
 Submit a Paper
 Propose a Special lssue
 Open Access
ARTICLE

Power Transformer Fault Diagnosis Using Random Forest and Optimized Kernel Extreme Learning Machine
1 School of Electrical Engineering, Xinjiang University, Urumqi, 830047, China
2 School of Mathematics, Xinjiang University, Urumqi, 830047, China
3 Sichuan Energy Internet Research Institute Under Tsinghua University, Cheng Du, 610213, China
* Corresponding Author: Xiaojing Ma. Email:
Intelligent Automation & Soft Computing 2023, 37(1), 691-705. https://doi.org/10.32604/iasc.2023.037617
Received 11 November 2022; Accepted 06 February 2023; Issue published 29 April 2023
 View Full Text
 Download PDF
Abstract
Power transformer is one of the most crucial devices in power grid. It is significant to determine incipient faults of power transformers fast and accurately. Input features play critical roles in fault diagnosis accuracy. In order to further improve the fault diagnosis performance of power transformers, a random forest feature selection method coupled with optimized kernel extreme learning machine is presented in this study. Firstly, the random forest feature selection approach is adopted to rank 42 related input features derived from gas concentration, gas ratio and energy-weighted dissolved gas analysis. Afterwards, a kernel extreme learning machine tuned by the Aquila optimization algorithm is implemented to adjust crucial parameters and select the optimal feature subsets. The diagnosis accuracy is used to assess the fault diagnosis capability of concerned feature subsets. Finally, the optimal feature subsets are applied to establish fault diagnosis model. According to the experimental results based on two public datasets and comparison with 5 conventional approaches, it can be seen that the average accuracy of the proposed method is up to 94.5%, which is superior to that of other conventional approaches. Fault diagnosis performances verify that the optimum feature subset obtained by the presented method can dramatically improve power transformers fault diagnosis accuracy.Keywords
Oil-immersed power transformer is one of the most important equipment in transmission and substation networks. When failures or malfunctions occur in the power transformers, it may lead to not only interruption of electricity supply, but also to the collapse of the entire power grid and other serious economic losses. Therefore, it is of great significance to diagnose and evaluate the incipient faults and working condition of power transformers [1].
In recent years, it can be seen a mature application of dissolved gas analysis (DGA) technology in fault diagnosis of oil-immersed power transformers [2]. Conventional DGA methods, including key gas method (KGM) [3,4], international electrotechnical commission (IEC) method [5], and improved three ratio method [6], are intensively employed worldwide to diagnose potential faults in power transformers. However, those aforementioned approaches supply mediocre fault diagnosis accuracy because of shortcomings such as experience and historical knowledge based, codes absence, rigorous borderline and so on [7]. With the rise of artificial intelligence (AI) and machine learning theory, various artificial intelligence approaches, including back propagation neural network (BPNN) [8], support vector machine (SVM) [9], extreme learning machine (ELM) [10], adaptive neuro fuzzy inference system (ANFIS) [11] and so on, have made significant and impressive progresses in the application of transformers fault diagnosis. In addition, deep learning approaches, including convolutional neural network (CNN) [12], recurrent neural network (RNN) [13], wasserstein autoencoder reconstruction model [14] and so on, also have been adopted to diagnose incipient fault of power transformers. However, these AI approaches mentioned above have pros and cons, for example, BPNN has good self-learning and classification ability but suffering from slow convergence speed and local optimal, SVM is able to provide impressive recognition performance but has difficulty in determining the suitable kernel functions and optimal parameters, while the hardship for determination of structures and insufficient samples are bottleneck for intensive application of deep learning methods and other neural network approaches. Therefore, those disadvantages mentioned above leave significant space for further improving fault diagnosis performance.
The input features of fault diagnostic models, whether traditional or AI-based, often apply IEC or IEEE standards-recommended gas concentrations, gas ratios, or comparative percentages. However, there is non-existence of a widely acknowledged feature set that is used to diagnose faults of power transformers. When faults occur in oil-immersed transformers, the oil and insulation paper will decompose and cause gases to be released. The total energy of the particular fault influences the types and quantities of the various gases generated. But the fault energy criteria for fault identification are rarely considered in previous feature selection based fault diagnosis models. Therefore, it is expected in this research to establish a feature set containing energy weighted dissolved gas analysis (EWDGA), which includes the amount of energy involved during the fault developing process as different gases require different level energy of formation in the event of faults [15]. Meanwhile, varied input features lead to different fault detection accuracy, so it is significant to investigate the impact of inputs and identify the best feature subset. Hence, random forest (RF) feature selection approach is employed to reduce bias in feature selection and increase the effectiveness of diagnosis. Afterwards, Aquila optimizer combined with kernel extreme learning machine (AO-KELM) is used to identify the best feature subset and optimize crucial parameters of classifier simultaneously. Finally, the optimal feature subset and parameters are utilized to establish fault diagnosis model.
The remainder of the paper is laid out as follows: the concept of the methodology employed in this paper is simply introduced in Section 2. The recommended method's fault diagnosis process is described in Section 3. Section 4 implements numerical experiments to verify the validity and superiority of the developed fault diagnosis method. Conclusions are drawn in Section 5.
The RF employs bagging method to extract samples from the original sample set in a random and repeatable manner in order to train the classifier, with approximately one-third of the samples not being used [16]. These are known as out of bag (OOB) data, and they can be used to calculate the significance of feature information. That is, the mean decrease in accuracy (MDA) can be employed as a guideline for feature optimization [17].
The RF model is illustrated by taking transformers fault diagnosis as an example. There are W transformer fault diagnosis training samples (Fj, yj), j = 1, 2, 3,…, W. Fj denotes the m-dimensional input features of the transformers, and yj is the output data of the training samples, corresponding to the transformer fault type. In calculating the importance of transformer feature information Fj, a decision tree i is used as the initial point to calculate the out of bag error EOOB (OOB error), and then the values of feature information Fj in the out-of-bag data are rearranged, keeping the other feature values unchanged, to obtain a new set of out-of-bag data, denoted as OOB′, and then the out-of-bag error of the new set is calculated OOB′ error (E′OOB), and subtract the two calculated results to obtain the MDA value of feature information Fj in the ith decision tree.
The importance of the feature information Fj is obtained by calculating the corresponding MDA values for each decision tree in the RF and then averaging all the MDA values.
where N is the number of decision trees. The larger the MDA value of feature information is, the more importance the feature will be.
In order to identify fault features closely related to fault types, many scholars have studied EWDGA. The EWDGA is the method of weighting the individual gas concentrations by a factor derived from the relative energy required for its formation [18]. The relationship among energy-weighted concentration Eewc, gas concentration Gc and weighting factor Wf can be depicted by the following Eq. (3):
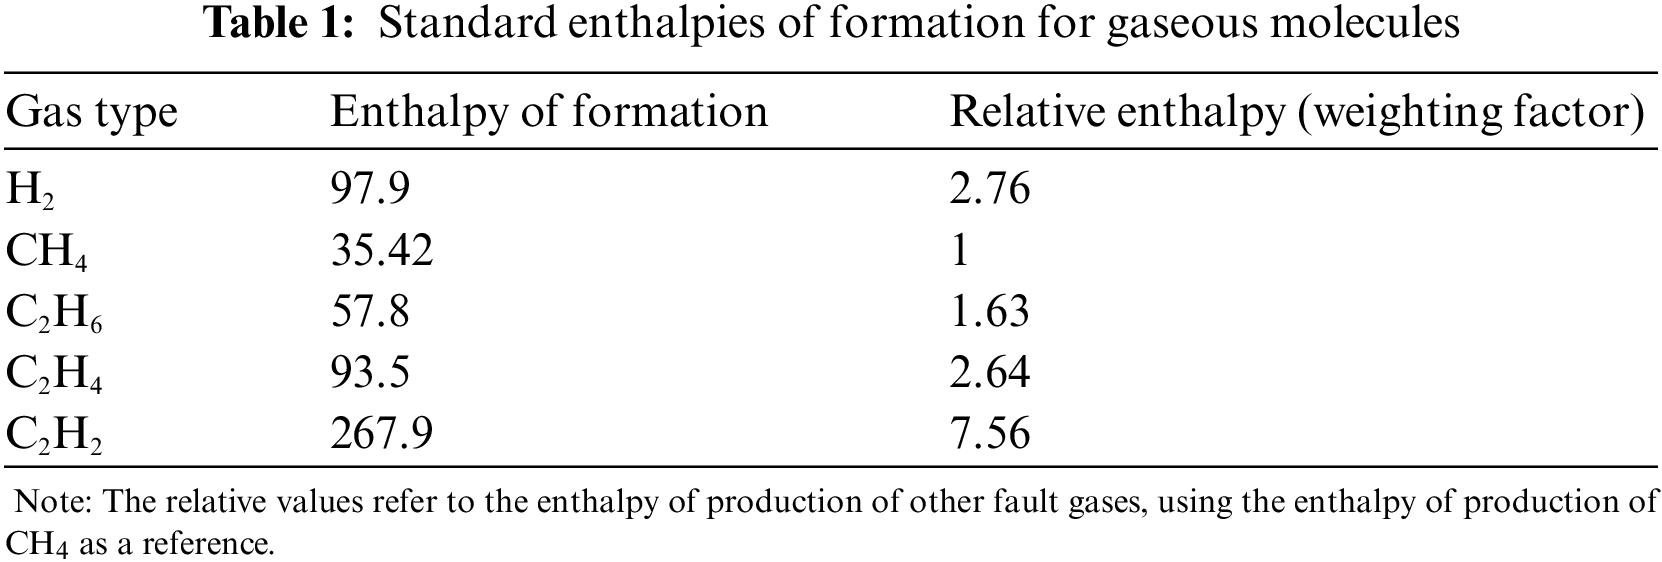
Prediction of the suitable weighting factor from thermodynamic decomposition model of the fault gases is necessary to incorporate energy content of fault gases. The relative enthalpies of fault gas formation are used to calculate the weighting factor. Various fault gases form with distinctly different enthalpies [19]. By regularizing the key fault gas production enthalpies, it is possible to obtain the weighting factors that demonstrate the fault's magnitude. The enthalpy of formation and relative enthalpies are listed in Table 1 [20].
2.3 Kernel Extreme Learning Machine
Extreme learning machine (ELM) is a feedforward neural network algorithm with a single hidden layer. It has a faster learning rate and better generalization efficiency than traditional back propagation neural networks, which have been widely adopted in classification and regression [21]. The ELM is described briefly as follows:
where H is the output matrix of the hidden layer, ω is the input weight vector, x is the input vector, L and N are the dimensional space and hidden layer nodes, g is the activation function, and b is bias of randomly assigned. Where β is the output weight matrix, and T is the output matrix:
Define the kernel matrix of KELM using Mercer’s theorem:
Kernel function that meets the Mercer condition can be employed as the KELM kernel function. In this study, the RBF kernel function is adopted. The RBF kernel function is expressed as K(x, xi) = exp (−γ||i||). Where γ is the kernel parameter, C is the penalty parameter, so the optimization of KELM can be attributed to the optimization problem of two variables γ and C [22].
2.4 Aquila Optimization Algorithm
Since the Aquila optimization algorithm has pros of rapid acceleration, consistent convergence, and excellent global optimum exploration capability, it attracts great attentions and has been employed in various optimization fields [23]. Optimization models for the Aquila algorithm consist of the following steps:
Step 1, vertical dive. When the Aquila identifies the prey area, it chooses an effective hunting area by rising in the worldwide prelim to identify the search area comprising the ideal solution, which is shown as Eq. (8):
where t and T denote the current iteration and the maximum number of iterations, respectively.X1 (t + 1) denotes the solution of (t + 1)th generation, which is generated by the search method X1. And Xbest(t) denotes the best solution, indicating the closest position of the target prey. XM(t) represents the mean value of the current solution’s position at the tth iteration, and rand strands for a random value.
Step 2, short glide attack. When the prey area is found from high altitude, the aquila hovers above the prey to narrow the hunting area and the search space for the best solution. The procedure can be described as Eq. (9):
where XR(t) is the random solution between [1 N]; D is the dimensional space and L(D) is the trapping flight distribution function.
Step 3, low flight. In this step, when the prey area is precisely identified and the Aquila is ready to land and attack, then it moves slowly toward the target. The Aquila tries to soar and then gently descends in the desired area to gauge the reaction of prey. It can be presented in Eq. (10):
where α and δ are the adjustment parameters. They are set to 0.1 in this paper, UB and LB denote the upper and lower bounds of the given problem, respectively.
Step 4, walking capture. When the Aquila approaches its target, it will attack from above the earth and quickly converges depending on the prey’s movement, as shown in Eq. (11):
where QF is the mass function used for the equilibrium search strategy, G1 represents the various movements of the eagle in pursuit of prey, G2 denotes the slope of the Aquila’s flight during the hunting process, and X(t) is the current solution for the tth iteration.
3 Fault Diagnosis Using Random Forest and Optimized Kernel Extreme Learning
A novel fault diagnosis model based on RF feature selection and AO-KELM is developed in order to increase the accuracy of power transformers fault diagnosis. The diagnosis process of this proposed method is shown in Fig. 1.
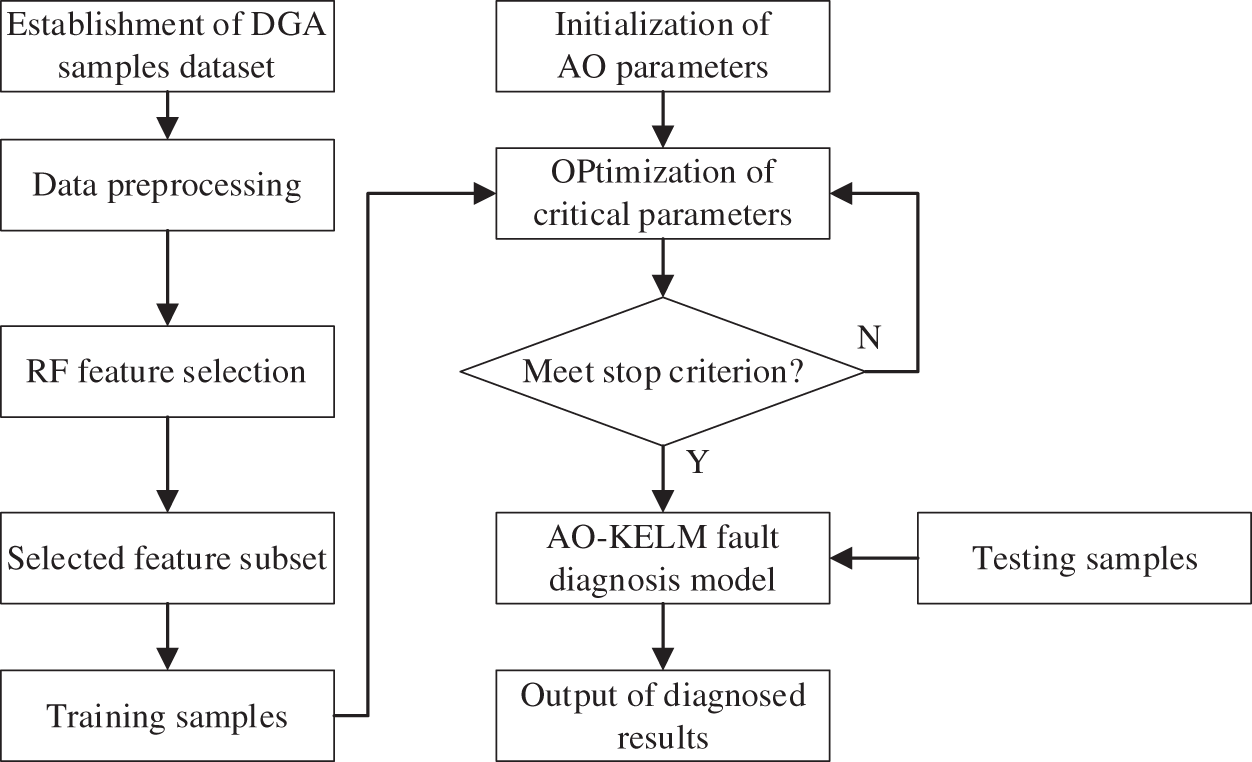
Figure 1: Flowchart for the proposed fault diagnosis method
The details of the proposed fault diagnosis approach can be described as below:
1. Establishment of fault sample dataset. DGA samples collected from published references and local power factories are used to create fault sample dataset. Each DGA sample consists of 5 kinds of characteristic gases, including hydrogen (H2), methane (CH4), acetylene (C2H6), ethylene (C2H4) and ethane (C2H2).
2. Creation of feature set. Features derived from gas concentrations, gas ratios, EWDGA and other criteria are introduced and created to establish a comprehensive and multiplex feature set.
3. Feature selection based on random forest. The importance of all features is evaluated by the random forest methods, and crucial features are retained to establish simple structure and highly efficient fault diagnosis model.
4. Optimization of vital parameters. Penalty factor C and kernel parameter σ play important roles in proving accurate and reliable result, hence the Aquila algorithm is adopted to tune those parameters and establish optimum diagnosis model to determine the final fault types.
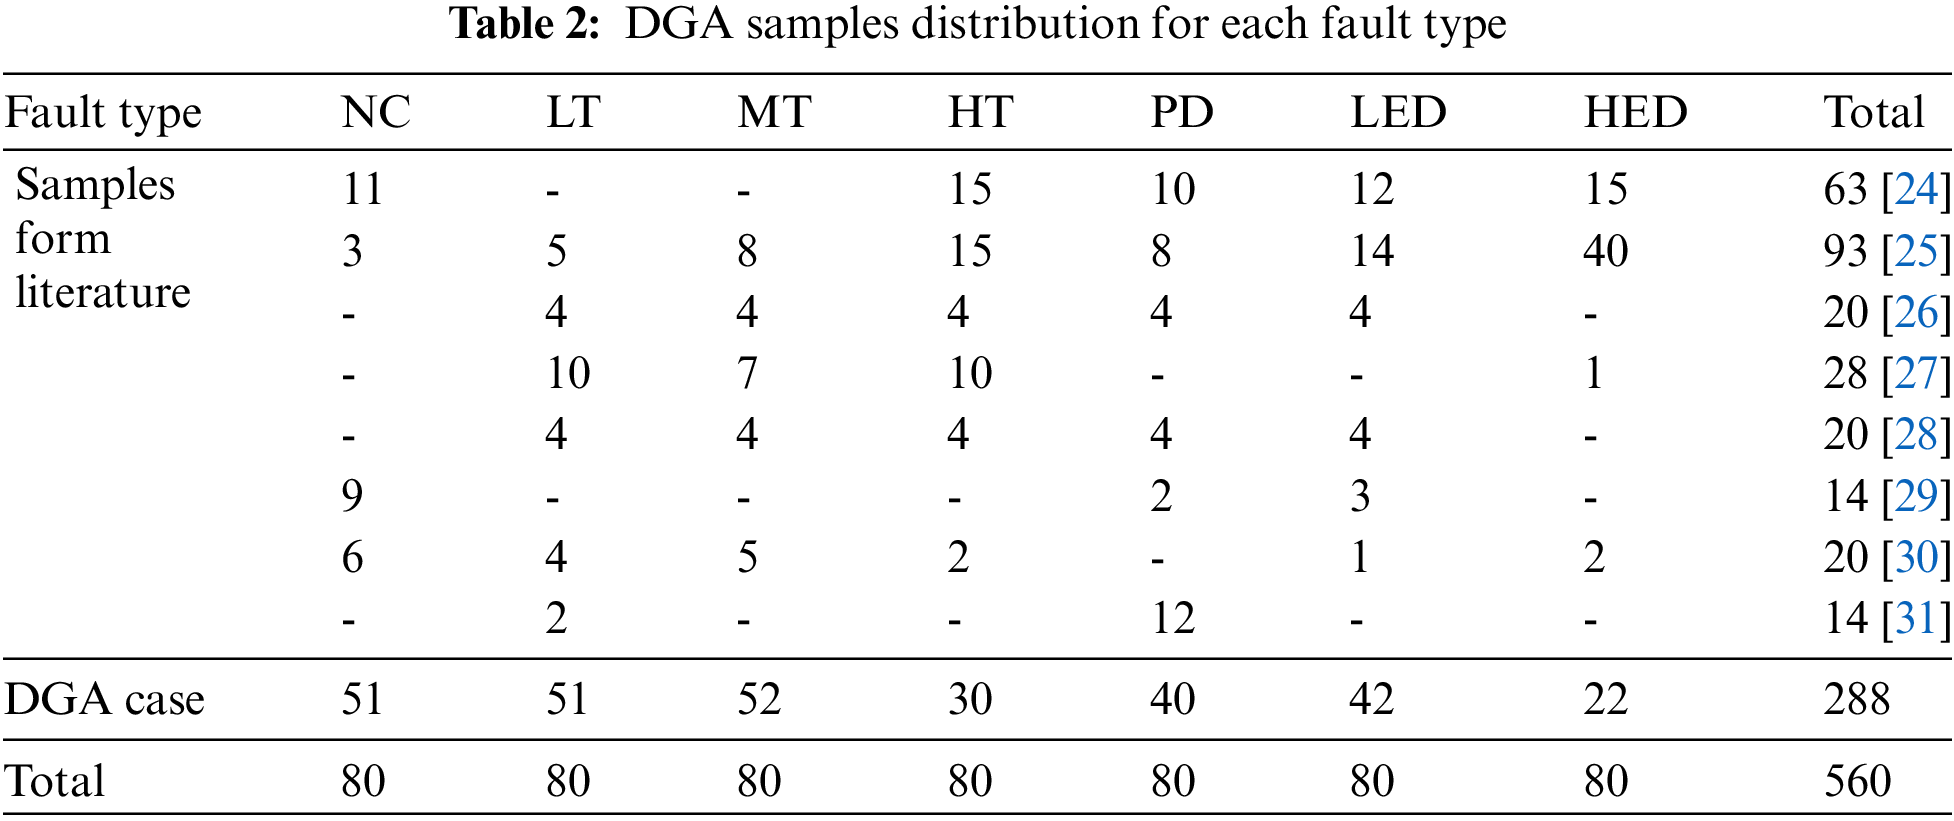
DGA samples gathered from literatures published previously and local power transformer factories are used to create fault diagnostic model. In this study, 6 types of faulty samples are under consideration, including partial discharge (PD), low-energy discharge (LED), high-energy discharge (HED), thermal fault of low temperature (LT), thermal fault of medium temperature (MT), and thermal fault of high temperature (HT). Besides, the normal condition (NC) is also taken into account. To be specific, 560 samples are collected and divided uniformly into 7 types. The concrete distribution of all obtained samples employed in this study is shown as Table 2. 80% of samples (448 samples) from the DGA sample dataset are used as training set and the rest ones (112 samples) are considered as testing set to estimate fault diagnosis performance. It should be noted that the implementation of whole works are conducted in MATLAB environment on a DELL serve.
At first, all raw data of all DGA samples are normalized before numerical calculation to prevent data singularity and improve fault diagnosis efficiency with Eq. (12):
where xik and xnik are the value of the ith sample for the kth feature before and after normalization, xkmax and xkmin are the maximum and minimum values of the kth feature.
4.2 Feature Selection Using Random Forest
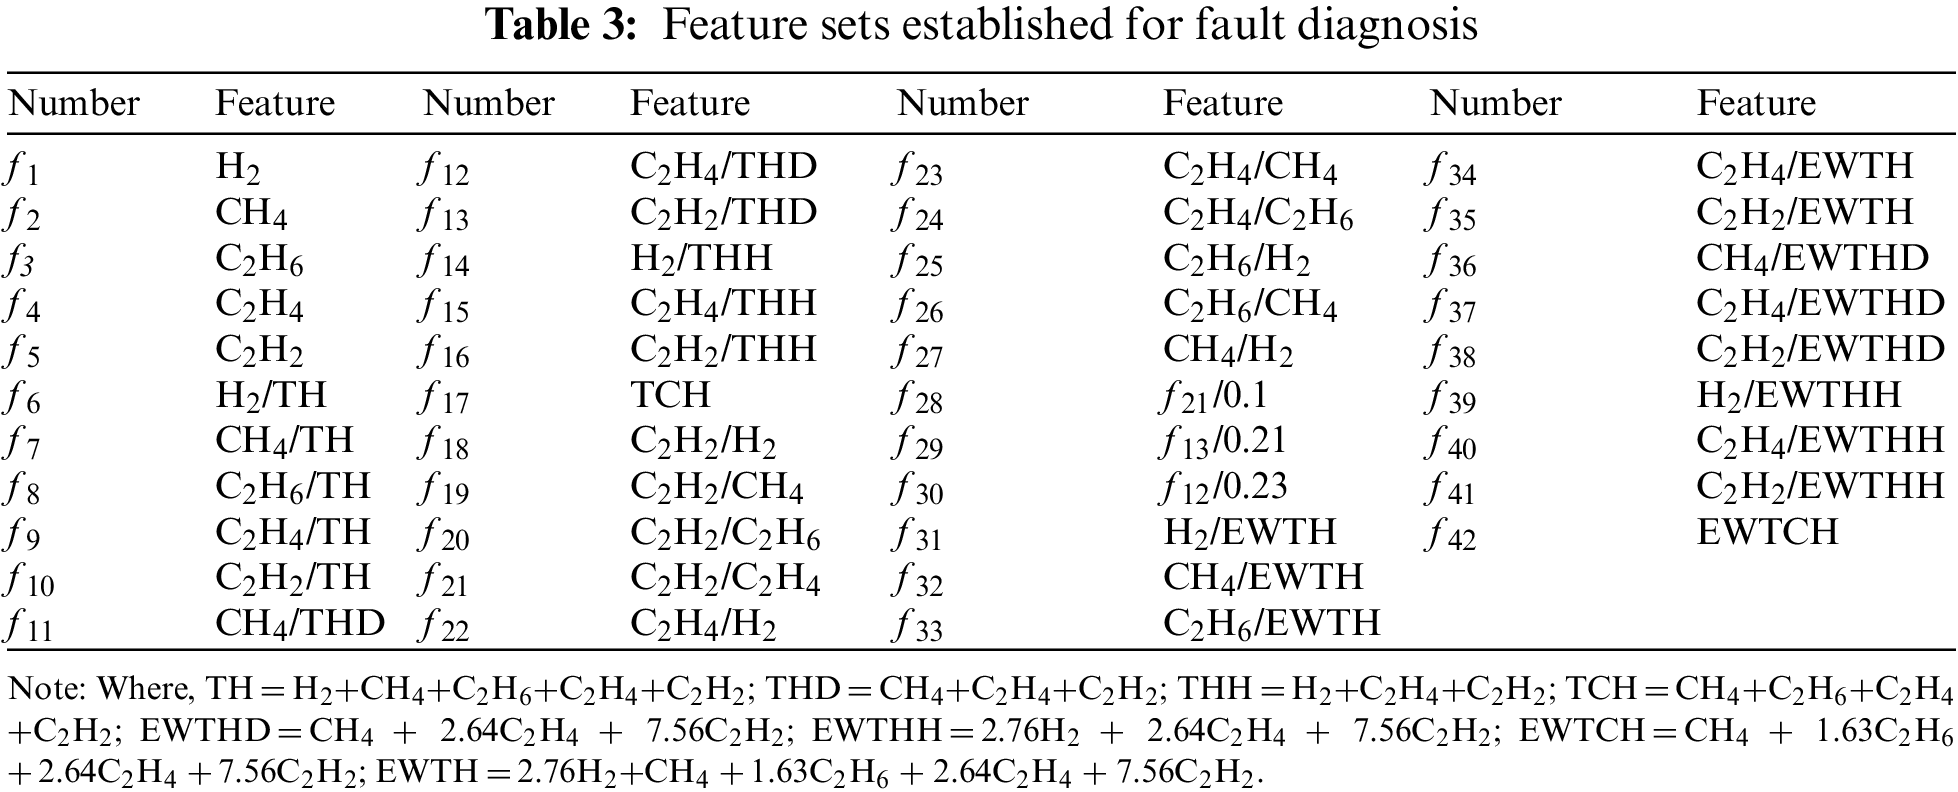
Different features denote different characteristics and degradations of the incipient faults, so it is imperative to consider various features from diverse aspects of dissolved gases. Therefore, after establishment of DGA sample dataset and normalization, a comprehensive and multiplex feature set is created in this study. By investigating domestic and abroad standards related to dissolved gas analysis and published literatures, the features derived by gas concentrations, gas ratios, energy weighted DGA and other criteria are produced and displayed in Table 3. It is noteworthy that f1∼f5 denotes absolute concentration, and f6∼f16 denotes relative concentration from various conventional methods. While f18∼f27 represent gas ratios, and f31∼f42 represent newly created gas ratios taking EWDGA into account. The rest features are crucial ones described in literatures.
The RF method is employed to sort all features in descending order. The higher the ranked order is, the less important the feature will be. The RF algorithm calculates the MDA values of the 42 candidate input features and obtains the significance ranking. Then, the features are adopted in order as inputs to created fault diagnosis model based on AO-KELM. Inputs of AO-KELM are increased one at a time following each sorted order until all features are utilized. Importance of input features and diagnostic accuracy corresponding to input features are presented as Fig. 2. In this study, the number of candidate variables mtry, which is randomly selected to split in each non-leaf node, is set to 8, and the decision tree number ntree is set to 400.
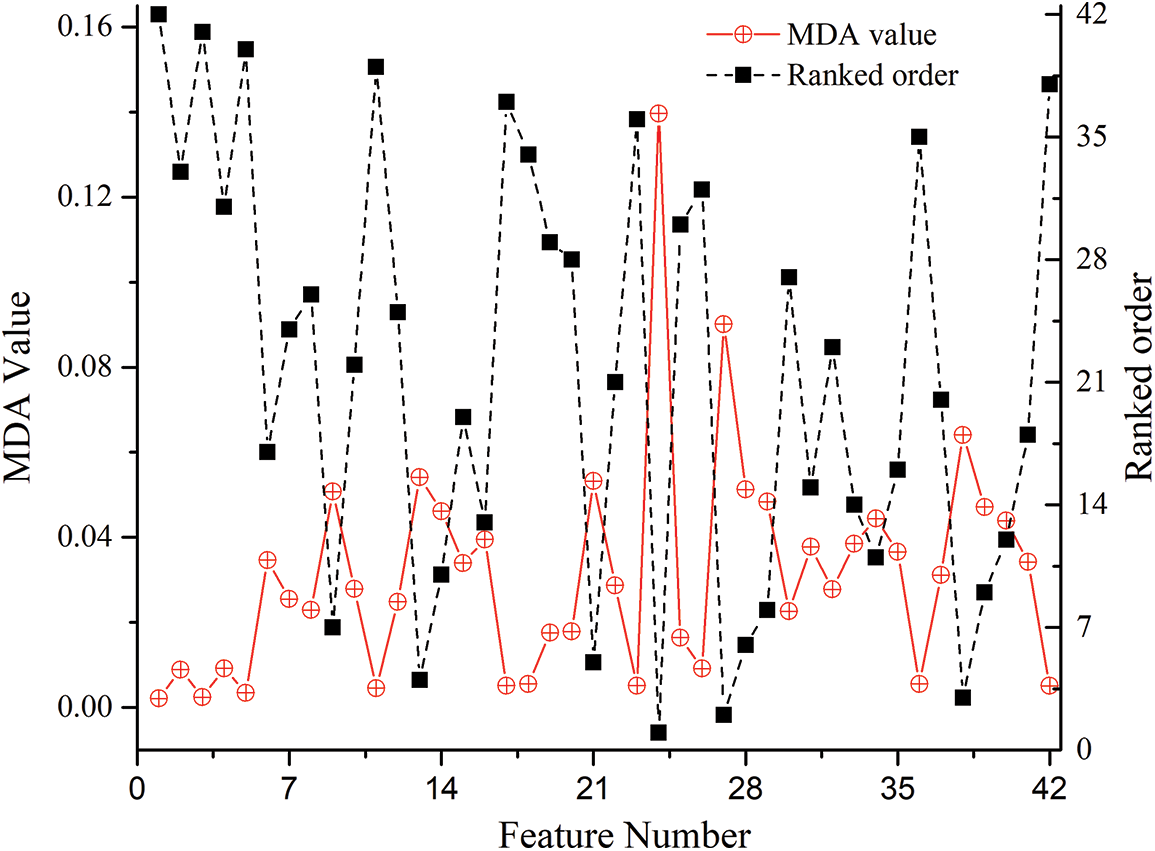
Figure 2: MDA value and ranked orders of all features
Afterwards, the obtained MDA values of all mentioned features are displayed in Fig. 2. It can be seen that features belonging to different categories have different importance. The features derived from gas concentration have less MDA values and higher order. While features from gas ratios category demonstrate higher significance than other parts. It is worth noting that features from energy weighted DGA also own higher MDA value and impressive feature ranks.
In order to determine an informative and compact feature subset, all features are sorted descendingly and ascendingly according to importance, and then those features are employed as input sequentially accumulated one by one for the fault diagnosis model. Fault diagnosis performances (accuracy 1 for descendingly sorted and accuracy 2 for ascendingly sorted) with different feature sizes are displayed in Fig. 3. It can be seen from the curve accuracy 1 that the diagnosis accuracy will be greater than 90% (that is 95.54%) with the first 9 features, and diagnosis accuracy can be up to the maximum value of 98.21% when the feature size equals to 12. Afterward, the diagnosis performance is fluctuating and stays stable after feature size is above 18. While for the curve accuracy 2, only when the feature size is up to 16, will the diagnosis performance be greater than 90% (that is 91.07%). Besides, the last 20 features can supply the maximum diagnosis accuracy of 98.21%. Therefore, it can be found that not all features are necessary for establishing fault diagnosis models, and a few important and informative features can provide optimal diagnosis performance. The potential reason is that the conventional features used to diagnose faults are based on experimental results or experience of field experts, which is lack of sufficient theoretical basis and proper optimization. Besides, all 42 features aforementioned are not necessarily related to fault diagnosis due to irrelevancy or redundancy. Therefore, it is prominent and imperative to create new features and select significant features to build compact and efficient models. All in all, the more important the input features are, the more accurate and efficient performance the fault diagnosis models provide.
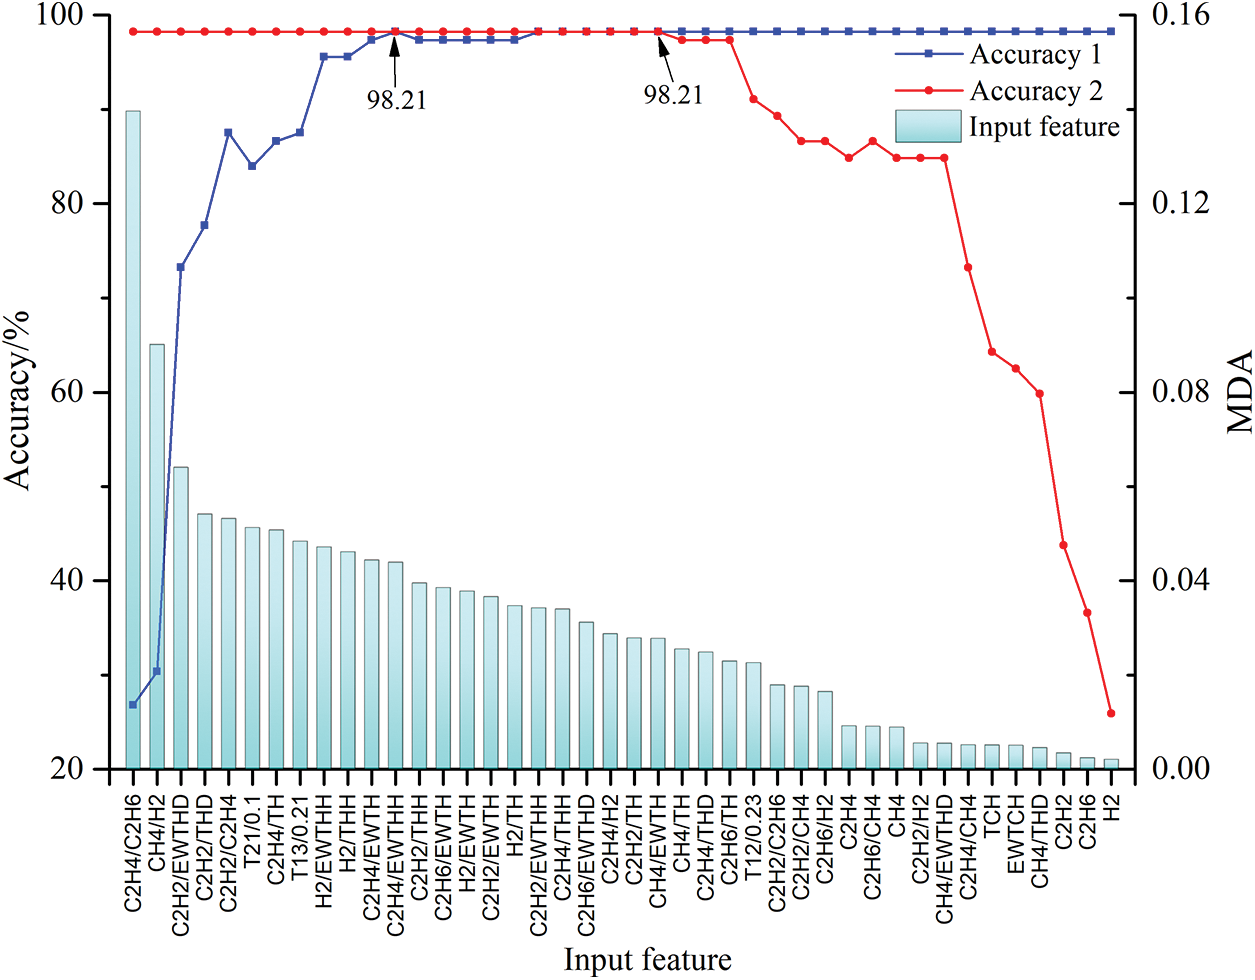
Figure 3: Feature importance score and classification accuracy curve
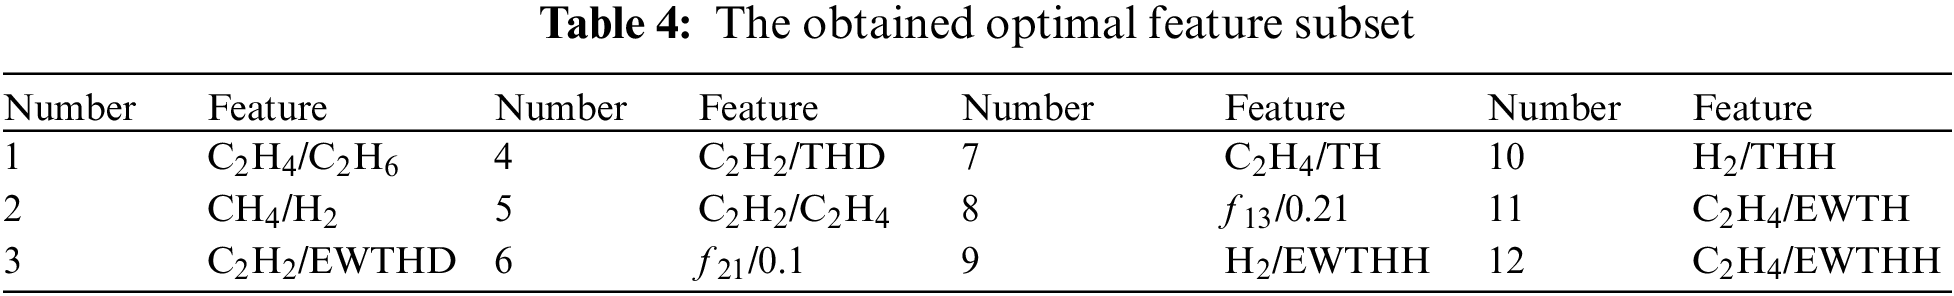
The top 12 important features which supply the highest accuracy are displayed in Table 4. It can be seen that half of the 12 features, including C2H4/C2H6, CH4/H2, C2H2/THD, C2H2/C2H4, C2H4/TH and H2/THH, are derived from the conventional approaches. While the rest 6 features, such as C2H2/EWTHD, f21/0.1, f13/0.21, H2/EWTHH, C2H4/EWTH and C2H4/EWTHH, are new created and show considerable importance. Among them, there are 4 features from energy weighted DGA category, which validates that it is imperative and effective to employ EWDGA technique to diagnose faults of power transformers.
4.3 Fault Diagnosis Results and Comparison
In order to establish a concise, efficient and accurate fault diagnosis model for power transformers, random forest and kernel extreme learning machine are employed in this study. 12 significant features selected by the random forest are applied as inputs of KEML. And 80% of samples shown in Table 2 are used to train fault diagnosis model and the remaining 112 samples are applied to estimate the fault diagnosis performance. Since parameters including penalty factor C and kernel radius γ play important roles in classification, the AO algorithm is introduced to tune those parameters to obtain optimum performance. In addition, the population size and iteration times of AO in this study are set to 20 and 200, respectively.
When penalty factor C and kernel radius γ equal to 40.38 and 0.22, the AO-KELM model based on training set provides the best fault diagnosis accuracy. The fitness development curves of AO are shown in Fig. 4. Afterwards, the optimum parameters are used to build model to diagnose incipient faults of power transformers. It can be seen from Fig. 5 that 110 samples out of 112 are diagnosed accurately, and only 2 samples belonging to thermal fault of high temperature are categorized incorrectly. The experimental results indicate that the proposed method is capable of providing high diagnosis accuracy.
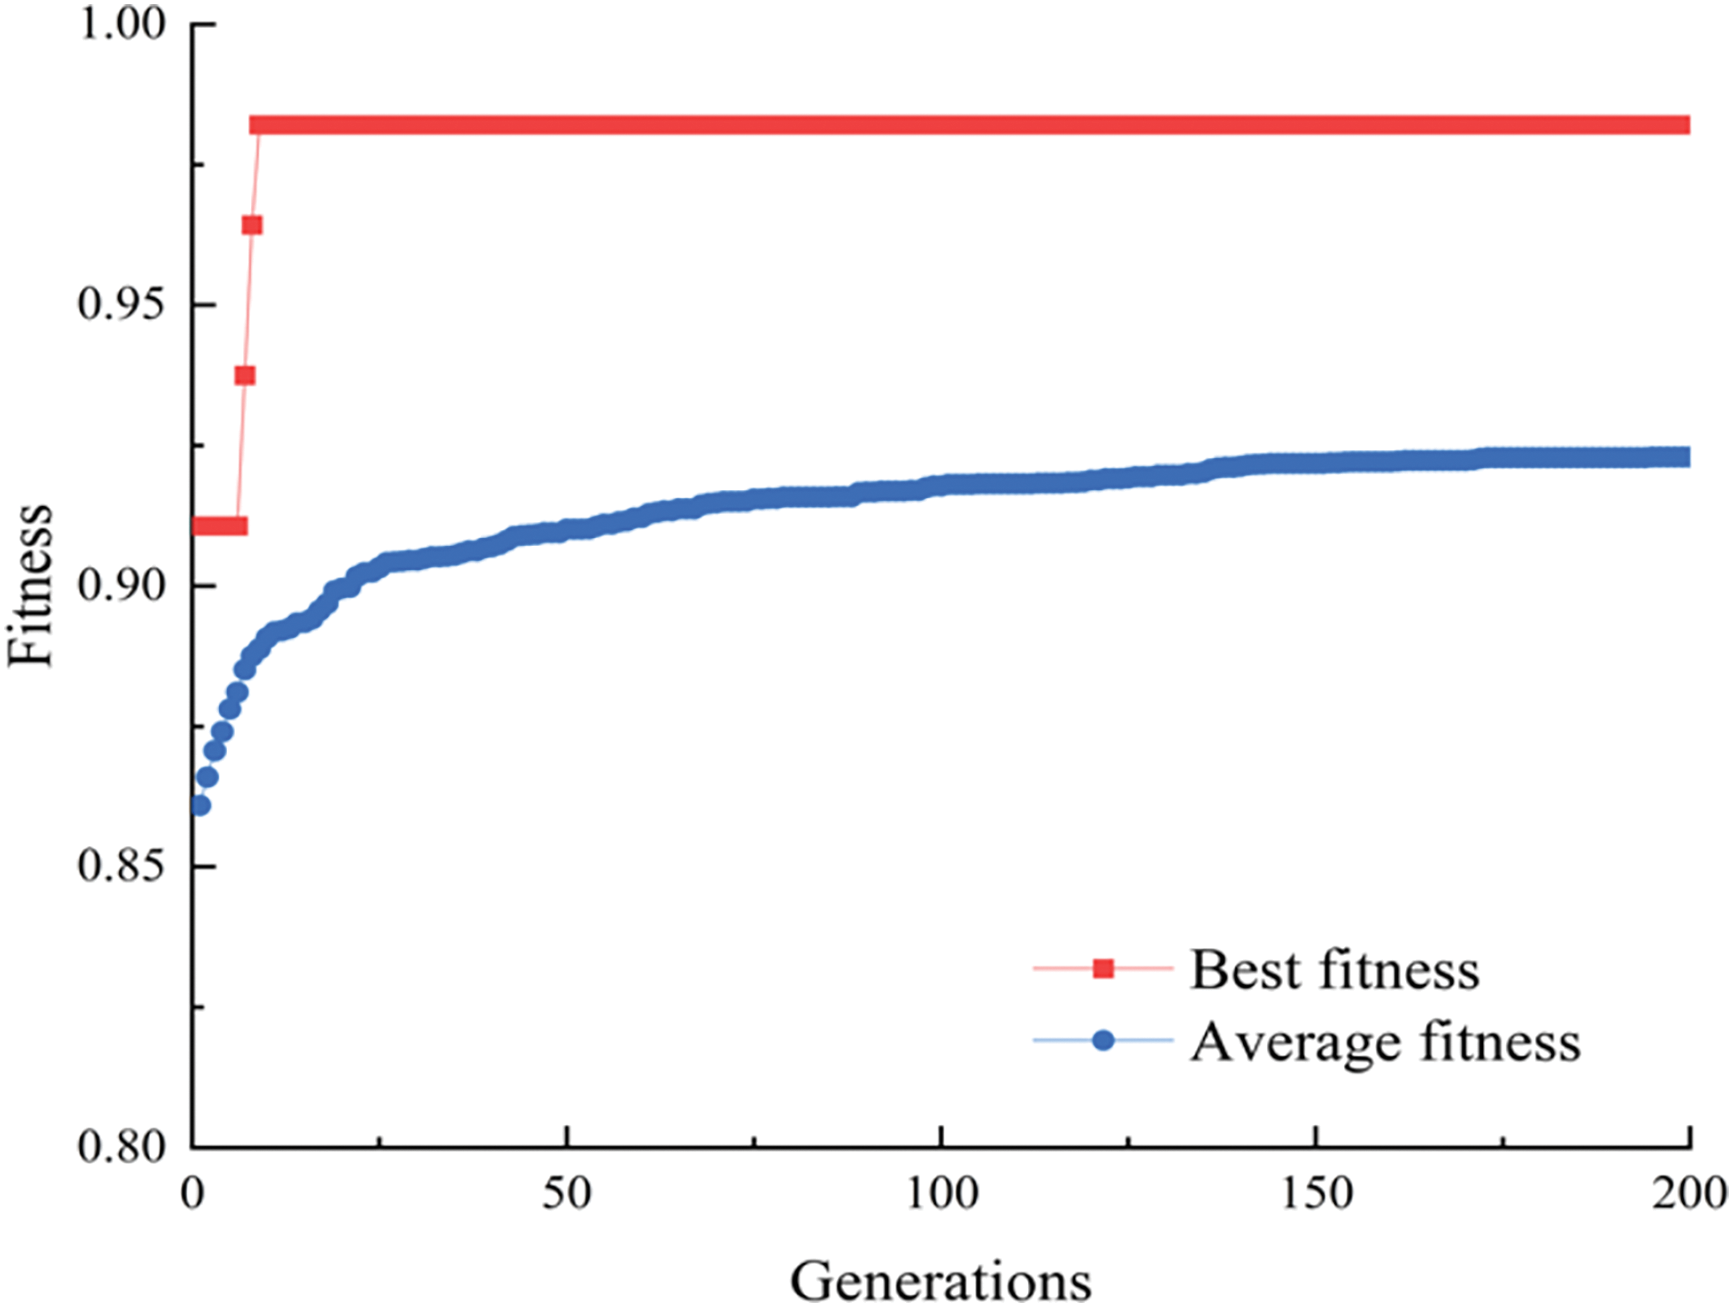
Figure 4: Fitness development curve of AO (accuracy = 98.21%)
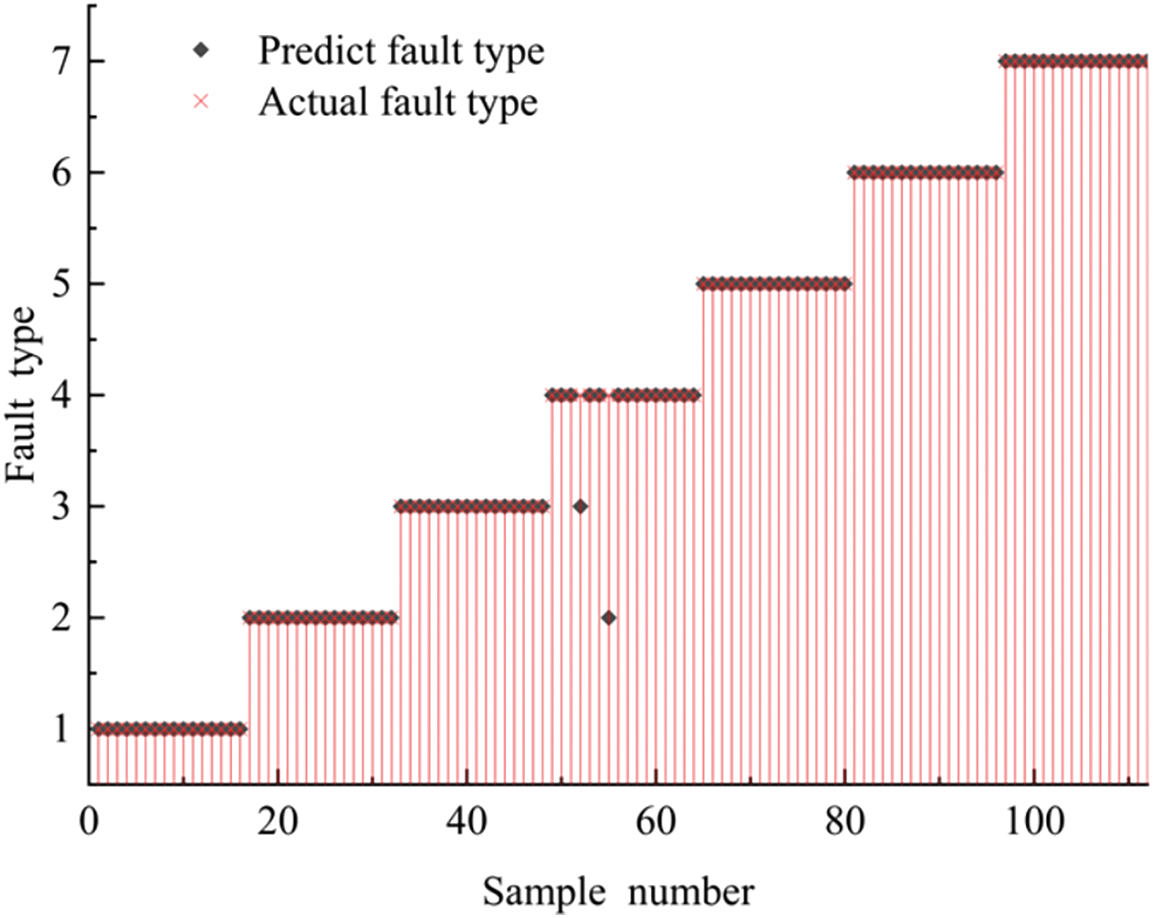
Figure 5: Fault diagnosis results for testing samples based on AO-KELM
In order to further demonstrate the superiority of the proposed approaches, we compare the fault diagnosis performance based on different optimization algorithms, different approaches and different datasets. At first, several popular optimization algorithms, including particle swarm optimization algorithm (PSO), sparrow search algorithm (SSA) and whale optimization algorithm (WOA) are used to tune the critical parameters of KELM. Fitness development curves of the proposed models are shown as Fig. 6. It can be seen that compared with other optimization methods, the AO algorithm has the fastest convergence speed (converge at the 9th iteration) and highest fitness value than any other methods, which manifest excellent global and local searching abilities of AO algorithm. While either fitness values or convergence iterations of other conventional searching algorithms are inferior to that of AO algorithm.
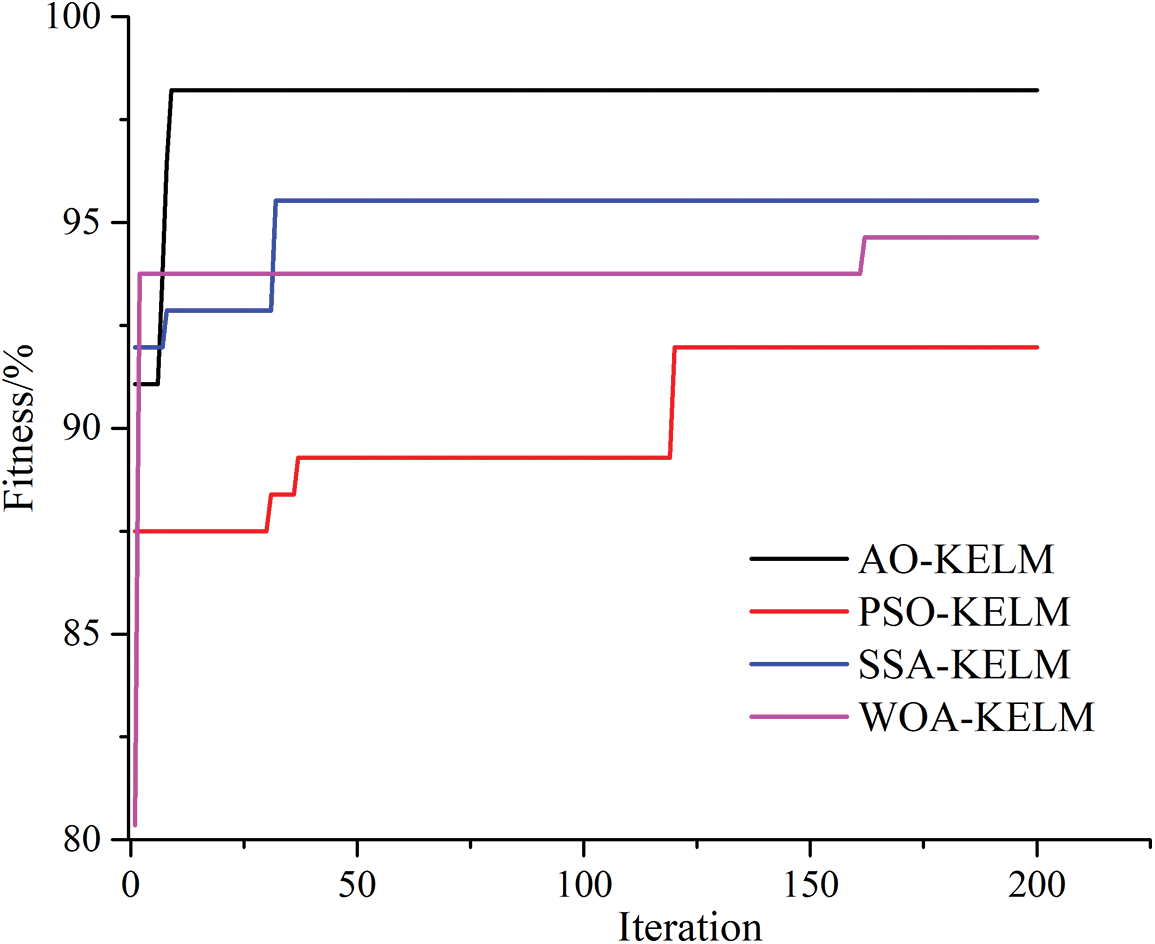
Figure 6: The fitness curves of different optimization models
Afterwards, 8 popular conventional approaches, including IEC method, improved three ratio method (ITR), back propagation neural network (BPNN), ELM, KELM, PSO-KELM, WOA-KELM and SSA-KELM, are used to evaluate diagnosis accuracy based on identical testing set. The default parameters are set for conventional methods. Moreover, numerical experiments for each model are repeated 50 times to avert perspective randomness and the average accuracy is applied to estimate diagnosis performance. The obtained experimental results are displayed in Table 5. It is worth noting that all numerical simulations are implemented in MATLAB environment on a DELL server.
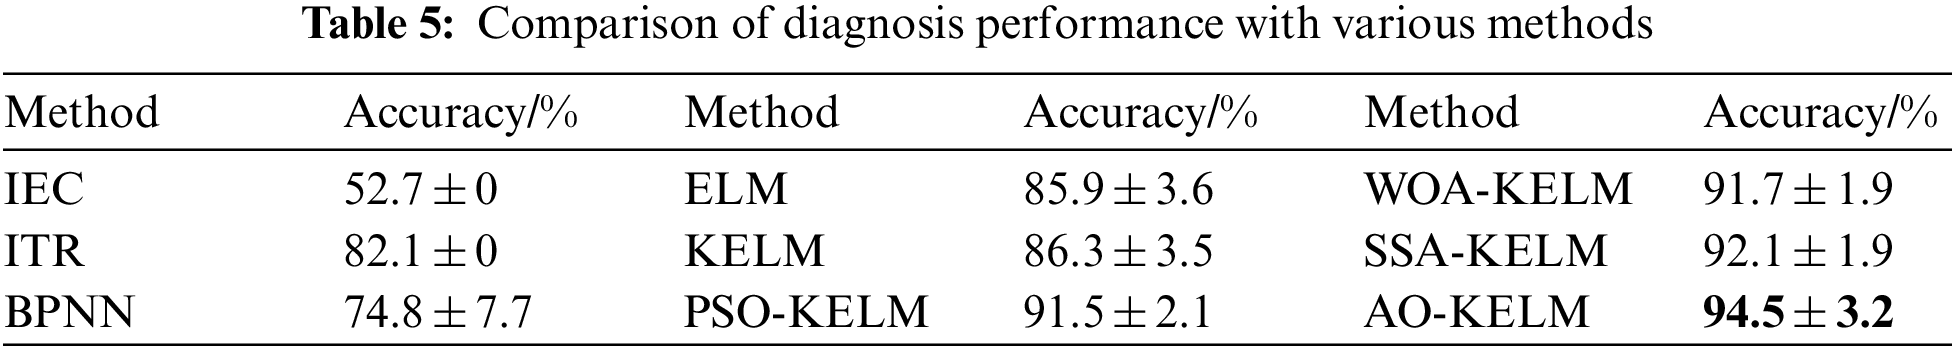
It can be known from Table 5 that the conventional approaches, such as IEC, ITR and BPNN have relatively mediocre performances, whose average diagnosis accuracy are 52.7%, 82.1% and 74.8%, respectively. While the artificial intelligence-based methods are able to provide better diagnosis performance. Among them, fault diagnosis model with optimized parameters offer much higher diagnosis accuracy than original fault diagnosis models. Fault diagnosis accuracy of the proposed AO-KELM methods is up to 94.5%, which outperforms all other approaches. The experimental results validate that fault diagnosis capability of the proposed approach is superior to the traditional methods.
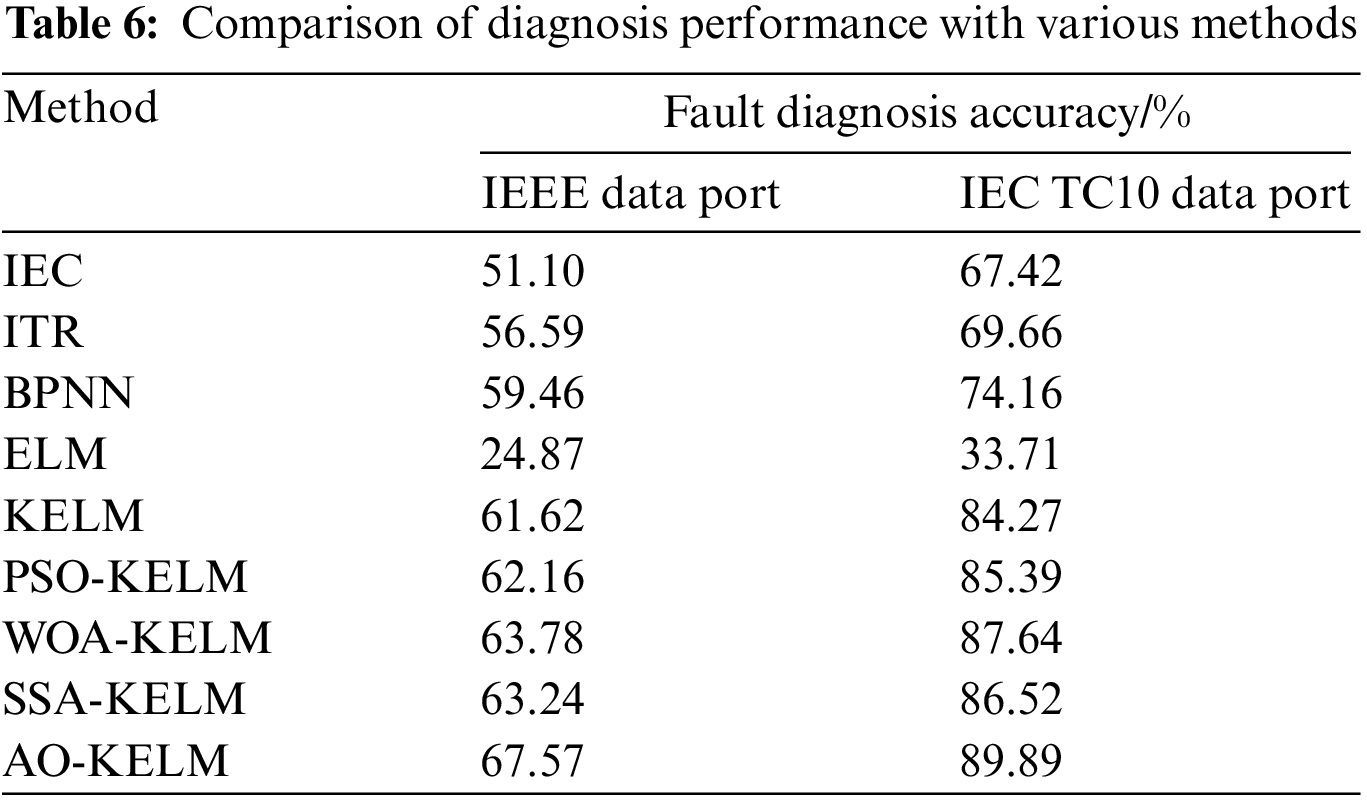
In addition, DGA samples from IEEE Dataport [32] and IEC TC10 Dataport [33] are diagnosed to verify robustness and generalization of the selected optimal feature subset and the presented fault diagnosis model. It can be seen from Table 6 that the proposed AO-KELM method provides the highest fault diagnosis accuracy for both datasets, which validates the feasibility, reliability and generalization ability of the proposed AO-KELM.
In this study, AO-KELM combined with feature selection techniques is applied to diagnose faults of power transformers. The RF feature selection approach creates a more compact, accurate and informative set of features. Then, the AO algorithm is employed to select appropriate parameters of KELM, which averts the reduction of diagnosis accuracy due to the random initialization of penalty factor C and kernel parameter σ. The final selected optimal features include C2H4/C2H6, CH4/H2, C2H2/EWTHD, C2H2/THD, C2H2/C2H4, f21/0.1, C2H4/TH, f13/0.21, H2/EWTHH, H2/THH, C2H4/EWTH and C2H4/EWTHH. In light of the comparison between feature subsets and diagnostic outcomes, the selected optimal feature subsets is able to provide the best fault diagnosis performance, whose accuracy is up to 94.5% ± 3.2%. Testing results indicate the robustness and generalization of the selected optimal feature subsets, which verify the advantage and validity of the optimal feature subset and the proposed method. Finally, DGA samples from IEEE Dataport and IEC TC10 Dataport are used to confirm the viability and generalization of the optimal feature subset.
In future work, more DGA features should be investigated to demonstrate the superiority of the proposed approaches. Besides, other new optimization algorithms, feature selection techniques, and classifiers need to be applied to further study the diagnosis performance from various aspects.
Funding Statement: The authors gratefully acknowledge financial support of national natural science foundation of China (No. 52067021), natural science foundation of Xinjiang (2022D01C35), excellent youth scientific and technological talents plan of Xinjiang (No. 2019Q012) and major science and technology special project of Xinjiang Uygur Autonomous Region (2022A01002-2).
Conflicts of Interest: The authors declare that they have no conflicts of interest to report regarding the present study.
References
1. J. Faiz and M. Soleimani, “Dissolved gas analysis evaluation in electric power transformers using conventional methods a review,” IEEE Transactions on Dielectrics and Electrical Insulation, vol. 24, no. 1, pp. 1239–1248, 2017. [Google Scholar]
2. J. I. Aizpurua, V. M. Catterson and B. G. Stewart, “Power transformer dissolved gas analysis through Bayesian networks and hypothesis testing,” IEEE Transactions on Dielectrics and Electrical Insulation, vol. 25, no. 2, pp. 494–506, 2018. [Google Scholar]
3. P. Mirowski and Y. LeCun, “Statistical machine learning and dissolved gas analysis: A review,” IEEE Transactions on Power Delivery, vol. 27, no. 4, pp. 1791–1799, 2012. [Google Scholar]
4. S. M. G. Sherif, B. M. T. Ibrahim and N. I. Elkalashy, “Integrated ANN-based proactive fault diagnostic scheme for power transformer using dissolved gas analysis,” IEEE Transactions on Dielectrics and Electrical Insulation, vol. 23, no. 3, pp. 1838–1845, 2016. [Google Scholar]
5. E. Dornerburg and W. Strittmatter, “Monitoring oil cooling transformers by gas analysis,” Brown Boveri Review, vol. 61, pp. 238–247, 1974. [Google Scholar]
6. Z. J. Li, “Research on power transformer fault diagnosis using fuzzy decision making,” Electrical Technology, vol. 21, no. 10, pp. 77–82, 2020. [Google Scholar]
7. F. Jawad and M. Soleimani, “Assessment of computational intelligence and conventional dissolved gas analysis methods for transformer fault diagnosis,” IEEE Transactions on Dielectrics and Electrical Insulation, vol. 25, no. 5, pp. 1798–1806, 2018. [Google Scholar]
8. X. Z. Li, “Fault diagnosis of transformer based on BP neural network and ACS-SA,” High Voltage Apparatus, vol. 54, pp. 134–139, 2018. [Google Scholar]
9. S. B. Li, G. N. Wu and G. Bo, “Interpretation of DGA for transformer fault diagnosis with complementary SaE-ELM and arctangent transform,” IEEE Transactions on Dielectrics and Electrical Insulation, vol. 23, no. 1, pp. 586–595, 2016. [Google Scholar]
10. Q. Li, T. T. Zhao and L. C. Zhang, “Ferrography wear particles image recognition based on extreme learning machine,” Journal of Electrical and Computer Engineering, vol. 2017, pp. 2017, 2017. [Google Scholar]
11. T. Kari, W. S. Gao and D. B. Zhao, “An integrated method of ANFIS and dempster shafer theory for fault diagnosis of power transformer,” IEEE Transactions on Dielectrics and Electrical Insulation, vol. 25, no. 1, pp. 360–371, 2018. [Google Scholar]
12. M. Afrasiabi, S. Afrasiabi and B. Parang, “Power transformers internal fault diagnosis based on deep convolutional neural networks,” Journal of Intelligent & Fuzzy Systems, vol. 37, no. 1, pp. 1165–1179, 2019. [Google Scholar]
13. A. Zollanvari, K. Kunanbayev and S. A. Bitaghsir, “Transformer fault prognosis using deep recurrent neural network over vibration signals,” IEEE Transaction on Instrumentation and Measurement, vol. 70, pp. 250211, 2021. [Google Scholar]
14. K. H. Fanchiang, Y. C. Huang and C. C. Kuo, “Power electric transformer fault diagnosis based on infrared thermal images using wasserstein generative adversarial networks and deep learning classifier,” Electronics, vol. 10, no. 10, pp. 1161, 2021. [Google Scholar]
15. E. M. Danish, S. A. Khan and T. Islam, “Transformer incipient fault diagnosis on the basis of energy-weighted DGA using an artificial neural network,” Turkish Journal of Electrical Engineering & Computer Sciences, vol. 26, no. 1, pp. 77–88, 2018. [Google Scholar]
16. X. K. Li, W. Chen and Q. R. Zhang, “Building auto-encoder intrusion detection system based on random forest feature selection,” Computers & Security, vol. 95, pp. 101851, 2020. [Google Scholar]
17. C. Mohamed, “Machine learning models based on random forest feature selection and Bayesian optimization for predicting daily global solar radiation,” International Journal of Renewable Energy Development, vol. 11, no. 1, pp. 309, 2022. [Google Scholar]
18. F. Jakob, P. Noble and J. J. Dukarm, “A thermodynamic approach to evaluation of the severity of transformer faults,” IEEE Transactions on Power Delivery, vol. 27, no. 2, pp. 554–559, 2011. [Google Scholar]
19. C. X. Guo, B. Wang and Z. Y. Wu, “Transformer failure diagnosis using fuzzy association rule mining combined with case-based reasoning,” IET Generation, Transmission & Distribution, vol. 14, no. 11, pp. 2202–2208, 2020. [Google Scholar]
20. G. Sherif, “Intelligent prediction of transformer faults and severities based on dissolved gas analysis integrated with thermodynamics theory,” IET Science, Measurement & Technology, vol. 12, no. 3, pp. 388–394, 2018. [Google Scholar]
21. H. Liu, C. H. Zhang and D. D. Huang, “Extreme learning machine and moving least square regression based solar panel vision inspection,” Journal of Electrical and Computer Engineering, vol. 2017,pp. 1–10, 2017. [Google Scholar]
22. J. F. Xia, D. Q. Yang and H. Zhou, “Evolving kernel extreme learning machine for medical diagnosis via a disperse foraging sine cosine algorithm,” Computers in Biology and Medicine, vol. 141, pp. 105137, 2022. [Google Scholar] [PubMed]
23. L. Abualigah, D. Yousri and M. A. Elaziz, “Aquila optimizer: A novel meta-heuristic optimization algorithm,” Computers & Industrial Engineering, vol. 157, pp. 107250, 2021. [Google Scholar]
24. K. Ali, K. Akif and D. S. Koroglu, “Fault diagnosis of oil-immersed power transformers using common vector approach,” Electric Power Systems Research, vol. 184, pp. 106346, 2020. [Google Scholar]
25. E. Osama, H. G. Salah, H. El and T. H. Hassan, “Proposed three ratios technique for the interpretation of mineral oil transformers based dissolved gas analysis,” IET Generation, Transmission & Distribution, vol. 12, no. 11, pp. 2650–2661, 2018. [Google Scholar]
26. I. B. M. Taha, A. Hoballah and S. S. M. G. Taha, “Optimal ratio limits of rogers’ four-ratios and IEC 60599 code methods using particle swarm optimization fuzzy-logic approach,” IEEE Transactions on Dielectrics and Electrical Insulation, vol. 27, no. 1, pp. 222–230, 2020. [Google Scholar]
27. J. L. Yin, “Research on fault diagnosis method of oil-immersed power transformer based on correlation vector machine,” Ph. D. dissertation, North China Electric Power University, China, 2013. [Google Scholar]
28. I. B. M. Taha, S. S. M. Ghoneim and H. G. Z. Taha, “Improvement of rogers four ratios and IEC code methods for transformer fault diagnosis based on dissolved gas analysis,” in 2015 North American Power Symp. (NAPS), Charlotte, NC, USA, 2015. [Google Scholar]
29. I. B. M. Taha, H. G. Z. Taha and S. S. M. Ghoneim, “Comparative study between dorneneburg and rogers methods for transformer fault diagnosis based on dissolved gas analysis using matlab simulink tools,” in 2015 IEEE Conf. on Energy Conversion (CENCON), Johor Bahru, Malaysia, 2015. [Google Scholar]
30. S. Seifeddine, B. Khmais and C. Abdelkader, “Power transformer fault diagnosis based on dissolved gas analysis by artificial neural network,” in 2012 First Int. Conf. on Renewable Energies and Vehicular Technology, Nabeul, Tunisia, 2012. [Google Scholar]
31. Z. X. Liu, B. Song and E. W. Li, “Study of “code absence” in the IEC three-ratio method of dissolved gas analysis,” IEEE Electrical Insulation Magazine, vol. 31, no. 6, pp. 6–12, 2015. [Google Scholar]
32. E. W. Li, L. N. Wang and B. Song, “Fault diagnosis of power transformers with membership degree,” IEEE Access, vol. 7, pp. 28791–28798, 2019. [Google Scholar]
33. M. Duval and A. dePabla, “Interpretation of gas-in-oil analysis using new IEC publication 60599 and IEC TC 10 databases,” IEEE Electrical Insulation Magazine, vol. 17, no. 2, pp. 31–41, 2001. [Google Scholar]
Cite This Article
 Copyright © 2023 The Author(s). Published by Tech Science Press.
This work is licensed under a Creative Commons Attribution 4.0 International License , which permits unrestricted use, distribution, and reproduction in any medium, provided the original work is properly cited.
 Downloads
 Citation Tools