
 Submit a Paper
 Propose a Special lssue
 Open Access
ARTICLE

3D Model Construction and Ecological Environment Investigation on a Regional Scale Using UAV Remote Sensing
1 School of Geography Science and Geomatics Engineering, Suzhou University of Science and Technology, Suzhou, 215009, China
2 State Key Laboratory of Remote Sensing Science, Aerospace Information Research Institute, Chinese Academy of Science, Beijing, 100101, China
3 School of Information Engineering, Zhejiang Ocean University, Zhoushan, 316022, China
4 Marine Science and Technology College, Zhejiang Ocean University, Zhoushan, 316022, China
5 China Aero Geophysical and Remote Sensing Center for Natural Resources, Beijing, 100083, China
* Corresponding Author: Li Chen. Email:
Intelligent Automation & Soft Computing 2023, 37(2), 1655-1672. https://doi.org/10.32604/iasc.2023.039057
Received 09 January 2023; Accepted 12 April 2023; Issue published 21 June 2023
A correction of this article was approved in:
Correction: 3D Model Construction and Ecological Environment Investigation on a Regional Scale Using UAV Remote Sensing
Read correction
 View Full Text
 Download PDF
Abstract
The acquisition of digital regional-scale information and ecological environmental data has high requirements for structural texture, spatial resolution, and multiple parameter categories, which is challenging to achieve using satellite remote sensing. Considering the convenient, facilitative, and flexible characteristics of UAV (unmanned air vehicle) remote sensing technology, this study selects a campus as a typical research area and uses the Pegasus D2000 equipped with a D-MSPC2000 multi-spectral camera and a CAM3000 aerial camera to acquire oblique images and multi-spectral data. Using professional software, including Context Capture, ENVI, and ArcGIS, a 3D (three-dimensional) campus model, a digital orthophoto map, and multi-spectral remote sensing map drawing are realized, and the geometric accuracy of typical feature selection is evaluated. Based on a quantitative remote sensing model, the campus ecological environment assessment is performed from the perspectives of vegetation and water body. The results presented in this study could be of great significance to the scientific management and sustainable development of regional natural resources.Keywords
Authors are required to adhere to this Microsoft Word template in preparing their manuscripts for submission. It will speed up the review and typesetting process. Ecological environment assessment would be helpful for a rapid and systematic understanding of the ecological status and would contribute to the sustainable development of the ecological environment [1]. Environmental impact assessment mainly includes pollution impact assessment, but the current ecological environmental impact assessment is not deep enough, failing to treat the whole natural environment as a whole and lacking the overall concept and predictability [2,3]. Therefore, there has been a gap between the actual needs of ecological environmental impact assessment and its current development state [4]. In recent years, frequent ecological disasters, such as haze, sandstorms, and soil erosion, have essentially been the result of the integrity destruction of the ecosystem and the disharmony between human development and nature [5–8]. In the process of environmental impact assessment, the study of ecological environment assessment is relatively backward, including mainly qualitative description and fewer quantitative indicators, thus affecting the reliability of ecological environment impact assessment of construction projects to a certain extent [9]. At present, environmental monitoring stations have been built in all parts of China to monitor ecological resources, such as water and air, in real-time, which has had a significant contribution to environmental protection [9–11]. However, the high price of system equipment and the limitation of human resources make it challenging to meet the requirements of ecological assessment and dynamic prediction [12]. Therefore, the ground investigation has often been limited to the single-factor assessment. In addition, due to the lack of integrity and macroscopic property, which affects the evaluation accuracy of the ecological environment, the requirements of ecological environment monitoring and evaluation cannot be met [2,6].
Remote sensing technology represents one of the most active technologies in the field of ecological environment assessment [13–15]. A UAV (unmanned air vehicle) remote sensing technology has improved the ecological environment impact assessment, compensating for the shortcomings of the traditional survey means and satellite remote sensing [11,16]. Using UAVs has allowed obtaining high-resolution spatial remote sensing information timely, rapidly, and accurately [16,17]. In addition, UAV remote sensing combines UAV technology, sensor technology, communication technology, GPS (global positioning system) positioning technology, and remote sensing science theory and application technology [17]. Through the combination of spatial remote sensing technology and GIS (geographic information system) technology, changes in landscape patches, patterns, and spatial patterns of land use can be quantitatively analyzed, which improves both the scope and the depth of the research of ecological environment and also promotes further development of ecological environment-related research [18,19]. Moreover, in recent years, researchers have favored it and have expanded the application range and user group of UAV remote sensing. The application of a UAV remote sensing system to the field of environmental protection can effectively improve the timeliness, reliability, and accuracy of basic environmental data and provide important data support for scientific and reasonable planning and protection of the ecological environment and resources [6,16,20]. UAV remote sensing has the advantages of convenience, high efficiency, low cost, stable imaging, and strong adaptability and thus has been widely used in disaster prediction, meteorology, and surveying and mapping of ecological environment, hydrology, and water resources [21–23]. The comparative study for ecological environment investigation using UAV is shown in Table 1.
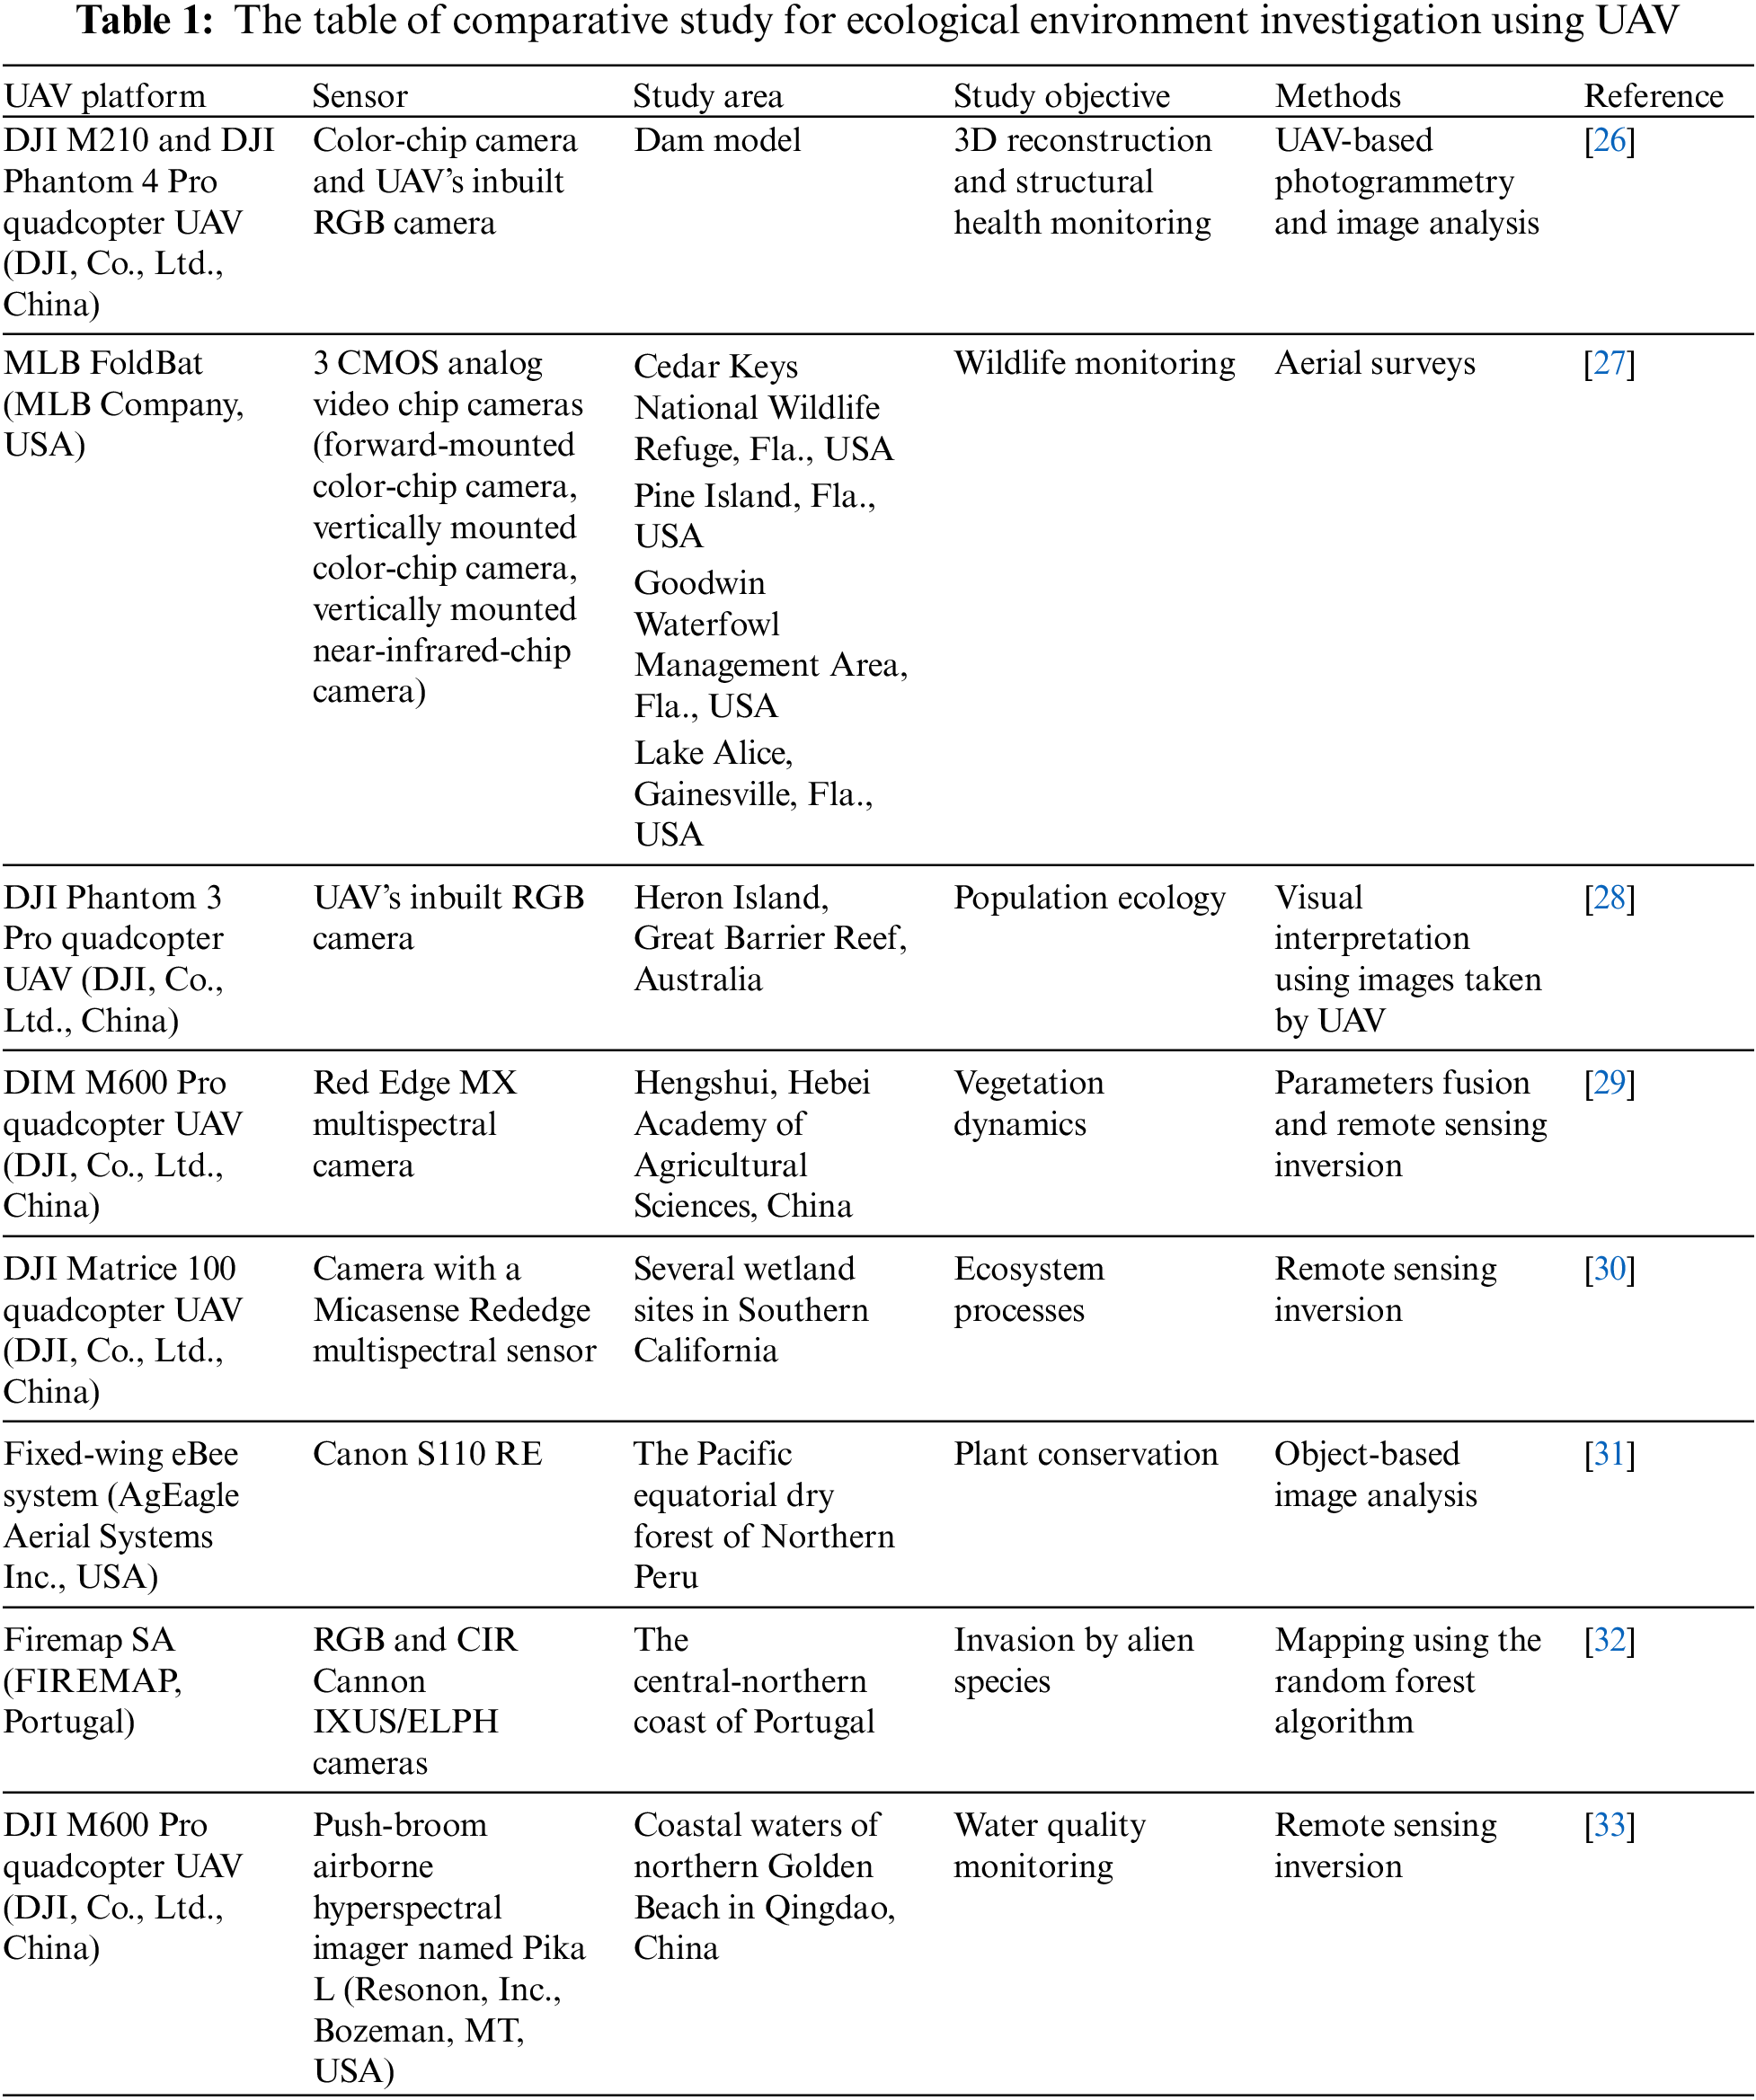
Compared with the traditional investigation methods based on satellite remote sensing, UAV remote sensing has outstanding advantages in the fields of regional digital information acquisition and ecological environment investigation [16]. The traditional environmental quality survey based on satellite remote sensing technology has the disadvantage of low spatial resolution, so it cannot carry out fine detection on a regional scale [32,33]. In this paper, the application of UAV remote sensing to regional 3D (three-dimensional) model construction and ecological environment investigation is studied through examples. The results presented in this study provide technical support for improving the comprehensiveness and accuracy of regional ecological environment impact assessment. This study can provide technical support for basic geographic information acquisition and environmental investigation at a regional scale.
Proceeding from reality, this paper uses the timely, fast and accurate characteristics of UAV remote sensing technology to solve the shortcomings of low spatial resolution and poor timeliness in the traditional environmental quality survey based on satellite remote sensing technology, and to better conduct the ecological assessment and dynamic prediction provide technical support for basic geographic information acquisition and environmental investigation on a regional scale.
In the study, The UAV remote sensing technology is used to construct 3D model and investigate the ecological environment on a regional scale. The overall workflow of the study is shown in Fig. 1. First, the UAV data is acquired. Second, the 3D model is constructed using Pix4D Mapper software and the geometric accuracy evaluation is carried out. Then, this study uses the values of NDVI (normalized difference vegetation index), FVC (fractional vegetation cover), and LAI (leaf area index) to investigate the regional environment and analyze the experimental results. Finally, the water environment in the study area is analyzed using the NDVI calculation results.
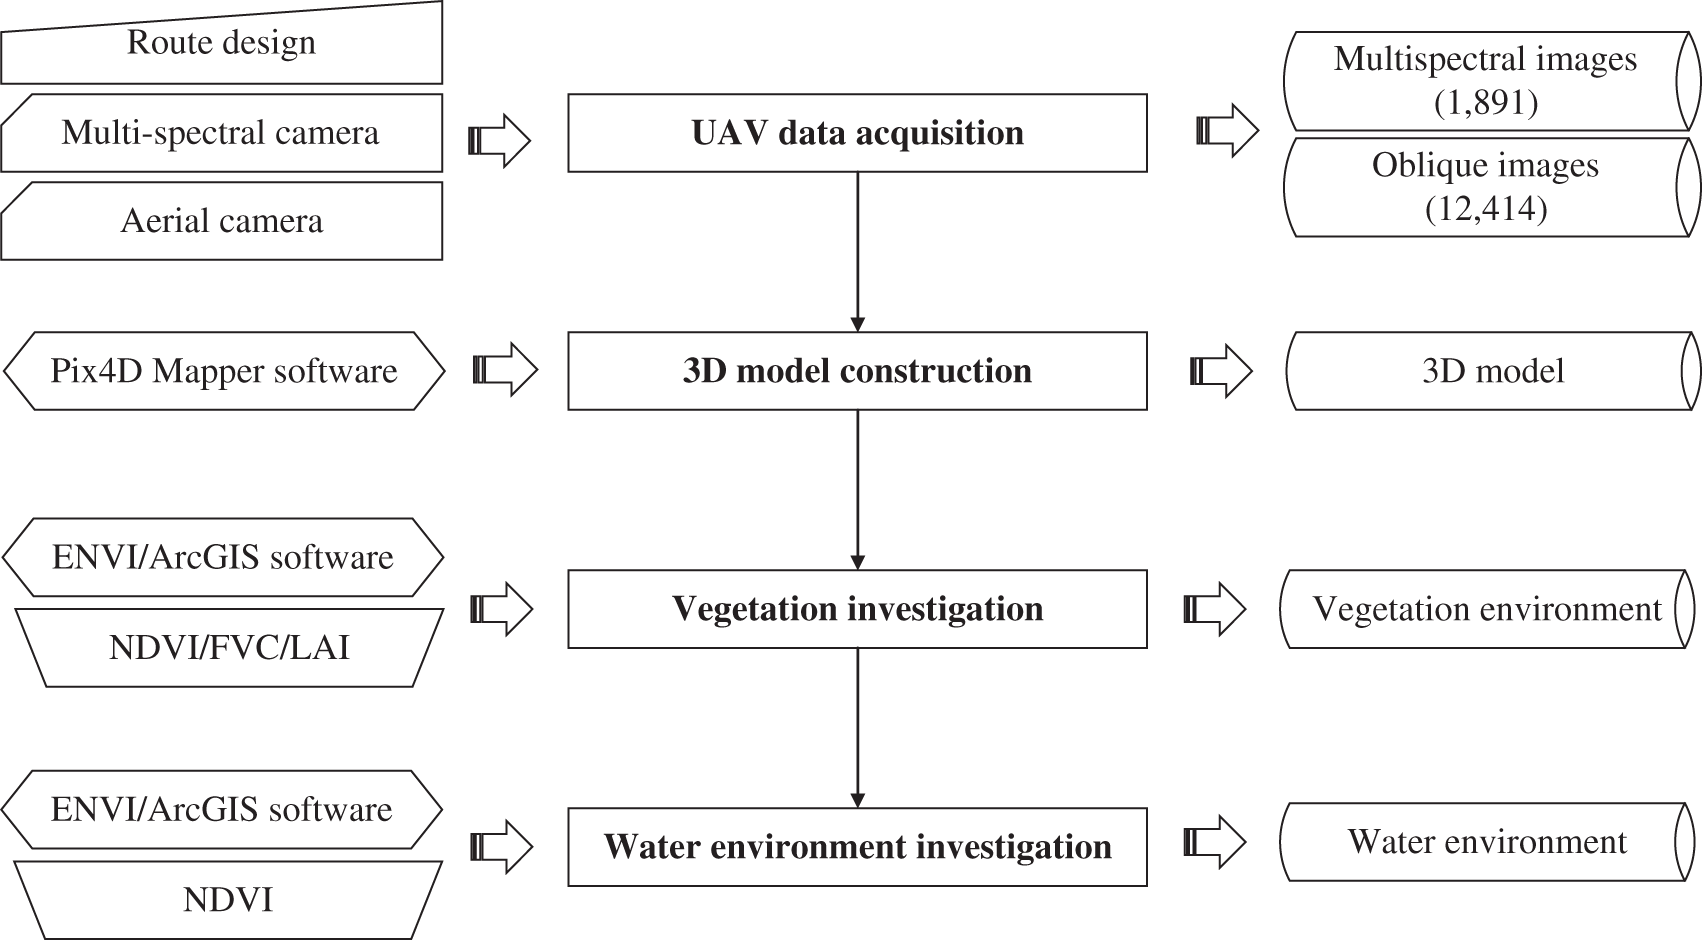
Figure 1: Flowchart of the study
The data acquisition process based on UAV aerial survey technology includes four main parts: route design, UAV flight operation, image pretreatment, and geometric accuracy evaluation. These four parts are explained in detail in the following.
The UAV manager software is used to automatically generate the air route of a UAV according to the environmental parameters and scope of UAV operation, and the route settings are saved after verification. During the operation, a UAV automatically takes photos along the current route. For a D-MSPC2000 multi-spectral camera, the S route is set, and for a D-CAM3000 aerial camera, the cross-shape route is sued to obtain multi-angle data. The route settings are shown in Fig. 2.
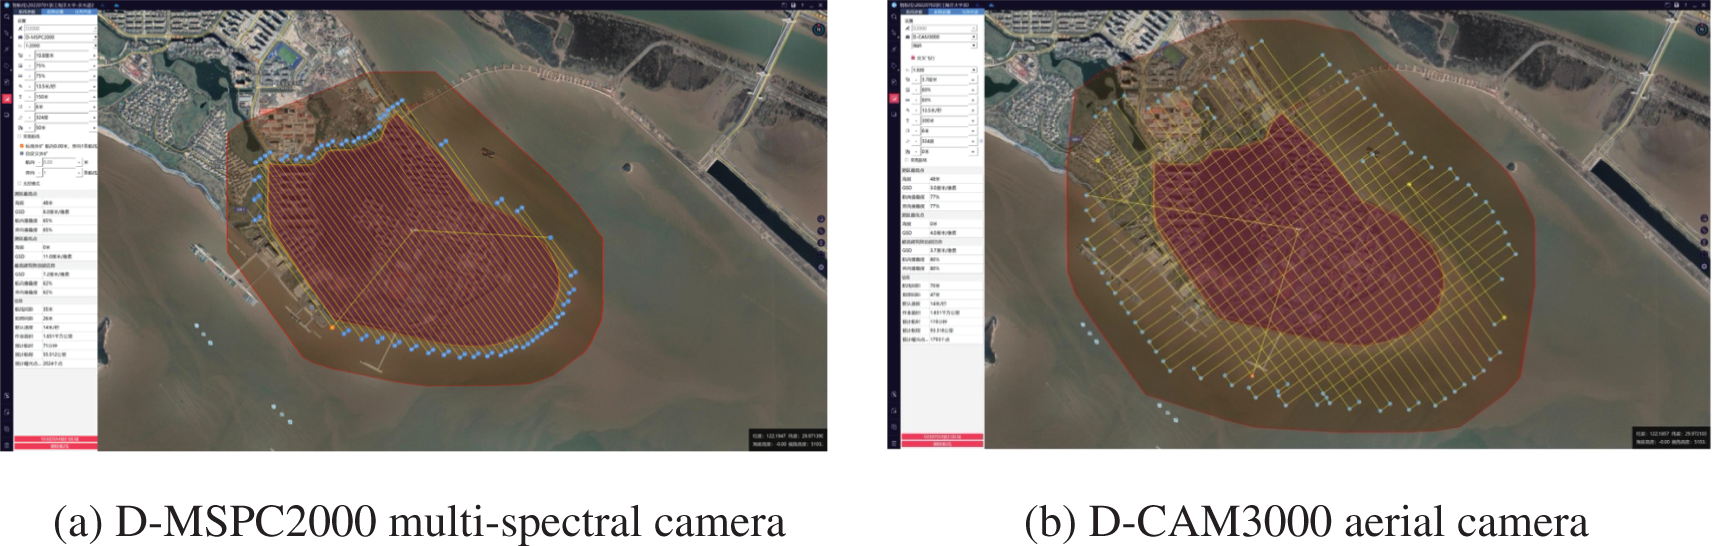
Figure 2: Flight route map settings
The flight height of a UAV represents the relative height of the UAV and the takeoff point, not the UAV altitude value. For a fixed photographic lens, the higher the flight height of a UAV is, the lower the ground resolution of a photo will be, and vice versa. This relationship can be expressed as follows:
where H is the flight height expressed in m, f is the lens focal length expressed in mm, GSD is the ground resolution given in meter, and a is the pixel size expressed in millimeter.
In an actual flight process, it is necessary to select the most suitable flight altitude for shooting according to the field situation.
The process of shooting during a flight can be affected by the exposure duration of a camera, resulting in pixel displacement and an accuracy decrease in the captured photos. Pixel displacement is related to the UAV flight speed, camera exposure time, and the GSD value. Therefore, it is necessary to select appropriate values of flight speed and exposure time based on the GSD requirements to reduce the impact of pixel displacement, and the corresponding relationship is expressed by:
where v is the flight speed in m/s, δ is image point displacement given in pixels, GSD is the ground resolution expressed in meter, and t is the exposure time given in second.
Considering the scope of the study area, battery capacity, and other influencing factors, the height, route, and other parameters are set. The flight multi-spectral data are obtained by a D-MSPC2000 camera at the height of 150 m, the heading overlap rate of 75, the side overlap rate of 75, the working area of 1.651 km2, and a total of 12,414 valid photos are obtained (six bands). Further, a CAM3000 camera is used to obtain the oblique photography data of the flight at the height of 300 m, under the cross-type flight mode, the heading overlap rate of 80, the side overlap rate of 80, and the working area of 1.651 km2; a total of 1,891 valid photos are collected.
Data processing is performed on valid photos obtained from the outwork to construct a digital elevation model, digital orthoimage, and multi-spectral data of a study area. This study uses the Pix4D Mapper software to obtain multi-spectral data and the Context Capture software to design digital elevation models and digital orthophotos. The data processing results are shown in Fig. 3.
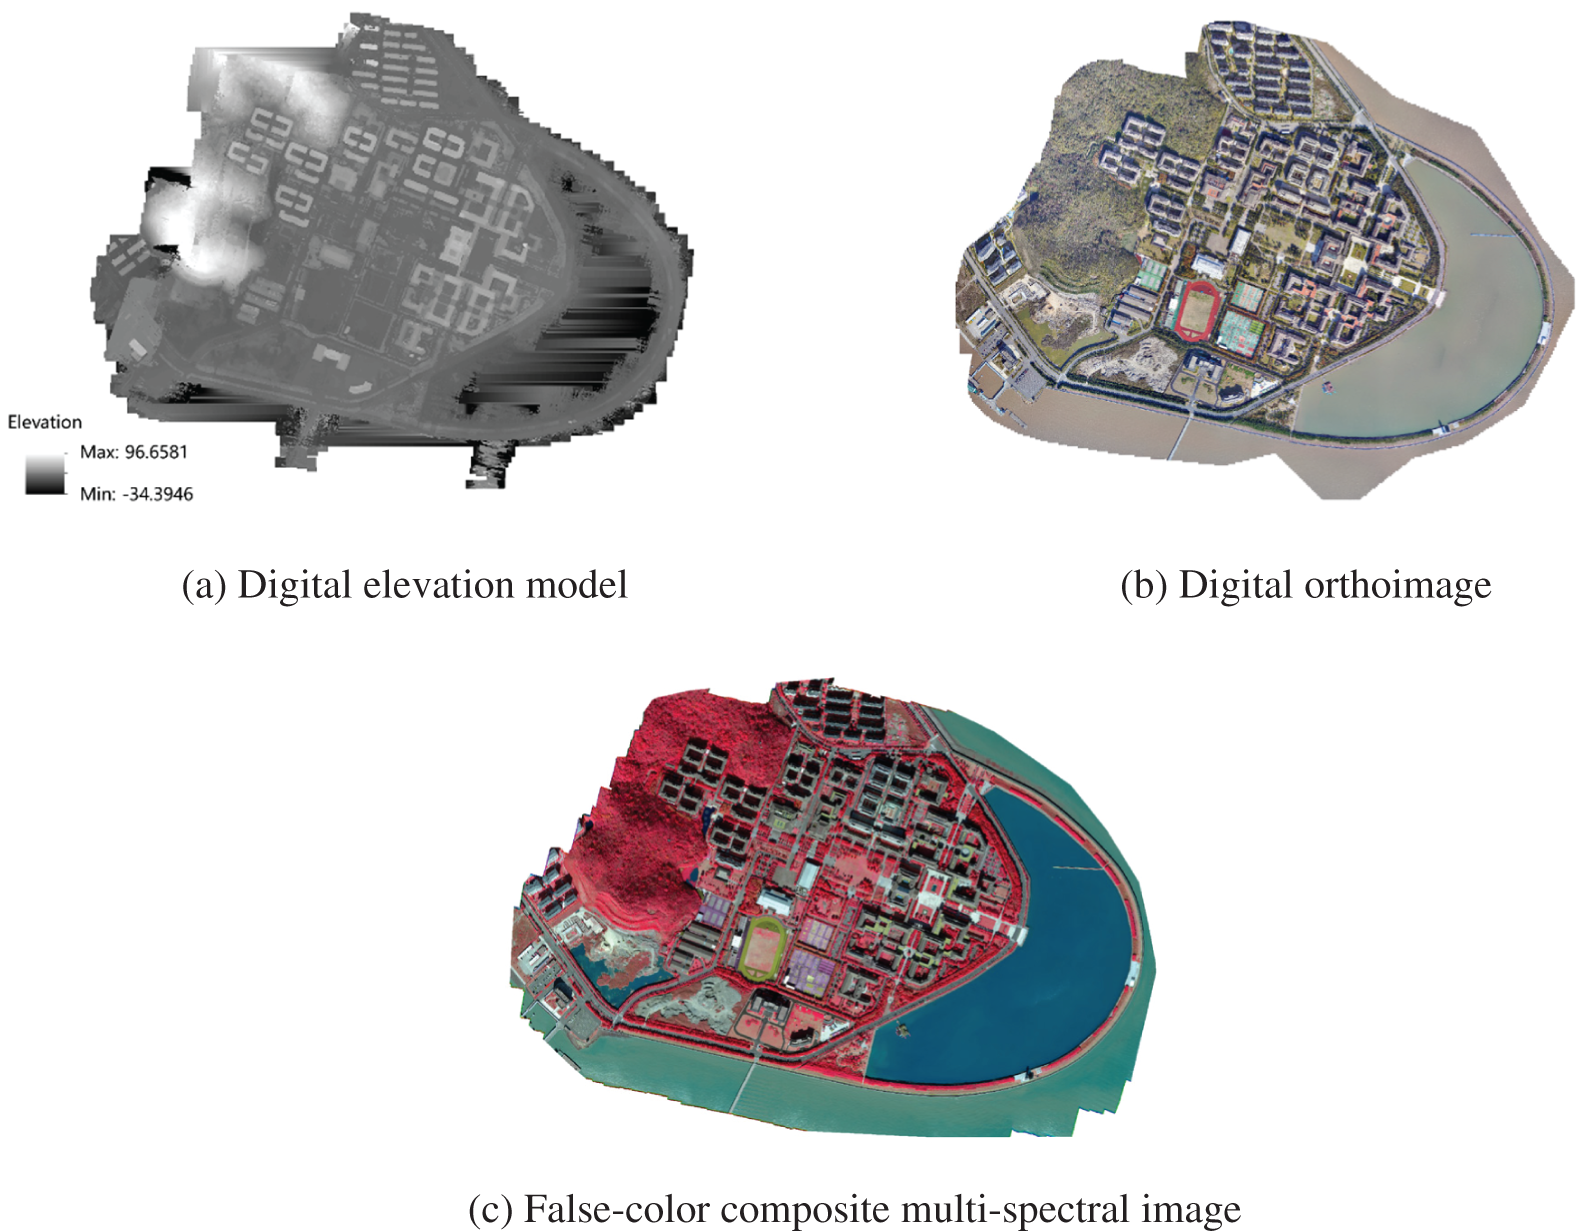
Figure 3: Data preprocessing results
3.4 Geometric Accuracy Evaluation
In the built 3D model, nine ground objects, including the square, football ground, tennis court, stadium, manhole cover, parking space, floor tile at the entrance of the gymnasium (Floor tile 1), floor tile at the main road of campus (Floor tile 2), and floor tile in front of the scientific research center (Floor tile 3), are selected for error calculation. In the measurement process of model and ground objects, an average value of five consecutive length measurements is calculated and used to reduce the influence of the measurement error. The error is calculated using Eq. (3), and the accuracy evaluation results are shown in Table 2.
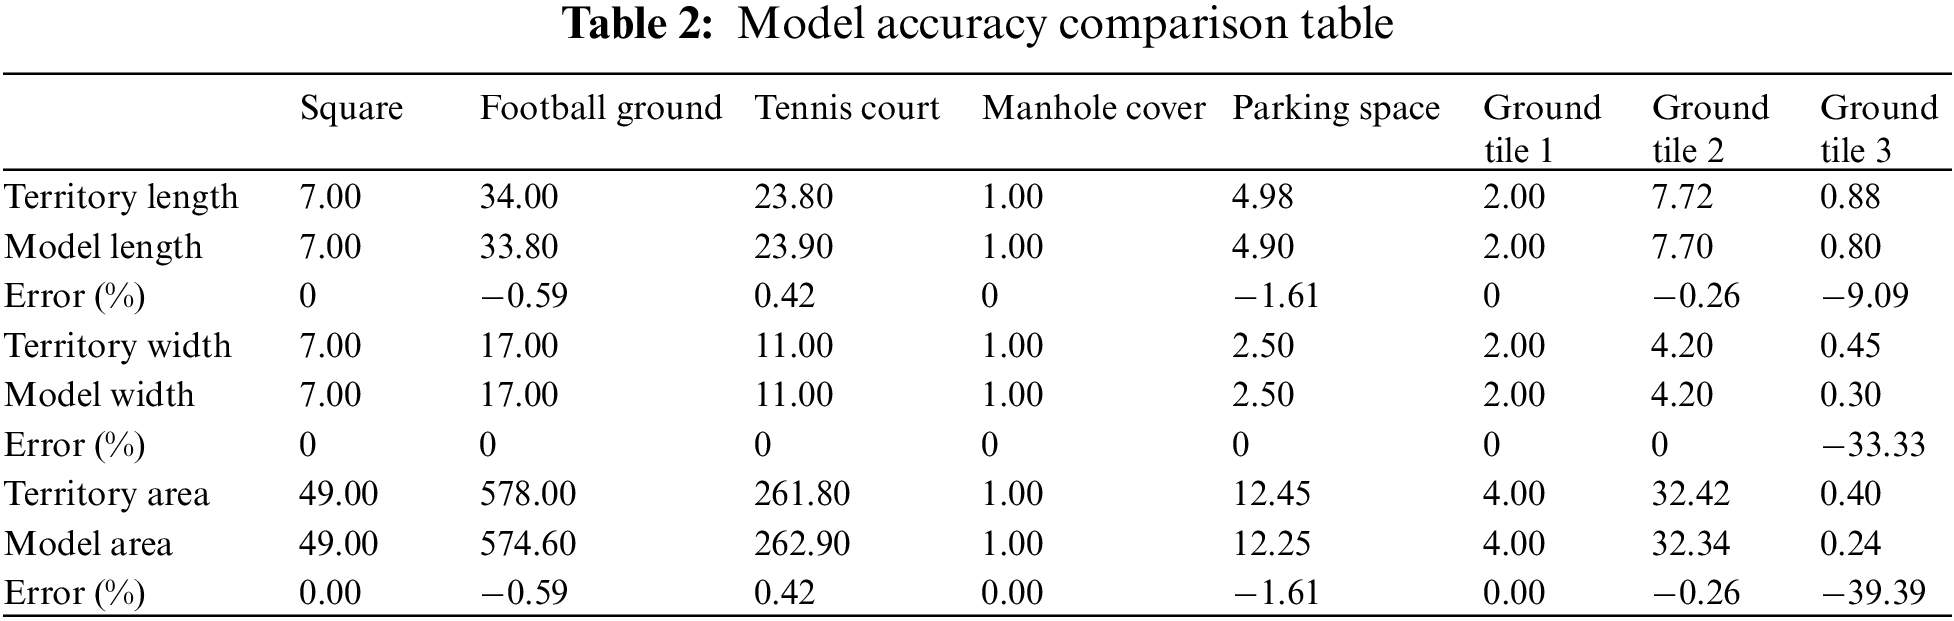
According to the results in Table 1, the length and width errors of most of the ground objects are less than two, but the error of Floor tile 3 is much larger. Thus, the constructed 3D model has high accuracy, and the digital orthophoto images obtained by the Pegasus D2000 UAV and CAM3000 aerial camera have higher geometric accuracy and slight regional deformation, which lays a foundation for the subsequent 3D model construction and digital information acquisition.
4 Regional Vegetation Environment Investigation
The regional vegetation status can reflect the level of ecological environmental quality in a small area, which is of great significance for ecological environment quality assessment and guarantee of life quality in a particular region [34,35]. The research object of this study is the vegetation growth of the Changzhi campus of Zhejiang Ocean University in July of 2022. The remote sensing images of 450 nm (35 nm), 555 nm (25 nm), 660 nm (22.5 nm), 720 nm (10 nm), 750 nm (10 nm), and 840 nm (30 nm) are obtained by a Pegasus UAV at a 150-m altitude; splicing is performed using a Pix4d Mapper to obtain multi-spectral data covering the entire study area. The values of NDVI, FVC, and LAI are calculated by ENVI 5.3 using the quantitative remote sensing model to analyze the growth status and spatial characteristics of vegetation in a region.
As mentioned above, the ENVI 5.3 software is used to calculate the band of multi-spectral reflectance data to obtain the NDVI data. Based on the obtained values, the FVC is calculated according to the improved pixel dichotomy, and LAI is calculated by an empirical algorithm [36–38].
(1) The NDVI value is calculated by:
(2) The FVC value is calculated by:
where NDVIsoil is the NDVI value of an area completely covered by bare soil or no vegetation, and NDVIveg is the NDVI value of a pixel completely covered by vegetation.
In this study, when a region can be approximated by VFCmax = 100 and VFCmin = 0, Eq. (4) can be rewritten as follows:
where NDVImax and NDVImin are the maximum and minimum NDVI values in a region, respectively.
(3) The LAI value is calculated by:
The LAI is an important structural parameter in the land surface process, and it is one of the most basic parameters to characterize the vegetation canopy structure [39]. It controls many biological and physical processes of vegetation, including photosynthesis, transpiration, carbon cycle, and precipitation interception. In this study, the LAI of a study area is calculated using the accurate inversion of the NDVI value [39].
The calculated values of NDVI, FVC, and LAI in this study are shown in Table 3.
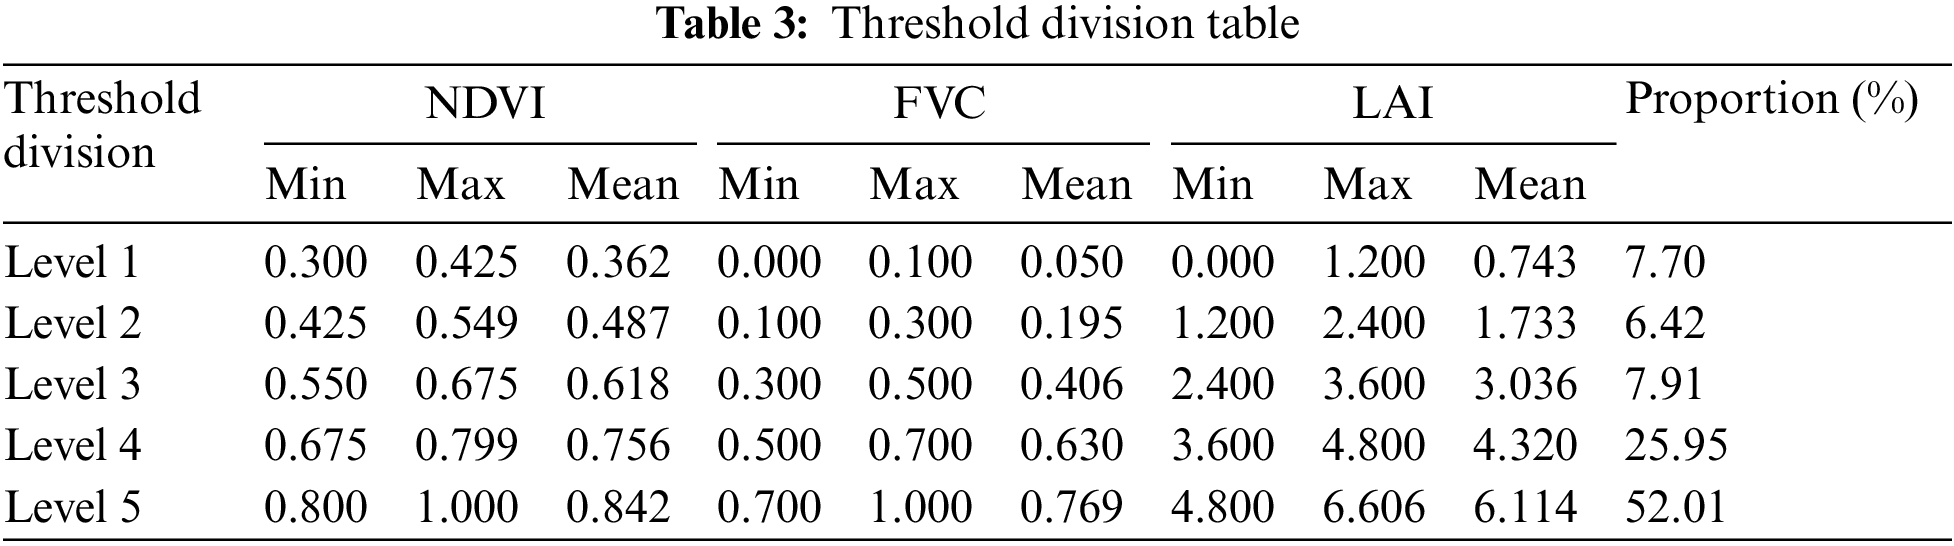
Using the UAV data to invert the vegetation index and combining it with the investigation data of the ground objects, the NDVI, FVC, and LAI data were divided into five grades denoted by Levels 1–5 according to the types of ground objects. Level 1 area denoted the sparse grassland, which was mainly distributed in the football ground on campus and the central lawn on the west side of the library, as well as sporadic distribution in the forest and reed edge area. The Level 2 area represented mainly the well-growing dense grassland, which covers the edge of the central lawn flowerbed and the surrounding area of the green belt. This level of vegetation area accounted for the least amount among all areas, covering only 3.97% of the overall study area. Level 3 denoted the sparse shrubs, which were mainly distributed on the campus of the worse-growth green belt. Most of the green belts were shown in Fig. 4 as Level 4, which was dominated by dense shrubs and trees. Level 5 was mainly distributed in the dense vegetation forests and concentrated in the northwest of the study area.
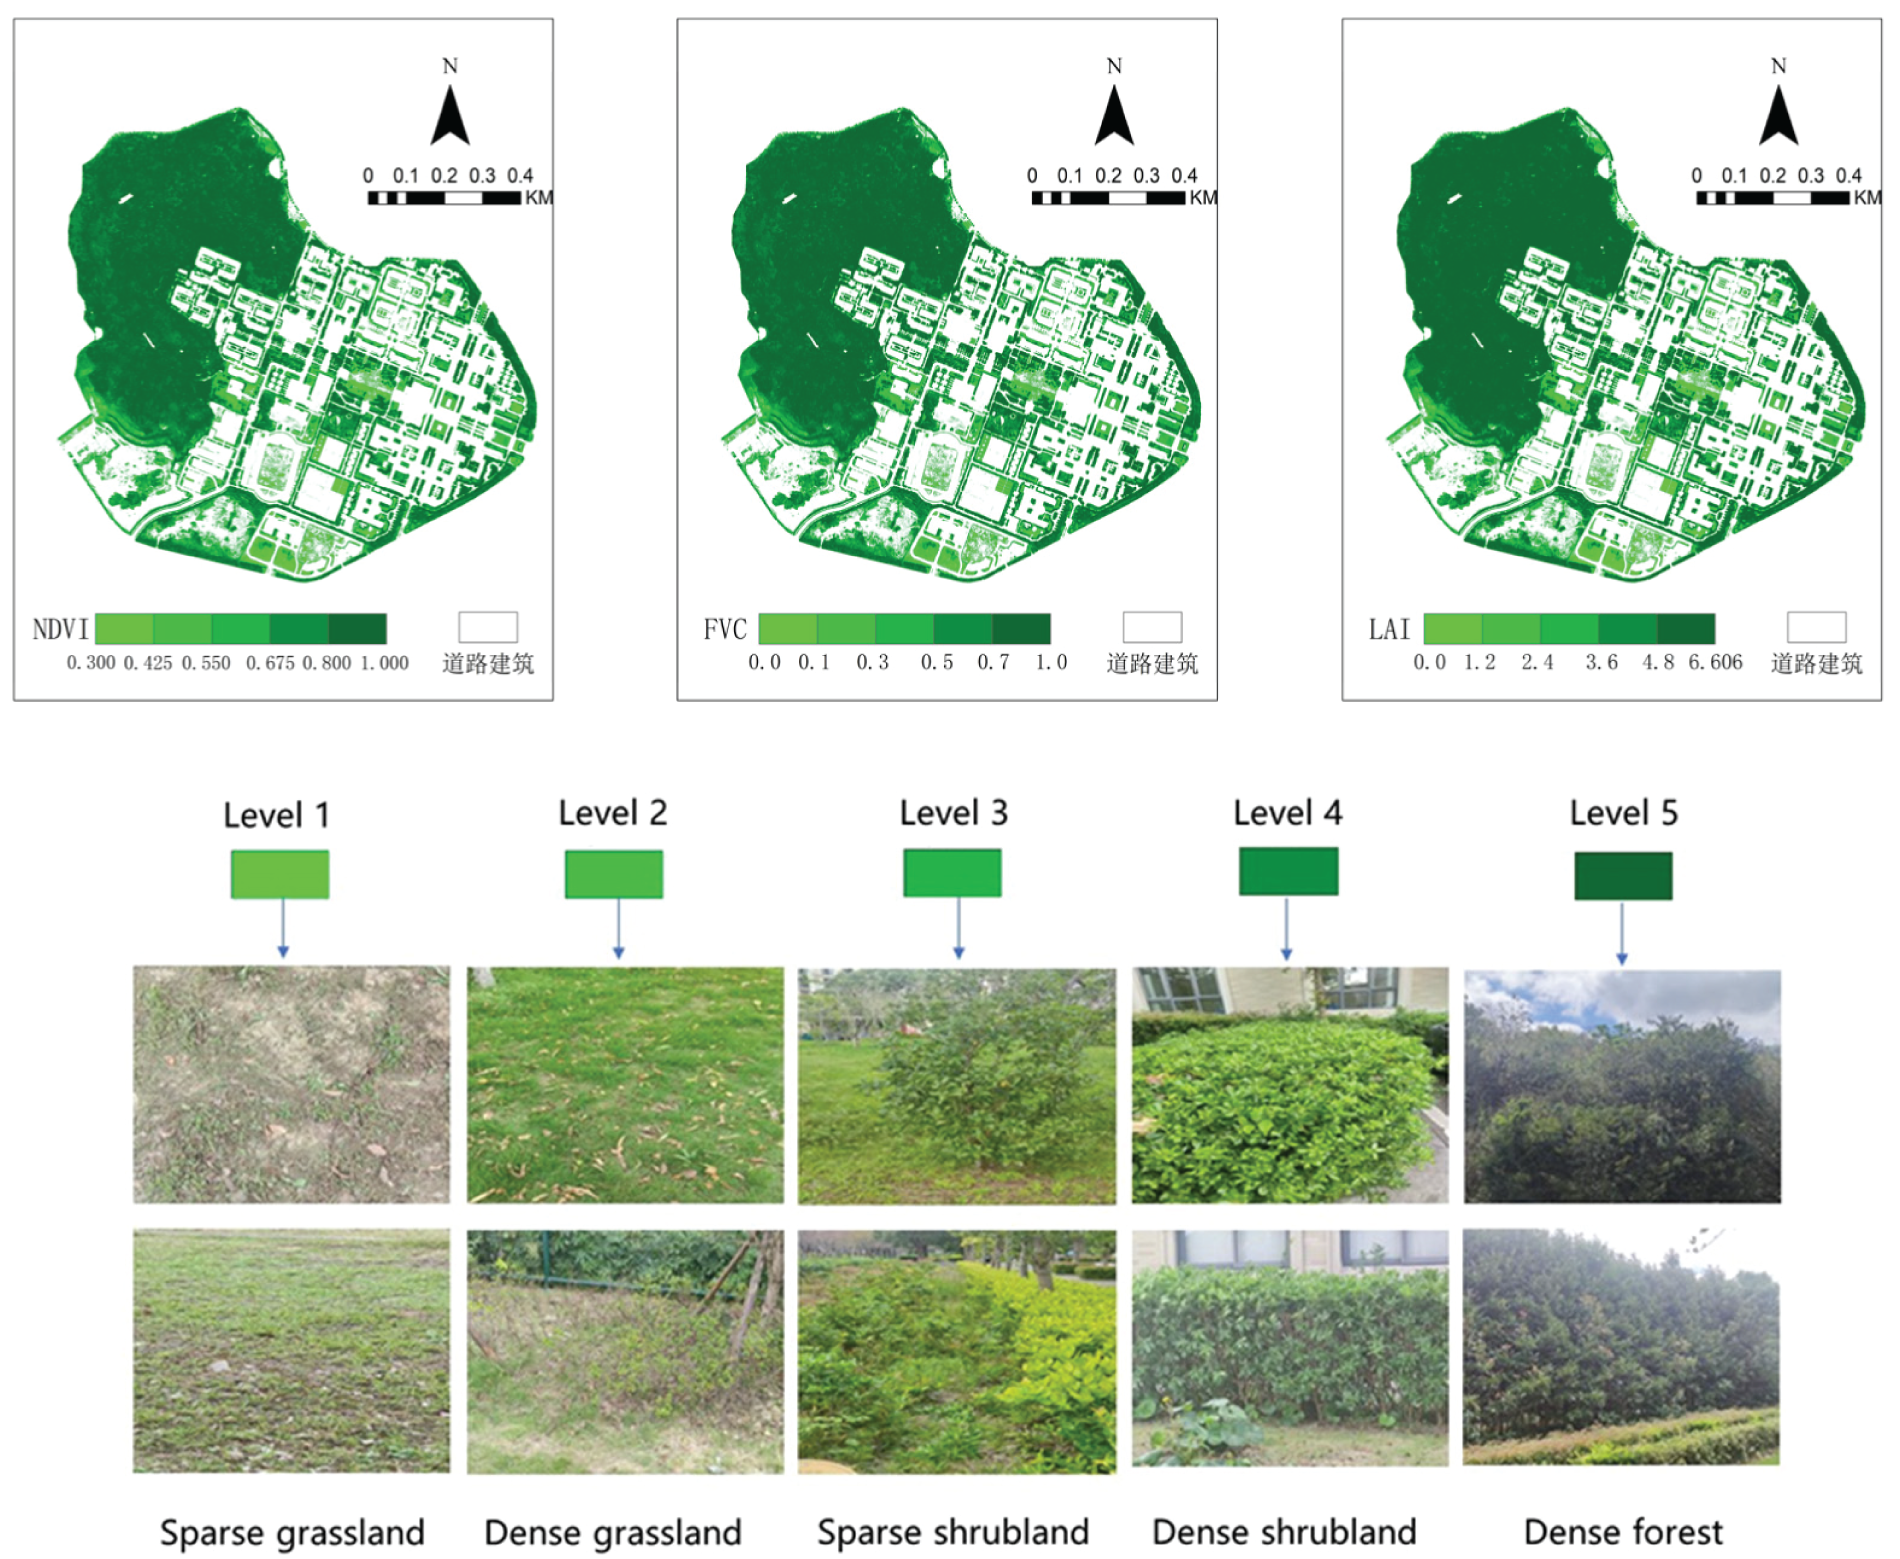
Figure 4: The results of the regional vegetation survey
Based on the multi-band remote sensing data obtained by Pegasus UAV, the spatial distribution characteristics of vegetation in Zhejiang Ocean University were analyzed by calculating the normalized vegetation index, vegetation coverage, and LAI.
(1) A large amount of vegetation was planted around the buildings and roads on the campus. The afforested area denoted more than 60% of the overall campus area, and the vegetation coverage was higher. The vegetation types in Level 4 and above accounted for more than 50% of the total area, where the vegetation was growing well. There was a certain amount of green vegetation around almost all man-made buildings. For example, the high level of campus afforestation created a good living environment for both teachers and students, which has been conducive to the development of teaching activities and the healthy growth of students;
(2) There were obvious differences in the spatial distribution of vegetation along the campus area. Affected by the layout of campus planning, the vegetation distribution in an area with a large flow of people was relatively poor, and there were many types of vegetation index grades. The areas with significant vegetation growth were mostly distributed in areas with a slight human impact, such as areas with trees around the campus and the back mountains.
5 Regional Water Environment Analysis
In this study, the Changzhi campus of Zhejiang Ocean University was used as a research objective. The multi-spectral images obtained by the Pegasus UAV at a flight height of 150 m were used to extract the aquatic vegetation area in the water body of Zhejiang Ocean University, and then the regional water environment was assessed.
Due to the small size of water areas inside the campus, the vegetation coverage near the edge of the lake was higher than in the other regions, resulting in an increase in the influence of vegetation at the edge of the water body [40,41]. Some regions of the water body were covered by vegetation, and the boundaries of the water and land areas were blurred in images. Furthermore, the spectral characteristics of the marginal aquatic vegetation were very similar to the marginal terrestrial vegetation, and it was challenging to distinguish them by the band-operation method, with a poor extraction effect. Benefiting from the high-resolution optical sensor carried by the Pegasus UAV, the imaging quality was greatly improved, and the water body with a small area inside the campus could be optically imaged with high accuracy. Based on the high-resolution characteristics of the Pegasus UAV, this study manually established a vector file to extract the water body. After field investigation and correction, the extraction results had higher accuracy.
5.1.2 Aquatic Vegetation Area Statistics
The NDVI has been the most commonly used indicator of vegetation cover and growth status, which can objectively and effectively reflect the dynamic information of vegetation cover at different spatial and temporal scales [42–44]. In general, the NDVI index of water has a negative value, whereas the NDVI index of vegetation has a positive value [45,46]. The Pegasus UAV equipped with multi-spectral sensors was used to obtain visible and near-infrared spectral information. Therefore, the images taken by Pegasus UAV were used to calculate the NDVI index, and the water area and aquatic vegetation area were distinguished based on their NDVI index values.
This study used the ENVI 5.3 software to process and analyze the images obtained by the Pegasus UAV collected at the Changzhi Campus of Zhejiang Ocean University on July 31, 2022. By manually establishing the region of interest (ROI) along the lake boundary to clip the image, the water body area was extracted, and then the band operation tool was used to calculate the NDVI index of the water body. To eliminate the interference of the oxygen pump and the land in the lake, a separate ROI region was defined for image cropping. The result is shown in Fig. 5.
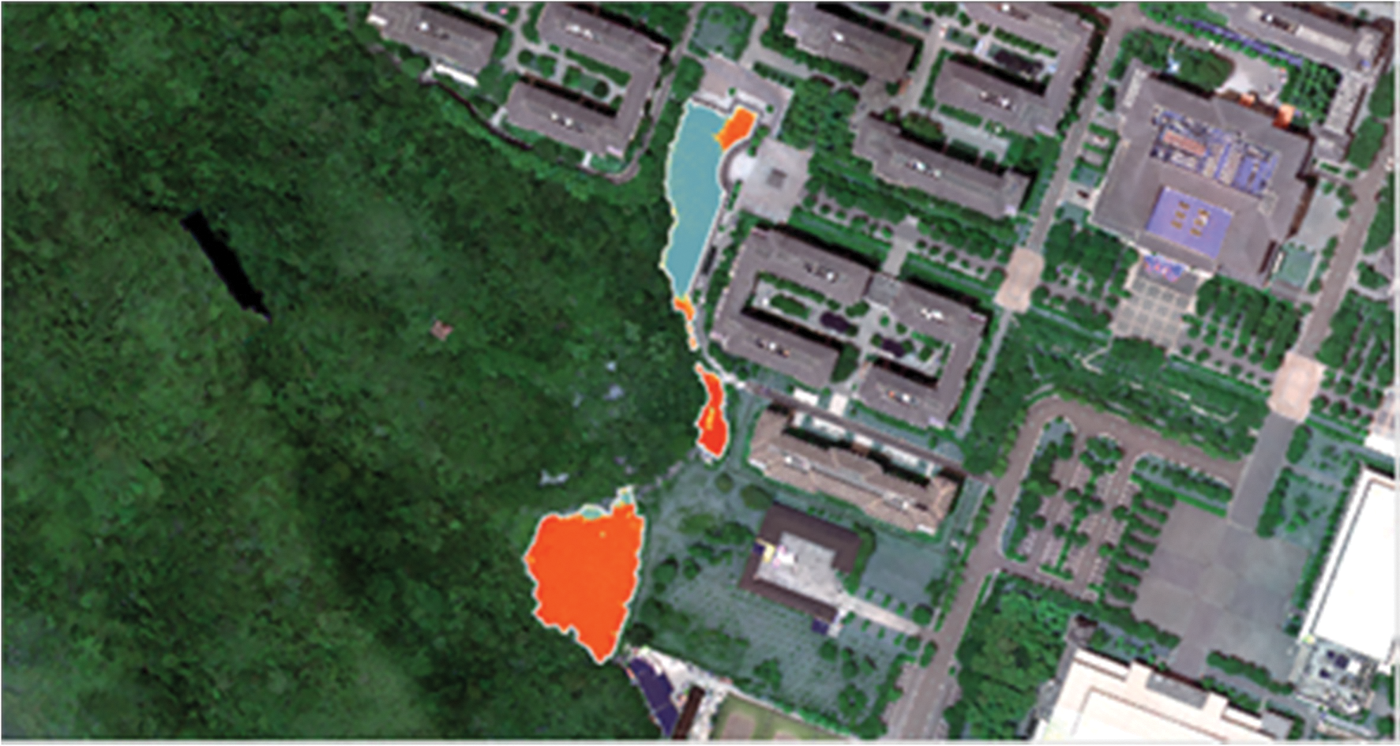
Figure 5: Water area and NDVI profile
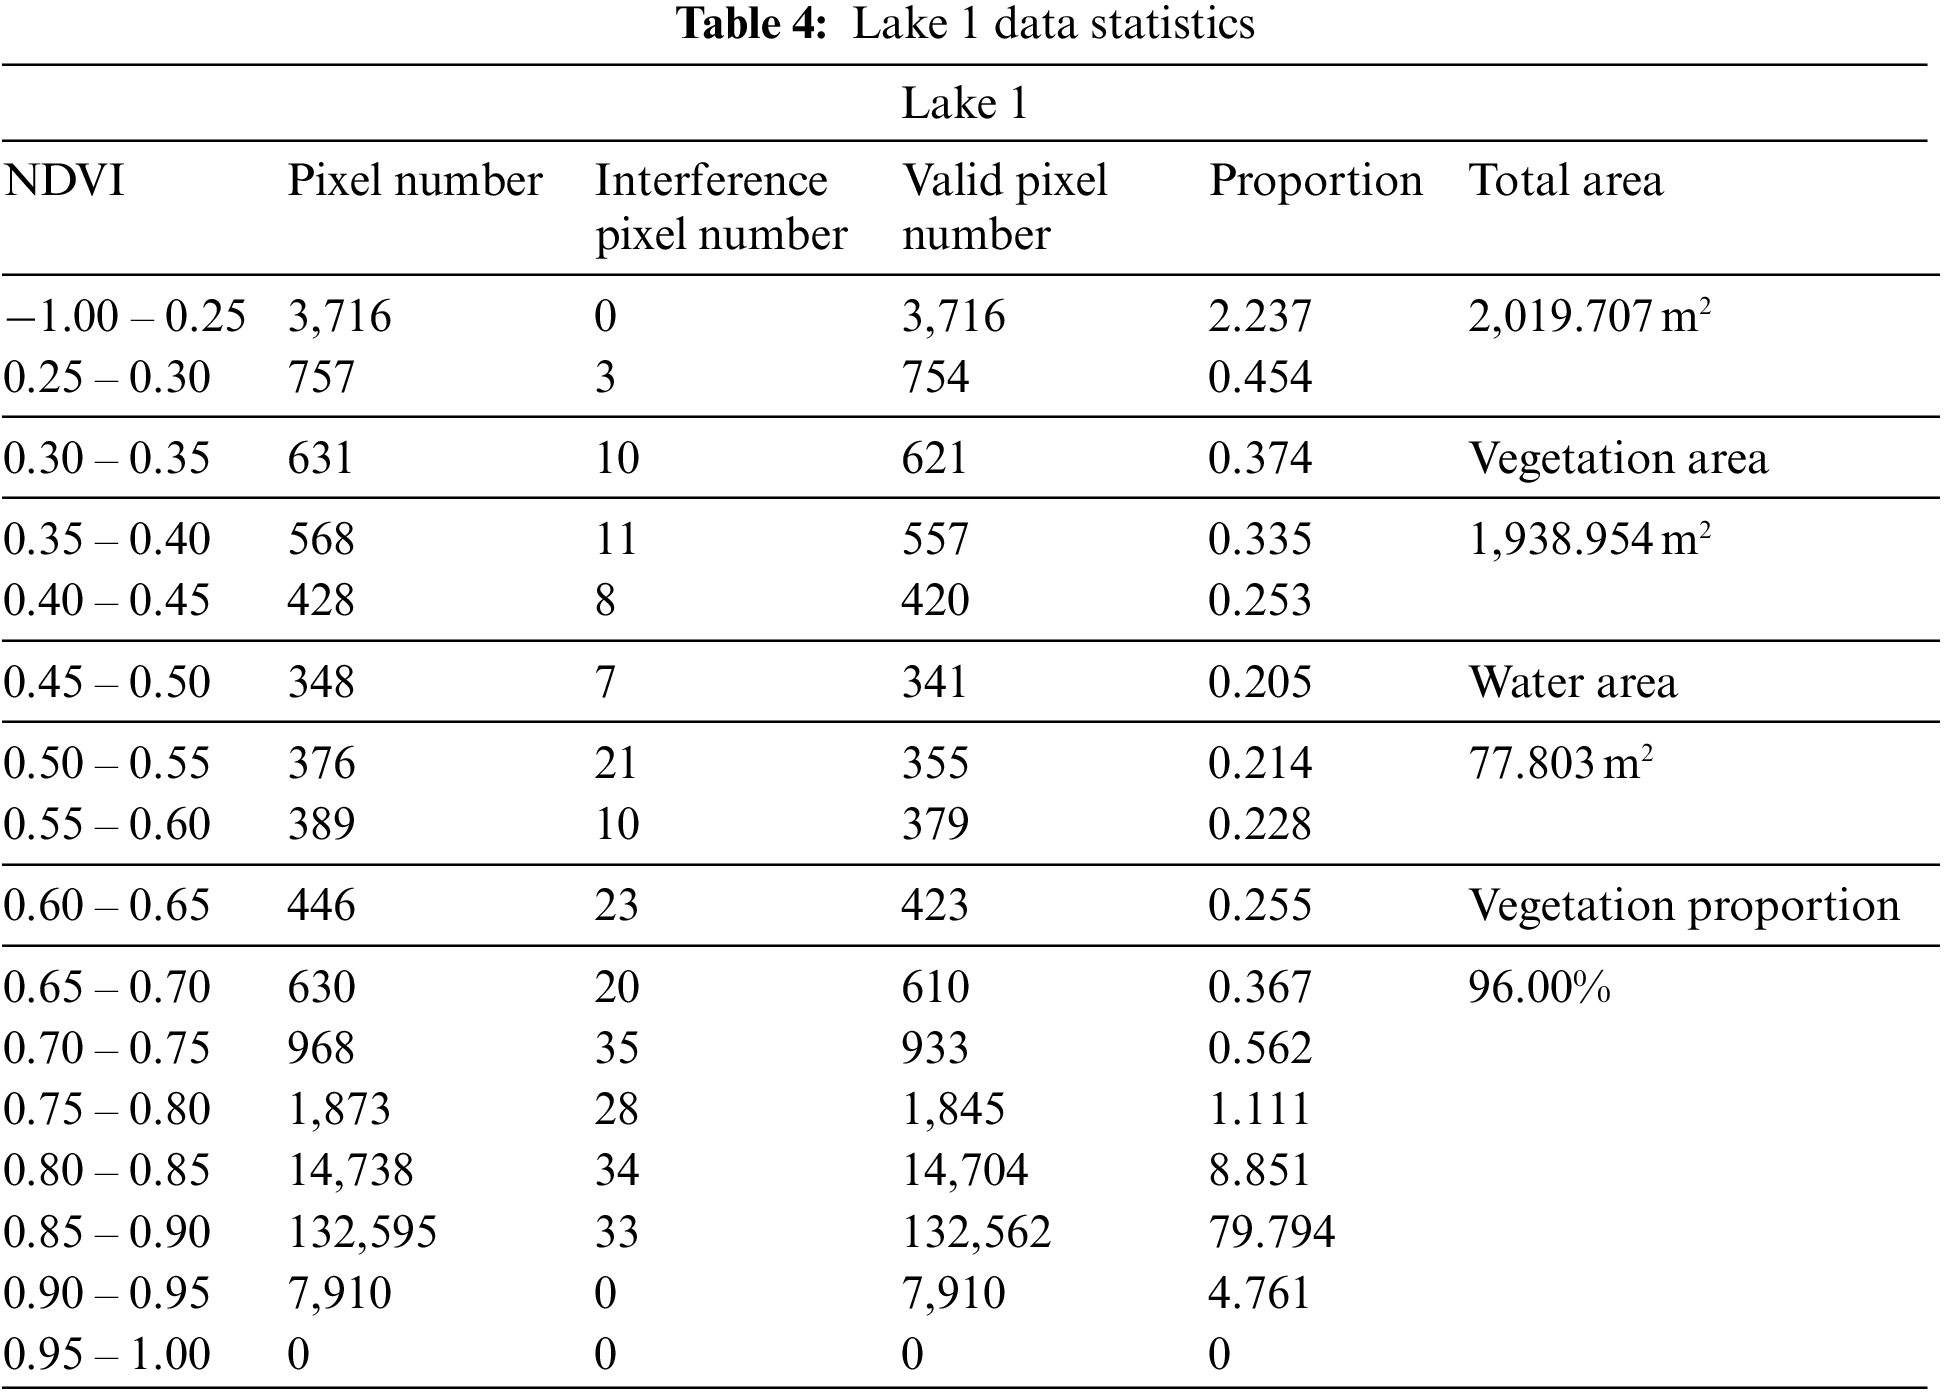
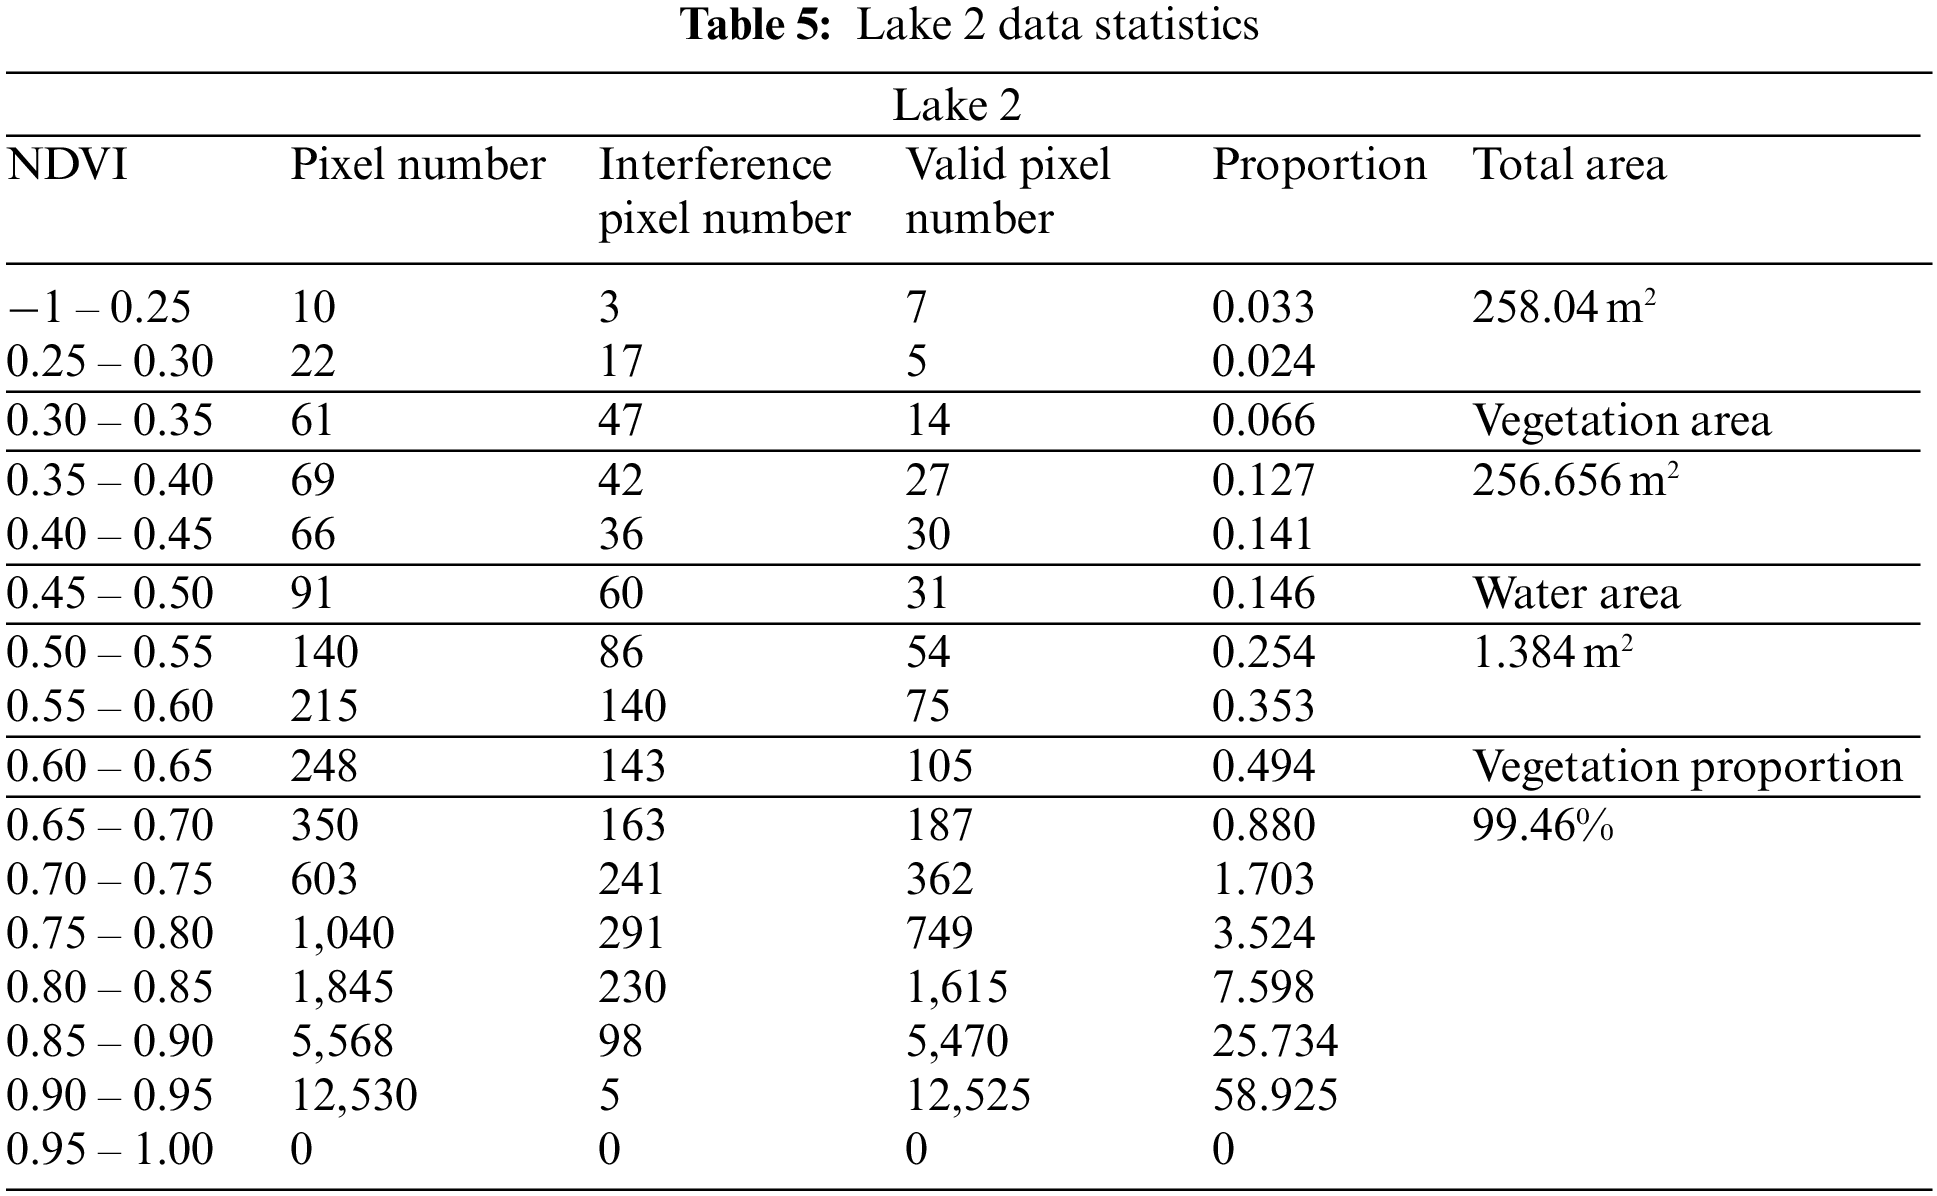
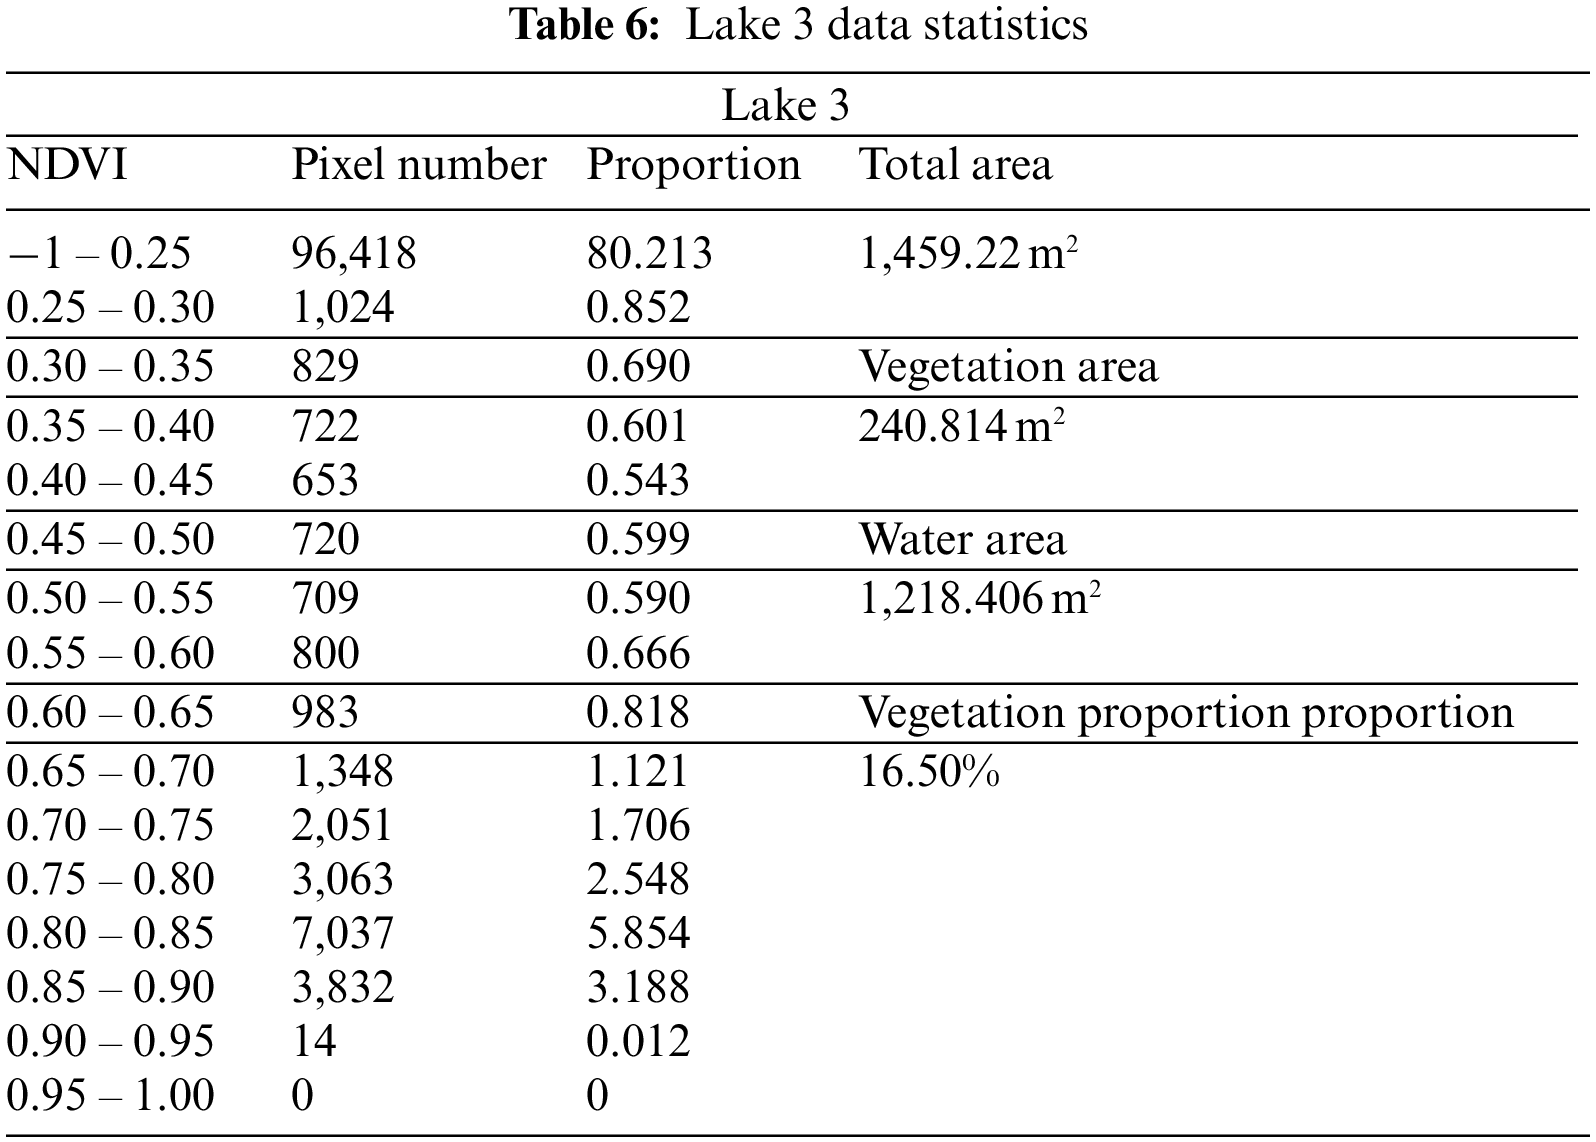
In the process of image visualization, color slices were established according to the distribution characteristics of NDVI values. Color division starts with one value and takes 16 colors down at an equal interval of 0.05 as a step, and the last scope is −1 to 0.25. The results are shown in Fig. 6 and Tables 4–6.
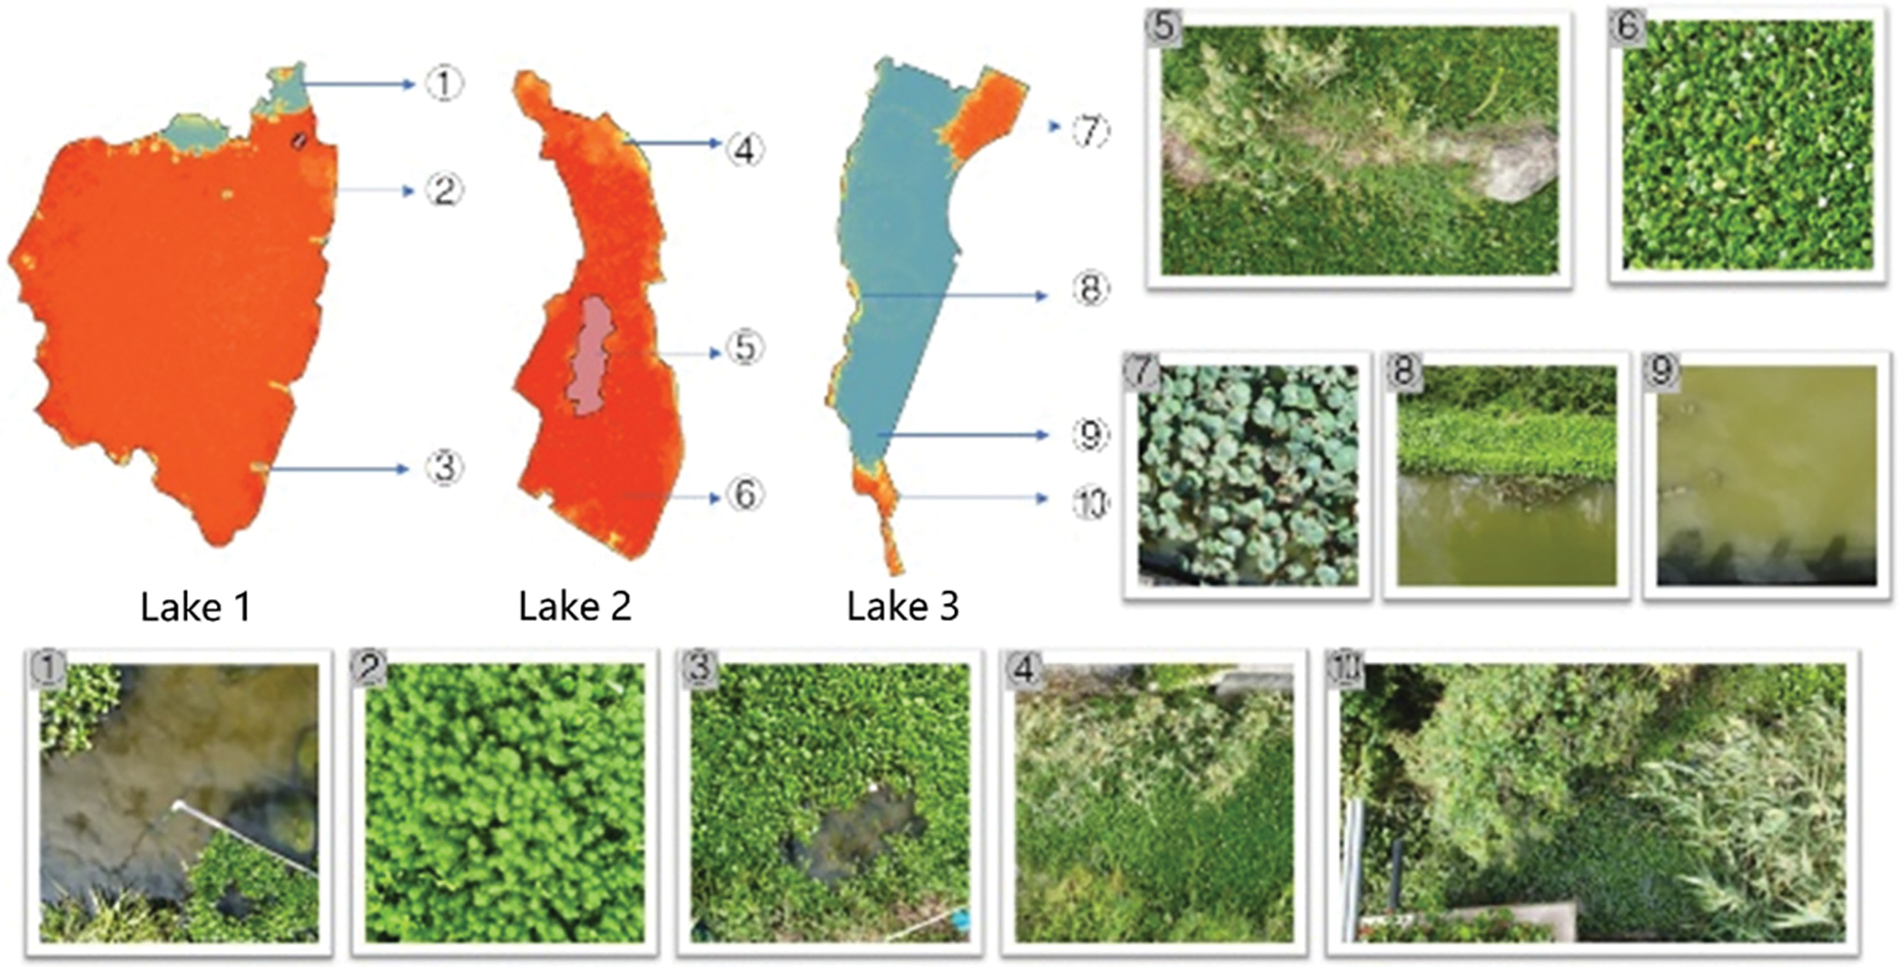
Figure 6: Comparison results of the NDVI calculation and analysis
As shown in Fig. 6, by comparing the NDVI images with the actual territory scene and considering the characteristics of the high NDVI value of aquatic vegetation, this study used the NDVI value of 0.5 as a threshold value. Therefore, areas with an NDVI value higher than 0.5 were classified as aquatic vegetation areas.
The NDVI results showed that there were large areas in Lakes 1 and 2 where the NDVI values were higher than 0.8. The field investigation results showed that in regions of Lakes 1 and 2, it was easy to grow and reproduce aquatic vegetation due to the warm and humid climate and the influence of the fertile water quality caused by human sewage with long-term desolation. These factors made the aquatic vegetation grow rapidly, covering 96% of the water area of Lake 1% and 99.5% of Lake 2.Lake 3 was the water area of Lianchi, which had termly governance on campus, so the aquatic vegetation in Lake 3 could be well controlled, accounting for only 6.1% of the water area. Most of the aquatic vegetation area in Lake 3 represented the region of artificial cultivation, accounting for roughly 10.4%.
In this study area, there were three types of aquatic vegetation. Based on the NDVI calculation results and ground object data in Fig. 2, it could be concluded that Eichhornia crassipes (Fig. 6 ⑥) had the darkest color and the highest NDVI value in the visual image of NDVI. It was followed by lotus (Fig. 6 ⑦), which was mainly distributed in the artificial cultivation region of Lake 3. However, Myriophyllum spicatum (Fig. 6 ②) and ree (Fig. 6 ④⑩) had relatively low NDVI values, which were mainly distributed in a small portion of the lakefront.
The analysis showed that due to the effect of large areas of green vegetation on the spectral characteristics of a small-scale waterbody and the influence of mixed pixels around aquatic vegetation, the NDVI values of partial water bodies were positive values. Due to this factor, the accuracy of aquatic vegetation area extraction would be reduced.
This study used high-precision remote sensing images obtained by the Pegasus UAV to extract aquatic vegetation based on the NDVI index values and investigated the water environment of the water body in the region of the Changzhi Campus of Zhejiang Ocean University.
Based on the obtained results, the following conclusions can be drawn:
(1) The method of extracting aquatic vegetation area based on the NDVI value can be easily interfered with by other ground object spectra in a smaller image scale. The original NDVI value of water may show numerical anomaly, which makes the threshold selection particularly important since it directly affects the accuracy of subsequent extraction;
(2) In the research on remote sensing of small and medium-sized water bodies, the high-resolution images obtained by UAV remote sensing can improve the accuracy of boundary discrimination and solve the problem of insufficient resolution of hyperspectral images in satellite remote sensing research. However, due to the UAV structural limitations, there is still a problem of low spectral resolution compared with satellite remote sensing, which has a certain impact on data processing and methods selection.
(3) This study investigates the water environment of the water body in campus from the perspective of aquatic vegetation cover. The results show that the water environment of Lake 3 is better than those of Lakes 1 and 2, which have high coverage of aquatic vegetation. Therefore, the governance of the campus water environment needs to be improved.
The 3D model construction and environment assessment from UAV imageries could be difficult for representing complex geographical conditions. Areas characterized by “smooth” surfaces (snowy, sandy, or rocky areas) may be failure-prone because of possible difficulties by matching algorithms to extract corresponding features over uniform surfaces.
The validation procedure illustrated in this paper suggests that both methodologies, 3D model construction and environment assessment, employed to generate the product with high-spatial resolution, exhibit a very good degree of agreement with ground truths. These comparisons show average discrepancies at centimeters levels with related RMS of less than 1 cm as the worst case. Products and measured data cross comparison show a good agreement across the study area even though some discrepancies within areas with sudden changes of topography were detected.
This study adopts Pegasus UAV remote sensing to construct a 3D model of the campus and obtain regional digital orthophoto maps, digital elevation models, and multi-spectral remote sensing data. Based on the quantitative remote sensing models, the campus vegetation distribution and water environment quality are analyzed. The obtained results are of high significance for future campus digitization and regional environmental assessment.
In this research, measured and laboratory analysis data are combined and used to conduct the inversion of water quality parameters, such as chlorophyll concentration. Using the timely and rapid characteristics of UAV remote sensing technology, the hyperspectral image of the study area was obtained, and the NDVI value was calculated to evaluate the vegetation coverage and aquatic vegetation growth. When calculating the NDVI of aquatic vegetation, based on the high-resolution features of Pegasus UAV, manually create a vector file to extract water bodies. After field inspection and calibration, the extraction results have high accuracy compared with the traditional method of calculating NDVI using spectral features. This also makes the following challenges in the research process: (1) It takes a lot of time and labor costs to conduct the environmental impact assessment. (2) The generalization of the 3D model and its application is beyond the scope of this study and will be analyzed in future studies.
UAVs are used to obtain hyperspectral images, and the vegetation indices NDVI, LAI, and FVC of the study area are calculated to monitor the environmental conditions of the study area. In the future research process, more vegetation index information and DEM DEM (digital elevation model) data will be integrated when constructing the 3D model, so as to provide strong technical support for regional scale environmental investigation and ecological environment monitoring. A more accurate and comprehensive water environment quality assessment could be conducted in the future. In addition, obtaining regional data, realizing campus visual modeling, and performing further analyses could be future research directions.
Acknowledgement: The authors would like to thank the editors and the anonymous reviewers for their outstanding comments and suggestions, which greatly helped to improve the technical quality and presentation of this manuscript. We thank LetPub (www.letpub.com) for its linguistic assistance during the preparation of this manuscript.
Funding Statement: This work was supported by the National Natural Science Foundation of China (Grant No. 42171311), the Open Fund of State Key Laboratory of Remote Sensing Science (Grant No. OFSLRSS202218), the Key Research and Development Program of the Hainan Province, China (Grant No. ZDYF2021SHFZ105), and the Training Program of Excellent Master Thesis of Zhejiang Ocean University.
Conflicts of Interest: The authors declare that they have no conflicts of interest to report regarding the present study.
References
1. Q. Liu, Z. Yang, F. Han, H. Shi, Z. Wang et al., “Ecological environment assessment in world natural heritage site based on remote-sensing data. A case study from the Bayinbuluke,” Sustainability, vol. 11, no. 22, pp. 6385–6403, 2019. [Google Scholar]
2. Z. Liu, L. Wang and B. Li, “Quality assessment of ecological environment based on Google Earth Engine: A case study of the Zhoushan islands,” Frontiers in Ecology and Evolution, vol. 10, pp. 551–557, 2022. [Google Scholar]
3. K. Ostad-Ali-Askar, R. Su and L. Liu, “Water resources and climate change,” Journal of Water and Climate Change, vol. 9, no. 2, pp. 239, 2018. [Google Scholar]
4. L. Wang, C. Chen, F. Xie, Z. Hu, Z. Zhang et al., “Estimation of the value of regional ecosystem services of an archipelago using satellite remote sensing technology: A case study of Zhoushan archipelago, China,” International Journal of Applied Earth Observation and Geoinformation, vol. 105, no. 2, pp. 102616–102632, 2021. [Google Scholar]
5. N. J. Murray, T. A. Worthington, P. Bunting, S. Duce, V. Hagger et al., “High-resolution mapping of losses and gains of Earth’s tidal wetlands,” Science, vol. 376, no. 6594, pp. 744–749, 2022. [Google Scholar]
6. H. Long, B. Lin, Y. Ou and Q. Chen, “Spatio-temporal analysis of driving factors of water resources consumption in China,” Science of the Total Environment, vol. 690, pp. 1321–1330, 2019. [Google Scholar]
7. C. Chen, H. Chen, J. Liang, W. Huang, W. Xu et al., “Extraction of water body information from remote sensing imagery while considering greenness and wetness based on tasseled cap transformation,” Remote Sensing, vol. 14, no. 13, pp. 3001–3012, 2022. [Google Scholar]
8. C. Chen, J. Liang, Z. Liu, W. Xu, Z. Zhang et al., “Method of water body information extraction in complex geographical environment from remote sensing images,” Sensors and Materials, vol. 34, no. 12, pp. 4325–4338, 2022. [Google Scholar]
9. Q. Yuan, H. Shen, T. Li, Z. Li, S. Li et al., “Deep learning in environmental remote sensing: Achievements and challenges,” Remote Sensing of Environment, vol. 241, pp. 111716–111740, 2020. [Google Scholar]
10. M. Jia, Z. Wang, D. Mao, C. Ren, C. Wang et al., “Rapid, robust, and automated mapping of tidal flats in China using time series sentinel-2 images and Google earth engine,” Remote Sensing of Environment, vol. 255, pp. 112285–11230, 2021. [Google Scholar]
11. L. P. Osco, J. M. Junior, A. P. M. Ramos, L. A. De Castro Jorge, S. N. Fatholahi et al., “A review on deep learning in UAV remote sensing,” International Journal of Applied Earth Observation and Geoinformation, vol. 102, pp. 102456–102477, 2021. [Google Scholar]
12. C. Chen, J. Liang, F. Xie, Z. Hu, W. Sun et al., “Temporal and spatial variation of coastline using remote sensing images for Zhoushan archipelago, China,” International Journal of Applied Earth Observation and Geoinformation, vol. 107, pp. 102711–102732, 2022. [Google Scholar]
13. G. Yang, K. Huang, W. Sun, X. Meng, D. Mao et al., “Enhanced mangrove vegetation index based on hyperspectral images for mapping mangrove,” ISPRS Journal of Photogrammetry and Remote Sensing, vol. 189, pp. 236–254, 2022. [Google Scholar]
14. C. Chen, J. Fu, S. Zhang and X. Zhao, “Coastline information extraction based on the tasseled cap transformation of Landsat-8 OLI images,” Estuarine Coastal and Shelf Science, vol. 217, pp. 281–291, 2019. [Google Scholar]
15. J. M. Fitton, A. F. Rennie, J. D. Hansom and F. M. Muir, “Remotely sensed mapping of the intertidal zone: A sentinel-2 and Google earth engine methodology,” Remote Sensing Applications: Society and Environment, vol. 22, pp. 100499–10061, 2021. [Google Scholar]
16. A. V. Emilien, C. Thomas and H. Thomas, “UAV & satellite synergies for optical remote sensing applications: A literature review,” Science of Remote Sensing, vol. 3, pp. 100019–100033, 2021. [Google Scholar]
17. J. Yue, T. Lei, C. Li and J. Zhu, “The application of unmanned aerial vehicle remote sensing in quickly monitoring crop pests,” Intelligent Automation & Soft Computing, vol. 18, no. 8, pp. 1043–1052, 2012. [Google Scholar]
18. F. N. Güttler, S. Niculescu and F. Gohin, “Turbidity retrieval and monitoring of Danube Delta waters using multi-sensor optical remote sensing data: An integrated view from the delta plain lakes to the western-northwestern Black Sea coastal zone,” Remote Sensing of Environment, vol. 132, pp. 86–101, 2013. [Google Scholar]
19. P. B. Holden, A. J. Rebelo and M. G. New, “Mapping invasive alien trees in water towers: A combined approach using satellite data fusion, drone technology and expert engagement,” Remote Sensing Applications: Society and Environment, vol. 21, pp. 100448–100462, 2021. [Google Scholar]
20. J. Everaerts, “The use of unmanned aerial vehicles (UAVs) for remote sensing and mapping,” The International Archives of the Photogrammetry, Remote Sensing and Spatial Information Sciences, vol. 37, no. 2008, pp. 1187–1192, 2008. [Google Scholar]
21. P. Wang, X. Luo, Z. Zhou, Y. Zang and L. Hu, “Key technology for remote sensing information acquisitionbased on micro UAV,” Transactions of the Chinese Society of Agricultural Engineering, vol. 30, no. 18, pp. 1–12, 2014. [Google Scholar]
22. S. Asadzadeh, W. J. de Oliveira and C. R. de Souza Filho, “UAV-based remote sensing for the petroleum industry and environmental monitoring: State-of-the-art and perspectives,” Journal of Petroleum Science and Engineering, vol. 208, pp. 109633–109647, 2022. [Google Scholar]
23. M. M. Nowak, K. Dziób and P. Bogawski,, “Unmanned aerial vehicles (UAVs) in environmental biology: A review,” European Journal of Ecology, vol. 4, no. 2, pp. 56–74, 2018. [Google Scholar]
24. S. Zhao, F. Kang, J. Li and C. Ma, “Structural health monitoring and inspection of dams based on UAV photogrammetry with image 3D reconstruction,” Automation in Construction, vol. 130, pp. 103832, 2021. [Google Scholar]
25. G. P. J. IV. L. G. Pearlstine and H. F. Percival, “An assessment of small unmanned aerial vehicles for wildlife research,” Wildlife Society Bulletin, vol. 34, no. 3, pp. 750–758, 2006. [Google Scholar]
26. A. Yaney-Keller, R. San Martin and R. D. Reina, “Comparison of UAV and boat surveys for detecting changes in breeding population dynamics of sea turtles,” Remote Sensing, vol. 13, no. 15, pp. 2857, 2021. [Google Scholar]
27. L. Qiao, D. Gao, R. Zhao, W. Tang, L. An et al., “Improving estimation of LAI dynamic by fusion of morphological and vegetation indices based on UAV imagery,” Computers and Electronics in Agriculture, vol. 192, pp. 106603, 2022. [Google Scholar]
28. C. L. Doughty, R. F. Ambrose, G. S. Okin and K. C. Cavanaugh, “Characterizing spatial variability in coastal wetland biomass across multiple scales using UAV and satellite imagery,” Remote Sensing in Ecology and Conservation, vol. 7, no. 3, pp. 411–429, 2021. [Google Scholar]
29. S. Baena, J. Moat, O. Whaley and D. S. Boyd, “Identifying species from the air: UAVs and the very high resolution challenge for plant conservation,” PLoS One, vol. 12, no. 11, pp. e0188714, 2017. [Google Scholar]
30. N. C. De Sa, P. Castro, S. Carvalho, E. Marchante, F. A. López-Núñez et al., “Mapping the flowering of an invasive plant using unmanned aerial vehicles: Is there potential for biocontrol monitoring?,” Frontiers in Plant Science, vol. 9, pp. 293, 2018. [Google Scholar]
31. Y. Gai, D. Yu, Y. Zhou, L. Yang, C. Chen et al., “An improved model for chlorophyll-a concentration retrieval in coastal waters based on UAV-borne hyperspectral imagery: A case study in Qingdao, China,” Water, vol. 12, no. 10, pp. 2769, 2020. [Google Scholar]
32. J. Zhang, C. Zhang, W. Shi and Y. Fu, “Quantitative evaluation and optimized utilization of water resources-water environment carrying capacity based on nature-based solutions,” Journal of Hydrology, vol. 568, pp. 96–107, 2019. [Google Scholar]
33. O. Dubovik, G. L. Schuster, F. Xu, Y. Hu, H. Bösch et al., “Grand challenges in satellite remote sensing,” Frontiers in Remote Sensing, vol. 2, pp. 619818–619828, 2021. [Google Scholar]
34. C. Chen, L. Wang, Z. Zhang, C. Lu, H. Chen et al., “Construction and application of quality evaluation index system for remote-sensing image fusion,” Journal of Applied Remote Sensing, vol. 16, no. 1, pp. 012006, 2022. [Google Scholar]
35. H. Chen, C. Chen, Z. Zhang, C. Lu, L. Wang et al., “Changes of the spatial and temporal characteristics of land-use landscape patterns using multi-temporal landsat satellite data: A case study of Zhoushan island, China,” Ocean & Coastal Management, vol. 213, pp. 105842–105857, 2021. [Google Scholar]
36. R. S. DeFries and J. R. G. Townshend, “NDVI-derived land cover classifications at a global scale,” International Journal of Remote Sensing, vol. 15, no. 17, pp. 3567–3586, 1994. [Google Scholar]
37. S. K. McFeeters, “The use of the normalized difference water index (NDWI) in the delineation of open water features,” International Journal of Remote Sensing, vol. 17, no. 7, pp. 1425–1432, 1996. [Google Scholar]
38. H. Xu, “Modification of normalized difference water index (NDWI) to enhance open water features in remotely sensed imagery,” International Journal of Remote Sensing, vol. 27, no. 14, pp. 3025–3033, 2006. [Google Scholar]
39. W. R. Becker, T. B. Ló, J. A. Johann and E. Mercante, “Statistical features for land use and land cover classification in Google earth engine,” Remote Sensing Applications: Society and Environment, vol. 21, pp. 100459–100468, 2021. [Google Scholar]
40. H. Singh, R. D. Garg and H. C. Karnatak, “Online image classification and analysis using OGC web processing service,” Earth Science Informatics, vol. 12, pp. 307–317, 2020. [Google Scholar]
41. S. N. MohanRajan, A. Loganathan and P. Manoharan, “Survey on land Use/Land cover (LU/LC) change analysis in remote sensing and GIS environment: Techniques and challenges,” Environmental Science and Pollution Research, vol. 27, no. 24, pp. 29900–29926, 2020. [Google Scholar]
42. X. Yang, Z. Zhu, S. Qiu, K. D. Kroeger, Z. Zhu et al., “Detection and characterization of coastal tidal wetland change in the northeastern US using landsat time series,” Remote Sensing of Environment, vol. 276, pp. 113047–113066, 2022. [Google Scholar]
43. L. Chu, Y. Zou, D. Masiliūnas, T. Blaschke and J. Verbesselt, “Assessing the impact of bridge construction on the land use/cover and socio-economic indicator time series: A case study of Hangzhou Bay Bridge,” GIScience & Remote Sensing, vol. 58, no. 2, pp. 199–216, 2021. [Google Scholar]
44. C. Chen, J. Fu, X. Sui, X. Lu and A. Tan, “Construction and application of knowledge decision tree after a disaster for water body information extraction from remote sensing images,” Journal of Remote Sensing, vol. 22, no. 5, pp. 792–801, 2018. [Google Scholar]
45. M. Jia, Z. Wang, D. Mao, C. Ren, C. Wang et al., “Rapid, robust, and automated mapping of tidal flats in China using time series sentinel-2 images and Google earth engine,” Remote Sensing of Environment, vol. 255, pp. 112285, 2021. [Google Scholar]
46. Z. Zou, C. Chen, Z. Liu, Z. Zhang, J. Liang et al., “Extraction of aquaculture ponds along coastal region using U2-net deep learning model from remote sensing images,” Remote Sensing, vol. 14, pp. 4001, 2022. [Google Scholar]
Cite This Article
 Copyright © 2023 The Author(s). Published by Tech Science Press.
This work is licensed under a Creative Commons Attribution 4.0 International License , which permits unrestricted use, distribution, and reproduction in any medium, provided the original work is properly cited.
 Downloads
 Citation Tools