
 Submit a Paper
 Propose a Special lssue
 Open Access
ARTICLE

Anomaly Detection and Access Control for Cloud-Edge Collaboration Networks
College of Computers and Information Security, Guilin University of Electronic Technology, Guilin, 541004, China
* Corresponding Author: Qian He. Email:
(This article belongs to the Special Issue: Advanced Achievements of Intelligent and Secure Systems for the Next Generation Computing)
Intelligent Automation & Soft Computing 2023, 37(2), 2335-2353. https://doi.org/10.32604/iasc.2023.039989
Received 27 February 2023; Accepted 15 May 2023; Issue published 21 June 2023
 View Full Text
 Download PDF
Abstract
Software-defined networking (SDN) enables the separation of control and data planes, allowing for centralized control and management of the network. Without adequate access control methods, the risk of unauthorized access to the network and its resources increases significantly. This can result in various security breaches. In addition, if authorized devices are attacked or controlled by hackers, they may turn into malicious devices, which can cause severe damage to the network if their abnormal behaviour goes undetected and their access privileges are not promptly restricted. To solve those problems, an anomaly detection and access control mechanism based on SDN and neural networks is proposed for cloud-edge collaboration networks. The system employs the Attribute Based Access Control (ABAC) model and smart contract for fine-grained control of device access to the network. Furthermore, a cloud-edge collaborative Key Performance Indicator (KPI) anomaly detection method based on the Gated Recurrent Unit and Generative Adversarial Nets (GRU-GAN) is designed to discover the anomaly devices. An access restriction mechanism based on reputation value and anomaly detection is given to prevent anomalous devices. Experiments show that the proposed mechanism performs better anomaly detection on several datasets. The reputation-based access restriction effectively reduces the number of malicious device attacks.Keywords
Software-defined networking (SDN) is seen as a promising and exciting option for the future of the Internet due to its flexibility, programmability, increased visibility, automation, cost savings, and innovation potential [1]. SDN enables the separation of the control plane and data plane in a network, allowing for centralized control and management. This makes it possible to program and configure the network dynamically, making it more flexible and adaptable to changing demands. Edge devices, such as IoT devices and smartphones, often operate on the edge of networks, collecting and processing data before sending it to the cloud or a data centre. With the prevalence of edge computing, a large number of devices are being deployed on the edge side of SDN networks [2]. Edge devices often have limited memory and processing power, challenging applying security updates and patches and leaving them vulnerable to known threats [3].
When malicious devices connect to a network, the network may be vulnerable to various attacks that can cause significant damage, such as denial-of-service (DoS) attacks and malware infections [4]. Therefore, SDN networks require appropriate access control mechanisms to restrict unauthorized edge devices from accessing the network and its resources, which is especially important in SDN environments with separate control and data planes. However, in the current SDN network environment, managing terminal access is challenging due to the lack of appropriate access control methods. In order to avoid the security issues mentioned above, some research has been conducted in recent literature [5,6]. However, traditional centralized access control models rely on a central authority to manage and enforce access policies, making them vulnerable to attacks and breaches. Recently, blockchain-based security solutions in SDN-enabled networks have also gained popularity [7–9]. Unlike centralized access control models that rely on a single point of failure, blockchain-based access control models are more resilient to failures and attacks, as the system is decentralized and distributed across nodes. Blockchain allows for transparent storage of access control policies, which can be easily audited and verified by all parties in a permissioned network.
Suppose a legitimate device with access to the network is compromised and controlled illegally. In that case, the entire network may suffer severe damage if necessary protective measures are not taken promptly. Key Performance Indicator (KPI) anomaly detection can help prevent intrusions through edge devices [10]. By monitoring the expected performance of edge devices, operators can detect abnormal situations that may indicate intrusions or other security threats.
One of the critical challenges in KPI anomaly detection in SDN networks is the large number of data generated by network devices and the need to process this data in real time to ensure quick and effective network management [11]. Many studies have explored machine learning techniques, such as ARMA [12], clustering algorithms, and neural networks [13], to address this challenge for KPI anomaly detection in SDN networks. Deep learning performs big data processing and analysis better than other machine learning methods. It thus has become a suitable method to solve the KPI anomaly detection problem [14]. However, deep learning-based anomaly detection requires numerous computations to achieve high accuracy, while edge devices need real-time responses for detecting anomalies. It means both cloud and edge computing alone can fulfil this requirement.
Combining cloud-edge collaborative architecture and deep learning, we propose a collaborative anomaly detection algorithm based on GRU-GAN. To address the challenge of a large number of anomaly detection tasks, the edge nodes divide the network into subregions, and the detection tasks in the cloud centre are divided into detection tasks for each subregion. The cloud and edge work together intelligently to complete the KPI anomaly detection tasks. The cloud trains the models, while the edge devices perform the detection, ensuring the security of operational data and reducing the delay of data transmission, thereby sharing the computing burden of the cloud.
In this paper, we propose a decentralized access control mechanism based on ABAC and blockchain. Its main idea is to use attributes to identify devices uniquely. Network administrators use the ABAC model to develop control policies for devices accessing the SDN network based on multiple attributes. In order to prevent abnormal devices from further endangering the network, we designed an access restriction mechanism based on reputation value. When a device’s KPI detection shows abnormal results, its reputation value will be reduced. As the number of abnormal events increases, the reputation value will quickly drop below the threshold. At this point, the edge-controller will call the smart contract to update the device’s access policy and restrict its network permissions.
In summary, our main contributions are as follows.
(1) We design an anomaly detection and access control system for cloud-edge collaboration networks. The system uses the ABAC model for fine-grained control of device access to the network. We use smart contract technology to implement the ABAC model, making the access control process and device-related attribute information secure and reliable.
(2) We propose a cloud-edge collaborative anomaly detection algorithm based on GRU-GAN, utilizing GRU as both the generator and discriminator models. The GRU-GAN generates an anomaly score based on the generator model’s reconstruction error and the discriminator model’s discrimination loss and automatically calculates the detection threshold to determine the anomaly.
(3) We propose an access restriction mechanism based on reputation value and anomaly detection results. If a device experiences an anomaly, its reputation value gradually decreases. Once the reputation value falls below a certain threshold, the device’s access control policy is updated to restrict or revoke its access rights.
The rest of this paper is organized as follows: Section 2 comprehensively reviews related work. In Section 3, we give an overview of system architecture. Section 4 describes the KPI anomaly detection method based on GRU-GAN in detail. In Section 5, we explain the process of access control. We discuss and evaluate the results of the proposed system using various evaluation metrics in Section 6. The paper is concluded in Section 7.
This section overviews the related efforts in traditional access control methods in SDN and KPI anomaly detection solutions.
Access control is one of the most critical research areas in SDN. Mattos et al. [15] proposed an access control model that combines user information with OpenFlow flow tables to address fine-grained user access control. However, the model has a single authentication method and poor scalability with many endpoints. Shin et al. [16] used context separation, resource utilization monitoring, and micro-privilege structures to prevent malicious applications. However, it performs poorly in specifying security policies. Al-Alaj et al. [5] proposed an access control model for SDN applications based on parameterized roles and permissions. However, it is a centralized method that may have poor performance in large-scale networks. Chattaraj et al. [7] proposed a blockchain-based access control scheme for the SDN framework to resist various well-known attacks and alleviate the existing single point of controller failure issue in SDN. Duy et al. [8] designed a blockchain-based access control framework, B-DAC, to achieve decentralized identity authentication and fine-grained access control for northbound interfaces, assisting administrators in managing and protecting critical resources.
Although the above solutions have addressed access control, they do not consider the potential damage to the network caused by devices that are experiencing anomalies. Zhou et al. [17] proposed a collaborative anomaly detection scheme in distributed SDN, which allows multiple SDN controllers to work together and train a global detection model that accurately identifies various cyber attacks. Zhou et al. [18] proposed a novel collaborative prediction and detection framework for edge computer DDoS attacks. LSTM networks were explored to predict and mitigate DDoS attacks in real-time. However, both [17] and [18] can not prevent malicious devices from accessing the network. Kammoun et al. [6] proposed a new SDN architecture based on IoT trust management and access control, which calculates the terminal trust value through a predefined trust management algorithm and prevents malicious devices from accessing the network based on the trust value. However, this approach does not consider the security of access control policies and may lead to policy leakage and other issues.
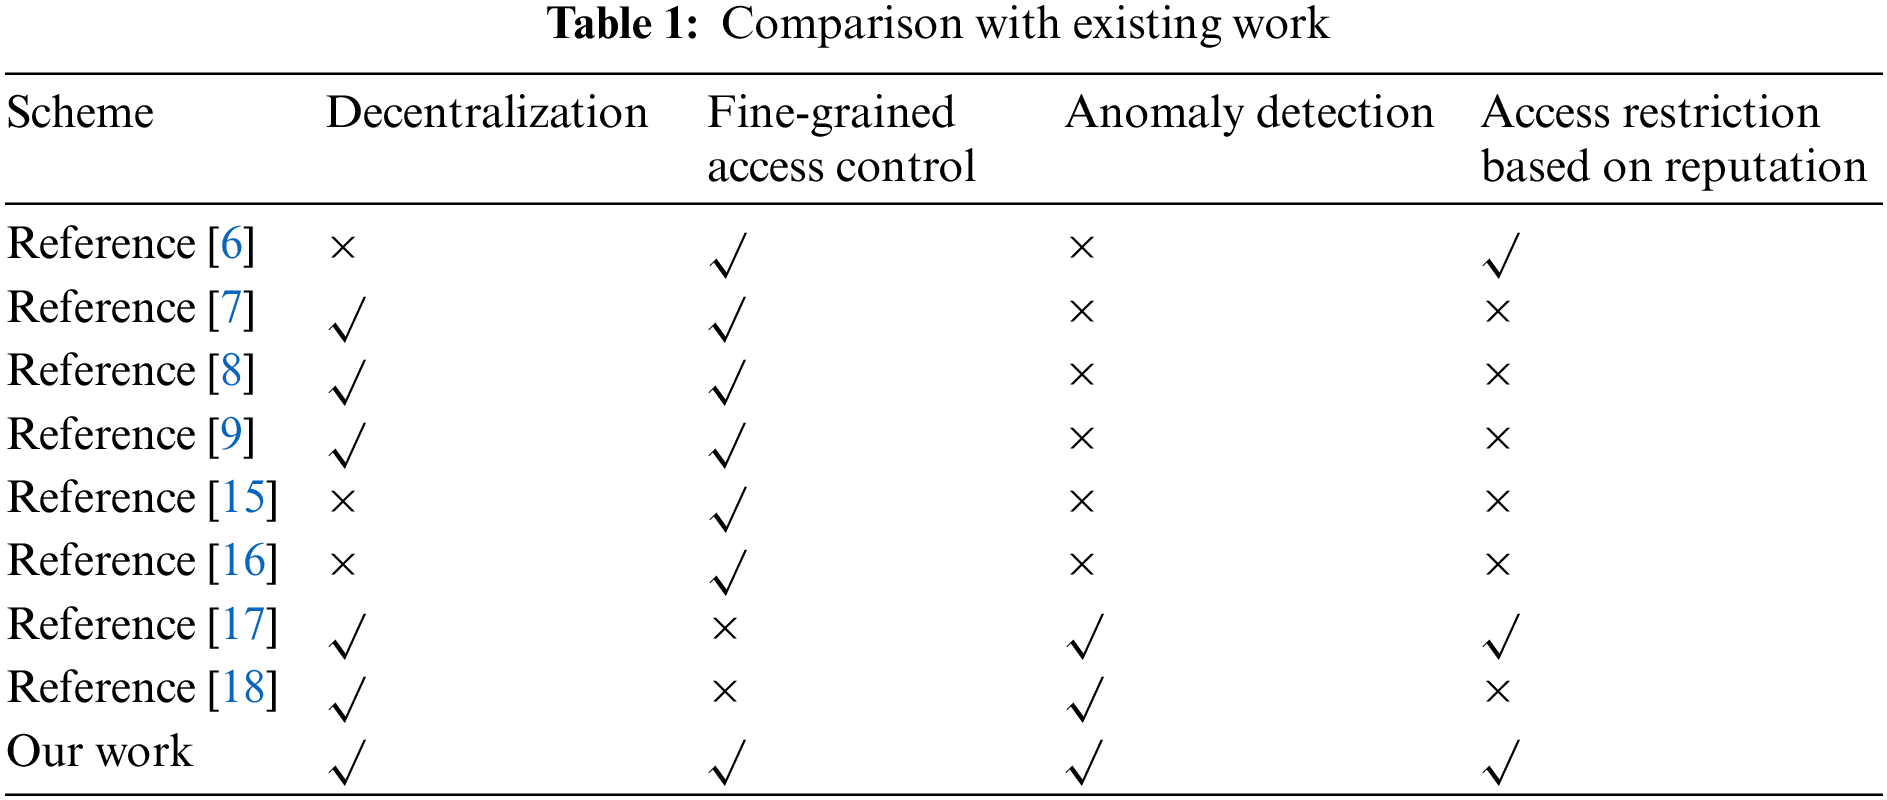
In our previous work [9], we designed a blockchain-based terminal access control system in SDN. The system utilized the ABAC model for fine-grained control. It used smart contract technology to implement the ABAC model, ensuring secure and reliable access control policies and terminal-related attributes. However, the system cannot detect abnormal situations of the devices and prevent deteriorating ones. To address this issue, in this paper, we propose a cloud-edge collaborative abnormal detection algorithm to detect device anomalies in real-time. Based on the detection results and reputation mechanism, the system will update the access control policy of the devices to restrict or revoke their access rights. A comparison between this work with existing works in access control mechanisms for SDN platforms is also provided in Table 1.
KPI anomaly detection is critical in various domains, such as network management, system performance monitoring, and business intelligence. The goal of KPI anomaly detection is to identify abnormal patterns or deviations from normal behaviour in the data, which can indicate potential issues or opportunities for improvement. There are several existing methods for KPI anomaly detection, including rule-based methods [19], statistical model-based methods [20], machine learning-based methods and deep learning-based methods [21].
Li et al. [21] proposed a fast clustering algorithm for long-time series, known as ROCKA, which was the first research to use clustering to reduce the cost of training for anomaly detection. This algorithm obtained an F1-score higher than 0.85 on real-world KPI datasets. Li et al. [22] applied conditional variational autoencoder (CVAE) to KPI anomaly detection for the first time and used dropout to avoid overfitting, achieving good anomaly detection performance. Wang et al. [23] developed a single-variable time series generation tool called TSAGen, which generates KPI data with abnormal and controllable features for KPI anomaly detection, solving the problem of inadequate common KPI datasets. Liu et al. [24] proposed an unsupervised reconstruction model named BeatGAN for detecting time-series anomalies, which can be combined with 1-d CNN and RNN. Experiments showed that BeatGAN achieved better detection accuracy on synthetic data and various real-time series. Zhang et al. [25] proposed a KPI anomaly detection method based on PU learning, which enhances anomaly detection accuracy by integrating clustering, PU learning, and semi-supervised learning, and proposes a new active learning method to avoid false alarms.
In summary, machine learning and deep learning methods do not require data to follow certain assumptions, nor does expert experience limit them. Thus, with the rise of intelligent operations, the method of KPI anomaly detection has gradually transitioned from traditional rule-based and statistical model-based methods to intelligent detection methods primarily based on machine learning and deep learning.
As shown in Fig. 1, the anomaly detection and access control system for cloud-edge collaboration networks consists of six roles: monitored devices, Edge-controller, cloud centre, permission management centre, blockchain, and SDN network equipment. Monitored devices and Edge-controller are deployed in the same subregion to provide real-time monitoring, data collection, and anomaly detection for IT devices and their hosted applications in the subregion. The attribute management centre and blockchain provide access control RestFul services based on the ABAC model. The Edge-controller implements access control for monitored devices by calling the smart contract service based on the device’s anomaly detection results. The cloud centre and Edge-controller complete the KPI anomaly detection through intelligent collaboration, i.e., the training task of the KPI anomaly detection model is completed by the cloud centre, and the model parameters are transmitted to the Edge-controller for anomaly detection.
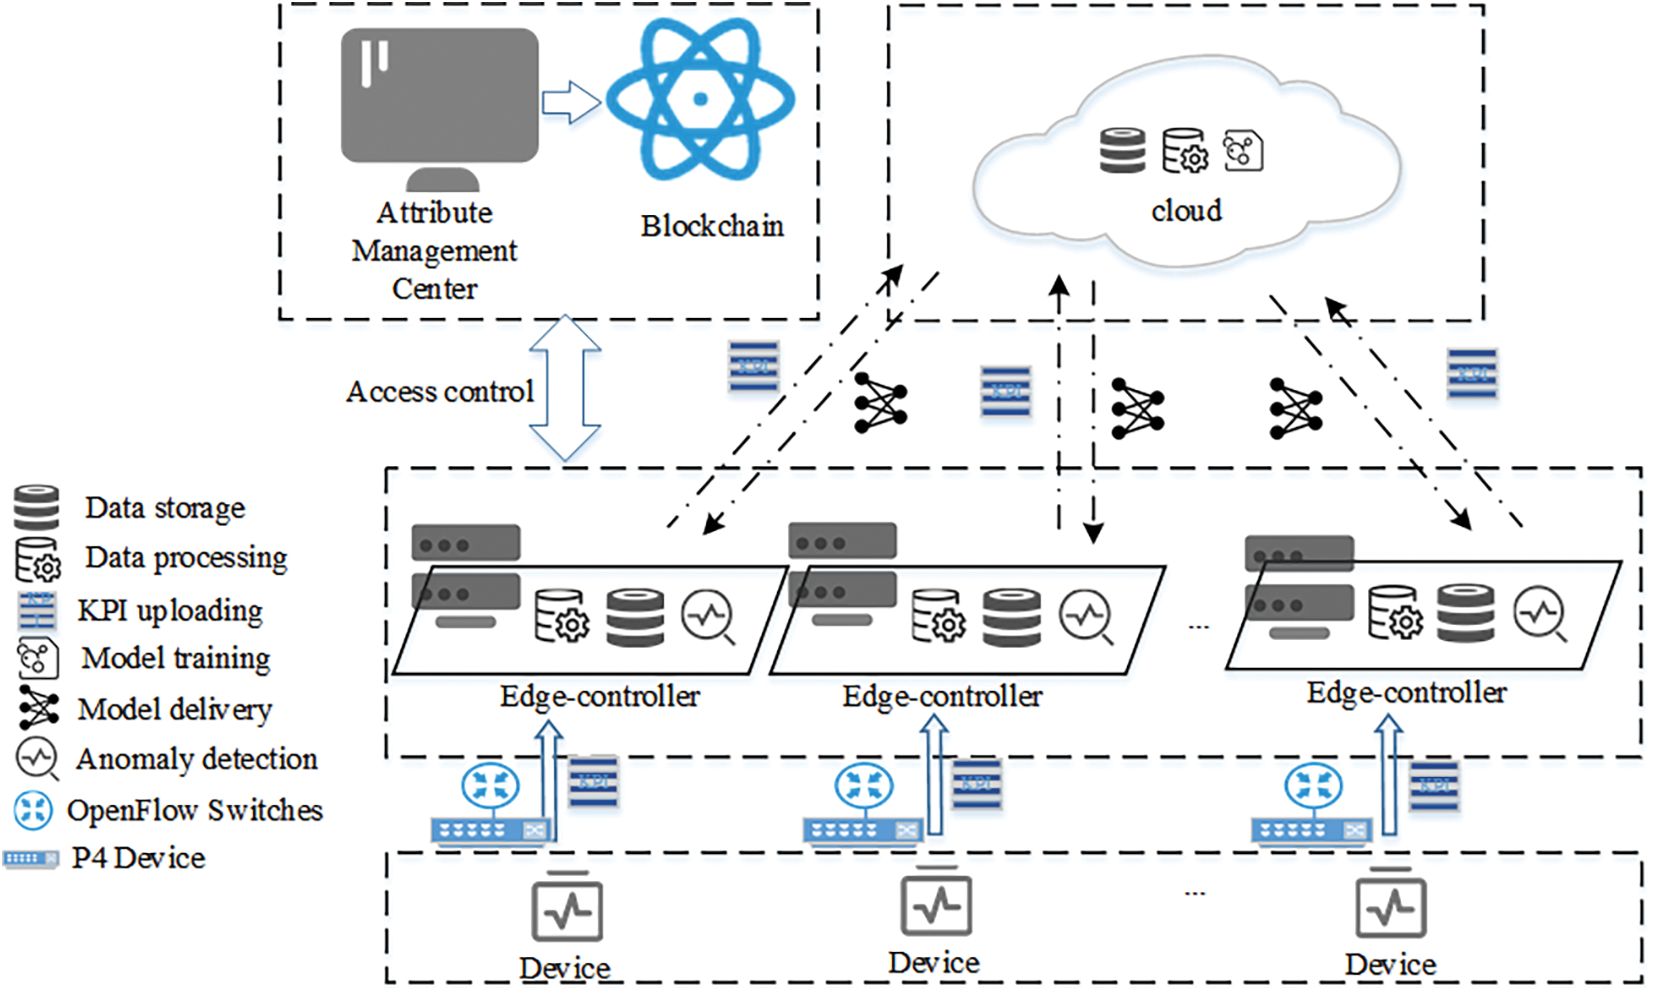
Figure 1: The architecture of anomaly detection and access control system
(1) Monitored device: The monitored device writes the required attribute set for the access request into the Options field of the IP packet and sends the packet to P4 to request access to the SDN network. Its operating status is monitored by monitoring tools, and real-time generated KPI data is collected and uploaded to the Edge-controller for further data processing and analysis.
(2) Edge-controller: Edge-controller is the core of the service architecture, which provides computing and storage capabilities at the data source as an extension and expansion of cloud computing capabilities. It is responsible for receiving data streams collected from monitored devices and providing real-time computing services such as access control, data storage, and anomaly detection. After loading the anomaly detection model parameters issued by the cloud-side nodes, the Edge-controller can directly perform anomaly detection. The Edge-controller receives IP packets from devices and parses the Options field value. Subsequently, it constructs the current device’s access request based on the parsing results. It submits the request to the blockchain access contract through the RestFul service to verify whether the terminal can access the network. The Edge-controller maintains a trust score list of monitored devices. When an abnormality is detected, the corresponding trust score of the device is reduced. The device will be restricted from accessing the network when the trust score is below the warning threshold.
(3) Cloud Centre: The Cloud Centre is mainly responsible for providing computing resources to solve computationally intensive tasks. As the KPI anomaly detection model is based on deep learning algorithms, the cloud centre utilizes its powerful computing capabilities to complete model training tasks and establish a corresponding library of anomaly detection models for different categories. It can issue corresponding model parameters to different edge-controllers based on different types of KPI sequences, assisting edge-controllers in completing anomaly detection tasks.
(4) Attribute Management Centre: The Attribute Management Centre (AMC) is responsible for managing the attribute set of the devices and batch submitting the attribute set to the blockchain.
(5) Blockchain: The blockchain is a distributed, immutable, and publicly accessible database. In this solution, the blockchain is used to build a trusted and decentralized access control model based on Attribute-Based Access Control (ABAC). A blockchain solution similar to the one described in [9] is used in our system. The blockchain functionality is integrated only into powerful SDN nodes such as controllers and the cloud centre. Since devices have limited capacity, they are usually not part of the blockchain network. Their controllers act as proxies to perform blockchain functions.
In our scheme, the ABAC model is implemented using smart contracts. This solution mainly uses three types of contracts: policy contracts, device contracts, and access contracts. The policy contract formulates access control policies and stores the policies on the blockchain. The device contract stores the attribute set submitted by the Attribute Management Centre in the blockchain state database and provides attribute support for access control policy formulation. The access contract judges whether a terminal can access SDN network resources.
(6) SDN Network Equipment: SDN network Equipment includes P4 and OpenFlow switches (referred to as OVS for simplicity below). P4 are mainly responsible for the fast pre-processing of data packets. They check whether the Token carried by the data packet is correct and implement fast access based on the query result. When devices send the data packets without a token, P4 parses the IHL field of the IP packet and filters the packet if the value of IHL is not greater than 0x05.
OVS encapsulates the data packets forwarded by P4 into Packet_in messages, forwards them to the controller, and performs normal packet forwarding based on the flow table issued by the controller.
4 KPI Anomaly Detection Method Based on GRU-GAN for Cloud-Edge Collaboration
The cloud-edge collaboration networks architecture divides the network into sub-regions, each managed by its corresponding edge-controllers. The KPI anomaly detection task is divided, and the model training task is placed in the cloud centre while each Edge-controller executes the anomaly detection. Data generated by each sub-region only flows between the device and the Edge-controller, ensuring data security while also taking advantage of the edge-controllers to share the computation pressure of the cloud centre. Upon completion of the anomaly detection model training, the cloud centre will only transmit encrypted model parameters, which the edge-controller will then decrypt and load. To facilitate the explanation, we simplify the anomaly detection process to a scenario with a cloud centre, an edge-controller, and a monitored device.
Training stage: The monitored device transfers the collected KPI data to the edge-controller and then forwards it to the cloud centre, where the cloud node completes the model training in the initial stage.
Detection stage: The edge-controller receives the model parameters issued by the cloud centre, completes the model loading, and then performs real-time anomaly detection on the KPI data collected from the monitored device. The KPI anomaly detection process based on cloud-edge collaboration is shown in Fig. 2.

Figure 2: KPI anomaly detection process for cloud-edge collaboration
Due to occasional errors, the data collection process has issues with data missing and data redundancy. To improve the detection effect of the KPI abnormal detection model, it is necessary to pre-process the collected KPI data and further improve the data quality.
If the same KPI value appears multiple times simultaneously, redundant data will be directly deleted to ensure that the KPI value and timestamp correspond one-to-one. For missing data, as KPI is a time series data, in order to protect the time series characteristics of KPI, this paper adopts a linear interpolation method to fill in the missing values. According to the KPI values
Besides, as many kinds of collected KPI sequences have different lengths and magnitudes, this paper completes KPI data standardization based on the Z-score method to ensure the model’s detection effect. The equation for Z-score is shown below:
4.2 Model Construction of GRU-GAN
The GAN network has the ability to generate approximate real sample data, and the GRU can capture the regularity of time series data. Therefore, we construct a GRU-GAN hybrid model for KPI anomaly detection. This section provides a detailed description of the model and network structure of GRU-GAN.
GAN networks have two models, the generator model and the discriminator model. After data pre-processing, the KPI sequence is divided into multiple time windows and inputted into the discriminator model along with fake samples generated by the generator model based on noise vectors.
The discriminator model judges the input samples as true or false and gives feedback. Both models optimize their parameters through backpropagation. GRU networks perform well when dealing with sequential data due to their simple structure and fewer parameters. For time-series data like KPI, using GRU networks as both the generator and discriminator in a GAN can better capture the data’s characteristics and correlations, thus improving the quality of the generated fake samples. The overall architecture of the model is shown in Fig. 3.

Figure 3: The GRU-GAN model structure
The network structure of the generator model includes an input layer, a GRU network layer, and a fully connected layer. The GRU network layer has four GRU units, and the fully connected layer chooses the Tanh function as the activation function. The expression of the Tanh function is as follows:
The network structure of the discriminator model also includes an input layer, a GRU network layer, and a fully connected layer. Unlike the generator model, the discriminator model’s GRU network only has two GRU unit layers. The discriminator model is a binary classifier used to identify whether the input sample is a real sample from the real world or a fake sample generated by the generator model. The discriminator model uses the Sigmoid function as the activation function and finally outputs the probability of true or false samples. The range of the Sigmoid function output is [0,1], which is commonly used in binary classification problems, and the expression of the function is as follows:
4.3 KPI Anomaly Detection Method Based on GRU-GAN
The KPI anomaly detection method based on the GRU-GAN model trains the model based on normal KPI sequences. The generator model generates fake samples by obtaining a random noise vector from the latent space and updates the parameters through alternating training with the discriminator model. After a training period, competition between the generator and discriminator models improves their knowledge and ability. The data distribution of the generated samples gradually approaches the real samples, and the discriminator model becomes difficult to recognize the authenticity of the samples. The training ends when the output probability of true and false is close to 0.5. In the anomaly detection phase, the abnormal score of each time window is calculated by the reconstruction error of the generator model and the discrimination loss of the discriminator model. The detection threshold is calculated based on the set of abnormal scores, and the anomaly judgment is made based on comparing the abnormal score and the detection threshold.
In GAN, both the generator and discriminator models attempt to optimize the competitive objective function during training, and the optimization process of GAN is a “minimax two-player game” problem. The objective function optimizes both the generator and discriminator models, and the overall objective is to make
In conclusion, the generator model aims for a smaller loss in the objective function, while the discriminator model aims for a larger loss. The training process of the GRU-GAN hybrid model is as follows:
(1) Set the number of training rounds to n, and set the label of the real sample to 1 and the label of the fake sample to 0.
(2) Given a real KPI sequence
(3) Fix the generator model and train the discriminator model. First, input the real sample
(4) Fix the discriminator model and train the generator model—input random noise
(5) Repeat steps (3) and (4) until reaching the training iteration n.
(6) After n iterations of training, the generator and discriminator models gradually become stable and cannot improve further, and the training is completed.
In the anomaly detection stage, the test KPI sequence is divided into multiple time windows and input into the trained GRU-GAN hybrid model. The difference between the generated KPI sequence and the input real KPI sequence generated by the generation model contains reconstruction error and discrimination loss, which forms the anomaly score as the basis for determining KPI anomalies. When the anomaly score exceeds the detection threshold, it is considered an abnormal window.
(1) Reconstruction error. For the KPI sequence in the t-th time window
(2) Discriminator loss. The discriminator loss
(3) anomaly detection. Each time window’s anomaly score
Define the set of anomaly scores
The anomaly score of each time window is calculated and compared with the detection threshold to determine whether the current time window is abnormal. The current time window is abnormal if the anomaly score exceeds the threshold. Otherwise, it is a normal window.
4.4 Model Update Strategy Based on Cloud-Edge Collaboration
To ensure the detection performance and robustness of the KPI anomaly detection model and to be able to perform anomaly detection on newly collected KPI sequences promptly, we design a cloud-edge collaborative model update strategy. The proposed model update strategy includes two modes:
(1) Timed model update: The model is updated by setting an update cycle. When an update cycle is reached, the edge-controller packages the KPI data generated during the cycle and sends it to the cloud centre. When the cloud centre receives the new KPI data, it re-trains the anomaly detection model to obtain new model weight parameters. The new model weight parameters are transmitted to the edge-controller and loaded as a new anomaly detection model. The timed update mechanism ensures the robustness of the KPI anomaly detection model, enabling more accurate anomaly detection.
(2) Model library update: We establish a KPI anomaly detection model library to detect multiple KPI sequences. However, the anomaly detection models stored in the model library can only detect existing KPIs. If a new KPI is added, the anomaly detection model corresponding to the new KPI is not stored in the model library, so the model library needs to be updated promptly. The data is transmitted to the edge-controller when the monitored device collects the corresponding new KPI. The edge-controller encrypts and transmits the data to the cloud centre. An abnormal detection model is trained for the new KPI sequence, and the new model is transmitted to the edge-controller to complete the model library update.
This section gives the detailed working procedure of the access control. It mainly includes the following parts. Access control mechanism based on ABAC model and blockchain, and access restriction mechanism based on anomaly detection and reputation value.
5.1 Access Control Method Based on ABAC Model and Blockchain
(1) The device must submit its attributes to the attribute management centre before accessing the network. The attribute management centre calls the device contract to store the device’s attribute information on the blockchain.
(2) The system administrator calls the policy contract to generate an access control policy (ACP) for devices that apply to access the SDN network. During the process of generating the access control policy, the corresponding Token for the device will be generated, and the Token value will be encrypted based on the relevant attributes in the access control policy. The system administrator can update and revoke the ACP through the RestFul service of the policy contract.
(1) The device adds the set of attributes to the Options field of the IP packet and sends the packet to P4.
(2) P4 parses the packet and filters out packets that do not have Options based on the value of the IHL field. Packets carrying Options are forwarded to OVS.
(3) OVS encapsulates the packet carrying Options in the Packet_in message and forwards it to the edge-controller.
(4) The edge-controller parses the Packet_in message to obtain the set of attributes in the Options field. The edge-controller generates the device authentication request (AAR) based on attributes and calls the access contract.
(5) According to the ACP, the access contract verifies the validity of the AAR. If the AAR meets the ACP requirements, the access contract returns the response status code “1” to the edge-controller. Otherwise, “0” is returned. When the edge-controller receives the status code “1”, it issues a flow table to OVS to allow the device to access the network. The edge-controller sends the Token to the device. The key-value pair (DeviceID, Token) is stored in the edge-controller’s cache database (CB) and on the blockchain, keeping both in real-time synchronization.
(6) The device adds the Token to the Options field of the IP packet and sends the packet to the SDN network. P4 executes the to_cpu action to mirror the packet to the P4 control plane. The P4 control plane parses the Options to obtain the Token and queries the CB for the Token value. Suppose the Token exists and is within the validity period. In that case, the P4 control plane implements a function similar to the Packet_in message to issue a flow table to OVS, and the device can join the SDN network normally. Otherwise, the IP packet carrying Options is resent to the edge-controller.
5.2 Access Restriction Mechanism Based on Anomaly Detection and Reputation Value
When a device is successfully authenticated and connected to the network, the edge-controller generates a reputation management list for the authenticated devices in the region and updates the reputation value in real time based on the KPI anomaly detection results. When the device operates normally, its reputation value increases over time and eventually stabilizes at a stable value, such as 100. On the contrary, when the device experiences anomalies, that is, the result of the KPI anomaly detection algorithm is abnormal, the reputation value of the device will decrease. In reality, a large number of KPI abnormal alarms on a device may indicate that the device is likely to fail or be maliciously controlled by an attacker, leading to many network resources being occupied and affecting the system’s robustness. Therefore, we need to punish abnormal devices. We propose a strategy: the edge-controller implements various measures based on the reputation value of the vehicle. For example, when a device is continuously detected as abnormal, its reputation value will rapidly drop below the warning threshold. Then the edge-controller will take action to restrict access to the device.
Before presenting the detailed design of the device management mechanism based on reputation values, we ignore the device’s behaviour—malfunctioning or being invaded—and only deal with it based on the results of the device’s KPI detection. Therefore, the reputation
where
where
Assuming the set of KPIs that
where
Depending on the reputation value of the devices, we can divide them into three categories. Take device
Normal device:
Suspicious device:
Abnormal device:
This section introduces the datasets, detection algorithms, and evaluation metrics used in the experiments. Then we evaluate and analyze the performance of the KPI anomaly detection method based on the GRU-GAN hybrid model on various datasets and the influence of the time window on the KPI anomaly detection effect. Finally, we analyze the positive impact of the access control method using anomaly detection on the system.
We build the simulated SDN network based on Mininet [26], where the cloud centre is a high-performance GPU server, and the edge-controllers and monitored devices are ordinary desktops. Floodlight is introduced as the SDN edge-controllers. Fabric [27] node is combined with each edge-controller to provide blockchain functions.
This paper evaluates the proposed method using the NAB, AIOps Challenge, and Zabbix self-collected datasets. NAB and AIOps challenge (referred to as AIOps for simplicity in the rest of this section) are open anomaly detection datasets, where NAB contains synthetic and real-world data, while AIOps only contains real-world data collected from different IT companies. The Zabbix dataset contains real-world data collected using the Zabbix client.
We used three representative detection algorithms in the experiment: ARMA [12], LSTM [13], and TAnoGAN [14]. ARMA is a traditional statistical method in time series anomaly detection, which combines autoregressive models (AR models) and moving average models (MA models). LSTM is commonly used for processing and analyzing text, sequences and other data types, and it implements time series anomaly detection based on prediction methods. TAnoGAN is an unsupervised anomaly detection method based on GAN, used for detecting anomalies in time series when only a small amount of data is available. For detailed descriptions of these algorithms, please refer to the relevant papers [12–14].
In this paper, Precision, Recall, and F1-score are used as evaluation metrics to assess the performance of the GRU-GAN model in the KPI anomaly detection task. Precision, Recall, and F1-score definitions can be found in [13].
6.2 Analysis of Anomaly Detection Performance on Different Datasets
As shown in Table 1, on the three datasets of NAB, the LSTM model achieved 100% precision, but the recall was relatively low, indicating that the KPI anomalies detected by the LSTM model were generally accurate, but a considerable proportion of anomaly sequences may have been missed, resulting in a low F1 score. ARMA algorithm, as a traditional time series anomaly detection method, achieved 100% recall on all three datasets, but it had very low precision, resulting in a low F1 score. This indicates that the ARMA algorithm can detect anomalies well, but there are also detection errors, where a large number of normal situations are incorrectly detected as anomalies, resulting in a large number of false alarms. Its performance in the KPI anomaly detection task is unsatisfactory and may cause alarm storms if applied in practical scenarios.
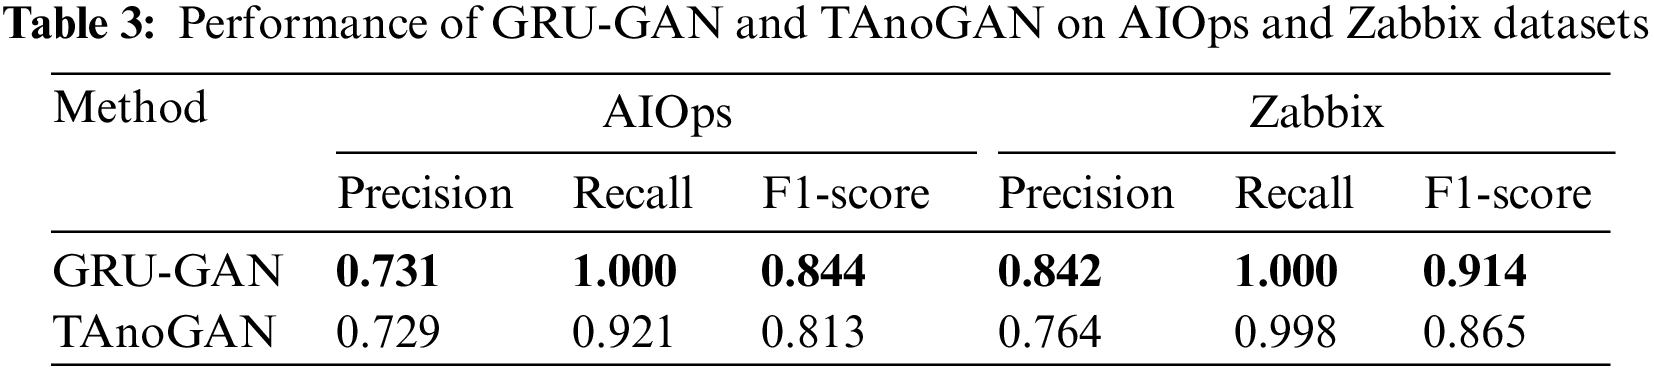
As shown in Tables 2 and 3, the detection performance of the TAnoGAN model is lower than our method on all five datasets. The reason may be that the threshold set by TAnoGAN is a fixed value of 12.2, which cannot adapt to the changing degrees of different types of KPIs. Therefore, this method performs well in the ambient temperature dataset and the machine temperature dataset but relatively poorly in the ec2_cpu_utilizatio__825cc2 dataset. In contrast, our method does not use a fixed threshold during the anomaly detection phase like TAnoGAN. Instead, it automatically calculates different detection thresholds based on different KPI sequences and determines anomalies based on the relationship between the anomaly score and the detection threshold for each window. This approach has better adaptability for KPIs with variable data characteristics, thus achieving the best anomaly detection performance on all datasets.
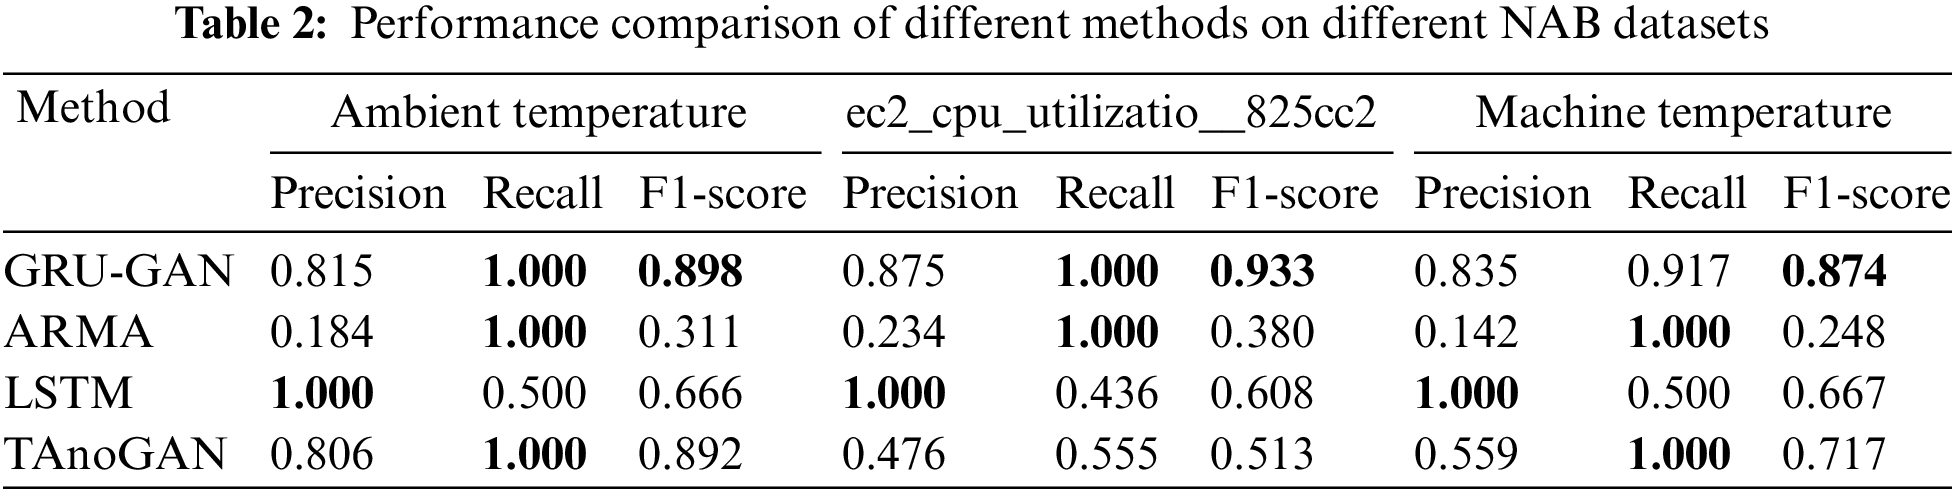
Compared to other methods, the KPI anomaly detection method based on the GRU-GAN hybrid model proposed in this paper achieved nearly 100% recall on the NAB dataset, indicating that almost all KPI anomalies were detected by our method with little or no real anomalies missed. At the same time, it also achieved relatively high precision, which means fewer false positive anomalies. The good performance in precision and recall enabled the KPI anomaly detection method based on the GRU-GAN hybrid model to obtain the highest F1 score on all datasets. Therefore, our proposed method demonstrated better anomaly detection performance than the other methods.
6.3 Effect of Different Lengths of Time Windows
Considering that different time window lengths may affect anomaly detection performance differently, we divided the time windows into different lengths to observe changes in model detection performance. Specifically, we observed the F1 scores achieved by the GRU-GAN model with different time window lengths on three datasets. From Fig. 4, it can be seen that different time window lengths have a certain impact on the detection performance of the GRU-GAN model in KPI anomaly detection tasks. We conducted nine experiments, setting time window lengths from 10 to 90. The experiments showed that if the time window length is set too small, the model is difficult to capture the data patterns of the KPI sequence, while if it is set too large, it is easy to overlook anomalies in the KPI sequence. Too-large and too-small time window lengths will result in lower anomaly detection performance. Our experiments achieved the best F1 scores when the time window length was set to 60 on all three datasets, indicating the best detection performance.

Figure 4: Effect of different lengths of time windows
6.4 Performance of the Access Restriction Management Mechanism Based on Reputation Value
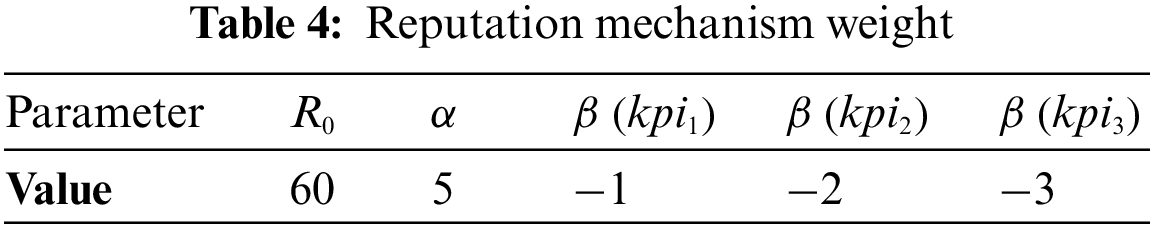
The experimental parameter settings are shown in Table 4. We set the punishment factor
As shown in Fig. 5a, starting from

Figure 5: Reputation value changes according to the anomaly detection results. (a) Normal device. (b) The device becomes an abnormal one
As shown in Fig. 5b, initially,
A reputation-based access restriction policy can effectively reduce the number of malicious devices attacking the network. As shown in Fig. 6, we assume that the device’s

Figure 6: The impact of access restriction strategies on the number of anomaly behaviours of devices
Ensuring secure access and control of devices in SDN networks is vital to prevent security risks and vulnerabilities, such as data breaches and network attacks, which can result from unauthorized terminal access. Additionally, timely detection of KPI anomalies, particularly those caused by intrusions, is critical to preventing significant damage to the network. To address the above issues, this paper proposes a system architecture for anomaly detection and access control in a cloud-edge collaborative SDN network. The system uses the ABAC model to achieve fine-grained control over device access. In order to ensure the security of the access control policies, smart contract technology is utilized to implement the ABAC model. In order to capture the time correlation between KPI sequences, this paper proposes a KPI anomaly detection method based on a GRU-GAN hybrid model, which uses GRU as both the generator and discriminator model for GAN. A cloud-edge collaborative model updating strategy is proposed to enhance further the robustness of KPI anomaly detection models in cloud-edge environments. Finally, based on the abnormal detection results of the devices, a reputation-based access restriction mechanism is designed in this paper. The reputation value of the device decreases as the number of abnormal occurrences increases. When the reputation value falls below a warning threshold, the system will update the device’s access control policy, restricting or revoking its access permissions. The experimental results show that the proposed anomaly detection algorithm in this paper exhibits superior performance on multiple datasets. The access control method can effectively reduce the number of network attacks, providing a secure and controllable access environment for SDN networks.
Funding Statement: This work was supported in part by the National Natural Science Foundation of China under Grant 62162018 and Grant 61861013, in part by the Innovation Research Team Project of Guangxi Natural Science Foundation 2019GXNSFGA245004.
Conflicts of Interest: The authors declare that they have no conflicts of interest to report regarding the present study.
References
1. S. Garg, K. Kaur, G. Kaddoum and S. Guo, “SDN-NFV-aided edge-cloud interplay for 5G-envisioned energy internet ecosystem,” IEEE Network, vol. 35, no. 1, pp. 356–364, 2021. [Google Scholar]
2. X. Li, D. Li, J. Wan, C. Liu and M. Imran, “Adaptive transmission optimization in SDN-based industrial internet of things with edge computing,” IEEE Internet of Things Journal, vol. 5, no. 3, pp. 1351–1360, 2018. [Google Scholar]
3. P. Ranaweera, A. D. Jurcut and M. Liyanage, “Survey on multi-Access edge computing security and privacy,” IEEE Communications Surveys & Tutorials, vol. 23, no. 2, pp. 1078–1124, 2021. [Google Scholar]
4. G. Logeswari, S. Bose and T. Anitha, “An intrusion detection system for SDN using machine learning,” Intelligent Automation & Soft Computing, vol. 35, no. 1, pp. 867–880, 2023. [Google Scholar]
5. A. Al-Alaj, R. Krishnan and R. Sandhu, “ParaSDN: An access control model for SDN applications based on parameterized roles and permissions,” in Proc. of 6th Int. Conf. on Collaboration and Internet Computing (CIC), Atlanta, GA, USA, pp. 107–116, 2020. [Google Scholar]
6. N. Kammoun, R. Abbasi, E. F. S. Guemara and M. Mosbah, “A New SDN architecture based on trust management and access control for IoT,” in Workshops of the Int. Conf. on Advanced Information Networking and Applications (WAINA), Caserta, Italy, pp. 245–254, 2020. [Google Scholar]
7. D. Chattaraj, B. Bera, A. K. Das, J. J. P. C. Rodrigues and Y. Park, “Designing fine-grained access control for software-defined networks using private blockchain,” IEEE Internet of Things Journal, vol. 9, no. 2, pp. 1542–1559, 2022. [Google Scholar]
8. P. T. Duy, H. H. Do and A. G. T. Nguyen, “B-DAC: A decentralized access control framework on Northbound interface for securing SDN using blockchain,” Journal of Information Security and Applications, vol. 64, no. 2, pp. 1–19, 2022. [Google Scholar]
9. B. Jiang, Q. He, Q. Pan and M. He, “Blockchain-based terminal access control in software-defined network,” in Proc. of 6th Int. Symp. on Mobile Internet Security (MobiSec22), Jeju Island, Republic of Korea, 2022. [Google Scholar]
10. S. He, Z. Li, J. Wang and N. N. Xiong, “Intelligent detection for key performance indicators in industrial-based cyber-physical systems,” IEEE Transactions on Industrial Informatics, vol. 17, no. 8, pp. 5799–5809, 2021. [Google Scholar]
11. K. Giotis, C. Argyropoulos, G. Androulidakis, D. Kalogeras and V. Maglaris, “Combining OpenFlow and sFlow for an effective and scalable anomaly detection and mitigation mechanism on SDN environments,” Computer Network, vol. 62, no. 5, pp. 122–136, 2014. [Google Scholar]
12. Y. Wang, D. Wang and Y. Tang, “Clustered hybrid wind power prediction model based on ARMA, PSO-SVM, and clustering methods,” IEEE Access, vol. 8, pp. 17071–17079, 2020. [Google Scholar]
13. M. A. Bashar, R. Nayak and N. Suzor, “Regularising LSTM classifier by transfer learning for detecting misogynistic tweets with small training set,” Knowledge and Information Systems, vol. 62, no. 10, pp. 4029–4054, 2020. [Google Scholar]
14. M. A. Bashar and R. Nayak, “TAnoGAN: Time series anomaly detection with generative adversarial networks,” in IEEE Symp. Series on Computational Intelligence (SSCI), Canberra, Australia, ACT, pp. 1778–1785, 2020. [Google Scholar]
15. D. M. F. Mattos and O. C. M. B. Duarte, “AuthFlow: Authentication and access control mechanism for software defined networking,” Annals of Telecommunications, vol. 71, no. 11–12, pp. 607–615, 2016. [Google Scholar]
16. S. Shin, Y. Song, T. Lee, S. Lee, J. Chung et al., “Rosemary: A robust, secure, and high performance network operating system,” in Proc. 21st ACM SIGSAC Conf. on Computer and Communications Security, Scottsdale, AZ, USA, pp. 78–89, 2014. [Google Scholar]
17. H. Zhou, X. Jia, J. Shu and L. Zhou, “CoWatch: Collaborative prediction of DDoS attacks in edge computing with distributed SDN,” in IEEE Global Communications Conf. (GLOBECOM), Madrid, Spain, pp. 1–6, 2021. [Google Scholar]
18. L. Zhou, J. Shu and X. Jia, “Collaborative anomaly detection in distributed SDN,” in IEEE Global Communications Conf. (GLOBECOM), Taipei, Taiwan, pp. 1–6, 2020. [Google Scholar]
19. N. Duffield, P. Haffner, B. Krishnamurthy and H. Ringberg, “Rule-based anomaly detection on IP flows,” in IEEE INFOCOM, Rio de Janeiro, Brazil, pp. 424–432, 2009. [Google Scholar]
20. E. H. M. Pena, M. V. O. de Assis and M. L. Proença, “Anomaly detection using forecasting methods ARIMA and HWDS,” in Proc. of 32nd Int. Conf. of the Chilean Computer Science Society (SCCC), Temuco, Chile, pp. 63–66, 2013. [Google Scholar]
21. Z. Li, Y. Zhao, R. Liu and D. Pei, “Robust and rapid clustering of KPIs for large-scale anomaly detection,” in Proc. IEEE/ACM 26th Int. Symp. on Quality of Service (IWQoS), Banff, AB, Canada, pp. 1–10, 2018. [Google Scholar]
22. Z. Li, W. Chen and D. Pei, “Robust and unsupervised KPI anomaly detection based on conditional variational autoencoder,” in Proc. of 37th Int. Performance Computing and Communications Conf. (IPCCC), Orlando, FL, USA, pp. 1–9, 2018. [Google Scholar]
23. C. Wang, K. Wu, T. Zhou, G. Yu and Z. Cai, “TSAGen: Synthetic time series generation for KPI anomaly detection,” IEEE Transactions on Network and Service Management, vol. 19, no. 1, pp. 130–145, 2022. [Google Scholar]
24. S. Liu, B. Zhou, Q. Ding, B. Hooi, Z. Zhang et al., “Time series anomaly detection with adversarial reconstruction networks,” IEEE Transactions on Knowledge and Data Engineering, Early Access, 2022. https://doi.org/10.1109/TKDE.2021.3140058 [Google Scholar] [CrossRef]
25. S. Zhang, C. Zhao, Y. Sui, Y. Su, Y. Sun et al., “Robust KPI anomaly detection for large-scale software services with partial labels,” in Proc. of 32nd Int. Symp. on Software Reliability Engineering (ISSRE), Wuhan, China, pp. 103–114, 2021. [Google Scholar]
26. R. L. S. D. Oliveira, C. M. Schweitzer, A. A. Shinoda and L. R. Prete, “Using mininet for emulation and prototyping software-defined networks,” in Proc. Colombian Conf. on Communications and Computing (COLCOM), Bogota, Colombia, pp. 1–6, 2014. [Google Scholar]
27. E. Androulaki, A. Barger, V. Bortnikov, C. Cachin, K. Christidis et al., “Hyperledger fabric: A distributed operating system for permissioned blockchains,” in Proc. of the 13th EuroSys Conf., Porto, Portugal, pp. 1–15, 2018. [Google Scholar]
Cite This Article
 Copyright © 2023 The Author(s). Published by Tech Science Press.
This work is licensed under a Creative Commons Attribution 4.0 International License , which permits unrestricted use, distribution, and reproduction in any medium, provided the original work is properly cited.
 Downloads
 Citation Tools