
 Submit a Paper
 Propose a Special lssue
 Open Access
ARTICLE
Design of a Multi-Stage Ensemble Model for Thyroid Prediction Using Learning Approaches
Department of Computer Science and Engineering, Faculty of Engineering, Karpagam Academy of Higher Education, Coimbatore, Tamil Nadu, India
* Corresponding Author: M. L. Maruthi Prasad. Email:
Intelligent Automation & Soft Computing 2024, 39(1), 1-13. https://doi.org/10.32604/iasc.2023.036628
Received 07 October 2022; Accepted 13 December 2022; Issue published 29 March 2024
 View Full Text
 Download PDF
Abstract
This research concentrates to model an efficient thyroid prediction approach, which is considered a baseline for significant problems faced by the women community. The major research problem is the lack of automated model to attain earlier prediction. Some existing model fails to give better prediction accuracy. Here, a novel clinical decision support system is framed to make the proper decision during a time of complexity. Multiple stages are followed in the proposed framework, which plays a substantial role in thyroid prediction. These steps include i) data acquisition, ii) outlier prediction, and iii) multi-stage weight-based ensemble learning process (MS-WEL). The weighted analysis of the base classifier and other classifier models helps bridge the gap encountered in one single classifier model. Various classifiers are merged to handle the issues identified in others and intend to enhance the prediction rate. The proposed model provides superior outcomes and gives good quality prediction rate. The simulation is done in the MATLAB 2020a environment and establishes a better trade-off than various existing approaches. The model gives a prediction accuracy of 97.28% accuracy compared to other models and shows a better trade than others.Keywords
Hypothyroidism, a butterfly-shaped neuroendocrine gland, regulates pulse rate, blood volume, and temperature in humans [1]. Since the diagnosis of malignancy, lung nodules have steadily grown over the last 50 years [2], and this vital organ has received much attention across the country. According to reports, thyroid illness afflicted more than 300 million citizens in 2018 [3], and the figure is continuously climbing today. Disease, the most often observed condition in men aged 30 to 39, was much more common in female categories, with four times the chances of diagnosing than males [4]. Because pancreatic illness is becoming more common, the diagnosis technique in pharmacies has not changed during the twentieth century [5]. Thyroid illness is classified as operational or malignant, and it is detected using traditional processes. A thyroid function test is necessary (i.e., hypothyroidism and hyperthyroidism). The thyroid gland produces two primary hormones: triiodothyronine (T3) and thyroxine (T4) [6]. The thyroid function assessment includes T3 and T4, free T3 (FT3) and free T4 (FT4), as well as thyroid-stimulating hormones (TSH), which are used to detect levothyroxine and hypertension [7]. Researchers distinguish thyroid tumours into normal and malignant types for thyroid neoplasm illness (cancerous cells). The early diagnosis of aberrant lung nodules can help avoid cancer and reduce the prevalence of chronic. Sonography, such as magnetic resonance imaging (MRI), computerized tomography (CT), radio-iodine scintigraphy, positron emission tomography (PET) scans, and ultrasound pictures, are commonly used to aid in thyroid diagnostic techniques [8]. Nevertheless, radiology is insufficient to distinguish malignant from benign tumours, necessitating fine-needle aspiration cytology (FNAC) [9,10].
Computer-aided diagnosis (CAD) techniques, which use data mining algorithms, and profound possible improvements to detect, diagnose, and cure disease, have been widely used in the clinical area [11,12]. Identifying levothyroxine and hyperactivity uses a wide variety of statistical and machine learning classification models, such as k-nearest neighbour [13], regression methods, and logistic regression, to mention a few. Conversely, deep learning models were frequently used in computed tomography to diagnose suspicious lesions. Researchers have generally focused on using ultrasound imaging to improve hypothyroidism illness diagnosis prediction performance. Generally, the classification tasks for detecting malignant thyroid cancer using sonograms achieved estimation accuracy ranging from 72% to 92%, outperforming untrained models. Ultrasound images, however, have limits since they are prone to noise and mottling. Ultrasound images are used to categorize specific complex nodules based on a single imaging method used to define diagnostic risk stratification insufficiently, resulting in ineffective therapeutic adoption agencies. The objective of the work is to predict thyroid using a novel machine learning approaches that intends to address the prediction challenge encountered in the prevailing approaches. The major research gap is the lack of proper automated tool for prediction with reduced execution time. This research concentrates on modelling an efficient clinical decision support system for thyroid prediction using ensemble learning where the weights of the classifier are optimized and attains a better prediction rate.
The remainder of the work is structured as follows: Section 2 analyses existing approaches and issues; Section 3 elaborates on the proposed cascaded random vector network methodology. The numerical outcomes of the anticipated model are provided in Section 4, followed by the research summary in Section 5.
Thyroid diseases still exist in operational (hypothyroidism, hypertension, and thyroiditis) and neoplastic (goitre, adenoma and four forms of malignancy thyroid nodules). Papillary adenocarcinoma, follicular melanoma, anaplastic carcinoma, and medullary carcinoma are the four malignant forms of nodules that result in malignant tumours [14]. In recent decades, many studies have used CAD techniques to identify hypothyroidism illness, and this article summarises the findings and describes the research needs.
According to earlier research, binary classifier problems were the most commonly completed. Neural network models have been used often in these researches to categorize hypothyroidism and hyperthyroidism. For example, by integrating linear discriminant analysis (LDA), k-nearest neighbours (KNN), and adaptive neuro-fuzzy learning algorithm, reference [15] suggested a hybrid decision-making support system for detecting thyroid problems, with a performance of 98.5 percent. In [16], the authors also utilized LDA, and his investigations revealed that the hyperthyroidism and hyperactivity classification provides performance rates of 99.62 percent and 99.62 percent, respectively. Support vector machine (SVM), Random Forest (RF) and KNN were also used independently, with the RF technique achieving 98.5 percent accuracy rates [17]. In comparison to identifying thyroid disorders, detecting illness is challenging for researchers. Due to a rise in thyroid cancer cases, distinguishing thyroid cancer as malignancy is a challenging study topic. Several studies have used machine learning algorithms to extract multiple elements from ultrasound images to identify stomach cancer. Nodule size, vascularity, micro-calcifications, border, form, contouring, and neovascularization are the most typically encountered parameters used to categorize thyroid cancer on images obtained [18]. SVM, KNN, LDA, and other machine learning-based have also been shown to be helpful in the detection of malignant tumours.
Deep learning has become a hot topic in machine learning during the last several years. Learning algorithms have resulted in very high diagnostic accuracy for thyroid illness identification. Meanwhile, deep learning can proactively choose characteristics from inputs, resulting in improved diagnostics performance and speed. Since the introduction of deep neural networks, image categorization implements the logic domain that has already been widely used in industrial industries, such as education, commerce, and, most crucially, medicine. Furthermore, deep learning models provide a novel approach to categorization that several researchers have used to identify an array of disorders, including breast cancer [19], melanoma sickness [20], and lung cancer. These two used most often, and effective deep learning techniques for categorizing thyroid cancer are artificial neural networks (ANN) and convolutional neural networks (CNN). Previous research suggests that ANNs can accurately identify either “benign” or “malignant” hypothyroidism, with an overall accuracy of roughly 82%.
Although several experiments have identified malignant thyroid cancer, a recommender of these techniques has yet to emerge due to their limitations. Previous research can assist doctors in distinguishing malignant multinodular to a large extent, but most approaches require time to categorize tumours, which is complicated or time. Thyroidectomy is also intended to remove all cancerous thyroid nodules rather than just the endocrine glands. As a result, identifying each nodule using ultrasounds takes time, and finding malignant nodules during operations is impossible, especially given the sensitivity of ultrasounds to scattering disturbances. As a result, implementing binary classification activities utilizing ultrasound pictures in clinical settings remains difficult. CT is a more effective method for identifying aberrant endocrine glands than ultrasound pictures, with improved diagnostic accuracy, and it is always necessary before surgery. Despite this, few trials are using CT for thyroid cancer screening. As a result, Xception is now the best option because of its improved performance and reliability. As a result, this present research presents a strategy that incorporates the Xception structure and has an adaptable multi-channel design. A comparison of sonograms and CT scans were provided in this research to highlight the utilization of diverse neuroimaging techniques. The methodology enables doctors to pick the most approach for thyroid cancer diagnosis while disregarding the peculiarities of the input sequence, determining output options, and having it relevant to both steady and unsteady data sets.
This section possesses various steps of the anticipated model. These steps include i) data acquisition, ii) outlier prediction, and iii) multi-stage weight-based ensemble learning process (MS-WEL). Fig. 1 depicts the flow of the anticipated model.
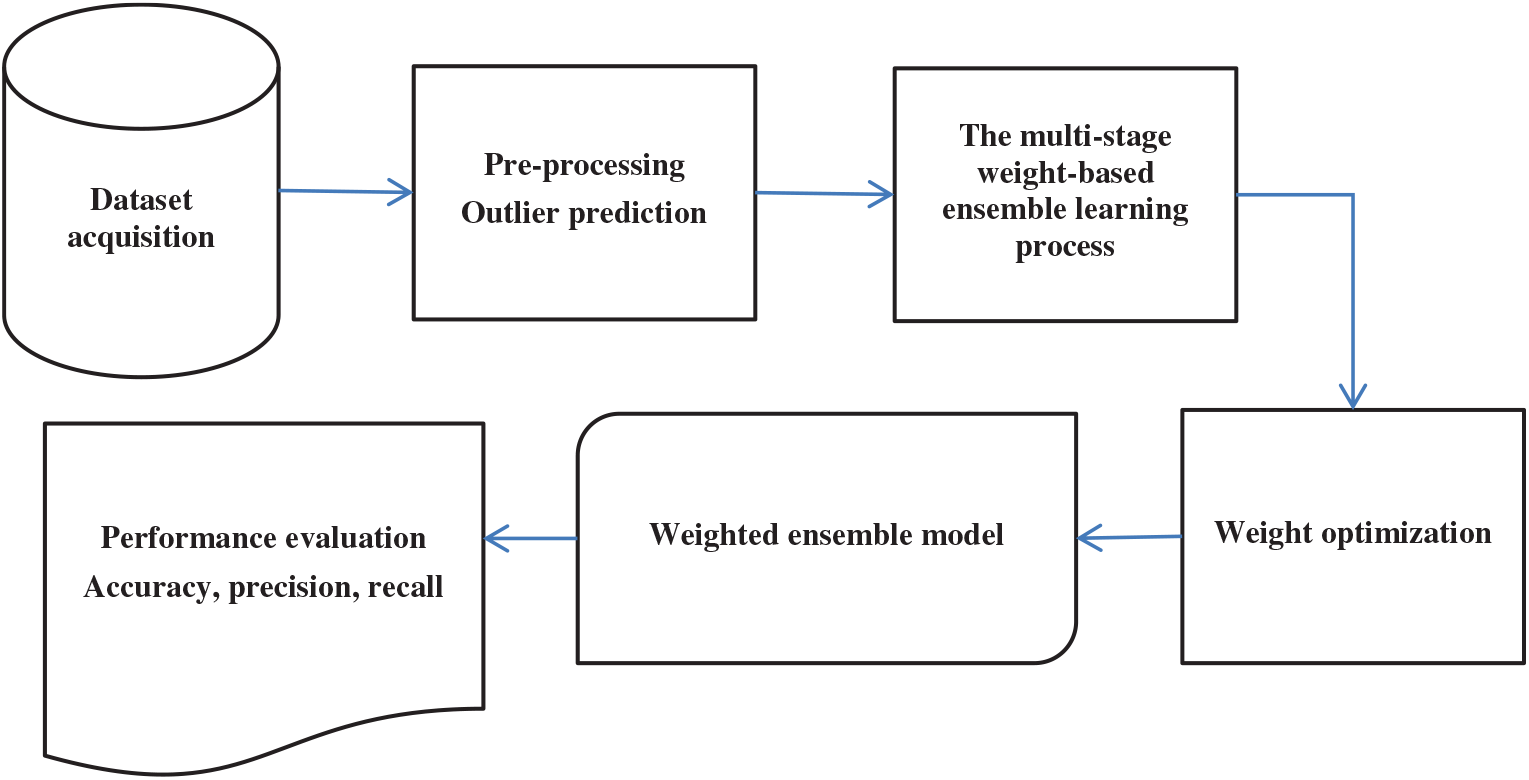
Figure 1: Workflow of the thyroid prediction model
From the “Federico II” Naples hospital [5], the datasets need to be taken from patients related to thyroid disease to be treated for conducting the research. Moreover, the data sources need to be gathered from every patient, including personal data like date of birth, age, pathology, sex, education, marital status, and profession; also details of family history, the physical features like weight, height, data concerned to possible pregnancies and mensuration for women, body mass index, and few considering alvus, diuresis, appetite are considered. In addition, some clinical data also needs to be considered, like neck, skin, thorax, heart, extremities, eyes, and abdomen. The obtained datasets are deemed to incorporate two data sets concerning 800 patients.
Secondly, the data source is obtained from the diary of doctors’ visits. It provides all the related data of every patient regarding clinical visits and tests conducted while visiting the doctor. The two data sources provide the data, and then it is combined into a single massive dataset with the help of a patients’ ID used as an element. Consecutively, the cleaning work needs to be carried out. The management of all the uncorrected data and missing values is primarily performed. However, patients who have a single visit are eliminated from the dataset by looking at every patient’s clinical history. They are not required for the evolution of the disease in this research.
Further, this proposed approach selects only the patients who suffered from hypothyroidism due to the examined medicine in predicting the disease. There are three macro-groups of pathologies in the gathered datasets. They are (a) congenital hypothyroidism, (b) Hashimoto’s thyroiditis with hypothyroidism, and (c) hypothyroidism. Finally, the collected dataset has 247 patient data, with 51 men and 195 women and a mean age of 46. In some circumstances, patients with hypothyroidism visit the hospital for more than a year or have many appointments in a single year. In particular, a group of collected datasets has 2784 instances that refer to a specific patient and a particular visit while the essential clinical and physical data are deposited (See Table 1).

The outlier(s) are the occurrence point(s) significantly different from the term frequency in machine learning and deep learning. In this case, anomalies identification is used to identify and eradicate anomalies from the data. The improvement of efficiency is a substantial benefit of eliminating outliers. Because an outlier can decrease the effectiveness of any machine learning method, this study uses isolation forest (IF). This unsupervised outlier identification methodology identifies outliers rather than profiles expected points. The IF differentiates outliers after creating isolated trees and retaining outliers as short overall duration under isolated trees. The IF can be a feasible and valuable tool for identifying outliers. It makes the point that exceptions are more subject to isolation; as a result, outliers may be identified across the forests as reports with shortened projected track durations.
After the sub-steps above, we apply normalization to the data. The information is restructured in this stage to be used for future study. The primary goal of data normalization is to organize the data and remove any irrelevant or extraneous information that may be present. The standard normalizing approaches include min-max, z-score, and a variety of other techniques. The min-max scalar method is used in this case, which is the most resilient technique for the estimation collection. The min-max scalar normalization approach is used, and the dataset is rearranged either to a value between 0 and 1.
3.3 Multi-Stage Weight-Based EnsembleLlearning Process (MS-WEL)
Here is a novel multi-stage weight-based ensemble learning model based on weighted voting. The model is constructed to identify the thyroid using various approaches. In the first stage, various classifier models are adopted to participate and generate the weighted ensemble learning. The classifier parameters are tuned via a genetic algorithm to generate an optimized baseline model. Moreover, the initial stage processing helps select the desirable optimization model from base classifiers using positive predictive values (PPV). Moreover, the weighted evaluation of the base model is constructed with two diverse processes: 1) weight optimization using grid searching and 2) optimum weight analysis after MCC for the generation of an ensemble model for further analysis. In the successive stage, the weighted ensemble model is developed to tune the model’s weight. The values of Mathews correlation coefficient (MCC) are considered to generate the optimal weight for every developed ensemble model.
3.4 Hyper-Parameter Analysis Using GA
A genetic algorithm (GA) is a meta-heuristic hyperparameters optimization tool that selects the population’s best-fitting chromosomal or individual people. GA is used in this work to modify the hyper-parameters of each base Support Vector Machine (SVM) classifier to increase the effectiveness of the proposed model. Because all of the hyperparameters in the GA are intuitionistic, the representations utilized for the primary base classifiers are a vector of integers. Each number represents the value of one of the basic classification model’s hyperparameters that are now being tuned. Construct the starting demographic of each type in the GA’s first stage. The feature subset variables for each classifier are selected at random from the stated search areas. In the second stage, assess each classifier’s optimization technique. The AUC practical assessment indicator is employed as the fitness function of each used classification model during the trials. The most accurate classification is those that are the fit. Then, from the group, identify the two best-fit people. Following that, an arbitrary crossovers point is chosen, and the heads of both people are switched to create new offspring, and the function called is given authority to modify the children, giving those distinct parents. Following that, the optimization algorithm of the created offspring is verified. If such kids are deemed fitter, they will supplant the majority’s less fit people. These three procedures are repeated until the number of designated generations reaches the maximum value. Finally, the method detects the majority’s best-fit people and displays them as the method’s output. The appropriate hyperparameters provide the most significant influence on the accuracy of any ML classifier. As a result, one of the most basic operations is to generate optimum base models, which aids in the development of the recommended MS-WEL model. In this scenario, the hyperparameters of each classifier are tuned using the GA. The parameter settings used to perform the GA as a hyperparameter tuning strategy are described. The optimized base models, which will provide the highest sensitivity, are generated using hyperparameters that have been fine-tuned. The hyperparameter is specified before initiating the learning process. The hyper-parameter model tuning enhances the model performance during validation set. This method implements the above-specified classification techniques with potentially reduced for each given classifier, as stated in Eq. (1). In the following stage, these fine-tuned base models aid in the improvement of two weighed learning versions.
where
In this case, the favourable predictive validity for each classifier is generated by such improved base models, as shown in Eq. (3):
Then, for each classifier shown in the calculation, calculate the sum of PPV of such optimized base classifiers
where
Then, for each classifier, such ability to achieve its objectives, optimized base models are shown in Eq. (6):
where
Each SVM classifier’s appropriate and desired weight boosts productivity in a weighted voting method. To construct an ensemble model, it is required to proactively construct the ideal weight via which any category may obtain the right and most acceptable weight. In this respect, the optimum weight for each classifier’s chosen optimized base model is generated using a grid search technique (GS). In this regard, the technique outlines the generation of optimal weight for each classifier chosen optimized base classifiers. The proportion of each chosen optimized base model is supplied using Eq. (7):
where
In Eq. (8),
This section discusses creating a unique weighted model using a weighted voting mechanism. The WV approach, described by the problem, is used to combine all of the proposed optimal training sets for each classifier. This technique combines the chosen optimized models trained for each classifier with the supplied new optimal weights for each optimized base model to produce each weighted model.
Here,
This section explains how to use the Weighted Vector (WV) approach to create a multi-tier weighted EL model (MS-WEL). The proposed model in this work integrates two previous weighted learning algorithms with the WV approach. The first layer of the recommended MS-WEL model produces two lists of basic classification techniques used as inputs in this technique. Each round generates two weighted learning models. One classifier is collected from the two classifiers at each repetition to create a scaled learning framework. This procedure continues until the classifier becomes accessible. The weight of each produced weighted learning model is initially allocated using calculation in the second layer of the recommended MS-WEL technique. The suggested MS-WEL model may be developed by explicitly generating n number of weighted learning alternative(s). The frequency of
where
The above equation
For each stacked learning model, on is the newly created optimal weight. Finally, both created weighting learning models are combined using an external technique to build a unique recommended multi-tier weighted learning model to forecast thyroid illnesses utilizing computation.
where
The evaluation of the efficiency and accuracy of the machine learning technique is performed with the help of performance indicators. When a person is categorized as HD, the positive classification is considered. The person comes under negative classification when the person is not classified as HD.
TP = True Positive (If the technique is accurately found as HD).
TN = True Negative (If the technique indeed recognized the opposite class, like patients with no heart problems).
FP = False Positive (If the technique inaccurately recognized the HD patients, that is, finding the non-HD patients as HD patients).
FN = False Negative (If the technique inaccurately recognized the opposite class, like HD patient as the average patient).
The proposed classifiers’ performance is better than the existing research in this research (Table 4). Moreover, some restrictions are dependent on the particular approach called feature selection. Illustrate with an example that highly accurate outcomes are produced when high reliance on Relief has occurred in this type of case. In addition, there is an adverse impact when a more level of missing values is available in the datasets. When the missing values are a little remarkable, this model needs to manage the problems. Further, a large dataset needs to develop the model more specific even though the training dataset is considerably extended in the proposed approach (See Figs. 2 to 4). The process of addressing the problems via the appropriate methods and using other datasets is demonstrated when this model is utilized.

Figure 2: Precision evaluation

Figure 3: Recall evaluation

Figure 4: Accuracy evaluation
Table 2 compares various performance metrics like TP, FP, FN, precision, recall and accuracy. The proposed model gives average prediction outcomes of 95.9% precision, 96.75% recall and 97.28% accuracy (See Figs. 2 to 4). Here, a successive iteration for 100 epochs is considered where the samples of 12 iterations are provided in the above table. The average TP for 12 iterations is 617.5, FP is 32.5, and FN is 27. The model performance is higher compared to various existing approaches. Based on these outcomes, it is observed that the proposed MS-WEL works well in thyroid prediction and establishes a better trade-off. Similarly, the prediction quality is improved by adopting superior feature selection approaches. The former model selects seven features while the latter selects eight features. Those selected features are fed as an input to the classifier, and better prediction outcomes are attained. The proposed model gives 97% prediction accuracy which is substantially higher the RF, SVR and LR. The proposed model is tested under the standard benchmark dataset and the computation with other benchmark standards consumes more time and leads to complexity in prediction.

This work concentrates on modelling an efficient machine learning approach for thyroid prediction. The dataset is taken from the available online resources for thyroid prediction. The initial pre-processing steps like outlier prediction are done to eliminate the unnecessary information or artefacts over the dataset. Then, the classification is done with the MS-WEL model, where the weight of the base classifier is estimated and intends to provide superior prediction accuracy. The proposed model gives an average precision of 95.9%, recall and 97.28% accuracy. Similarly, the average outcomes for 12 successive iterations are 617.5, FP is 32.5, and FN is 27. The model establishes a better trade-off and assists the physicians in predicting the thyroid’s occurrence. The major research constraint is the analysis with the computational time needed for execution that has to be reduced. However, the major drawback is the more comprehensive analysis with the ensemble model and weight prediction. It will be rectified by adopting a deep classifier in the future.
Acknowledgement: My heart full thank to my institution “Karpagam Academy of Higher Education, Coimbatore, Tamil Nadu, India” for the support and facilities provided for the research.
Funding Statement: The authors received no specific funding for this study.
Author Contributions: 1. M. L. Maruthi Prasad: Implementation of proposed model “Multi-Stage Weight-Based Ensemble Learning Process (MS-WEL)”. 2. R. Santhosh: Problem formation, results and analysis and refinement of methodology.
Availability of Data and Materials: Not applicable.
Conflicts of Interest: The authors declare that they have no conflicts of interest to report regarding the present study.
References
1. L. Chen, X. Li, Q. Z. Sheng and W. C. Peng, “Mining health examination records–a graph-based approach,” IEEE Transactions on Knowledge and Data Engineering, vol. 28, no. 9, pp. 2423–2437, 2016. [Google Scholar]
2. G. Ulutagay, “Modeling of thyroid disease: A fuzzy inference system approach,” Wulfenia Journal, vol. 19, no. 1, pp. 346–357, 2012. [Google Scholar]
3. S. M. Gorade, A. Deo and P. Purohit, “A study of some data mining classification technique,” International Research Journal of Engineering and Technology, vol. 4, no. 4, pp. 3112–3115, 2017. [Google Scholar]
4. B. N. Patel, S. G. Prajapati and K. Lakhtaria, “Efficient classification of data using decision tree,” Bonfring International Journal of Data Mining, vol. 2, no. 1, pp. 6–12, 2012. [Google Scholar]
5. U. Sidiq, S. M. Aaqib and R. A. Khan, “Diagnosis of various thyroid ailments using data mining classification techniques,” International Journal of Scientific Research in Computer Science, Engineering and Information Technology, vol. 5, no. 1, pp. 2456–3307, 2019. [Google Scholar]
6. S. Kondo, K. Takagi, M. Nishida, T. Iwai, Y. Kudo et al., “Computer-aided diagnosis of focal liver lesions using contrast-enhanced ultrasonography with perflubutane microbubbles,” IEEE Transactions on Medical Imaging, vol. 36, no. 7, pp. 1427–1437, 2017. [Google Scholar] [PubMed]
7. Y. Feng, F. Yang, X. Zhou, Y. Guo, F. Tang et al., “A deep learning approach for targeted contrast-enhanced ultrasound based prostate cancer detection,” IEEE/ACM Transactions on Computational Biology and Bioinformatics, vol. 16, no. 6, pp. 1794–1801, 2018. [Google Scholar] [PubMed]
8. J. Zhang, M. Ding, F. Meng and X. Zhang, “Quantitative evaluation of two-factor analysis applied to hepatic perfusion study using contrast-enhanced ultrasound,” IEEE Transactions on Biomedical Engineering, vol. 60, no. 2, pp. 259–267, 2013. [Google Scholar] [PubMed]
9. A. Esteva, B. Kuprel, R. A. Novoa, J. Ko, S. M. Swetter et al., “Dermatologist-level classification of skin cancer with deep neural networks,” Nature, vol. 542, no. 7639, pp. 115–118, 2017. [Google Scholar] [PubMed]
10. X. Liang, L. Lin, Q. Cao, R. Huang and Y. Wang, “Recognizing focal liver lesions in CEUS with dynamically trained latent structured models,” IEEE Transactions on Medical Imaging, vol. 35, no. 3, pp. 713–727, 2015. [Google Scholar] [PubMed]
11. Y. Feng, X. Qin, Y. Luo, Y. Li and X. Zhou, “Efficacy of contrast-enhanced ultrasound washout rate in predicting hepatocellular carcinoma differentiation,” Ultrasound in Medicine & Biology, vol. 41, no. 6, pp. 1553–1560, 2015. [Google Scholar]
12. K. Wu, X. Chen and M. Ding, “Deep learning based classification of focal liver lesions with contrast-enhanced ultrasound,” Optik, vol. 125, no. 15, pp. 4057–4063, 2014. [Google Scholar]
13. M. Wang, C. Lian, D. Yao, D. Zhang, M. Liu et al., “Spatialtemporal dependency modeling and network hub detection for functional MRI analysis via convolutional-recurrent network,” IEEE Transactions on Biomedical Engineering, vol. 67, no. 8, pp. 2241–2252, 2019. [Google Scholar] [PubMed]
14. A. K. Dwivedi, “Performance evaluation of different machine learning techniques for prediction of heart diseases,” Neural Computing and Applications, vol. 29, no. 10, pp. 685–693, 2018. [Google Scholar]
15. P. Ghosh, A. Karim, S. T. Atik, S. Afrin and M. Saifuzzaman, “Expert model of cancer disease using supervised algorithms with a LASSO feature selection approach,” International Journal of Electrical and Computer Engineering, vol. 1, no. 3, pp. 2632–2640, 2020. [Google Scholar]
16. R. Banerjee, S. Biswas, S. Banerjee, A. D. Choudhury, T. Chattopadhyay et al., “Time-frequency analysis of phonocardiogram for classifying heart disease,” in Proc. of IEEE Computing in Cardiology Conf. (CinC), Vancouver, Canada, pp. 573–576, 2016. [Google Scholar]
17. G. Singh, “Breast cancer prediction using machine learning,” International Journal of Scientific Research in Computer Science, Engineering and Information Technology, vol. 8, no. 4, pp. 278–284, 2020. [Google Scholar]
18. P. Ghosh, M. Z. Hasan and M. I. Jabiullah, “A comparative study of machine learning approaches on dataset to predicting cancer outcome,” Journal of the Bangladesh Electronic Society, vol. 18, no. 1–2, pp. 81–86, 2018. [Google Scholar]
19. Z. Masetic and A. Subasi, “Congestive heart failure detection using random forest classifier,” Computing Methods Programs in Biomedicine, vol. 130, no. 43, pp. 54–64, 2016. [Google Scholar]
20. S. H. Ripon, “Rule induction and prediction of chronic kidney disease using boosting classifiers, ant-miner and J48 decision tree,” in Proc. of IEEE Int. Conf. on ECCE, Baltimore, USA, pp. 1–6, 2019. [Google Scholar]
Cite This Article
 Copyright © 2024 The Author(s). Published by Tech Science Press.
This work is licensed under a Creative Commons Attribution 4.0 International License , which permits unrestricted use, distribution, and reproduction in any medium, provided the original work is properly cited.
 Downloads
 Citation Tools