
 Submit a Paper
 Propose a Special lssue
 Open Access
ARTICLE
Extended Deep Learning Algorithm for Improved Brain Tumor Diagnosis System
1 Department of Computer Engineering, Government Polytechnic College, Sevvapet, Tiruvallur, Tamil Nadu, 602025, India
2 Department of Computer Science and Engineering, KG Reddy College of Engineering and Technology, Hyderabad, Telangana, 500075, India
3 Department of Computer Science and Engineering, Sri Venkateswara College of Engineering, Sriperumbudur, Chennai, 602117, India
4 Department of Computer Science and Engineering, Annamalai University, Chidambaram, Tamil Nadu, 608002, India
5 Department of Computer Science and Engineering, Aarupadai Veedu Institute of Technology, Vinayaka Mission Research Foundation, Paiyanur, Tamil Nadu, 603104, India
6 Department of Electrical and Electronics Engineering, Sri Venkateswara College of Engineering, Sriperumbudur, 602117, India
7 Department of Computer Science, College of Computer and Information Sciences, Majmaah University, Al-Majmaah, 11952, Saudi Arabia
8 Department of Mathematics, College of Science Al-Zulfi, Majmaah University, Al-Majmaah, 11952, Saudi Arabia
9 Electrical Engineering Department, Faculty of Engineering & Technology, Future University in Egypt, New Cairo, 11835, Egypt
10 Department of Computer Science, College of Computing, Khon Kaen University, Khon Kaen, 40002, Thailand
* Corresponding Author: Mohd Anul Haq. Email:
Intelligent Automation & Soft Computing 2024, 39(1), 33-55. https://doi.org/10.32604/iasc.2024.039009
Received 07 January 2023; Accepted 10 March 2023; Issue published 29 March 2024
 View Full Text
 Download PDF
Abstract
At present, the prediction of brain tumors is performed using Machine Learning (ML) and Deep Learning (DL) algorithms. Although various ML and DL algorithms are adapted to predict brain tumors to some range, some concerns still need enhancement, particularly accuracy, sensitivity, false positive and false negative, to improve the brain tumor prediction system symmetrically. Therefore, this work proposed an Extended Deep Learning Algorithm (EDLA) to measure performance parameters such as accuracy, sensitivity, and false positive and false negative rates. In addition, these iterated measures were analyzed by comparing the EDLA method with the Convolutional Neural Network (CNN) way further using the SPSS tool, and respective graphical illustrations were shown. The results were that the mean performance measures for the proposed EDLA algorithm were calculated, and those measured were accuracy (97.665%), sensitivity (97.939%), false positive (3.012%), and false negative (3.182%) for ten iterations. Whereas in the case of the CNN, the algorithm means accuracy gained was 94.287%, mean sensitivity 95.612%, mean false positive 5.328%, and mean false negative 4.756%. These results show that the proposed EDLA method has outperformed existing algorithms, including CNN, and ensures symmetrically improved parameters. Thus EDLA algorithm introduces novelty concerning its performance and particular activation function. This proposed method will be utilized effectively in brain tumor detection in a precise and accurate manner. This algorithm would apply to brain tumor diagnosis and be involved in various medical diagnoses after modification. If the quantity of dataset records is enormous, then the method’s computation power has to be updated.Keywords
A brain tumor is a collective abnormal cell in the human brain. As the skull covers the brain rigidly, if the mass of abnormal cells has grown, it leads to problems in the brain. Brain tumors are cancerous or noncancerous. So, it must be predicted earlier to recover from brain tumor impact by treating accordingly, like providing therapy or surgical intervention. Many research works have been carried out to propose methods to detect with a quick process. One such rapid process-based brain tumor detection was 2D-VNet deep learning architecture [1]. This work introduced a consistent and automatic processable technique, and it was CNN for segmentation purposes. The BRATS2020 benchmark dataset was used for training and testing purposes in this work. Brain tumor detection is essential with accurate measures as this disease is dangerous for human life. Henceforth the introduction of an efficient method or framework is critical instantly. A DL-based brain tumor-detecting mechanism has been introduced for MRI scan images to analyze brain tumor disease status [2]. This work has taken part in detecting abnormal locations in the image and identifying tumor regions. The abnormality of a site from MRI images has been detected with the DL algorithm. Further to the segment, the tumor region has been identified with multi-level thresholding. Here malignant pixels have been identified to measure the affected part.
MRI-based images have been used to predict brain tumors introduced, and it has been solved with the DL model [3]. This DL hybridized with Local Interpretable Model-agnostic Explanation (LIME), CNN, and Shapley Additive Explanation (SHAP) algorithms. This work was mainly introduced to detect meningioma, pituitary, and glioma with the help of an MRI image dataset. The specialty of this work is that it has fed dual input CNN for challenging classification challenges. Sometimes images with inferior quality introduce noise and metal kinds of artifacts. In this work, high predictive performance was carried out for trust development for clinical practice and its applications.
Yet another article has discussed the Internet of Medical Things (IoMT) set up for the medical world to utilize effectively with fine-tuned GoogLeNet features alongside the side of the computer-aided diagnosis (CAD) system [4]. In this work, features of MRI image-based brain tumors were extracted with the help of CNN pre-training. Further, this CNN was chosen as GoogLeNet alongside feature classification with the softmax technique. Later these results were compared with K-Nearest Neighbour (KNN) and Support Vector Machine (SVM) algorithms. The dataset was used from the Harvard Medical Repository and Figshare repository. The performance measures utilized for this work were F1 score, specificity, and accuracy. Later this compared result was evaluated. The brain tumor detection system consists of the following components as usual: inputting the dataset and pre-processing, testing along with training the feeding algorithms, and analyzing the output performance. Fig. 1 illustrates the brain tumor detection system’s components.
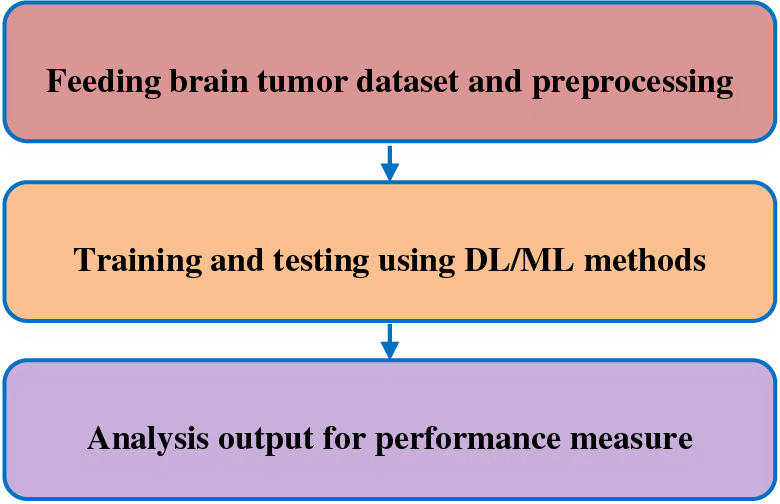
Figure 1: Stepping mechanism of brain tumor detection
Feeding brain tumor dataset and pre-processing: the brain tumor dataset [5–8] will be initiated to test and pre-process. Training and testing using DL/ML methods: This is the step to be taken, pre-processed dataset in the proper order as training and testing to some extent. This would be processed and get results as its performance measures. Analysis output for performance measure: later it would be taken as its performance parameter and here SPSS tool will be used and compare all the method’s performance measures with statistical analysis and graph builders.
The contribution of this work is as follows:
• This research manuscript has identified the EDLA algorithm for brain tumor prediction with a concerned dataset.
• CNN has been modified to get high accuracy, sensitivity to brain tumor prediction, and less false positive and false negative.
• The LeakyReLU layer of the EDLA algorithm has been introduced to get best parameters performance for brain tumor prediction. It introduces novelty concerning activation function in modification and performance parameters.
• The experiment with EDLA and CNN algorithms for brain tumor prediction for sufficient repeat analyzed their mean performances.
Regarding brain tumor identification systems and mechanisms, many relevant and basic concepts and techniques were introduced in different journals and articles, around 200 plus in count. It is now time to briefly about classification and prediction techniques alongside their features as comparative analysis. For the features transfer concept, a deep CNN has been utilized as a technique to classify brain tumors [9]. This work uses glioma, pituitary, and meningioma brain tumor types alongside deep transfer learning. This work has an extensive performance by means of F score, recall, specificity, and accuracy. The dataset used to measure performance was Figshare [5]. A work has initiated a different approach to measure the performances with large MRI dataset images [10]. The idea of this work was that a deep feature ensemble had been used to improve performance significantly and vigorously. The classifier used in this work was a radial basis function-based SVM algorithm. Yet another work has been coined to predict Liver and brain tumors with the help of Long Short-Term Memory Networks (LSTM) and Discrete Wavelet Transform (DWT) alongside CNN concepts [11]. This hybrid method has achieved high performance measured by means of accuracy. The dataset was obtained from Firat Research Hospital. The limitations of this research work were the usage of the limited size of the dataset (56 images) and the consumption of a huge amount of time.
Two-Dimensional Magnetic Resonance (2DMR) with DL was recently upgraded to measure the brain tumor [12]. In this work, Transfer Learning (TL) alongside 7 DL methods was used, including the Visual Geometry Group at Oxford-19 (VGG-19) and DenseNet201 to train and extract features to detect brain tumors. Further, this output was applied over traditional classifier algorithms such as Adaboost, Random Forest (RF), SVM, Decision Tree (DT), and Gradient Boosting (GB) to measure accuracy. Other performance measures measured were F1 score, recall, Jaccard, specificity, Cohen’s kappa, etc. Around 100352 features were considered to train and detect brain tumors. A DenseNet201-based model for detecting brain tumors was introduced as a proposed [13]. Three class brain tumor datasets were used with Inception-v3 and DenseNet201models to measure accuracy. It concatenated all features with pre-trained models as state-of-the-art ML and DL algorithms for brain tumor classification. The later proposed model was compared with the Neural Network (NN).
A different work was discussed for brain disease diagnosis with DL and ML algorithms [14]. An AI-based neurology solution was utilized as a proposed solution. Here the different feature extraction solutions of ML and DL were trained and tested, and the same has been tabulated. A Deep Neural Network (DNN) algorithm has gained accuracy considerably more than the Recurrent Neural Network (RNN) algorithm. Yet more pathology’s internal working mechanism-based hybridized ML algorithm was introduced to analyze brain tumors [15]. It applied the Maximum A Priori (MAP) firefly algorithm with the orientation of pattern descriptors. This work has extracted features such as shape, texture, and intensity. Also, this work has checked the dataset to detect stroke disease. CNN descriptor method is used to extract shape-based extraction. A quantized extreme pattern with a neoteric direction was applied to extract texture features. Finally, a wavelet transform with clustering was used to extract features of intensity. To detect brain tumors, some regions, including necrotic, oedema, and non-necrotic, were identified. Some performance measures, including accuracy, were introduced.
Brain MR Image was used to detect tumors as the augmentation process was carried out as application work [16]. A realistic or diverse synthesis was achieved with Generative Adversarial Networks (GANs). This has introduced most medical imaging datasets with non-small and non-fragmented. The dataset was used as an image-to-image or noise to the image. Steps of the proposed work has two major steps high-resolution image generation followed by a translation of image-to-image setup with the multi-model unsupervised algorithm. Accuracy and sensitivity have been measured. The dataset has been taken as real images. A work has introduced a Histopathological brain tumor-based brain tumor detection mechanism as robust cell detection along with adaptive dictionary selection and sparse reconstruction [17]. This work has also used CAD to detect brain tumors with better decisions for tumor diagnosis. Cellular analysis was further unfurled on challenges when it has to be detected as robust brain tumor detection. Some steps have been adapted to detect brain tumor detection, and those were adaptive dictionary learning and sparse reconstruction. A special dataset enhancement has been carried out as 32 whole slides with 2000 cell extraction. Accuracy and F1 scores were measured.
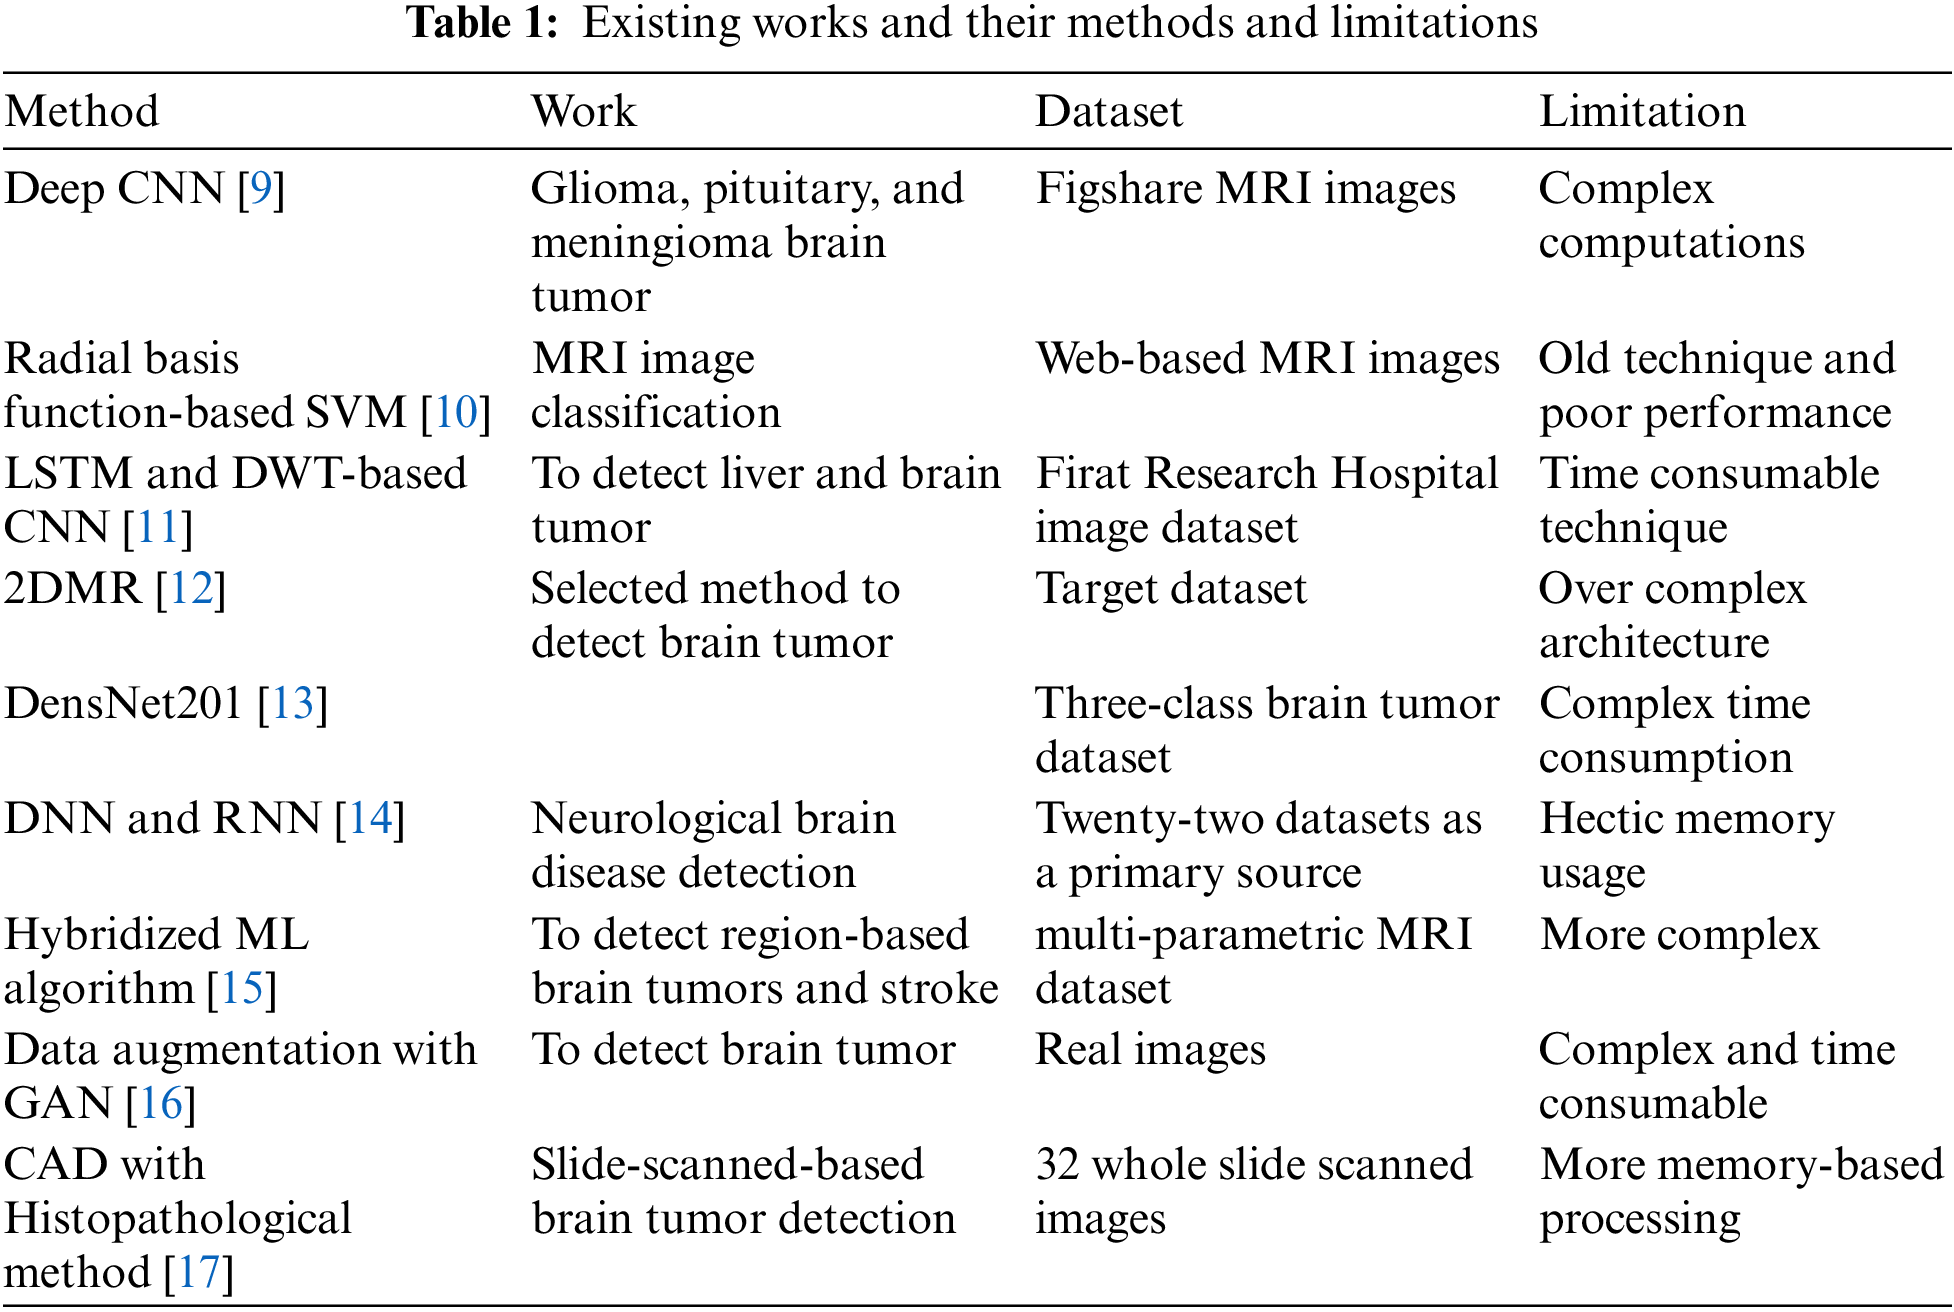
Some authors have introduced a method to overcome CAD-based brain tumor detection. The reason was that CAD has difficulty since it has various factors as inferences to diagnose more while detecting brain tumors. MRI detection technology with CNN as the proposed method was used in the ensemble to detect features of the tumor. Recognition efficiency has been achieved with the CNN method alongside the introduced feature fusion on diagnosis results. Later, performance analysis was introduced as a practical effect alongside subsequent research on brain tumors. The dataset of high-resolution-based complex dimensional images was used. Table 1 has listed various research methods, used datasets, and limitations.
Many valuable works have been proposed over the past couple of decades. Still, there has to be introduced an efficient brain tumor detection mechanism with the help of research-oriented ML and DL algorithms as there was a research gap existing in the aspect of accuracy, sensitivity, false positives, and false negatives. As an author, certain research work has been carried out in the field of ML and DL [18–20]. The works were like network traffic analysis, COVID forecasting, and Classification of stage-wise COVID-19 X-ray images executed previously. A powerful feature was extracted with an MRI scan image with the DL algorithm. Further feature vectors are vectorized with partial least squares. A cooperative learning neural network was discussed about object detection with semi-supervised learning [21]. Here is the proposed research work; it is decided to introduce an efficient brain tumor detection mechanism with novelty using the EDLA algorithm. Further, its performance is supposed to be compared with some existing algorithms.
An experiment has been carried out to enhance brain tumor detection performance. Two algorithms, namely, the EDLA and CNN, were taken. Group 1 was taken as the EDLA algorithm, and Group 2 was taken as the CNN algorithm to measure the performance of brain tumor detection. The dataset was downloaded from Kaggle, and three types of classification for the brain tumor dataset were referred to, trained, and tested [5–8] as this review claimed benign, pituitary, and malignant tumors. The difficulty in the detection of brain tumors has had factors such as the location of the tumor and abnormalities. A total of 3264 images of MRI were taken. Among 3264 images, the type of glioma [7] image was 926 counts, meningioma tumor image 937 counts, pituitary tumor images 901 in the count, and non-tumor images 500 the count were taken. From this dataset, 80 % of 3264 images were trained under four different categories, and 20% of 3264 were taken for testing with four internal categories.
The existing CNN algorithm has worked as follows. It is one of the computer vision application methods. Usually, it is used to analyze visual image-based data with DNN. The process of the initial layer is a convolutional layer, which was used here to filter with the extraction of the sub-region of the image alongside the activation function. Next, the max pooling layer was used to further specify the pooled region to avoid overlap of brain tumor image as input. The further convolutional 2D layer is applied for the padding function. Finally, a dense layer is applied to the hidden layer and unit of the image in brain tumor detection.
3.1 EDLA Algorithm Architecture
The proposed EDLA algorithm has been working as an extension of the CNN algorithm. The simple block diagram is illustrated in Fig. 2 to detect brain tumor steps inclusive of dataset reading.
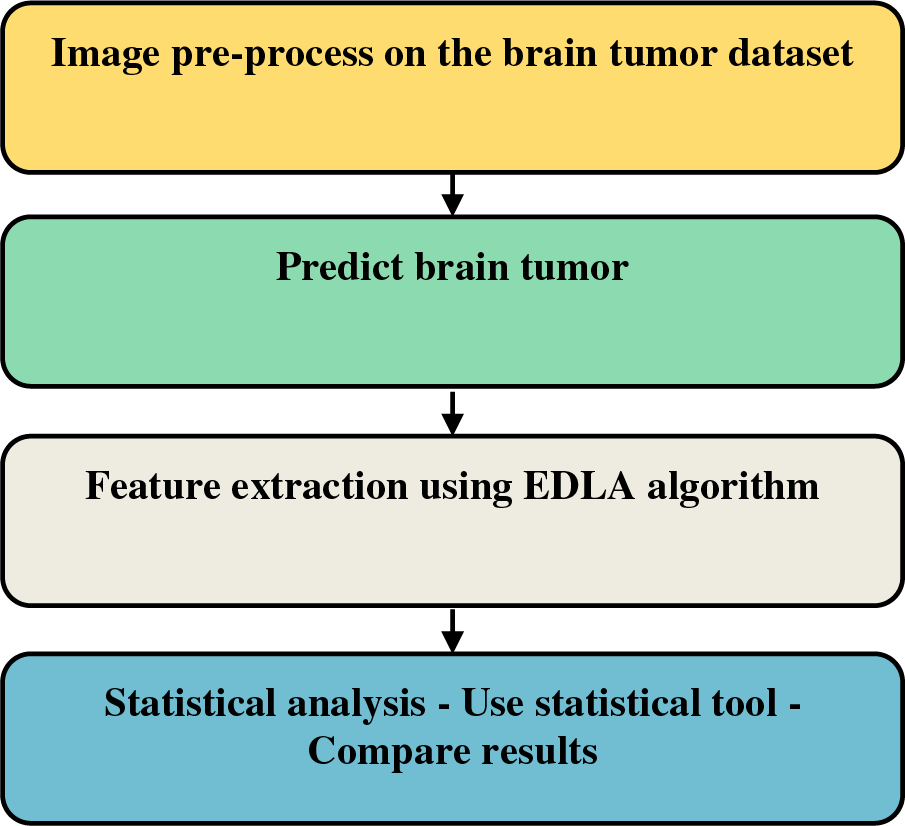
Figure 2: Brain tumor detection steps over the proposed EDLA algorithm
Fig. 3 illustrates block-based steps to be applied to get brain tumor detection on the MRI image dataset. The generalized work of detection of brain tumors with CNN was modified, and it was extended as follows. Initially, with the help of image pre-processing, the image is augmented. Immediately to detect brain tumors, the biggest contour is selected, followed by an extreme point-finding process. From there, crop function would be called to segregate the useful part for brain tumor detection. This part will be finally resized for the EDLA model and find the prediction accuracy, sensitivity, false positive and false negative performance measures. This Fig. 3 consists of Neural Network architecture with a complex model after introducing the LeakyReLU activation function.
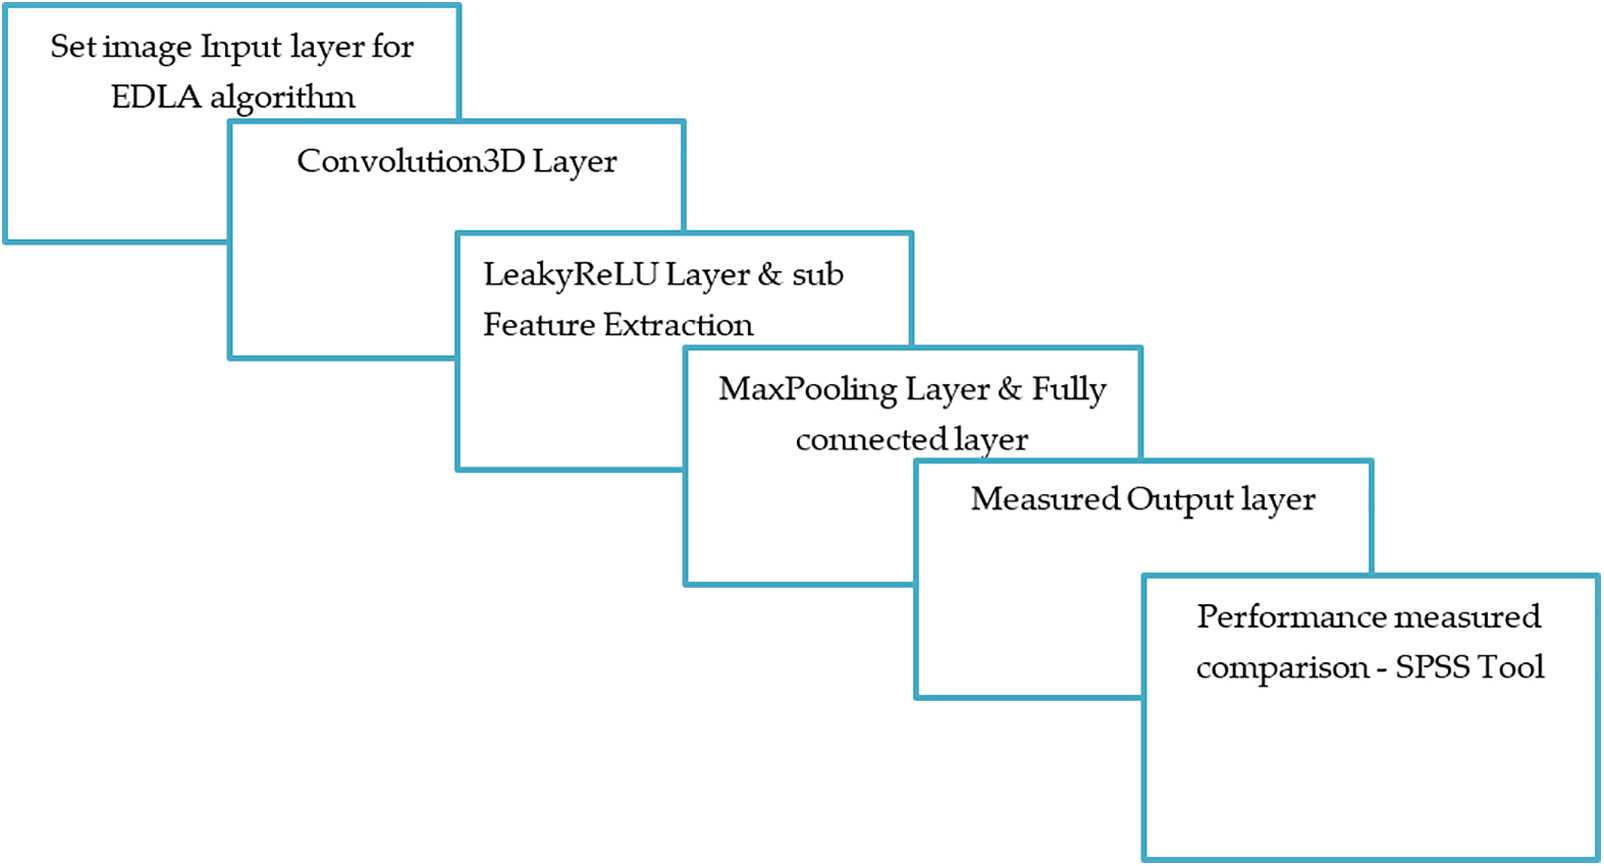
Figure 3: The EDLA algorithm’s layered working mechanism with image data input and performance output
Here modified CNN architecture was used. This has an input layer, convolution3D layer, leakyReLU layer, sub-feature extraction layer, max pooling layer, fully connected layer and output layer. Further sections introduced the working mechanism and functionality of each layer. Steps followed to detect brain tumor: The initial multi-module will set the path to locate an image of the brain tumor dataset. Later, Python’s openCV and its CV2 module’s imread() function was applied to convert the image of the brain tumor dataset as pixel information, including resizing of brain tumor dataset images. Finally, the image function followed by the imshow() function displays the output. Here convolutional layers extract features of the image of the brain tumor dataset. Fully connected layers classified the output, followed by data augmentation. Under this step, a transformation like horizontal, vertical, flip, and zooming happened since the dataset of brain tumor images was very small in size.
All this information has been traced in Fig. 4, as shown. The image dataset is taken to the input layer in EDLA, which is pre-processed with the identification of the biggest contour, finding the point of extreme, cropping the exact contour, and resizing with a convolutional layer. Here the feature map was calculated with a parameter of the total number, and Eq. (1) illustrates this process.
where n and m are the input image’s dimensions and k is the number of features for the image’s input ‘nxm’ dimension as output. The parameter ‘l’ is the feature map as input. Here Leaky Rectified Linear Unit (leakyReLU) layer and sub-feature extraction layer were applied as extended work from the Residual Network (ResNet201). Here leakyReLU was taken as an activation function. There is a trick: sometimes, a negative value for the activation function leaves a slight slope.
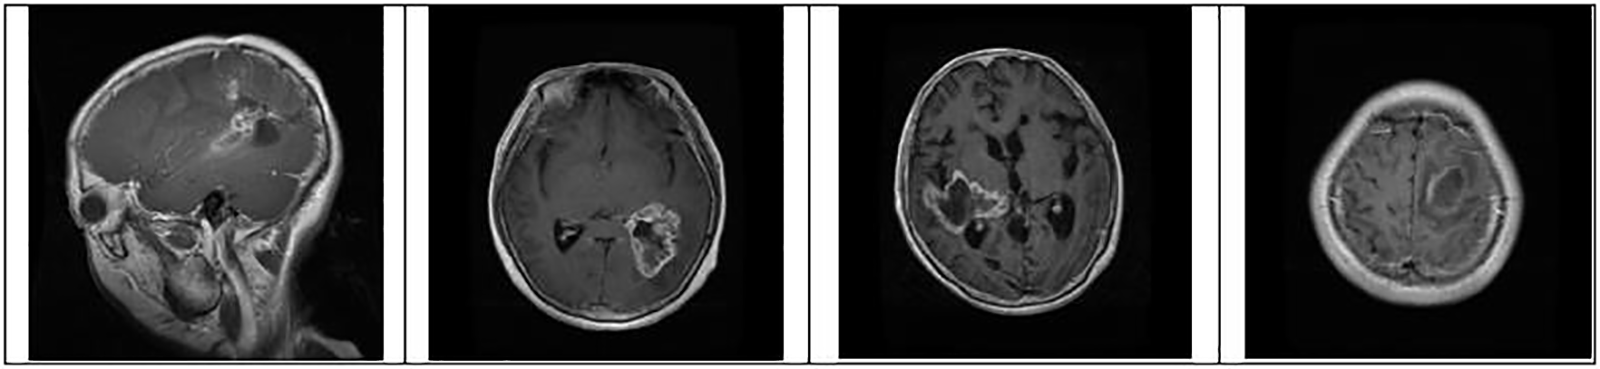
Figure 4: Identification of brain tumor-type glioma samples from the dataset for training and testing
Further experiment set count hyperparameter, which was set as 100 with LeakyReLU-based activation function. This hyperparameter was set over brain tumor detection with several hidden layers and the activation function to introduce the novelty of this work. Here MaxPooling layer with the inevitable role will be reducing contour image size since subsampling is unavoidable and followed by a fully connected layer that separates input weight concerning output weight with the classification of the image from input to output. Here output to input is mentioned with a number in count as n and m, respectively, and the output computational function is represented as Eq. (2).
3.2 System Specification and Experimental Setup
CoLab of Google was used and initialized all required packages to detect brain tumor detection over the MRI image dataset. The package of Python was utilized for pre-processing, and performance measures were calculated with existing CNN. Further, CNN was modified in appropriate layers for enhancement and deep penetration. Here ResNet201 was used internally to extend the performance in accuracy rate flow. The dataset of 3264 MRI images with three positive categories and one harmful category was used. The dataset imaged was used under the 8:2 ratio for training and testing to detect brain tumors. ResNet201 and You Only Look Once (YOLO) were used to detect brain tumors. Ten iterations were repeated and noted its performance. Here for image pre-processing, Opencv, YOLOv3, and YOLO_mark are executed. For training, 80% were trained.
Algorithm 1 was coined to extend the CNN, and it was named after execution as the EDLA algorithm. The following mechanism was carried out to detect brain tumors precisely and accurately detect them.
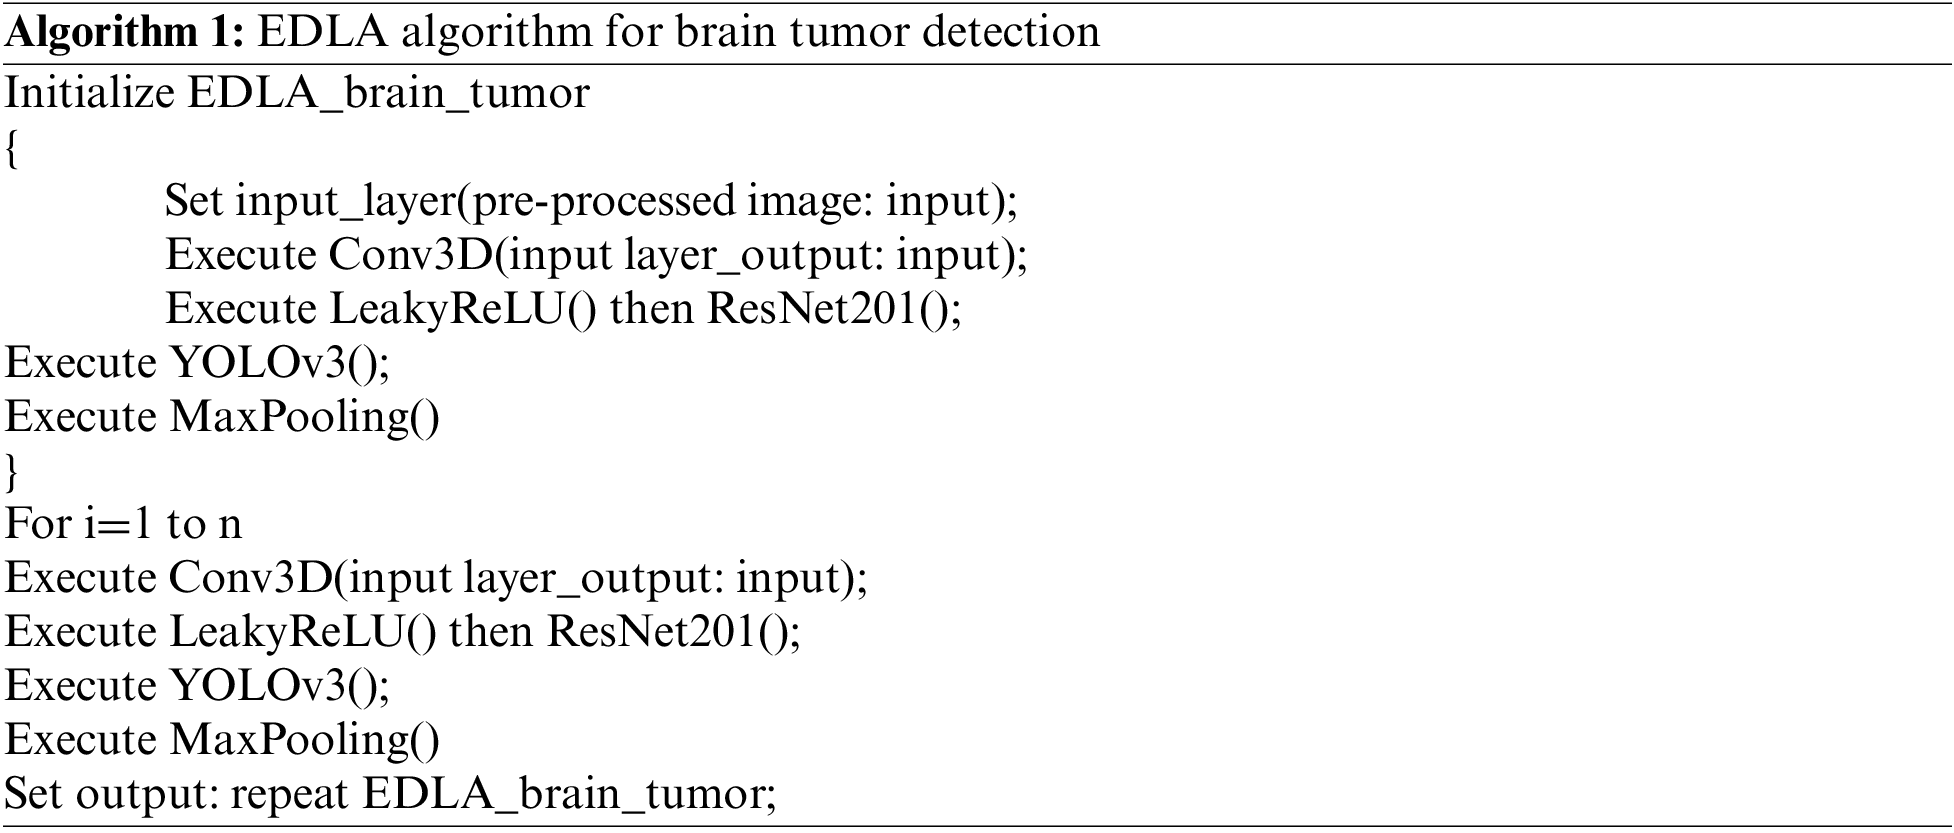
Here, the step by step of brain tumor detection is discussed. Initially, the original image from the dataset was read using the EDLA algorithm’s (Set input_layer(pre-processed image: input)). Next CNN CNN-based execution instruction ‘Conv3D (input layer_output: input)’ checks the point of extreme, most extensive contour, cropped contour and resizes the silhouette with the effectiveness of extract. Next, for brain tumor feature recognition, the instruction ‘LeakyReLU()’ of ‘ResNet201()’ was executed to gather feature maps as mentioned in Eq. (1). The required notice was that LeakyReLU had been triggered as an activation function to classify images as normal or abnormal. This work’s next step was using the MaxPooling position to avoid slight slop, and reducing contour image size as a sub-sample was inevitable. It also enhances the image after setting the threshold followed by tumor location detection. The above steps were repeated multiple times until precise and accurate results of detection of brain tumor were detected.
Further above algorithm would be computationally processed as follows. Initially, datasets [5–8] were trained and labeled with identification like YOLO brain tumor just before ResNet201. The dataset was trained with the .jpg extension. YOLO configuration is measured to identify brain tumors. Eq. (3) represents the configuration of YOLO. Here YOLOv3 was explicitly applied to detect brain tumor regions as features of brain tumors learned by the upper layers of the EDLA algorithm. Hence YOLOv3 has followed object detection based on features generated by the upper layers of the EDLA algorithm.
where yc is YOLO configuration, c is the class of images, its value is maximum 4, b is batch, and s are leading subdivisions. The ResNet201 built-in package is represented as Eq. (4).
where rn is the NesNet201 package, bt is building type, l functions for a library, id is the directory to include brain tumor contour, and od is OpenCV with ResNet201. Eq. (5) represents OpenCV with ResNet201.
where pc is a package configuration of brain tumor algorithm, mf is making the file of brain tumor, and m is brain tumor contour make. Figs. 4 to 6 represent three different types of brain tumors: glioma, meningioma, and pituitary. With algorithm 1, all said types were identified. The output of different kinds of brain tumor detection and its sample is represented in Figs. 4 to 6. Here glioma is a low-grade tumor, like a normal brain, with a similar texture and colour. Here intra-operative sampling and the enhanced visual tumor have been applied as glioma detection steps, as shown in Fig. 4. For meningioma detection, vision change, seizures, and confusion were checked with dura mater and pia mater, as shown in Fig. 5. Here DeepMedic architecture with t1 method for MRI image. The same further process is applied to pituitary tumors. The EDLA architecture process was applied, and results were generated.
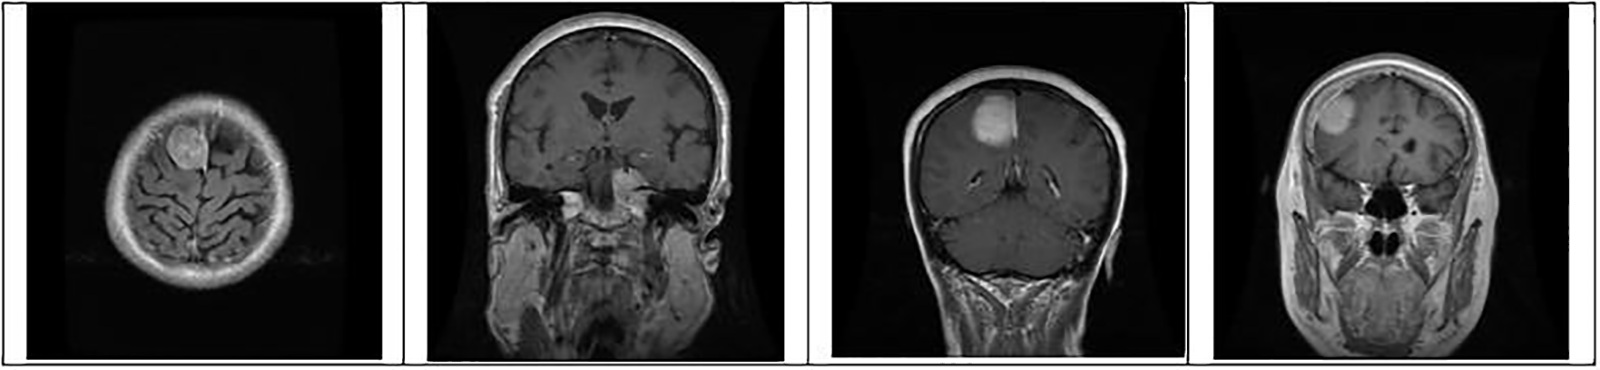
Figure 5: Identification of brain tumor-type meningioma samples from the dataset for training and testing
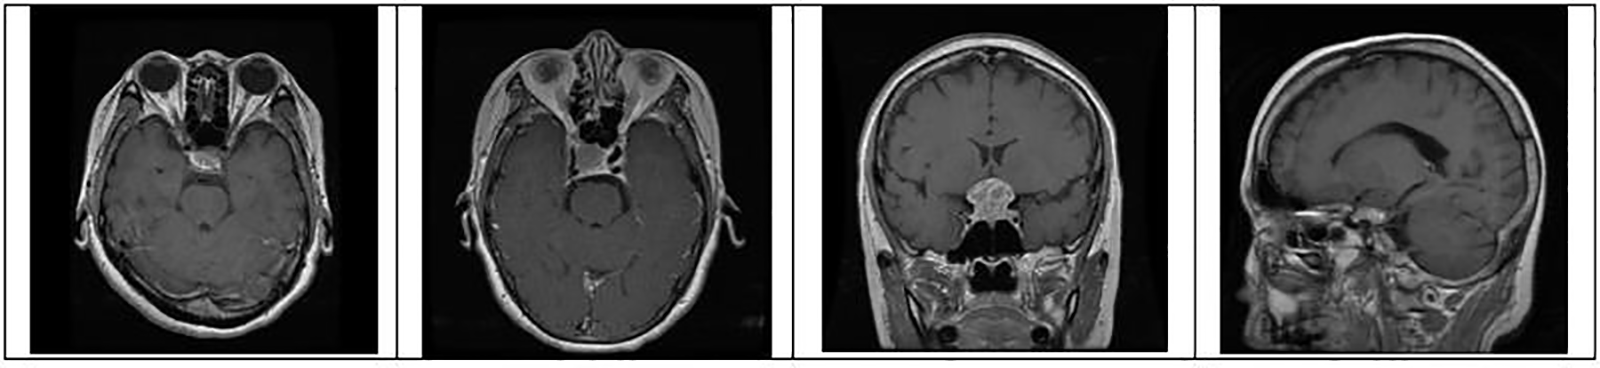
Figure 6: Identification of brain tumor-type pituitary samples from the dataset for training and testing
3.3 Brain Tumor Performance Measures
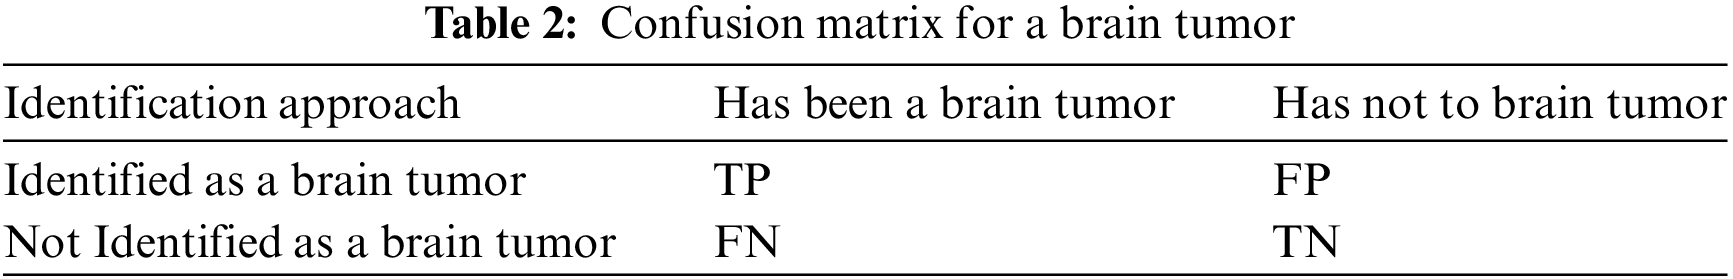
Table 2 represents the confusion matrix for brain tumor detection, which has four components True Positive (TP), True Negative (TN), False Positive (FP), and False Negative (FN). TP is that the image has a tumor cell, and the result is also accurate. TN is that the actual image input is tumor-based, and output is displayed as not tumor. FP is the one in which taking a standard image and detecting output is tumor detection. Finally, FN is that the input is a tumor image, but the result is not a tumor. The confusion scores were represented based on the identification of brain tumors and non-identification of brain tumors.
The rest in measure with identification of brain tumor is the accuracy. It is measured as represented in Eq. (6).
Further, yet another performance measure was calculated as sensitivity; it is nothing but the direct proposition of TP of brain tumor detection to the indirect request of brain tumor detection’s sum of TP and FN. The sensitivity is represented as Eq. (7).
Brain tumor False Positive Rate (FPR) is to be calculated to know, not positive. It is the direct proposition with FP and the indirect recommendation with the sum FP and TN, which is presented as Eq. (8).
Brain tumor False Negative Rate (FNR) would be the detecting negative. It is directly propositioned with FN and indirectly proportional to the sum of FN and TP, represented as Eq. (9).
Usually, CNN has applied all layers to detect brain tumors. Hence it has used high computation costs. Here in EDLA, the feature extraction and detection can be used with YOLOv3 and ResNet201; thereby computation cost would be less than the CNN algorithm. Hence proposed algorithm has introduced low computation power-based EDLA, and it is to convey that EDLA has gained novelty for the detection of brain tumors.
3.4 Statistical Analysis of Brain Tumor with SPSS Tool
After all performance measures like accuracy, sensitivity, false positive, and false negative for 10 in the count, the SPSS tool was utilized to analyze the performance of both the proposed EDLA algorithm and the existing CNN algorithm. Here independent variable for detecting brain tumors was taken as the sample MRI image size of the dataset. Brain tumor detection dependent variables are used as pixels and labels of images. Brain tumor detection further utilized sub-package SPSS tools like independent t-sample tests and graphics builder to generate intended tables and graphs.
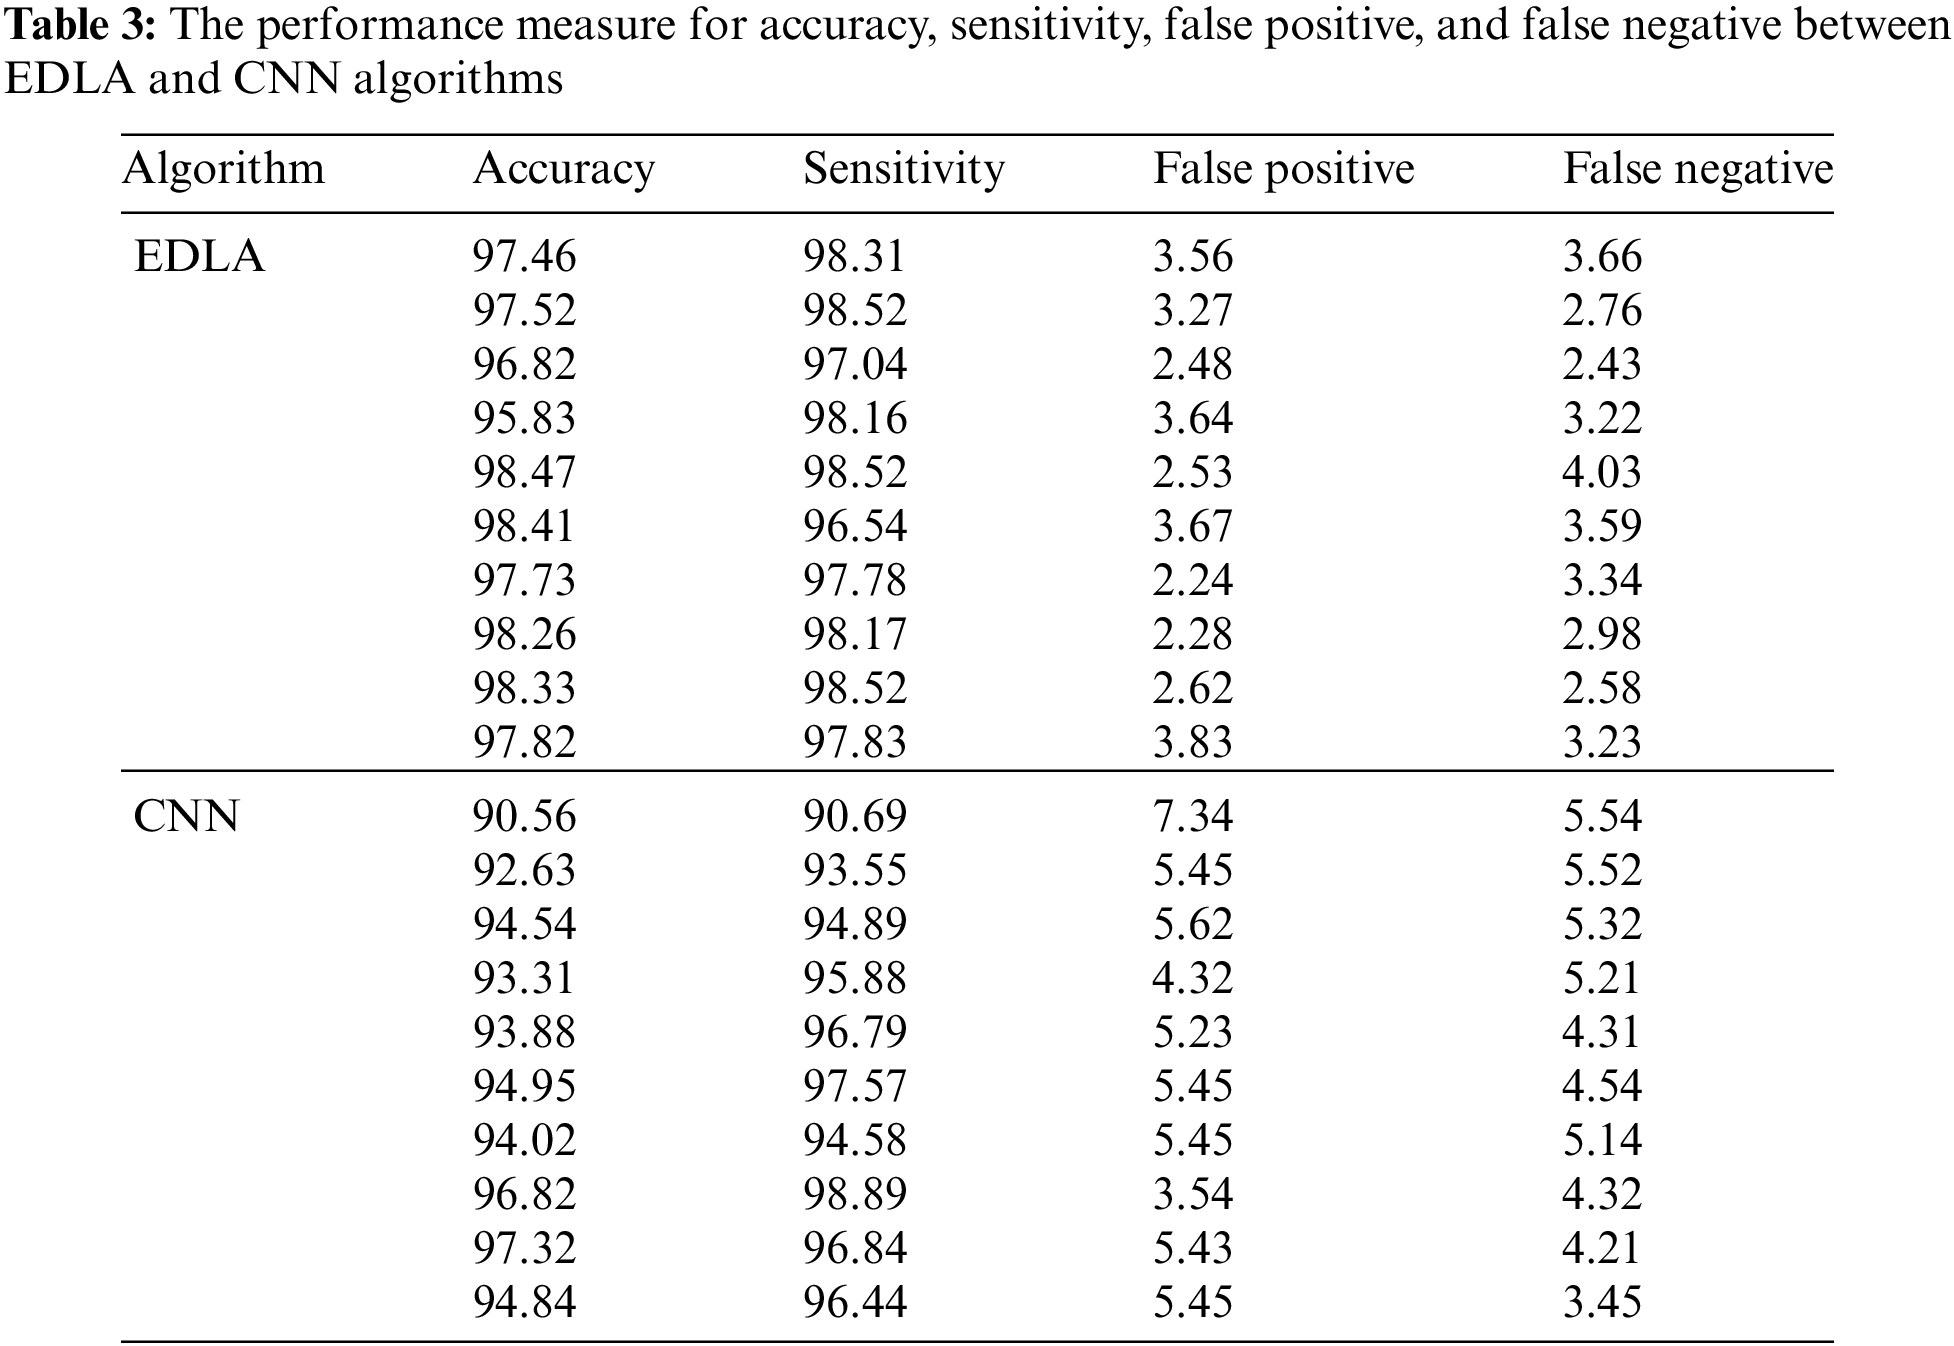
The conducted experiment results were analyzed for performance measures such as accuracy, sensitivity, false positive, and false negative. The performance values for ten iterations for the proposed EDLA and CNN algorithms. The high-performance values of accuracy, sensitivity, false positive, and false negative, respectively, were 98.47%, 98.52%, 2.24%, and 2.43% for the EDLA algorithm. For the CNN algorithm, the high-performance values of accuracy, sensitivity, false positive, and false negative, respectively 97.32%, 97.57%, 3.54%, and 3.45%, were achieved. Table 3 lists the performance value for ten iterations for the experimented algorithms, such as EDLA and CNN, in vertical order.
4.1 Comparison of Accuracy between EDLA and CNN Algorithms
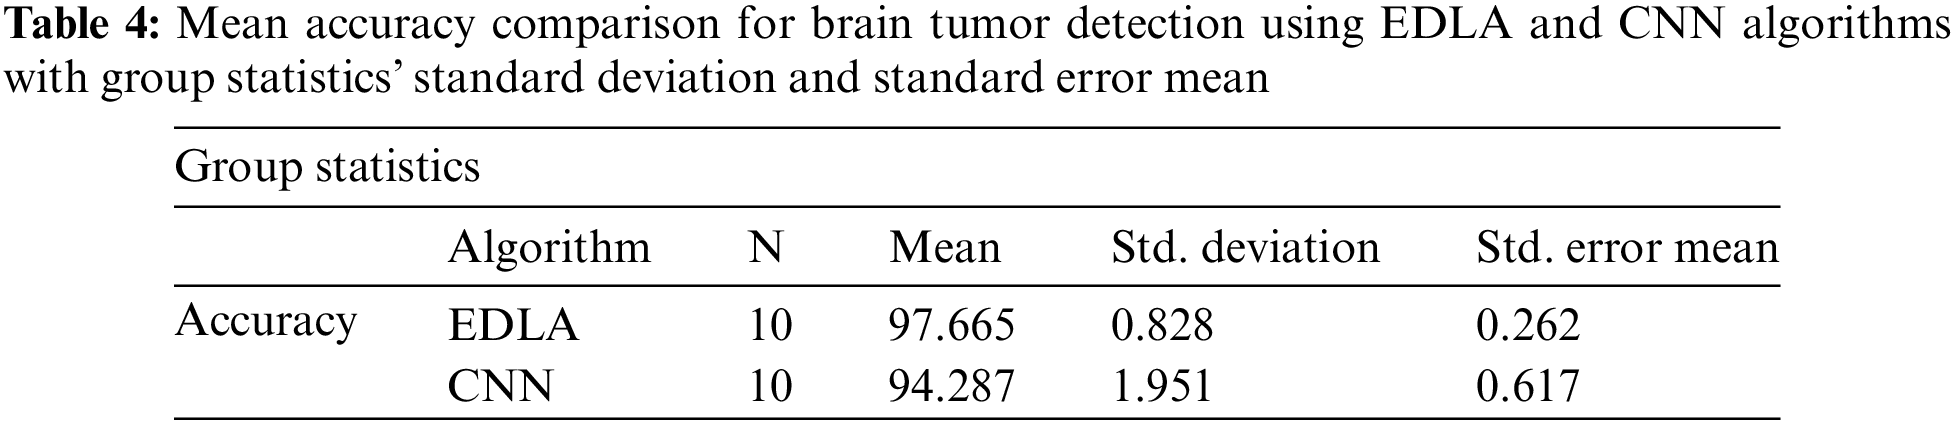
After the results of iterations were noted for accuracy in predicting brain tumors, analysis was carried out with the SPSS analysis tool. For generating group statistics and independent sample test tables, analysing sub-procedure comparing mean independent sample t-test was called to examine ten iterations’ values. Table 4 was generated with group statistics values for algorithms, several iterations, mean, standard deviation, and standard error indicated. It was inferred that the mean accuracy, standard deviation, and standard error mean were 97.665%, 0.828%, and 0.262% for the EDLA algorithm. As compared with CNN group statistics performance parameters’ values, the proposed EDLA algorithm has gained a better.
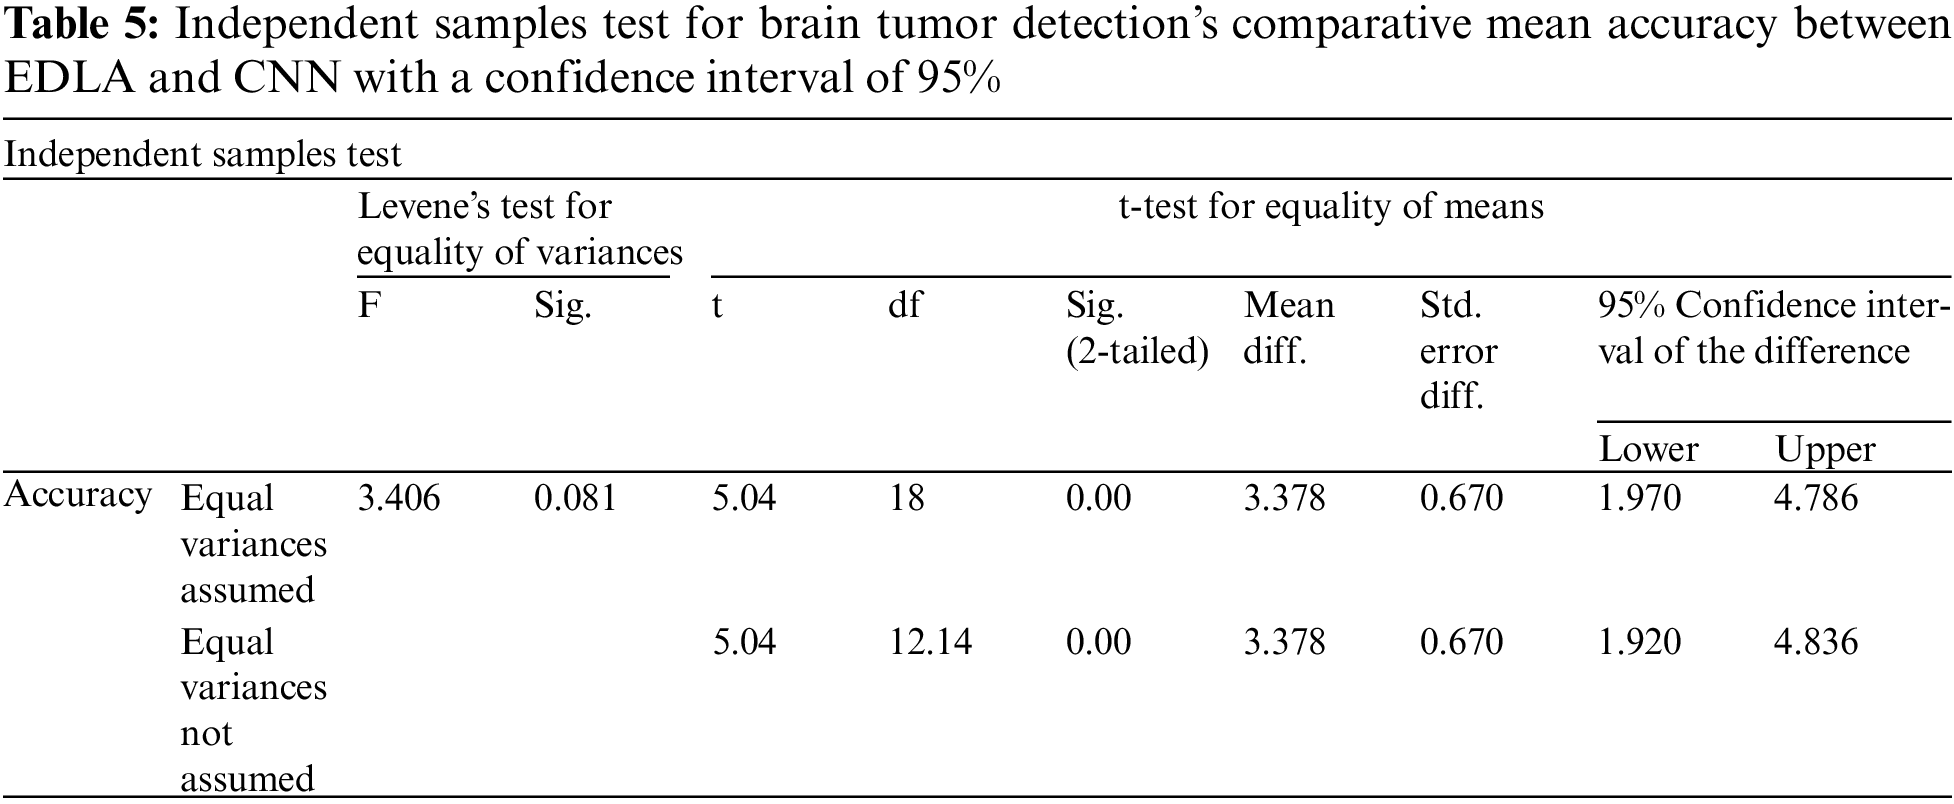
Further, the independent samples test from the t-test was completed for brain tumor detection with the aid of the SPSS tool alongside EDLA and CNN algorithms on mean accuracy. Table 5 lists the sample test performance parameters and their mean accuracy values. The significant difference between EDLA and CNN algorithms was 0.81%, which appears slightly more than the alpha value of 0.05%. Here it was also inferred, and the rest of the parameters like F, t, significance two-tailed, mean difference, df, confidence interval, and standard error difference were also compared between EDLA and CNN algorithms’ mean accuracy. Finally, the inference of this t-test concludes that the EDLA algorithm outperformed than CNN algorithm for predicting brain tumors of the MRI-scanned image dataset.
The SPSS tool was utilized to generate graphical results for mean accuracy to predict the brain tumor in the MRI image dataset. The chart builder utility was deployed with 10 iteration values for mean accuracy with a standard deviation of ±1 and a confidence interval of 95%. From this generated graphical result, it is observed that the mean accuracy of brain tumor detection for the EDLA algorithm appears to be more accurate with less standard error rate than the CNN algorithm. Henceforth EDLA has achieved novelty in detecting brain tumor detection and may be said to be a novel EDLA algorithm concerning brain tumor detection. Fig. 7 shows the mean accuracy comparison and its difference alongside the standard error rate.
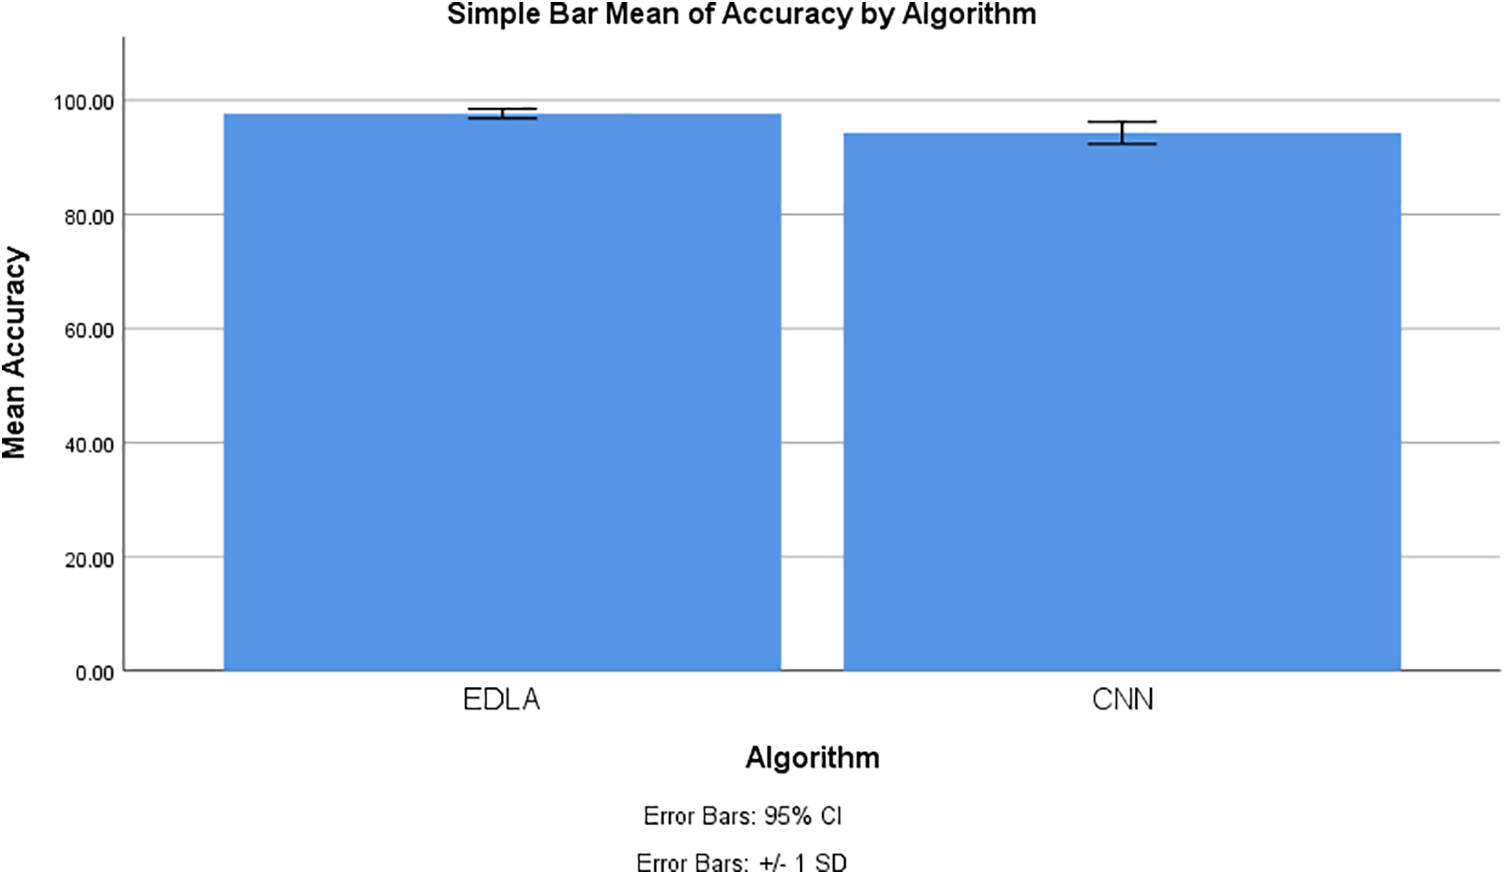
Figure 7: Mean accuracy comparison to detect brain tumors using EDLA and CNN algorithms with a confidence interval of 95% and standard deviation ±1
4.2 Comparison of Sensitivity between EDLA and CNN Algorithms
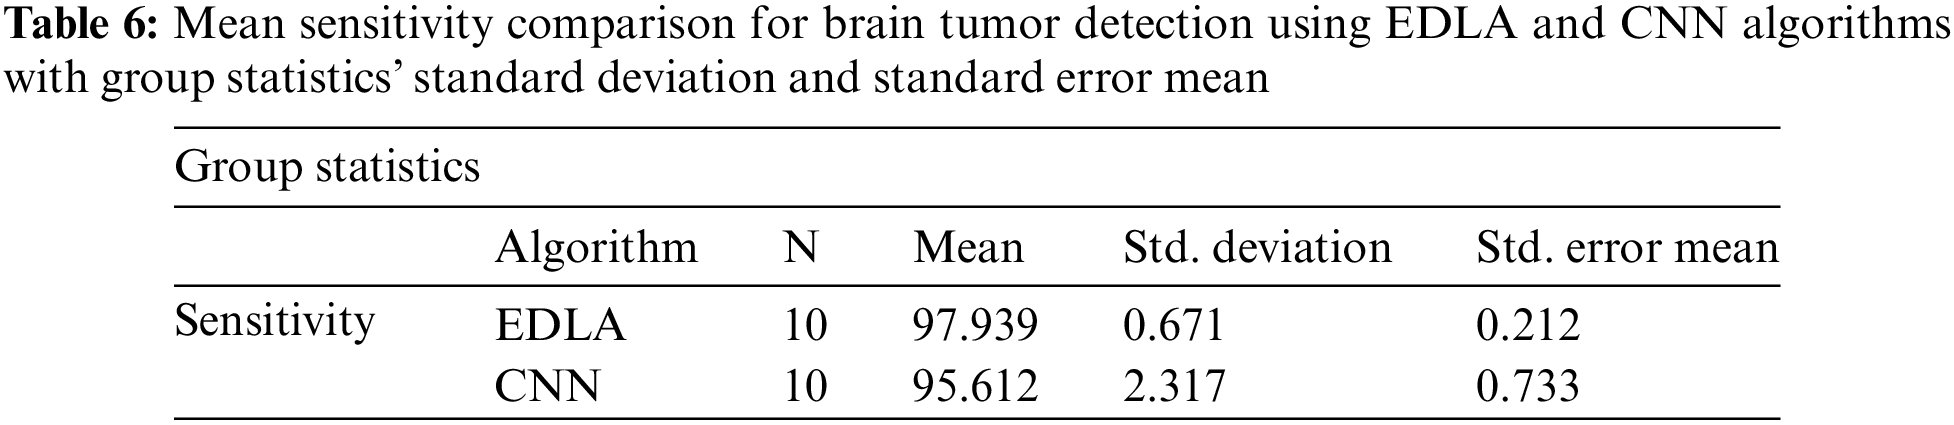
After the results of iterations were noted for sensitivity, analysis was carried out with the SPSS analysis tool. For generating group statistics and independent sample test tables, analyze sub procedure comparing mean independent sample t-test was called to investigate ten iterations’ values. Table 6 was generated with group statistics values for algorithms, several iterations, mean, standard deviation, and standard error mean. It was inferred that the mean sensitivity, standard deviation, and standard error mean are 97.039%, 0.671%, and 0.212% for the EDLA algorithm to predict brain tumors. As compared with CNN group statistics performance parameters’ values, the proposed EDLA algorithm has gained a better.
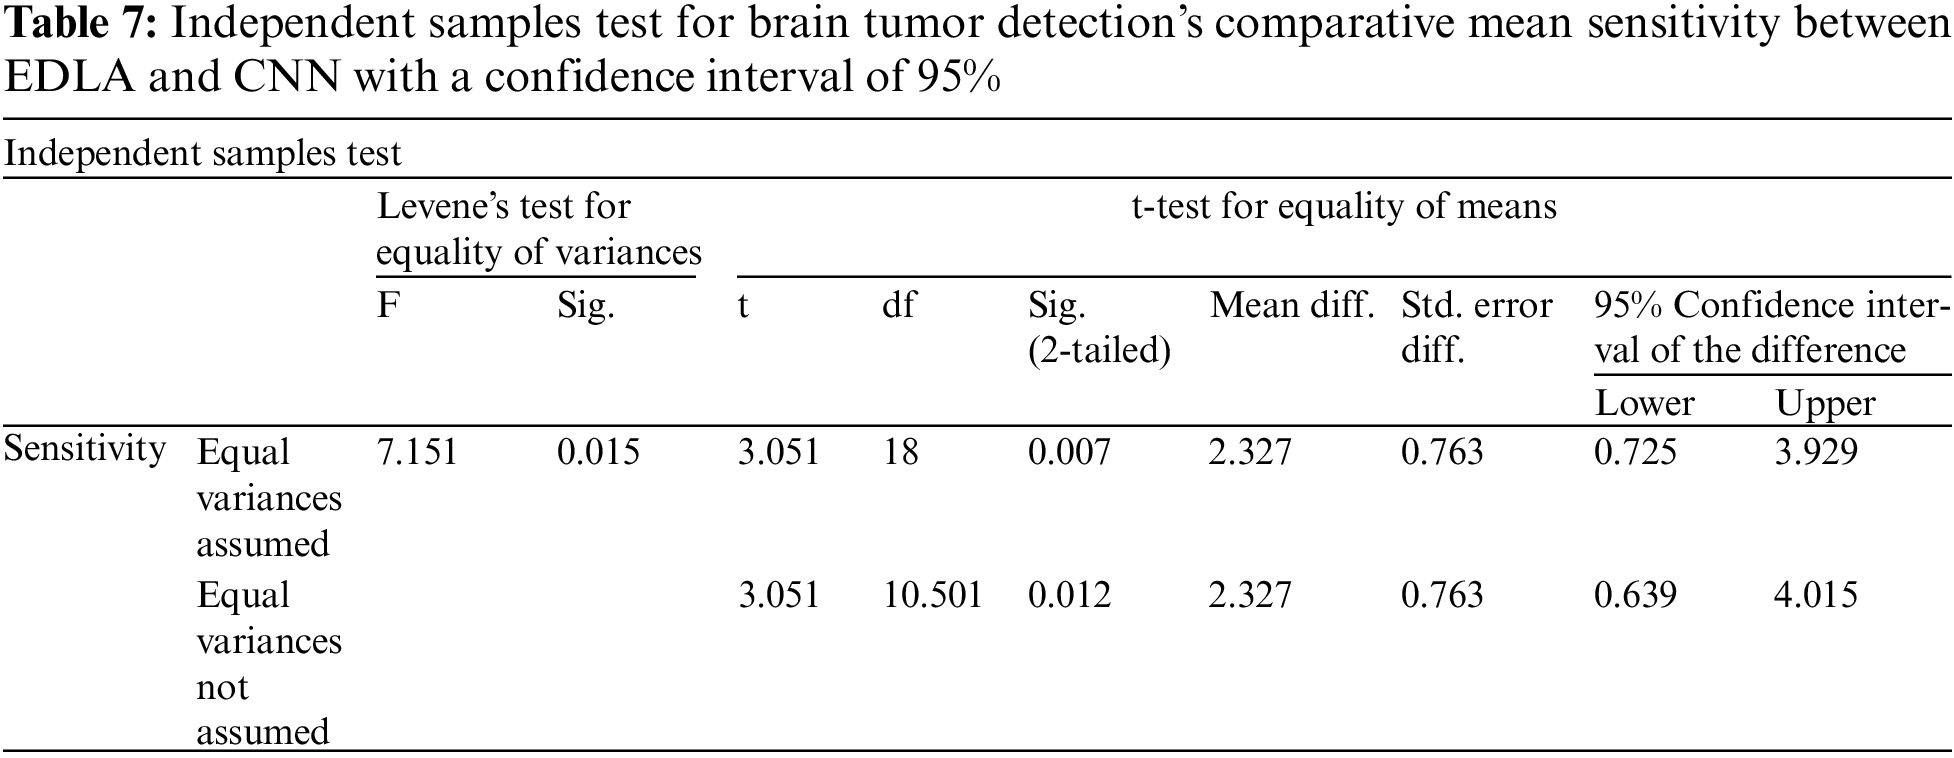
Further, the independent samples test from the t-test was completed for brain tumor detection with the aid of the SPSS tool alongside EDLA and CNN algorithms on mean sensitivity. Table 7 lists the sample test performance parameters alongside its values for mean sensitivity. The significant difference between EDLA and CNN algorithms was 0.015% which appears to be less than the alpha value of 0.05%. Here it was also inferred, and the rest of the parameters like F, t, significance two-tailed, mean difference, df, confidence interval, and standard error difference were also compared between EDLA and CNN algorithms’ mean sensitivity. Finally, the inference of this t-test concludes that the EDLA algorithm outperformed than CNN algorithm for predicting brain tumors of the MRI-scanned image dataset.
The SPSS tool generated graphical results for mean sensitivity to predict the brain tumor in the MRI image dataset. The chart builder utility was deployed with 10 iteration values for mean sensitivity with standard deviation ±2 and a confidence interval of 95%. This generated graphical result shows that the mean sensitivity of brain tumor detection for the EDLA algorithm appears to be more sensitivity gain with less standard error rate than the CNN algorithm. Henceforth EDLA has achieved novelty in detecting brain tumor detection, and it may be said to be a novel EDLA algorithm concerning brain tumor detection. Fig. 8 shows the mean sensitivity comparison and its difference alongside the standard error rate.
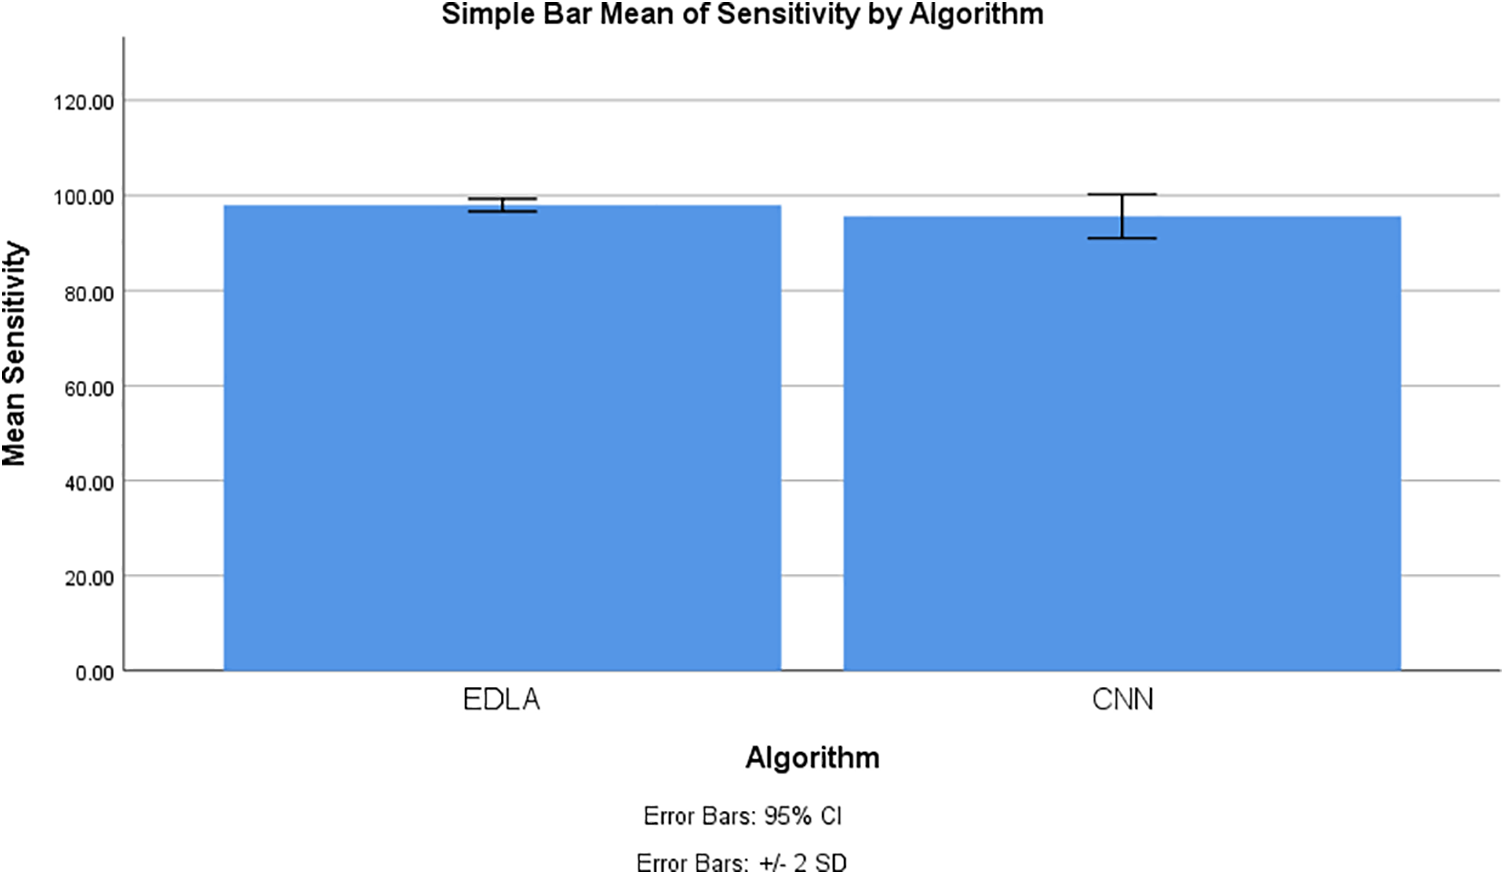
Figure 8: Mean sensitivity comparison to detect brain tumor using EDLA and CNN algorithms with confidence interval 95% and standard deviation ±2
Figs. 7 and 8 claim very clearly that with accuracy and sensitivity to measure the performance of brain tumor detection, the proposed EDLA has somewhat outperformed the CNN algorithm. This claim has been gathered from illustrations in Figs. 7 and 8, also from Tables 4 to 7. Accuracy and sensitivity gained more with the proposed EDLA algorithm, and hence it has produced more novelty than the CNN algorithm.
4.3 Comparison of Mean False Positive between EDLA and CNN Algorithms
After the results of iterations were noted for false positives to predict brain tumors, analysis was carried out with the SPSS analysis tool. For generating group statistics and independent sample test tables, analyze sub procedure comparing mean independent sample t-test was called to investigate ten iterations’ values. Table 8 was generated with group statistics values for algorithms, several iterations, mean, standard deviation, and standard error mean. It was inferred that the mean false positive, standard deviation and standard error mean, respectively, was 3.012%, 0.638%, and 0.202% for the EDLA algorithm. As compared with CNN group statistics performance parameters’ values, the proposed EDLA algorithm has gained a better.

Further, the independent samples test from the t-test was completed for brain tumor detection with the aid of the SPSS tool alongside EDLA and CNN algorithms on mean false positive. Table 9 lists the sample test performance parameters alongside its values for mean false positive. It is inferred that the significant difference between EDLA and CNN algorithms was 0.99% which appears to be more than the alpha value of 0.05%. Here it was also inferred, and the rest of the parameters like F, t, significance two-tailed, mean difference, df, confidence interval, and standard error difference were also compared between EDLA and CNN algorithms’ mean false positive. Finally, the inference of this t-test concludes that the EDLA algorithm outperformed the CNN algorithm for predicting brain tumors of the MRI-scanned image dataset.
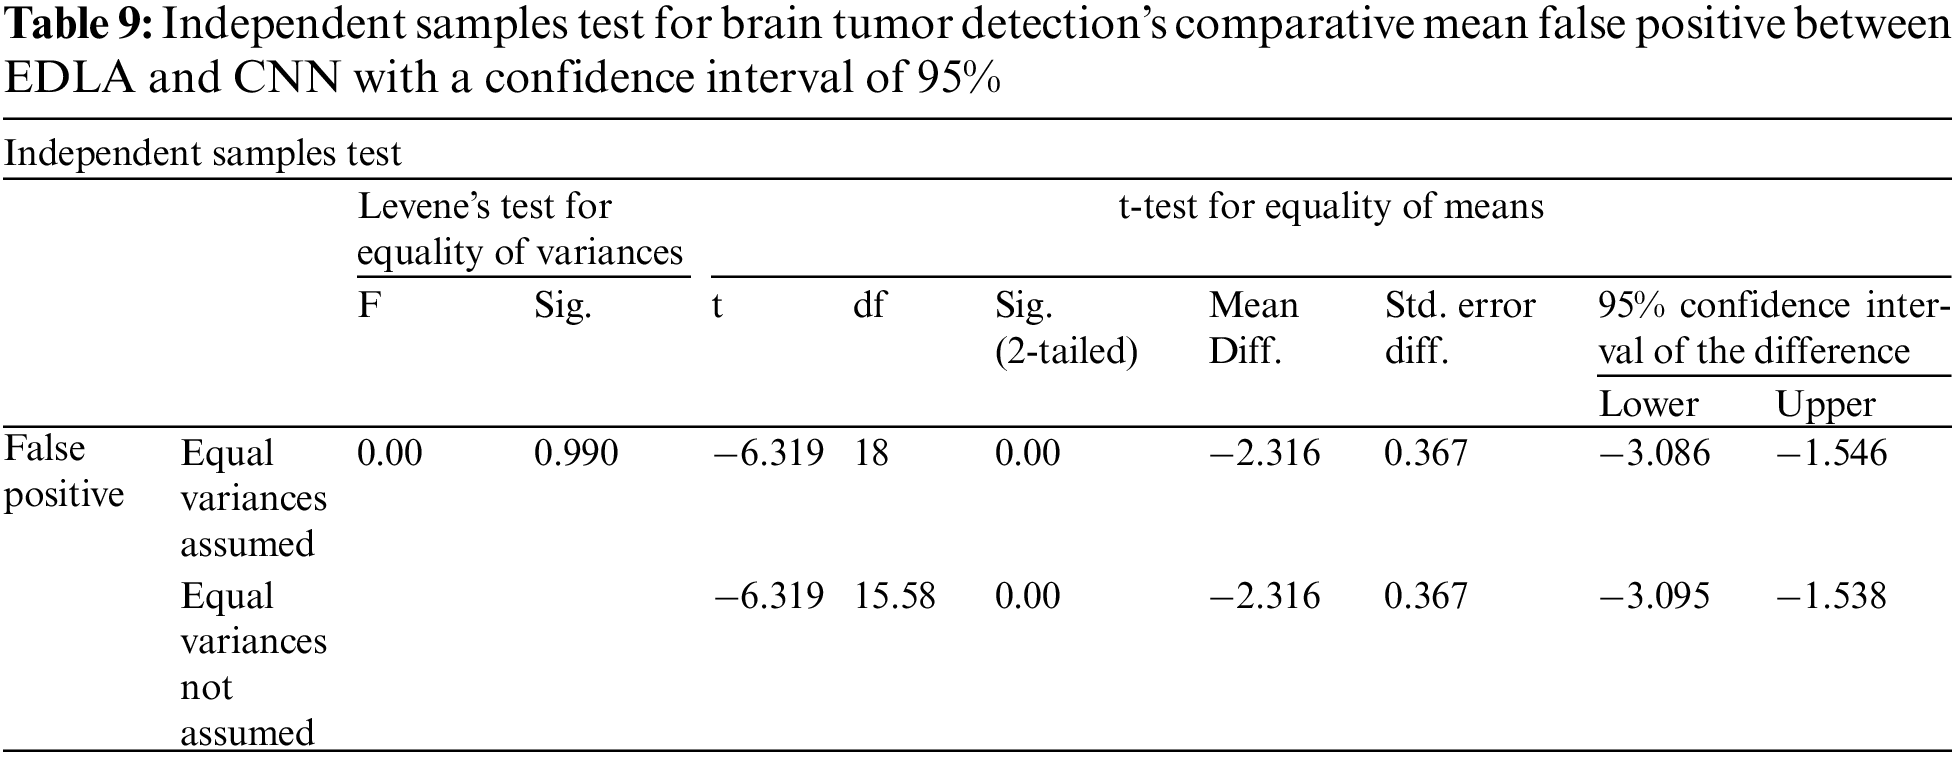
The SPSS tool generated graphical results for mean false positives to predict the brain tumor in the MRI image dataset. The chart builder utility was deployed with 10 iteration values for mean false positive with standard deviation ±2 and confidence interval 95%. This generated graphical result shows that the mean false positive of brain tumor detection for the EDLA algorithm appears to be a weak false positive rate with less standard error rate than the CNN algorithm. Henceforth EDLA has achieved novelty in detecting brain tumor detection and may be said to be a novel EDLA algorithm concerning brain tumor detection. Fig. 9 shows the mean false favorable comparison and its difference alongside the standard error rate.
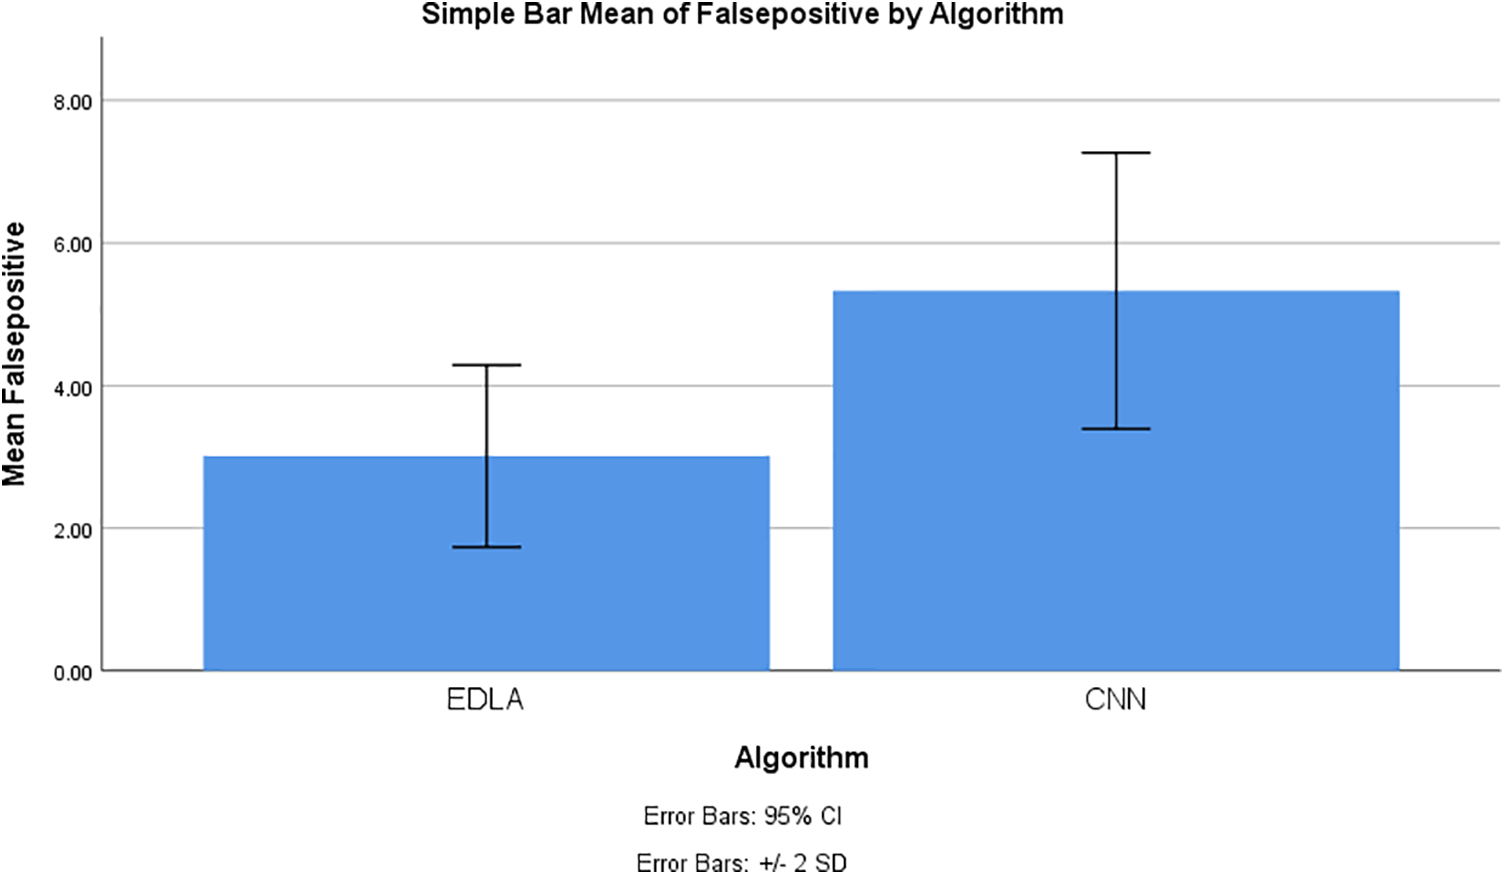
Figure 9: Mean false positive comparison to detect brain tumor using EDLA and CNN algorithms with confidence interval 95% and standard deviation ±2
4.4 Comparison of Mean False Negative between EDLA and CNN Algorithms
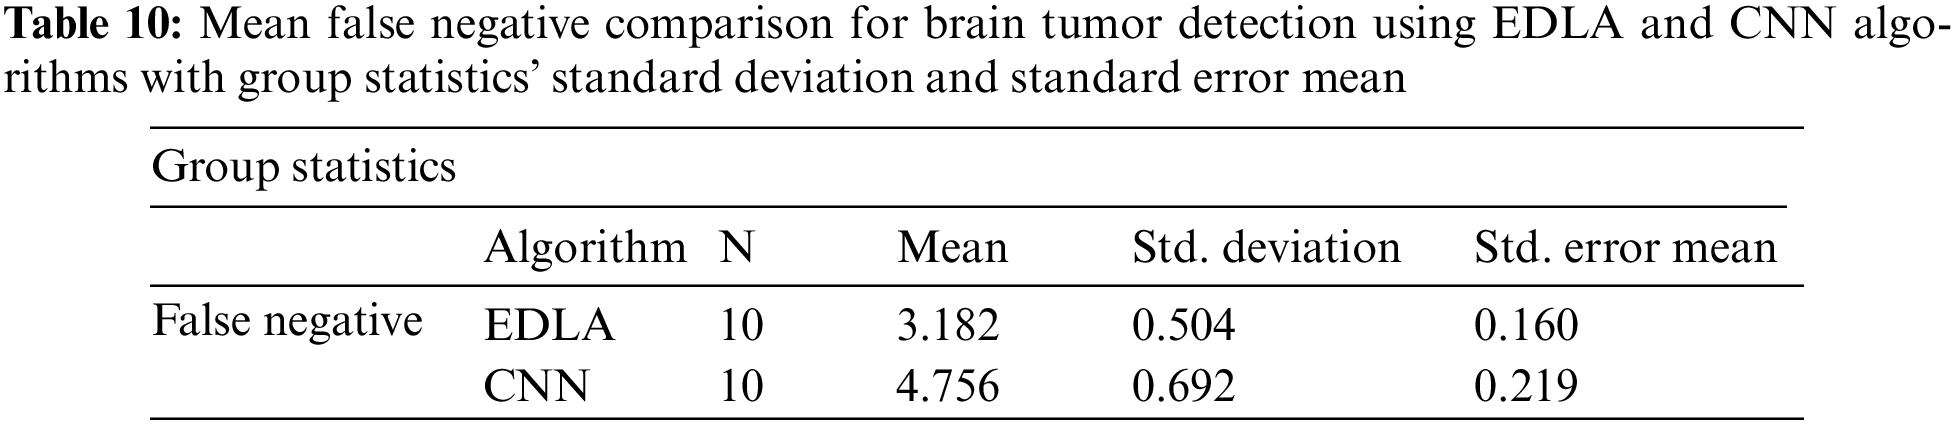
After the results of iterations were noted for false negatives to predict brain tumors, analysis was carried out with the SPSS analysis tool. For generating group statistics and independent sample test tables, analyzing sub-procedure comparing mean independent sample t-test was called to analyze ten iterations’ values. Table 10 was generated with group statistics values for algorithms, several iterations, mean, standard deviation, and standard error mean. It was inferred that the mean false negative, standard deviation, and standard error mean were 3.182%, 0.504%, and 0.160% for the EDLA algorithm. As compared with CNN group statistics performance parameters’ values, the proposed EDLA algorithm has gained a better.
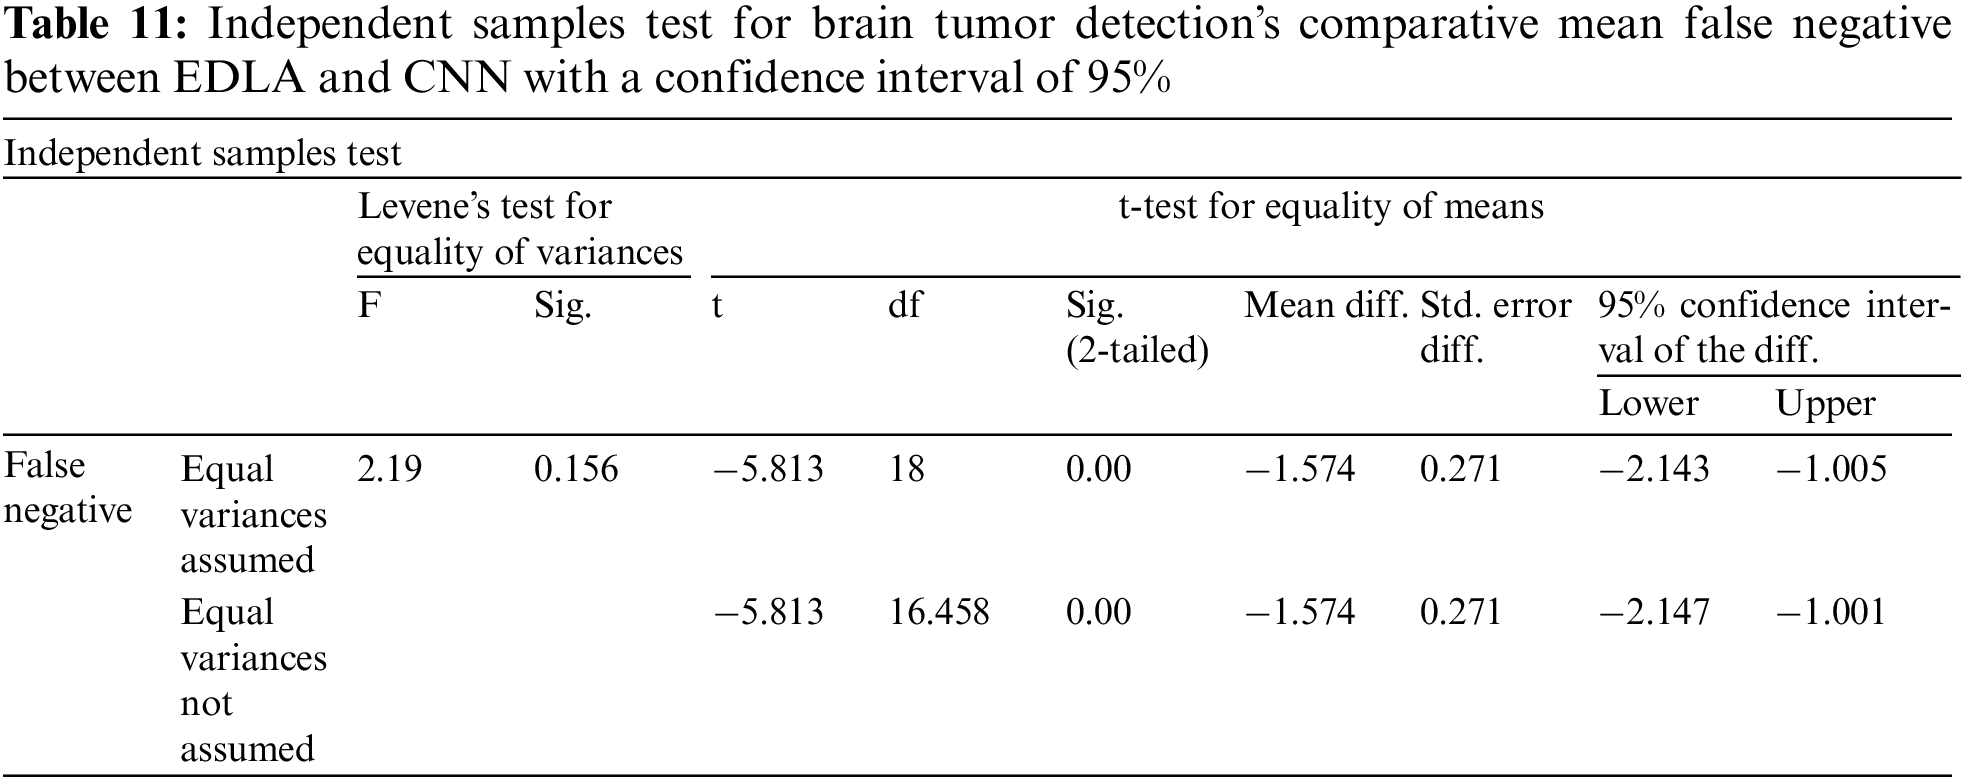
Further, the independent samples test from the t-test was completed for brain tumor detection with the aid of the SPSS tool alongside EDLA and CNN algorithms on the mean false negative. Table 11 lists the sample test performance parameters and their mean false negative values. It is inferred that the significant difference between EDLA and CNN algorithms was 0.156% which appears to be more than the alpha value of 0.05%. Here it was also inferred, and the rest of the parameters like F, t, significance two-tailed, mean difference, df, confidence interval, and standard error difference were also compared between EDLA and CNN algorithms’ mean false negative. Finally, the inference of this t-test concludes that the EDLA algorithm outperformed the CNN algorithm for predicting brain tumors of the MRI-scanned image dataset.
The SPSS tool generated graphical results for mean false negatives to predict the brain tumor in the MRI image dataset. The chart builder utility was deployed with 10 iteration values for mean false negative with standard deviation ±2 and confidence interval 95%. This generated graphical result shows that the mean false negative of brain tumor detection for the EDLA algorithm appears to be less false negative with less standard error rate than the CNN algorithm. Henceforth EDLA has achieved novelty in detecting brain tumor detection, and it may be said to be a novel EDLA algorithm concerning brain tumor detection. Fig. 10 shows the mean false unfavorable comparison and its difference alongside the standard error rate.
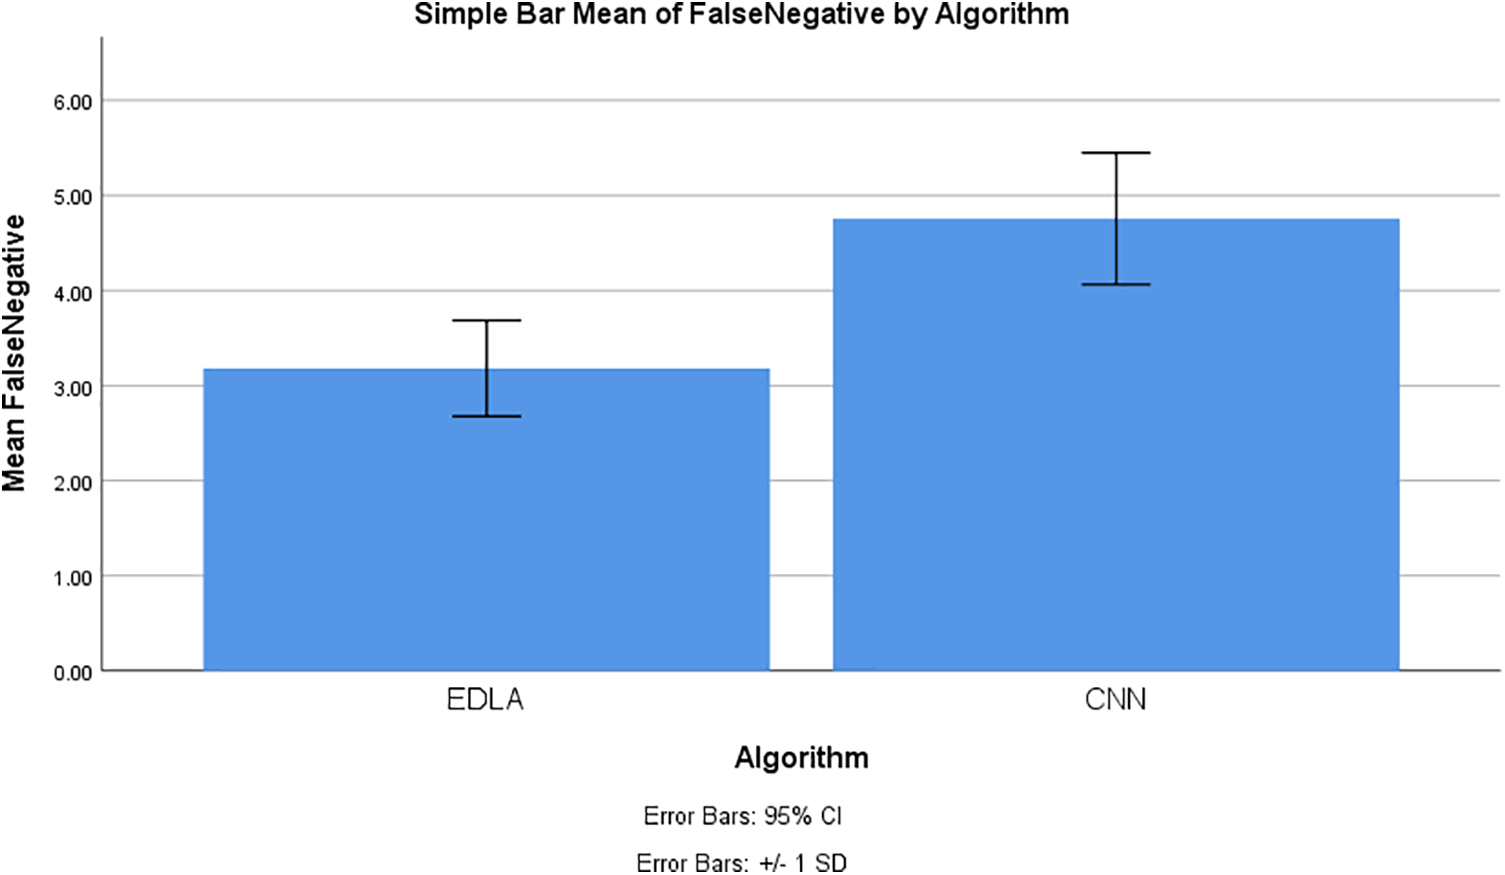
Figure 10: Mean false negative comparison to detect brain tumor using EDLA and CNN algorithms with confidence interval 95% and standard deviation ±1
4.5 Overall Performance Measure Comparison between EDLA and CNN Algorithms
Table 12 lists mean accuracy, mean sensitivity, mean false positive and mean false negative performance parameters alongside their mean values for EDLA and CNN algorithms. It is very likely that the EDLA algorithm has introduced better performance than the CNN algorithm. Hence EDLA has introduced a novelty to detect brain tumors with MRI image datasets.
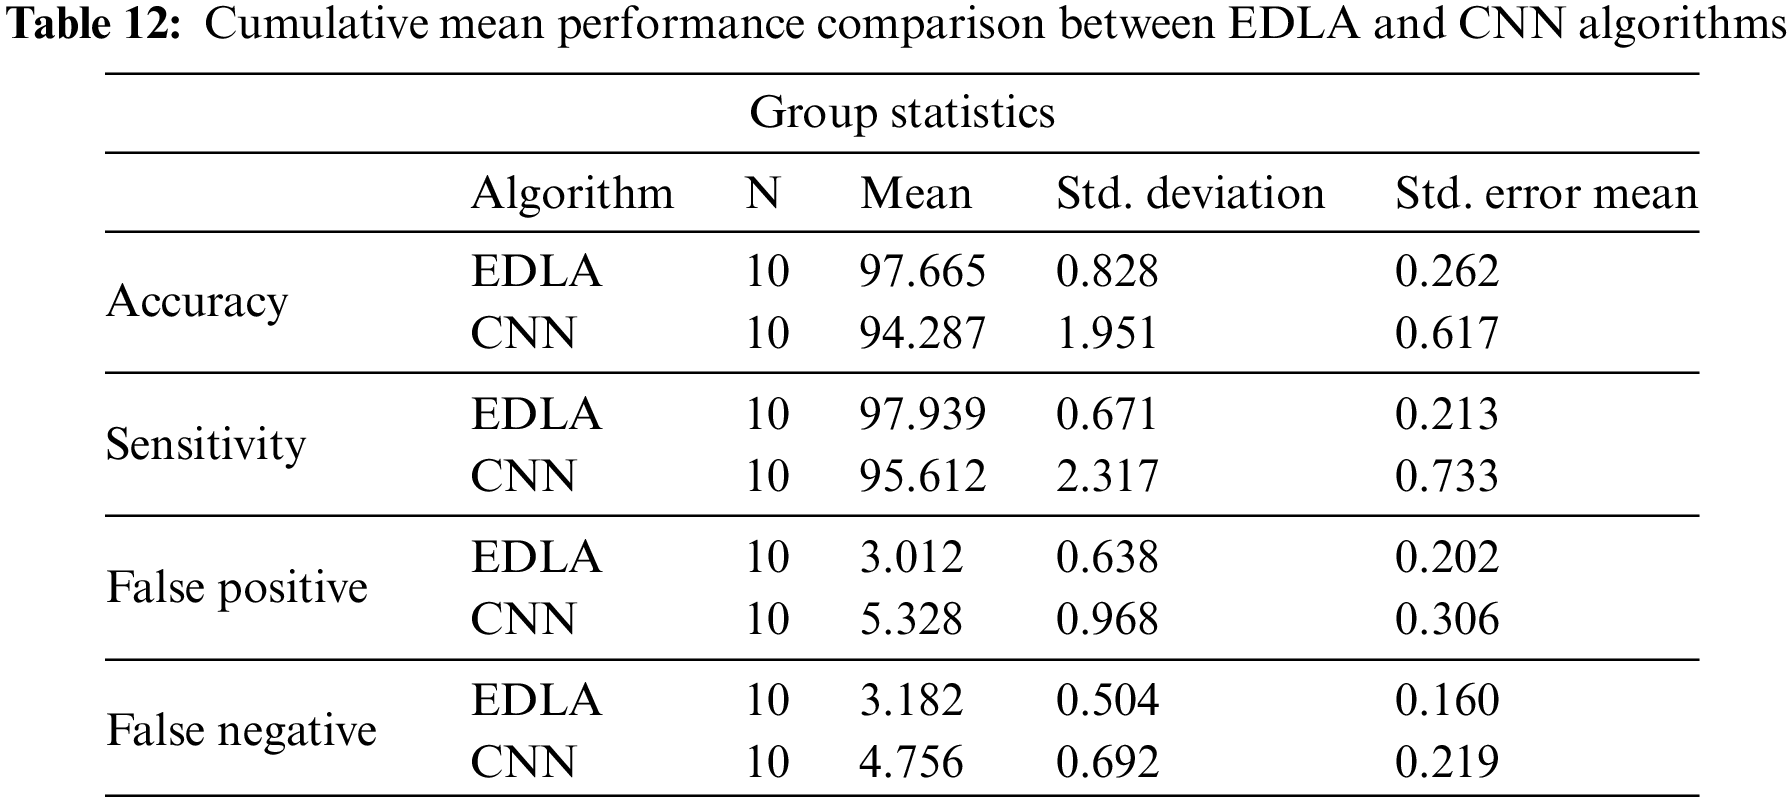
Table 13 lists the cumulative performance measures for mean, accuracy, mean sensitivity, mean false positive, and mean false negative parameters and their values alongside iteration with 10. From this table, it is inferred that the EDLA algorithm gained significantly better than the CNN algorithm. Hence as per the significant difference, the EDLA has over-performed as compared to the CNN algorithm, and thereby EDLA has signed novelty to detect brain tumors detection on MRI image datasets.

Fig. 11 shows the outer performance illustration of the EDLA algorithm over the CN algorithm for mean accuracy, mean sensitivity, mean false positive, and mean negative alongside the standard error, mean standard deviation, and confidence interval of 95% cumulatively. These performance values showed that EDLA was introducing novelty when it was compared with CNN algorithm performance parameter values.
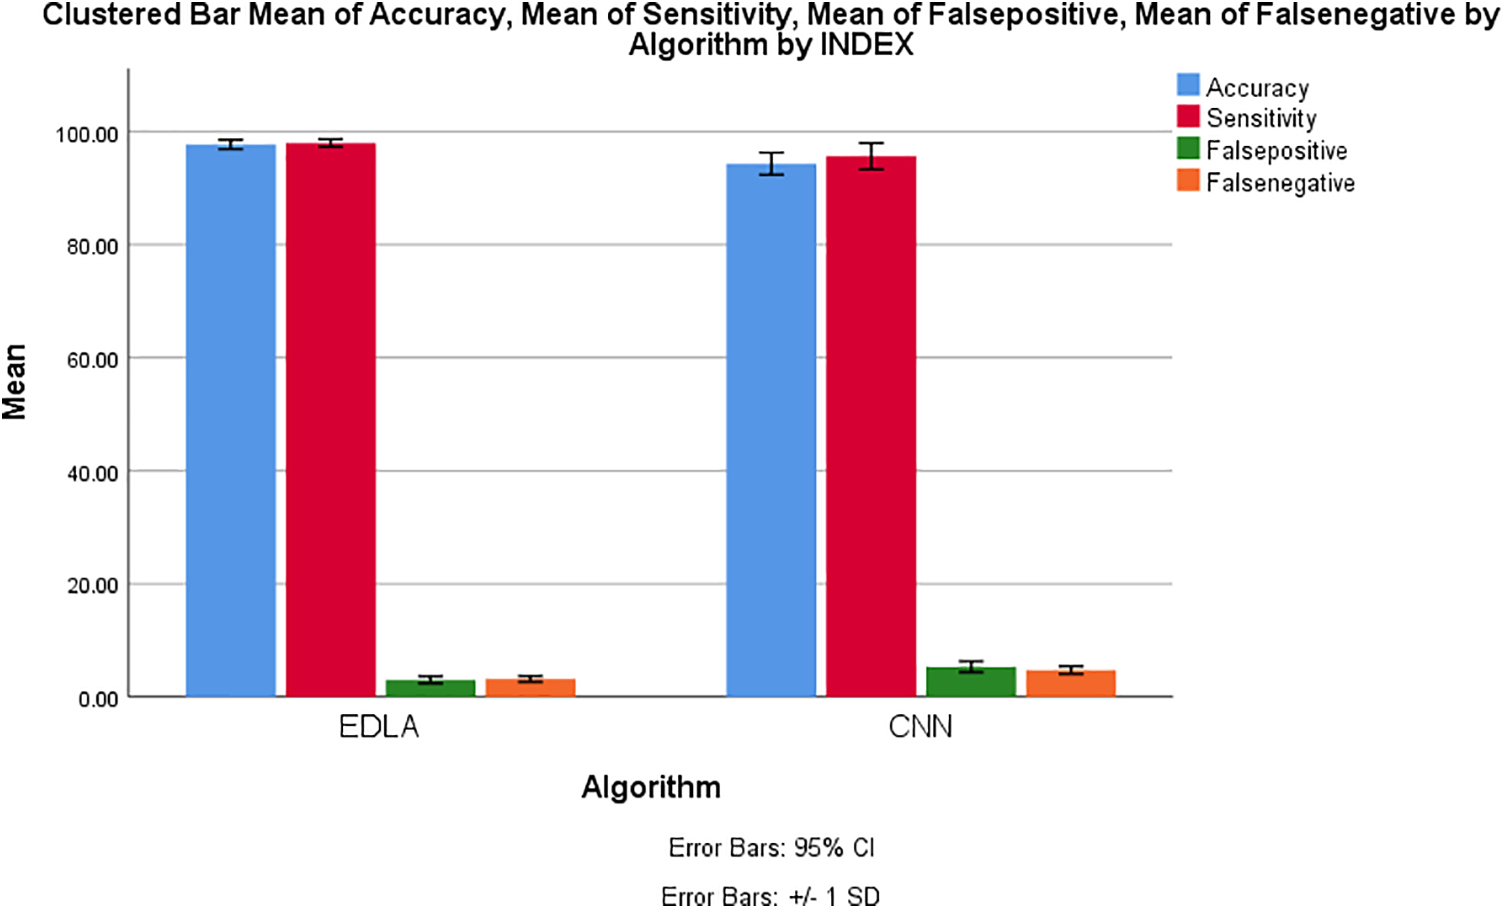
Figure 11: Cumulative performance measure comparison between the EDLA and the CNN algorithms for brain tumor detection
5 A Summary of Analyzed Observation
This research has experimented with a proposed novel EDLA algorithm alongside the CNN algorithm with a repeat count of 10 for mean accuracy, mean sensitivity, mean false positive, and mean false negative. The results have shown that EDLA has gained significantly higher performance for mean accuracy (97.665%), mean sensitivity (97.939%), mean false positive (3.012%) and mean false negative (3.182%) than CNN algorithm performance values. Now it has supposed to be compared with other existing algorithms for brain tumor detection from different work. The proposed experiment compared the CNN performance measures with the proposed EDLA algorithm. Later for the discussion part, similar findings and dissimilar findings were addressed in detail by comparing different algorithms. Table 14 lists various works for brain tumor detection alongside the used dataset of MRI images and accuracy measures. When the accuracy of the EDLA algorithm (98.47) was compared with the Deep CNN algorithm (98%) [5], it is almost a 0.47% difference, a similar finding. A radial basis function SVM has achieved accuracy performance for brain tumor detection at 9.237% [6]. Once again, SVM in work on the target dataset has gained 96.38% [8]. The LSTM and DWT-based CNN have gained 93.8% [7] accuracy in detecting brain tumors. Yet another work of CNN to detect brain tumors alongside NN had gained 84.19% and 93.68%, respectively [9].
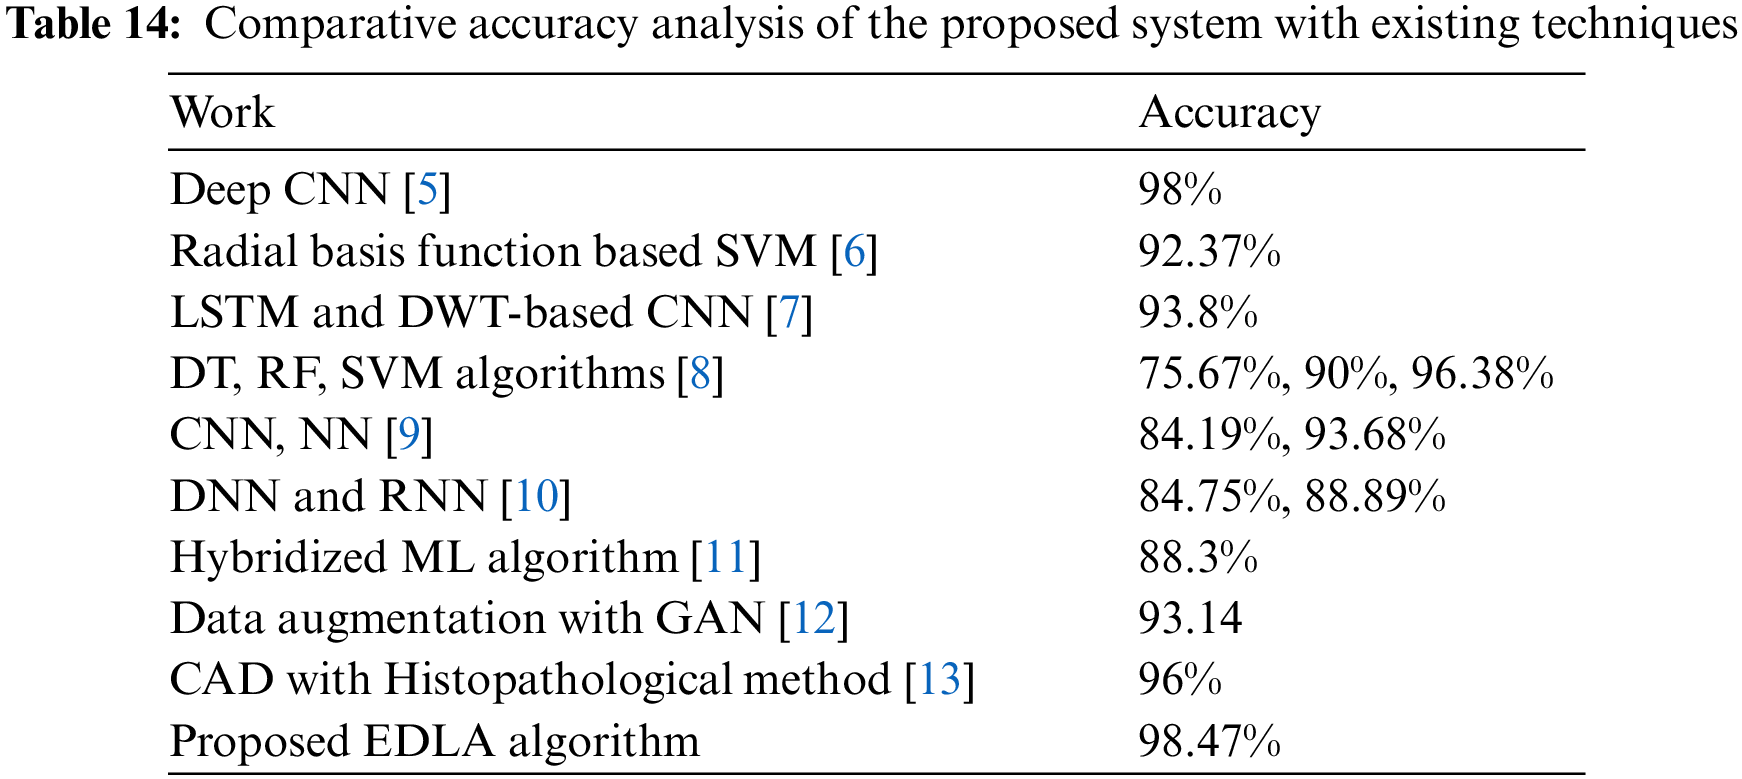
Work on three class brain tumor datasets has used DNN and RNN, and the accuracy gained was achieved at 84.75% and 88.89%, respectively [10]. The hybridized ML algorithm [11] on a multi-parametric MRI dataset has performed well with an accuracy of 88.3%. Dissimilarly, Data augmentation with GAN [12] has gained brain tumor detection accuracy of 93.14% with an actual image dataset. Finally, CAD with the Histopathological method [13] has achieved 96% accuracy on 32 whole slides scanned images. From these, all performance comparisons of difference work have inferred that the proposed algorithm has gained better accuracy, and hence it is claiming the novelty of brain tumor detection work. As per accuracy improvement and light complex instruction of the proposed algorithm claim, it can be considered novel.
Usually, measures such as accuracy, precision, false positive, false negative etc., have been used to validate the performance of any algorithm; here, for this work, Algorithm 1 has comparatively gained 4% more than the existing CNN. Thus, there was a novelty considered to be claimed. However, most medical diagnosis work has yet to introduce cost-utilizing time. But still, the cost of using time and testing one sample would be based on the processor speed and memory size of the system: right now above-set comment lags with the proposed EDLA algorithm for brain tumor detection.
In summary, it was evident that the base marginal effect of the proposed algorithm has gained 2.5% with CAD with the Histopathological method [13] and the best effective gain of 23% approximately with DT [8] for the brain tumor dataset with training and testing [5–8].
A brain tumor is a disease that spreads unnoticeably in human beings and would lead the dead as a result. It is essential to identify the threat’s early stages to safeguard the general public’s valuable life. Even some specialists in the medical field are well versed in detecting and cure some extent manually. Some machine-automated techniques have been introduced in the technical world for the past two decades. Still, to detect brain tumor disease accurately and precisely, the a requirement to find out the fine-tuning mechanisms in medical research. In this proposed work, an EDLA algorithm has been coined to detect brain tumors precisely. The performance measures such as accuracy, sensitivity, false positive, and false negative have been measured cumulatively for ten counts for both proposed EDLA and existing CNN algorithms. With the help of carried out the experiment, the mean performance measures for the proposed EDLA algorithm were calculated, and those measured were accuracy (97.665%), sensitivity (97.939%), false positive (3.012%), and false negative (3.182%) for ten iterations. It is noticed that the EDLA algorithm showed an overwhelming performance sign over the CNN algorithm as it had gained accuracy, sensitivity, false positive and false negative at 94.287%, 95.612%, 5.328% and 4.756%, respectively. Later the same results were compared with various mechanisms; those algorithms were measured accurately to detect brain tumors. The strength of this proposal is that this work has gained considerable effect on brain tumor detection for the EDLA algorithm than the existing algorithms and thus achieved novelty with LeakyReLU activation function on the EDLA algorithm. The limitation of this method is that it could have been more effective with blurred image-based datasets and lag of automation.
In the future, the same work could be extended to automate real-time patients with a dynamic passion. To this extent, it is essential to survey and coin wearable sensor-based automation of brain tumor detection supposed to be tried. On the other hand, a multi-cancer detection mechanism has to be tried on a wearable sensor basis. Additionally, in the future, drone setups may be adapted for brain tumor detection for online medical diagnosis systems and EndoCervical Curettage (ECC) signal-based Armani activities. Furthermore, advanced DL based models can also be assessed and incorporate the classification and prediction of brain tumor diagnosis.
Acknowledgement: Mohd Anul Haq would like to thank the Deanship of Scientific Research at Majmaah University for supporting this work under Project No. R-2023-23.
Funding Statement: This work was supported by Project No. R-2023-23 of the Deanship of Scientific Research at Majmaah University.
Author Contributions: Study conception and design: M. Adimoolam, K. Maithili, N. M. Balamurugan; data collection: R. Rajkumar, S. Leelavathy; analysis and interpretation of results: M. Adimoolam, Raju Kannadasan, Mohd Anul Haq; draft manuscript preparation: K. Maithili, Ilyas Khan, ElSayed M. Tag El Din, Arfat Ahmad Khan. All authors reviewed the results and approved the final version of the manuscript.
Availability of Data and Materials: The data that support the findings of this study are available from the corresponding author, Mohd Anul Haq, upon reasonable request.
Conflicts of Interest: The authors declare that they have no conflicts of interest to report regarding the present study.
References
1. D. Rastogi, P. Johri, and V. Tiwari, “Brain tumor segmentation and tumor prediction using 2D-VNet deep learning architecture,” in Proc. SMART, Moradabad, India, 2021, pp. 723–732. [Google Scholar]
2. A. Sinha, R. P. Aneesh, M. Suresh, R. N. Mohan, D. Abinaya and A. G. Singerji, “Brain tumor detection using deep learning,” in Proc. ICBSII, 2021, pp. 1–5. [Google Scholar]
3. G. Loveleen, B. Mohan, R. Tanvi, M. Saurav, and Z. Zhongming, “Explanation-driven deep learning model for prediction of brain tumor status using MRI image data,” Front. Genet., vol. 13, pp. 822666, 2022. doi: 10.3389/fgene.2022.822666. [Google Scholar] [PubMed] [CrossRef]
4. A. Sekhar, S. Biswas, R. Hazra, A. K. Sunaniya, A. Mukherjee and L. Yang, “Brain tumor classification using fine-tuned GoogLeNet features and machine learning algorithms: IoMT enabled CAD system,” IEEE J. Biomed. Health Inform., vol. 26, no. 3, pp. 983–991, 2022. doi: 10.1109/JBHI.2021.3100758. [Google Scholar] [PubMed] [CrossRef]
5. S. Bhuvaji, A. Kadam, P. Bhumkar, S. Dedge, and S. Kanchan, “Brain tumor classification (MRI),” Kaggle Dataset, vol. 1, no. 1, pp. 1–2, 2020. [Google Scholar]
6. A. A. Isaza and L. M. Jiménez, “Data augmentation and transfer learning for brain tumor detection in magnetic resonance imaging,” IEEE Access, vol. 10, pp. 23217–23233, 2022. doi: 10.1109/ACCESS.2022.3154061. [Google Scholar] [CrossRef]
7. M. Rizwan, A. Shabbir, A. R. Javed, M. Shabbir, T. Baker and D. Al-Jumeily Obe, “Brain tumor and glioma grade classification using gaussian convolutional neural network,” IEEE Access, vol. 10, pp. 29731–29740, 2022. doi: 10.1109/ACCESS.2022.3153108. [Google Scholar] [CrossRef]
8. Y. Liu et al., “Deep C-LSTM neural network for epileptic seizure and tumor detection using high-dimension EEG signals,” IEEE Access, vol. 8, pp. 37495–37504, 2020. doi: 10.1109/ACCESS.2020.2976156. [Google Scholar] [CrossRef]
9. J. Kang, Z. Ullah, and J. Gwak, “MRI-based brain tumor classification using ensemble of deep features and machine learning classifiers,” Sens., vol. 21, no. 6, pp. 2222, 2021. doi: 10.3390/s21062222. [Google Scholar] [PubMed] [CrossRef]
10. H. Kutlu and E. Avcı, “A novel method for classifying liver and brain tumors using convolutional neural networks discrete wavelet transform and long short-term memory networks,” Sens., vol. 19, no. 9, pp. 1992, 2021. doi:10.3390/s19091992. [Google Scholar] [PubMed] [CrossRef]
11. S. Ahmad and P. K. Choudhury, “On the performance of deep transfer learning networks for brain tumor detection using MR images,” IEEE Access, vol. 10, pp. 59099–59114, 2022. doi: 10.1109/ACCESS.2022.3179376. [Google Scholar] [CrossRef]
12. N. Noreen, S. Palaniappan, A. Qayyum, I. Ahmad, M. Imran and M. Shoaib, “A deep learning model based on concatenation approach for the diagnosis of brain tumor,” IEEE Access, vol. 8, pp. 55135–55144, 2020. doi: 10.1109/ACCESS.2020.2978629. [Google Scholar] [CrossRef]
13. P. Khan et al., “Machine learning and deep learning approaches for brain disease diagnosis: Principles and recent advances,” IEEE Access, vol. 9, pp. 37622–37655, 2021. doi: 10.1109/ACCESS.2021.3062484. [Google Scholar] [CrossRef]
14. B. Deepa, M. Murugappan, M. G. Sumithra, M. Mahmud, and M. S. Al-Rakhami, “Pattern descriptors orientation and MAP firefly algorithm based brain pathology classification using hybridized machine learning algorithm,” IEEE Access, vol. 10, pp. 3848–3863, 2022. doi: 10.1109/ACCESS.2021.3100549. [Google Scholar] [CrossRef]
15. C. Han et al., “Combining noise-to-image and image-to-image GANs: Brain MR image augmentation for tumor detection,” IEEE Access, vol. 7, pp. 156966–156977, 2019. doi: 10.1109/ACCESS.2019.2947606. [Google Scholar] [CrossRef]
16. H. Su, F. Xing, and L. Yang, “Robust cell detection of histopathological brain tumor images using sparse reconstruction and adaptive dictionary selection,” IEEE Trans. Med. Imaging, vol. 35, no. 6, pp. 1575–1586, 2016. doi: 10.1109/TMI.2016.2520502. [Google Scholar] [PubMed] [CrossRef]
17. W. Wang, F. Bu, Z. Lin, and S. Zhai, “Learning methods of convolutional neural network combined with image feature extraction in brain tumor detection,” IEEE Access, vol. 8, pp. 152659–152668, 2020. doi: 10.1109/ACCESS.2020.3016282. [Google Scholar] [CrossRef]
18. P. Windisch et al., “Machine learning for the detection and segmentation of benign tumors of the central nervous system: A systematic review,” Cancers, vol. 14, no. 11, pp. 2676, 2022. doi: 10.3390/cancers14112676. [Google Scholar] [PubMed] [CrossRef]
19. F. J. D. Pernas, M. M. Zarzuela, M. A. Rodríguez, and D. G. Ortega, “A deep learning approach for brain tumor classification and segmentation using a multiscale convolutional neural network,” Healthcare, vol. 9, no. 2, pp. 153, 2021. doi: 10.3390/healthcare9020153. [Google Scholar] [PubMed] [CrossRef]
20. M. Aamir et al., “A deep learning approach for brain tumor classification using MRI images,” Comput. Electr. Eng., vol. 101, no. 1, pp. 108105, 2022. doi: 10.1016/j.compeleceng.2022.108105. [Google Scholar] [CrossRef]
21. K. Kavin Kumar et al., “Brain tumor identification using data augmentation and transfer learning approach,” Comput. Syst. Sci. Eng., vol. 46, no. 2, pp. 1845–1861, 2023. doi: 10.32604/csse.2023.033927. [Google Scholar] [CrossRef]
Cite This Article
 Copyright © 2024 The Author(s). Published by Tech Science Press.
This work is licensed under a Creative Commons Attribution 4.0 International License , which permits unrestricted use, distribution, and reproduction in any medium, provided the original work is properly cited.
 Downloads
 Citation Tools