
 Submit a Paper
 Propose a Special lssue
 Open Access
ARTICLE

Leveraging Segmentation for Potato Plant Disease Severity Estimation and Classification via CBAM-EfficientNetB0 Transfer Learning
1 University School of Information, Communication & Technology, Guru Gobind Singh Indraprastha University, Dwarka, New Delhi, 110078, India
2 Division of Plant Pathology, Indian Agricultural Research Institute, Indian Council of Agricultural Research, New Delhi, 110012, India
* Corresponding Author: Kajal Kaul. Email:
(This article belongs to the Special Issue: Advances in Artificial Intelligence for Engineering and Sciences)
Journal on Artificial Intelligence 2025, 7, 451-468. https://doi.org/10.32604/jai.2025.070773
Received 23 July 2025; Accepted 19 September 2025; Issue published 06 November 2025
 View Full Text
 Download PDF
Abstract
In agricultural farms in India where the staple diet for most of the households is potato, plant leaf diseases, namely Potato Early Blight (PEB) and Potato Late Blight (PLB), are quite common. The class label Plant Healthy (PH) is also used. If these diseases are not identified early, they can cause massive crop loss and thereby incur huge economic losses to the farmers in the agricultural domain and can impact the gross domestic product of the nation. This paper presents a hybrid approach for potato plant disease severity estimation and classification of diseased and healthy leaves, combining the strengths of classical image processing, computer vision, and deep learning. We propose a pipeline that initially employs OpenCV’s cv2 led color-based image segmentation to isolate and highlight diseased brown, yellow-colored lesions or regions and healthy green colored lesion areas associated with various potato leaf diseases. Adaptive Thresholding for illumination and texture feature extraction and U-Net Segmentation for mask refinement for severity estimation. It has a mathematical framework for quantifying the severity based on the spatial area distribution of these regions. This allows for both visual representation of the segmented regions in the form of overlay masks and quantification of distinct disease severity. We detail the implementation of the approach, including color space selection, segmentation strategies, mask creation, area calculation, and a potential mathematical model for severity calculation. Overlay masks generated are then used as input to a CBAM-EfficientNetB0 model, leveraging transfer learning for improved classification accuracy and efficiency. For the Plant Village dataset, the test accuracy achieved is 0.99, whereas the test loss is 0.02, respectively. For the Plant Doc dataset, the test accuracy achieved is 0.97, whereas the test loss is 0.06, respectively. Also, the CBAM attention mechanism model lays emphasis on relevant features within the lesions and overall image context. The results achieved with the Plant Village dataset are slightly better in comparison to the Plant Doc dataset.Keywords
Potato, also known as Solanum tuberosum L., is an everyday staple in most households worldwide, providing a crucial source of carbohydrates and nutrients. However, potato plants are vulnerable to several diseases that significantly decrease productivity and quality. Early and precise detection of diseases is important to implement the control measures and lower economic loss. Conventional diagnosis of diseases relied on visual inspection, which is an error-prone and tedious process. Techniques like DL and Computer vision are better ways for automated disease detection. DL models like Convolution Neural Network and its variants have achieved humungous success in image classification, including potato plant disease identification. Though large datasets and significant computational resources require transfer learning, comprising a model that is pre-trained and is optimised on a new dataset, provides a more time-efficient and effective approach. Our method leverages cv2 color-based segmentation and adaptive thresholding to isolate and highlight lesion areas associated with different potato diseases for severity estimation. This processed image, i.e., the overlay merged masks, serves as input to the U-Net segmentation model for generating refined ground truth masks for calculating severity. Further, an attention-enabled CBAM-EfficientNetB0 model that has been fine-tuned using transfer learning helped classify the three classes. This particular approach allows the model to emphasise the relevant features of disease symptoms, leading to improved classification accuracy. The datasets used for the above approach were the Plant Village and the Plant Doc datasets. It was observed that the Plant Village dataset performed better in terms of performance metrics. The computational requirements have been discussed in the proposed system requirements. The dataset acquired, pre-processed, image segmentation, overlay mask visualisation, U-Net segmentation, severity estimation and classification for both the datasets have been discussed extensively in the Implementation section. The framework provided a combined classification and severity estimation of potato plant diseases.
The motivation behind this research framework developed in this paper is to address the need to help farmers in the identification of potato leaf disease and its severity. This can be achieved via visualising the potato plant overlays and leveraging them for potato plant disease severity estimation and classification. The aim is to help the agriculturists and farmers in enhancing their yields by letting them know the severity of potato plant leaves and giving them accurate classification results. The research utilises techniques such as image segmentation, utilising colour thresholding for colour-based feature extraction and adaptive thresholding for light feature. The colour range definition, binary mask generation, and colored overlay masks generation using OpenCV’s library called cv2. It helped in achieving excellent visualisation of individually colored potato overlay leaf masks. These brown, yellow, and green images were further checked for severity, given the fact that brown and yellow depicted severity and the green part of the leaf is healthy. The lighting feature was also catered to in the adaptive masks generated. Hence, severity estimation was attained by combining colored masks and adaptive thresholding masks. The same set of ground truth images was then classified using a CBAM-based EfficientNetB0 Transfer Learning model. This framework is highly useful for farmers to understand the potato leaf disease classification, and it also helps to measure the severity of various leaves. It is an effort to help farmers enhance their yield, as in India, the potato leaf diseases, such as PEB and PLB, are pretty standard. It is an effective way to protect the farms against these diseases and will help them identify these diseases with efficacy. In accordance with the disease severity, further work can be done by farmers to determine the type of pesticides and chemicals to be used for the particular disease type in the farm fields. This contribution feels noble as it aims to help agricultural farmers in a great way and also helps enhance the GDP of the nation. Hence, both the Plant Village and the Plant Doc datasets were used for this pursuit.
The Literature Review of various papers has been done in Table 1 as follows:

4 Proposed System Requirements
4.1 Computational Requirements
The implementation uses the Google Colab platform with a fast NVIDIA v2-8 Tensor Core TPU. Python language utilised OpenCV’s cv2 library along with TensorFlow and Keras framework.
GPU-enabled workstation with the device specifications-LAPTOP-P4ORVA2M.
Processor: 11th Gen Intel(R) Core (TM) i5-1135G7 @ 2.40 GHz, 2.42 GHz.
RAM Memory: 16.0 GB (15.8 GB usable) RAM
4.1.2 Operating System Requirements
Windows 11, 64-bit OS, ×64-based processor was installed.
Network Bandwidth: 5 GHz WIFI Internet connection.
The implementation workflow is represented in Fig. 1 as given below:

Figure 1: Flowchart representation of potato plant disease severity estimation & classification
The dataset was taken from the Kaggle website, having classes as PEB, PLB, and PH leaves. The Plant Village dataset in Fig. 2a consists of 2152 potato plant images. It comprised 1000 PLB, 1000 PEB, and 152 PH plants. The Plant Doc dataset comprises 515 potato plant images, with 208 PLB, 171 PEB, and 136 PH plants. In Fig. 2b, some samples are shown for the Plant Doc dataset used.

Figure 2: (a) Representation of all three class labels, PEB, PLB and PH leaves in the Plant Village Dataset. (b) Representation of all three class labels, PEB, PLB and PH leaves in the Plant Doc Dataset
The Plant Village dataset, having 2152 images, is trifurcated into testing, validation, and training sets. Data split of 80% data in train_ds, 10% in val_ds, and 10% in test_ds is done. With shuffle: True, train_split, val_split, test_split as the function parameters, the splitting function utilized was def get_dataset_partitions_tf(). In the Plant Doc dataset, the total number of images in train_ds is 309, of which PLB is 125, PEB is 102 and PH is 82. The total number of images in val_ds is 51, of which PLB is 21, PEB is 17 and PH is 13. The total number of images in test_ds: 155, of which PH is 41, PEB is 52 and PLB is 62.
Techniques like cropping, translation, rotation, flipping, scaling/zooming: zooming in or out on a part of the image and shearing are applied.
The actual image size 256 × 256 is reduced to 224 × 224 for the Sequential layer and the data augmentation layer. The pixels are rescaled to 0–1, and the images are randomly transformed to improve model computational power and generalisation.
5.2.4 Color-Based Segmentation via cv2
RGB to HSV conversion is applied. HSV is even more robust to changes in illumination than RGB, making it better suited for color-based segmentation. Defining Color Ranges based on visual observation and experimentation, appropriate HSV ranges are defined for healthy and diseased regions. This stage aims to isolate and highlight the lesion areas associated with different potato diseases using color-based segmentation with the cv2 library. First, images undergo RGB to HSV conversion. This color space is more suitable when variations in lighting and shadow exist compared to RGB. For each disease, specific HSV color ranges are defined based on the characteristic color of the lesions. These ranges are determined empirically through analysis of a representative set of diseased leaves. A binary mask is created by thresholding the HSV image within the defined color ranges. Pixels within the range are allotted value 1, while those outside the range are allotted value 0. Finally, the original image is overlaid with the segmented area using a distinct color (e.g., red or green) to highlight the lesion. This creates a color-segmented overlay image. Segmentation mask visualisation samples are given.
The color thresholding is a Global Thresholding technique as it applies a single, fixed range of threshold values across the entire image’s color channels to segment the desired pixels. The cv2.inRange() function in OpenCV is used to create binary masks that isolate the pixels within the defined HSV ranges. This results in separate masks for healthy and diseased regions.
This technique is a local thresholding technique wherein a separate threshold value for each pixel is calculated. Adaptive thresholding is an image binarization technique that uses a local threshold for each pixel instead of a single global one. It works by dividing an image into small regions. For each pixel, it calculates a threshold value based on the average or weighted sum of the pixel intensities within its neighbourhood. A pixel is then converted to white if its intensity is above this local threshold and black if it’s below. This method is effective for images with uneven lighting or shadows because it adapts the threshold to the local conditions.
5.3 Visualisation of Binary Segmented Mask and Overlay Mask
5.3.1 Binary Color Segmented Mask
Binary Black and White masks are generated, depicting the colored region under consideration as white, and the rest black, as shown in Fig. 3a–f below:


Figure 3: (a) Brown segmented mask samples for the Plant Village dataset. (b) Brown segmented mask samples for the Plant Doc dataset. (c) Yellow segmented mask samples for the Plant Village dataset. (d) Yellow segmented mask samples for the Plant Doc dataset. (e) Green segmented mask samples for the Plant Village dataset. (f) Green segmented mask samples for the Plant Doc dataset
5.3.2 Adaptive Threshold Binary Segmented Mask Generation
The adaptive threshold segmented masks catering to the lighting feature are crucial to eliminate any light-based distortions. These adaptive masks are given in Fig. 4a,b for the Plant Village and the Plant Doc dataset as follows:

Figure 4: (a) Adaptive mask samples for Plant Village dataset. (b) Adaptive Overlay mask samples for Plant Doc dataset
5.3.3 Overlay Mask Generation Based on Color Feature
The colored overlay mask highlights the region under consideration. Repositories of Brown, Yellow, and Green highlighted overlays are stored separately in different Google Drive directories. The distinct colored masks are overlaid over original images through the function named cv2.addWeighted(). The overlay images of the diseased areas were easily visualised, identified, and assessed. The transparency of the mask can be adjusted to control the visibility of the underlying image. The overlay masks generated are given in Fig. 5a–f as below:

Figure 5: (a) Brown segmented overlay mask samples for the Plant Village dataset. (b) Brown segmented overlay mask samples for the Plant Doc dataset. (c) Yellow segmented overlay mask samples for the Plant Village dataset. (d) Yellow segmented overlay mask samples for the Plant Doc dataset. (e) Green segmented overlay mask samples for the Plant Village dataset. (f) Green segmented overlay mask samples for the Plant Doc dataset
5.3.4 Overlay Mask Generation Based on Illumination and Texture Feature
The Adaptive Thresholding-based segmentation masks and corresponding adaptive overlay masks are shown in Fig. 6a for the Plant Village dataset and Fig. 6b for the Plant Doc as below:

Figure 6: (a) Adaptive Overlay mask samples for Plant Village dataset. (b) Adaptive overlay mask samples for Plant Doc dataset
5.3.5 Overlay Masks Combination Based on Color, Illumination & Texture Features
The Adaptive masks are overlaid over the original images for visualisation. This is based on features like color, illumination and texture of the leaf images as shown in Fig. 7a for the Plant Village dataset and Fig. 7b for the Plant Doc dataset as follows:

Figure 7: (a) Combined Final Ground Truth Masks for Plant Village dataset. (b) Combined Final Ground Truth Masks for Plant Doc dataset
5.4 Segmentation and Disease Severity Estimation
The segmentation and disease severity estimation process used in this paper has been systematically mentioned as follows:
5.4.1 Affected Area Calculation
The pixel count in the affected, diseased region mask is counted using the cv2.countNonZero() function.
5.4.2 Total Leaf Area Calculation
The total count of pixels in the leaf area is calculated. This is done by isolating the entire leaf area via a segmentation step, which is achieved via the estimation of image dimensions.
The disease severity is calculated as the ratio of the Diseased_Area to the Total_Leaf_Area, expressed as a percentage using the formula given in Eq. (1) below:
5.4.4 U-Net Segmentation for Mask Refinement
The initial stage focuses on using image segmentation and the DL technique for precise analysis of diseased areas. CV2 and UNET-Refined Masks are created. The process begins by using a U-Net model to create highly accurate segmentation masks of the potato leaves and their diseased spots. The combined overlays serve as the ground truth masks. Ground truth masks are the ideal, correct segmentation masks. In the context of training a model, they serve as the target output that the model tries to learn. Predicted masks are the masks generated by the trained U-Net model. These are the model’s estimations of the segmentation based on the images it has processed. The term “U-Net refined masks” implies that the model’s output is clean and precise. In Fig. 8a,b, the Ground Truth Masks and predicted masks are plotted as given below:

Figure 8: (a) U-Net Mask Segmentation for Plant Village dataset. (b) U-Net Mask Segmentation for Plant Doc dataset
5.5 CBAM-EfficientNetB0 Transfer Learning Based Model Architecture
In this paper, the combination of CBAM and EfficientNetB0 involves two separate, powerful concepts. EfficientNetB0 has a complex architecture with compound scaling, while the CBAM module is an attention mechanism with its own set of mathematical operations. When a pretrained model is used, it means the weights for these mathematical operations have already been learned from a massive dataset, like ImageNet.
5.5.1 EfficientNetB0 Architecture
EfficientNetB0 is the smallest model in the EfficientNet family. Its design is based on compound scaling, a technique that balances depth, width, and resolution of the network using a fixed set of scaling coefficients. Instead of scaling a single dimension, EfficientNet scales all three simultaneously to achieve better performance and efficiency. The core of this is the compound coefficient ϕ. The key mathematical relationship for compound scaling is given in Eqs. (2)–(4) as follows:
where constants calculated through a small grid search EfficientNetB0 model are represented as α, β and γ, subject:
5.5.2 CBAM (Convolutional Block Attention Module)
The CBAM module is embedded inside the EfficientNetB0 architecture to improve the network’s emphasis on essential features. It sequentially applies two Modules, namely Channel Attention and Spatial Attention.
(a) Channel Attention Module
This module helps models decide “what” is essential in the image by focusing on the channels. It takes a feature map F as input, and to accumulate spatial information, it performs average-pooling and max-pooling. Then the pooled features are passed via a common Multi-Layer Perceptron. The outputs are then added element-wise and fed through an activation function—sigmoid to create a channel attention map, Mc. Mathematical formulation has been given in Eq. (5) below:
The modified feature map F′ is attained from the actual feature map F, which is multiplied by this channel attention map. It is illustrated in Eq. (6) below:
(b) Spatial Attention Module
This module helps the model decide “where” to focus. It feeds input as the feature map F′, which is channel-refined. It uses two techniques, namely average-pooling and max-pooling, along with the channel axis to form two 2D feature maps. These are combined and convolved to create a spatial attention map. The mathematical formulation is given in Eq. (7) below:
The above convolution operation is represented by (f)7×7, and here the kernel size is 7 × 7. Finally, the channel-modified feature map F′ is multiplied by the spatial attention map to get F′′, i.e., the final output feature map, which is given in Eq. (8) as below:
5.5.3 Pretrained CBAM-EfficientNetB0
For the pretrained CBAM-EfficientNetB0 model, the weights for all the convolutional layers and the MLP in the CBAM module have been learned on a humongous dataset like that of ImageNet. This allows the model to already have a robust understanding of lower-level features such as colours, textures, and higher-level features, i.e., objects. All mathematical operations described above are the core mechanisms by which the pretrained model processes new images and classifies them. Transfer learning is applied to optimise these learned weights on a small dataset like potato plant diseases, allowing the model to quickly adapt to your new task without starting from scratch. The CBAM architecture is shown in Fig. 9 below:

Figure 9: CBAM-based EfficientNetB0 architecture
5.5.4 Transfer Learning and Training
The pre-trained CBAM-EfficientNetB0 model on a large dataset, such as ImageNet, learns general image features. The pre-trained model is then refined on the potato plant disease datasets, both Plant Village and Plant Doc. The input to the model consists of two channels: the original image and the segmented overlay image generated in the previous stage. This allows the model to leverage both the overall image context and the highlighted lesion areas. For the Plant Doc dataset, the number of input image channels for classification is one, i.e., it was fed the augmented leaf images due to its small size initially. Transfer Learning makes the training process faster and more efficient. The hyperparameters tuned are given in Table 2 as follows:

The proposed method was tested on potato plant leaf overlay merged images with varying degrees of disease severity. The results indicate that both Severity Estimation via cv2 led Image segmentation, overlay mask generation, UNET segmentation, visualisation, and Classification via attention enabled CBAM-based EfficientNetB0 model were performed with utmost efficacy.
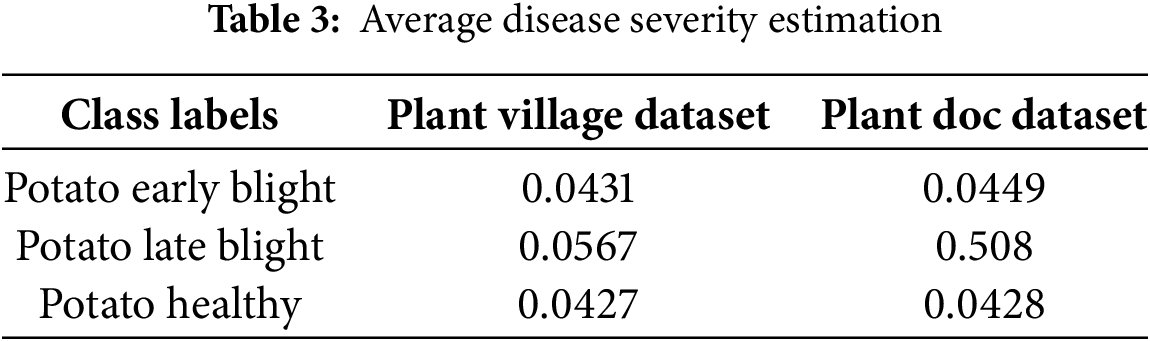
The estimated average severity values correlated well with visual assessments performed by experts. The estimated Disease Severity average calculation for all the leaf images of the respective class labels is shown in Table 3 for the Plant Village dataset and the Plant Doc dataset as below:
The U-Net-based segmentation has several evaluation metrics as given in Table 4 below:

For the classification of our dataset into three respective classes, we utilised the CBAM-enabled EfficientNetB0 model. The following evaluation metrics for performance are represented in Eqs. (9)–(12) as follows:
Accuracy: Correctly classified images percentage;
Precision: The ratio of true positives over the overall count of predicted positives;
Recall: The ratio of true positives over the overall count of actual positives.
F1-score: The mean(harmonic) of precision and recall.
where:
TP = True Positives (precisely identified affected(diseased) samples)
TN = True Negatives (precisely identified healthy samples)
FP = False Positives (healthy samples inaccurately identified as diseased)
FN = False Negatives (diseased samples inaccurately identified as healthy).
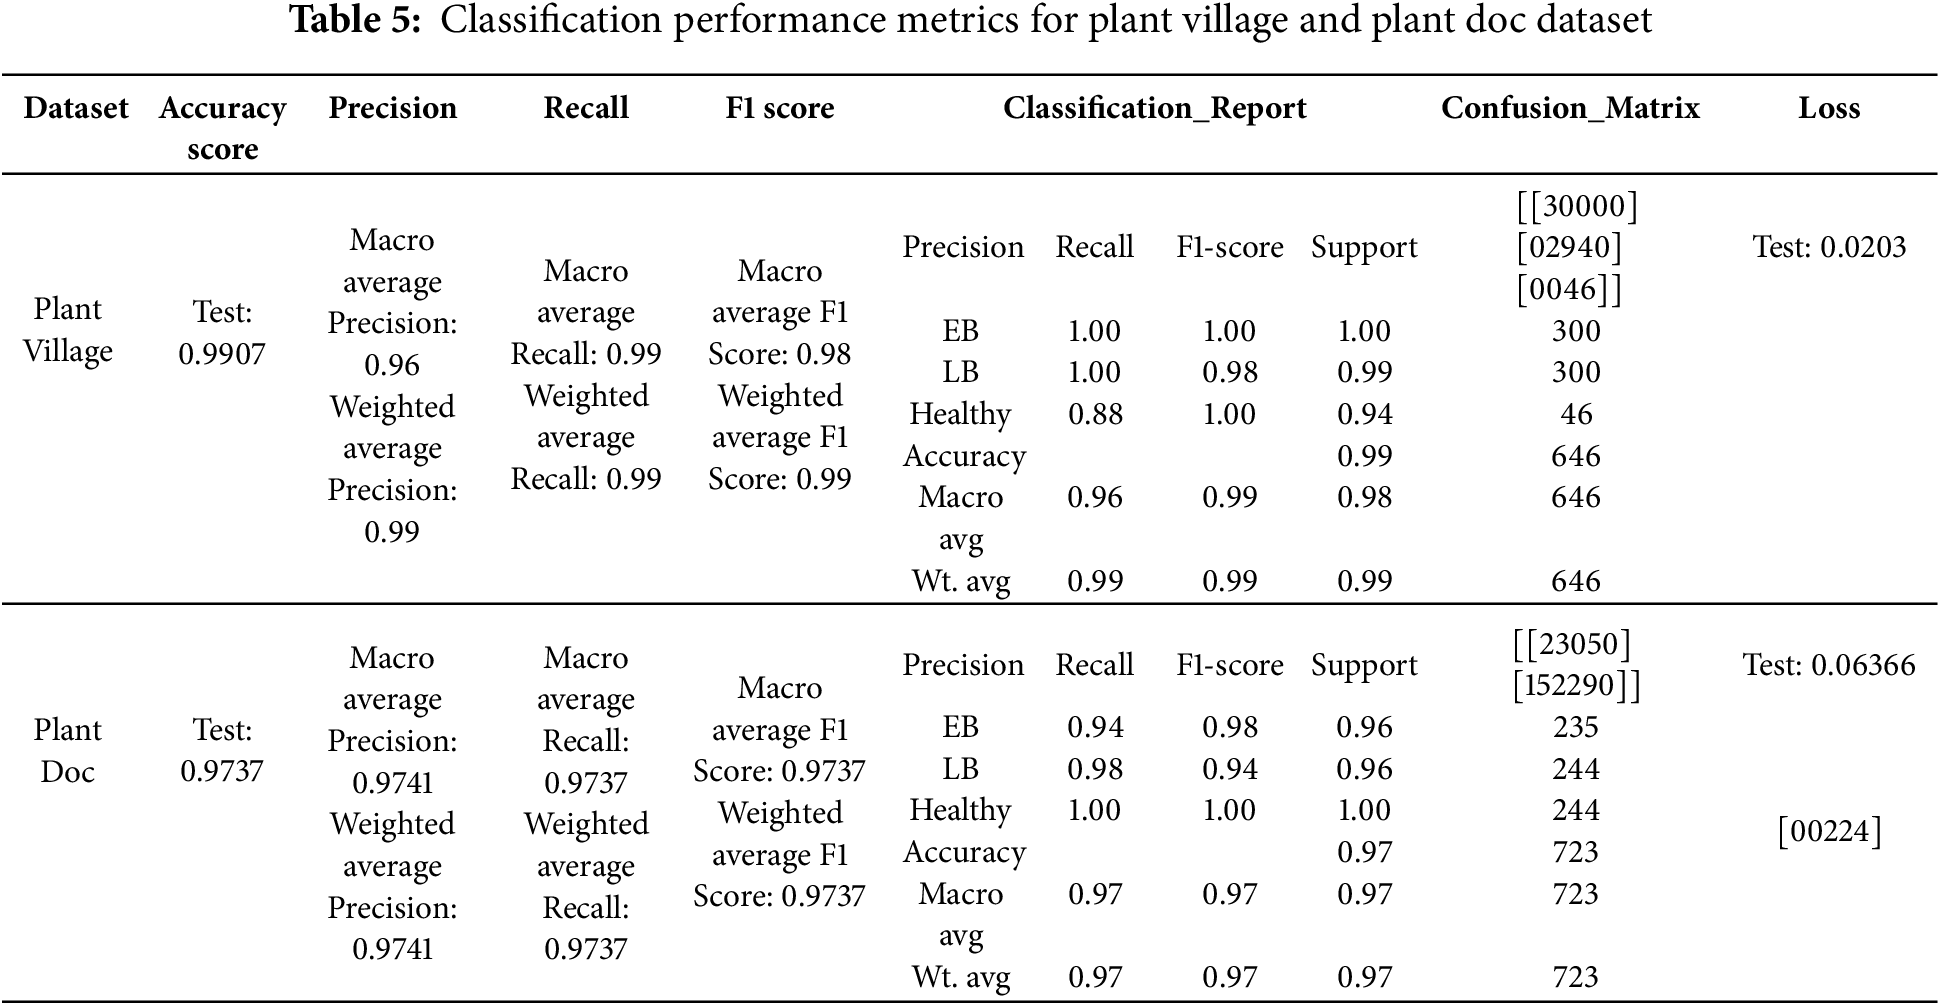
The performance measures used in the research are Accuracy score, Precision, Recall, F1 Score, Classification Report, Confusion matrix and Loss. All the performance metrics are given in Table 5 for the Plant Village dataset and the Plant Doc dataset as follows:
The distinct accuracy graph and loss graph for the classification model are given in Fig. 10a,b for Plant Village dataset and Fig. 11a,b for Plant Doc dataset as depicted below:

Figure 10: (a) Accuracy graph for the plant village dataset. (b) Loss graph for the plant village dataset

Figure 11: (a) Accuracy graph for plant doc dataset. (b) Loss graph for the plant village dataset
The results demonstrated the efficacy of our novel method for disease classification and severity estimation in the potato plant. The CBAM-EfficientNetB0 model with color and adaptive threshold segmented overlays achieved slightly higher accuracy for the Plant Village dataset compared to the Plant Doc dataset. Specifically, we observed the following:
The cv2 color segmentation, illumination, lighting feature, and texture features using adaptive threshold segmented masks enhanced our UNET model to refine these masks, allowing the model to focus on the areas of interest. This resulted in improved classification accuracy, particularly for diseases with subtle visual differences.
The transfer learning approach enabled the model to generalise well to unseen images, even with little training data.
6.3.3 Effective Attention Mechanism
The attention mechanism-based CBAM module focused on informative features of the dimensions, both channel and spatial. This qualifies the model’s capability to discriminate between different diseases.
6.3.4 Reasonable Severity Estimation
The method provides a reasonable estimation of disease severity, aligning with visual assessments.
This paper has a novel take on the integrated approach served by severity estimation via cv2 colour segmentation overlays fed to the CBAM-EfficientNetB0 transfer learning model. The results presented show that this novel workflow and systematic structure of the methodology achieve superior results compared to conventional DL approaches, highlighting the efficacy of integrating classical image processing and computer vision for enhanced disease detection and severity estimation as well. The primary feature extracted is the colour of the leaf, based on which severity is estimated, since it’s one of the most quintessential features for detecting severity in leaves. The color segmentation step aids in the same.
Acknowledgement: Really grateful to the Department of Biotechnology (DBT) for kind support in undertaking this research project.
Funding Statement: Funding has been received for this study. This research was done under Department of Biotechnology (DBT) project titled “Application of Machine Learning for Hyperspectral Imaging and Remote Sensing aimed at Early Detection of Fungal Foliar Diseases and Bacterial Wilt Diseases in Potato Crop”, DBT/Reference. No. BT/PR45388/133/58/2022.
Author Contributions: The research work was done by Kajal Kaul, Amit Prakash Singh, Anuradha Chug, Ravinder Kumar and Veerubommu Shanmugam. Kajal Kaul contributed in the following areas: introduction, motivation, literature review, proposed system requirements, implementation, results and conclusion. Amit Prakash Singh and Kajal Kaul helped in proofreading and formatting, and Anuradha Chug, Ravinder Kumar, and Veerubommu Shanmugam reviewed the results. All authors reviewed the results and approved the final version of the manuscript.
Availability of Data and Materials: The dataset used for this paper will be made available only upon seeking consent from the authors.
Ethics Approval: Not applicable.
Conflicts of Interest: The authors declare no conflicts of interest to report regarding the present study.
Abbreviations
| PEB | Potato Early Blight |
| PLB | Potato Late Blight |
| PH | Potato Healthy |
| CBAM | Convolution Block Attention Module |
| GDP | Gross Domestic Product |
| DL | Deep Learning |
| CNN | Convolution Neural Networks |
References
1. Verma S, Chug A, Singh AP, Singh D. Plant disease detection and severity assessment using image processing and deep learning techniques. SN Comput Sci. 2023;5(1):83. doi:10.1007/s42979-023-02417-5. [Google Scholar] [CrossRef]
2. Kaul K, Chug A, Singh AP, Kumar R, Shanmugam V. Hyperparameter tuning of CNN based potato plant disease detection model integrated with GridSearchCV. J Inf Optim Sci. 2025;46(1):1–14. doi:10.47974/jios-1846. [Google Scholar] [CrossRef]
3. Li J, Wu J, Liu R, Shu G, Liu X, Zhu K, et al. Potato late blight leaf detection in complex environments. Sci Rep. 2024;14(1):31046. doi:10.1038/s41598-024-82272-3. [Google Scholar] [PubMed] [CrossRef]
4. Tonmoy MR, Hossain MM, Dey N, Mridha MF. MobilePlantViT: a mobile-friendly hybrid ViT for generalized plant disease image classification. arXiv:2503.16628. 2025. doi:10.48550/arxiv.2503.16628. [Google Scholar] [CrossRef]
5. Nyakuri JP, Nkundineza C, Gatera O, Nkurikiyeyezu K, Mwitende G. AI and IoT-powered edge device optimized for crop pest and disease detection. Sci Rep. 2025;15(1):22905. doi:10.1038/s41598-025-06452-5. [Google Scholar] [PubMed] [CrossRef]
6. Miao Y, Meng W, Zhou X. SerpensGate-YOLOv8: an enhanced YOLOv8 model for accurate plant disease detection. Front Plant Sci. 2025;15:1514832. doi:10.3389/fpls.2024.1514832. [Google Scholar] [PubMed] [CrossRef]
7. Mahum R, Munir H, Mughal ZUN, Awais M, Sher Khan F, Saqlain M, et al. A novel framework for potato leaf disease detection using an efficient deep learning model. Hum Ecol Risk Assess. 2023;29(2):303–26. doi:10.1080/10807039.2022.2064814. [Google Scholar] [CrossRef]
8. Rashid J, Khan I, Ali G, Almotiri SH, AlGhamdi MA, Masood K. Multi-level deep learning model for potato leaf disease recognition. Electronics. 2021;10(17):2064. doi:10.3390/electronics10172064. [Google Scholar] [CrossRef]
9. Esgario JGM, Krohling RA, Ventura JA. Deep learning for classification and severity estimation of coffee leaf biotic stress. Comput Electron Agric. 2020;169:105162. doi:10.1016/j.compag.2019.105162. [Google Scholar] [CrossRef]
10. Li X, Zhou Y, Liu J, Wang L, Zhang J, Fan X. The detection method of potato foliage diseases in complex background based on instance segmentation and semantic segmentation. Front Plant Sci. 2022;13:899754. doi:10.3389/fpls.2022.899754. [Google Scholar] [PubMed] [CrossRef]
11. Fu J, Zhao Y, Wu G. Potato leaf disease segmentation method based on improved UNet. Appl Sci. 2023;13(20):11179. doi:10.3390/app132011179. [Google Scholar] [CrossRef]
12. Johnson J, Sharma G, Srinivasan S, Masakapalli SK, Sharma S, Sharma J, et al. Enhanced field-based detection of potato blight in complex backgrounds using deep learning. Plant Phenomics. 2021;2021(1):9835724. doi:10.34133/2021/9835724. [Google Scholar] [PubMed] [CrossRef]
13. Asha Rani KP, Gowrishankar S. Pathogen-based classification of plant diseases: a deep transfer learning approach for intelligent support systems. IEEE Access. 2023;11(20):64476–93. doi:10.1109/access.2023.3284680. [Google Scholar] [CrossRef]
14. Wang G, Sun Y, Wang J. Automatic image-based plant disease severity estimation using deep learning. Comput Intell Neurosci. 2017;2017:2917536–8. doi:10.1155/2017/2917536. [Google Scholar] [PubMed] [CrossRef]
15. Mutiso G, Ndia J. A unified U-net-vision mamba model with hierarchical bottleneck attention for detection of tomato leaf diseases. J Artif Intell. 2025;7(1):275–88. doi:10.32604/jai.2025.069768. [Google Scholar] [CrossRef]
Cite This Article
 Copyright © 2025 The Author(s). Published by Tech Science Press.
This work is licensed under a Creative Commons Attribution 4.0 International License , which permits unrestricted use, distribution, and reproduction in any medium, provided the original work is properly cited.
 Downloads
 Citation Tools