
 Submit a Paper
 Propose a Special lssue
 Open Access
ARTICLE

Suitability and Sustainability of Rainwater Quality Monitoring System in Cistern for Domestic Use
Department of Electronics and Telecommunication Engineering, Dar es Salaam Institute of Technology, P. O. Box 2958, Dar es Salaam, Tanzania
* Corresponding Author: Kenedy A. Greyson. Email:
Journal on Internet of Things 2023, 5, 1-11. https://doi.org/10.32604/jiot.2023.040255
Received 10 March 2023; Accepted 29 June 2023; Issue published 14 September 2023
 View Full Text
 Download PDF
Abstract
Rainwater harvesting (RWH) systems have been the source of domestic water for many years and still becoming essential in many communities of developing countries. However, due to various reasons, there are several sources of contamination in the rainwater cistern systems. Dissolved chemicals from the roofing, storage, and conveyance materials, together with the suspended particulate matter from the airborne, are examples of water contamination. In this work, the water quality monitoring system has been designed and implemented. Chemical and physical parameters of water samples were collected from three locations using a data acquisition (DAQ) system and rainwater quality was analyzed using Water Pollution Index (WPI). Results obtained from three locations have been presented.Keywords
Water is among the vital natural resources that sustain various processes of value to the mankind and survival of life on earth. In most developing countries, water is used for cooking, drinking, washing, bathing, cleaning, irrigation, and other domestic uses. However, there is always an imbalance between water demand and supply in most growing cities of developing countries. In a densely populated city like Dar es Salaam, a home for more than six million, water demand is very high. This substantial population craves a larger amount of water for different purposes which results in the deficiency of water supply. In Dar es Salaam the shortage of water is due to climate change, severe over-abstraction, and water loss in the Ruvu River (the source of water supply in the city of Dar es Salaam). This experience of chronic deficiency of water supply has evolved the need for Rainwater Harvesting (RWH) and drilled wells to be considered the alternative source of water supply for domestic consumption in the city.
To secure sufficient drinking water, new strategies of protection and rational use of water are encouraged and established, including rainwater harvesting (RWH) systems [1–7]. It is reported that globally implemented RWH systems could cover up to 90% of household water consumption and it plays a critical role in solving the world’s problem of increased water stress [8–10]. Rainwater is collected from the galvanized iron sheet roofs and stored in the basement reinforced concrete tanks through a network of gutters and downpipes [11]. Examples of the storage tank (cistern) are shown in Fig. 1, however, there are numerous sources of contaminations in the rainwater cistern system such as the dissolved chemicals from the roofing, storage, and conveyance materials and the suspended particulate matters from the airborne contribute in the water contamination in the system. Therefore, the need for water monitoring and treatment is inevitable.

Figure 1: The structure of the water monitoring system
Water quality monitoring in rainwater cistern systems involves data collection and data analysis to obtain information about the ecological status of the water. It is the assessment of the quality of water which includes regular sampling and assessment of the data samples to ascertain if the water quality standards are met. Tanzania National Water Policy [12], for instance, requires that water quality should be monitored to meet the approved standards. To facilitate proper RWH practices, the government has decided to prepare RWH Guidelines in line with the Tanzania national water policy, intended to promote its usage in the country. The aim is to advocate, guide and enable the proper application of RWH techniques to optimize the quality of the harvested rainwater for domestic use as advocated by the national water policy.
There are several related works in water quality monitoring. He et al. [13] presented the novelty of the fabrication process of flexible sensors from the metalized polymer film. In this paper, the authors discussed an IoT-based system to monitor water bodies’ nutrients and record them regularly for observing the trends. Lakshmikantha et al. [14] and Zulkifli et al. [15] presented a review of the works that were implemented in the arena of smart water pollution monitoring systems. In [14], authors proposed IoT-based smart using technology to monitor the quality parameters. Grzywna et al. [16] analyzed the physical and chemical parameters of the surface waters of the basin using various parameters, such as suspended solids, the potential of Hydrogen (pH), electric conductivity, sulfates, ammonia, chlorides, and phosphate to estimate the ecological status of water.
Through these studies, it is observed that the need for monitoring is inevitable. Therefore, improved electronics of the monitoring systems are the solution. This work aims to design an electronic monitoring system that collects parametric data and analyzes the quality of water in the cistern. This work presents the structure of a designed electronic monitoring system used to collect the related parameters and analyze the quality of the water harvested by the rainwater cistern systems. The data acquisition (DAQ) system intends to gather related parameters of water quality in the cistern. Descriptive indicators of polluted water such as the water pollution index (WPI) are defined by the potential of hydrogen (pH) value, electric conductivity (EC), temperature, dissolved oxygen (DO), turbidity, and total dissolved solids (TDS) are used to obtain the ecological water status compared to the acceptable standards levels.
Water pollution is a contamination process that creates byproducts in the water and degrades the water resource [17,18]. There are several severe diseased cases involved with water contamination. The catchment rainwater cistern system includes a roof, gutters, and a piping system that conveys the collected water to the cistern or tank. Materials used in the system such as asbestos, lead, and copper may seep or leak chemicals especially when they last for a long time. Moreover, rainwater can be contaminated by dust, smoke, and particles from the air. This study proposes a water quality monitoring system for the rainwater cistern system. Therefore, due to the aging of the rainwater cistern system, water quality control become an issue that requires regular monitoring.
3 Water Pollution Index Background
There are various means of evaluating the quality of water. For instance, Mammeri et al. [19] described the water quality index (WQI) formula using seven hydro-chemical parameters (i.e., Ca, Mg, Na, K, Cl, SO4, and HCO3) that may offer an approximation of the hydro-chemical characteristics of a region. Similarly, other researchers use the WPI as an alternative to evaluating the quality of water. Water is considered polluted if some substances or condition is present to such a degree that the water cannot be used for a specific purpose [20]. That is the excessive amount of pollutants from sewage leakages, oil spillage, industrial waste, building lavatories, etc., such that it is no longer suitable for the intended use or cannot keep up with their cleaning responsibilities. The pollution index is a useful tool to provide information about water quality [21,22]. In all cases, the choice of physicochemical parameters, standard and analytical methods of physicochemical parameters for water quality depends on the use of the water and the site. For example, temperature and salinity of water are more important factors for water containing the life of organisms than water for washing clothes. Therefore, the water pollution index provides a single or specific assessment score when interpreting water quality [23].
4 Conceptual Framework of the Water Quality Monitoring System
The architecture of the proposed water quality monitoring system is based on the 3-layers of the OSI layers: the physical layer, network layer, and application layer. The structure of the monitoring system is shown in Fig. 2. The physical layer contains the cellular IoT-based microcontroller and the arrays of water parameters sensors. The network layer provides the routing of data to different devices over the Internet. This layer is composed of a cellular IoT or the Narrow Band IoT (NB-IoT). The application layer, on the other hand, is where the IoT application resides.

Figure 2: The structure of the water monitoring system
The objective is to monitor the quality of the harvested rainwater. Therefore, the system is composed of an array of sensors including pH-, EC-, turbidity-, temperature-, DO-, and TDS sensors connected to the microcontroller and cellular IoT integrated board. A sample of water is pumped to the reservoir containing sensing elements for respective parameters data collection.
4.2 Physical Layer Hardware Assembly
The Particle Electron 3G-270, or newer versions such as B Series SoM and Boron, is a cellular IoT that incorporates the interfaces for the water quality parameter sensors, STM32F205RGT6 ARM Cortex M3 processor-based microcontroller, as well as the cellular communication link. This IoT board has Universal Asynchronous Receiver and Transmitter (UART), Serial Peripheral Interface (SPI), Inter-IC Sound (I2S), Inter-Integrated Circuit (I2C), and Controller Area Network (CAN) serial communication protocol ports. It has digital I/Os, and ADC inputs. The system is powered by a solar or rectified power system. Fig. 3 is a wired laboratory prototype of a water quality monitoring system in the project box. Sensors such as pH electrodes, EC, and DO use Bayonet Neill–Concelman (BNC) interface to their modules. Other sensors are connected directly to their respective modules. Solar battery power bank with 12 V, 20 A uses a power distributor to distribute different levels of voltages required by various parts of the system. The Electron 3G-270, replaced by the B Series SoM or Boron, is a programmable tiny development kit for creating cellular-connected electronics IoT projects. Electron 3G-270 is compatible with many East African countries including Tanzania, Congo, Kenya, Rwanda, and Uganda.

Figure 3: Water quality monitoring system prototype circuit
5 Physicochemical Characteristics of Water Pollution
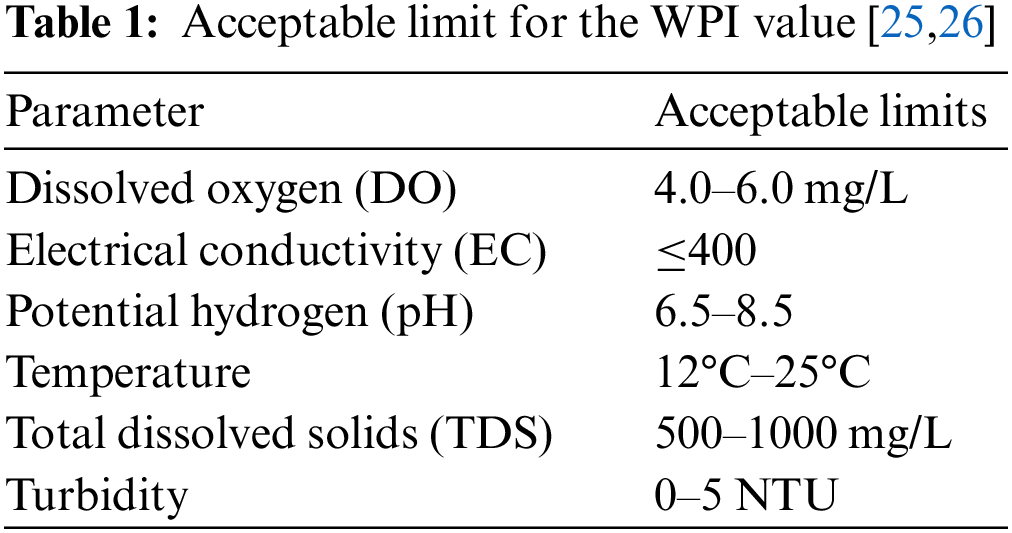
Apart from the previously mentioned water pollution, there are other various sources of water pollution such as sewage systems, air pollution from industries, and industrial waste [24]. According to WHO, the proposed Water Pollution Index (WPI), shown in Table 1, presents an arithmetical way of integrating parameters for assessing the chemical and ecological surface waters.
The Mean value of all WPIs divided by the number of used parameters and expressed by (1) [16,25,26]. Therefore, WPI is computed as
given that,
where P refers to pollution load, Ac is the observed concentration of the parameter and T is the threshold or highest permissible standard limit for the respective variables, WPI is Water Pollution Index,
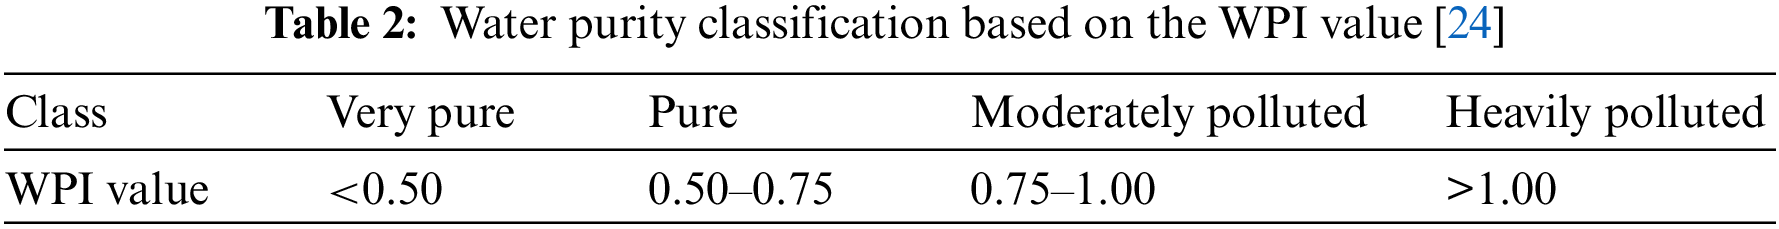
The standards shown in Table 2 present the classification of the sustainability and suitability of water for drinking using WPI. The technique based on pollution load or water quality status proposed in [24] is adapted and WPI modified values as suggested in [16]. These WPI levels can be summarised as pure (WPI < 1), moderately polluted (WPI > 2), and heavily polluted (WPI > 6).
Note that water quality management refers to the pollution index that can give suggestions assessing the water quality and take action to improve water quality when quality decrease occurs due to pollutants occurrence [27].
For test purposes only, samples of treated water pollution parameters (pH, DO, temperature, TDS, turbidity, and electric conductivity) were collected from three rainwater-cistern systems located at three different locations. Two locations (location 1 and location 2) were at Vingunguti industrial areas, about 500 meters from each other, and the third location (location 3) was at the city center in Ilala district, a non-industrialized community. All RWH systems in these locations use underground cisterns, the location at the city center. The electric pump is used to pump water to the tanks that provide water in the taps through gravity.
These samples were for the treated water claimed to be safe for drinking. The standard measuring instruments were used to calibrate and test the performance of the designed monitoring system. The results were compared and the statistical error analysis is used to minimize the magnitude of the error of the monitoring system. Six sets of measuring data were recorded in 20–30 minutes (i.e. each set in every two minutes). The choice of this period was based on the fact that each sensor needs a settling time of about 90 seconds. Using the standard measuring instruments, no significant change in the parameter readings was recorded within 30 minutes. The set of measurement readings is subject to random errors. In this work, the advantage of computation speed is used where the arithmetical processes involve a repeated number of measurements to improve the precision of measurements by considering the mean or median value. For a set of N measurements, the spread or measurement is measured using the standard deviation,
As the deviation decreases for the measurement set (finite number of measurements), the confidence it brings that the mean is closer to the true value. Hence, the measure of the error in the mean, the standard error in the mean,
The water pollution index for the rainwater cistern systems was calculated from six parameters, namely: dissolved oxygen, electric conductivity, the potential of Hydrogen, temperature, total dissolved solids, and Turbidity for three sampling rainwater cisterns systems to assess the suitability of rainwater for domestic use. Table 3 shows the sets of measurements collected using the monitoring system at location 1 in the Vingunguti industrial area, Table 4 shows the set of measurements collected at location 2 in the Vingunguti area, and Table 5 shows the set of measurements collected at location 3 in the city center.
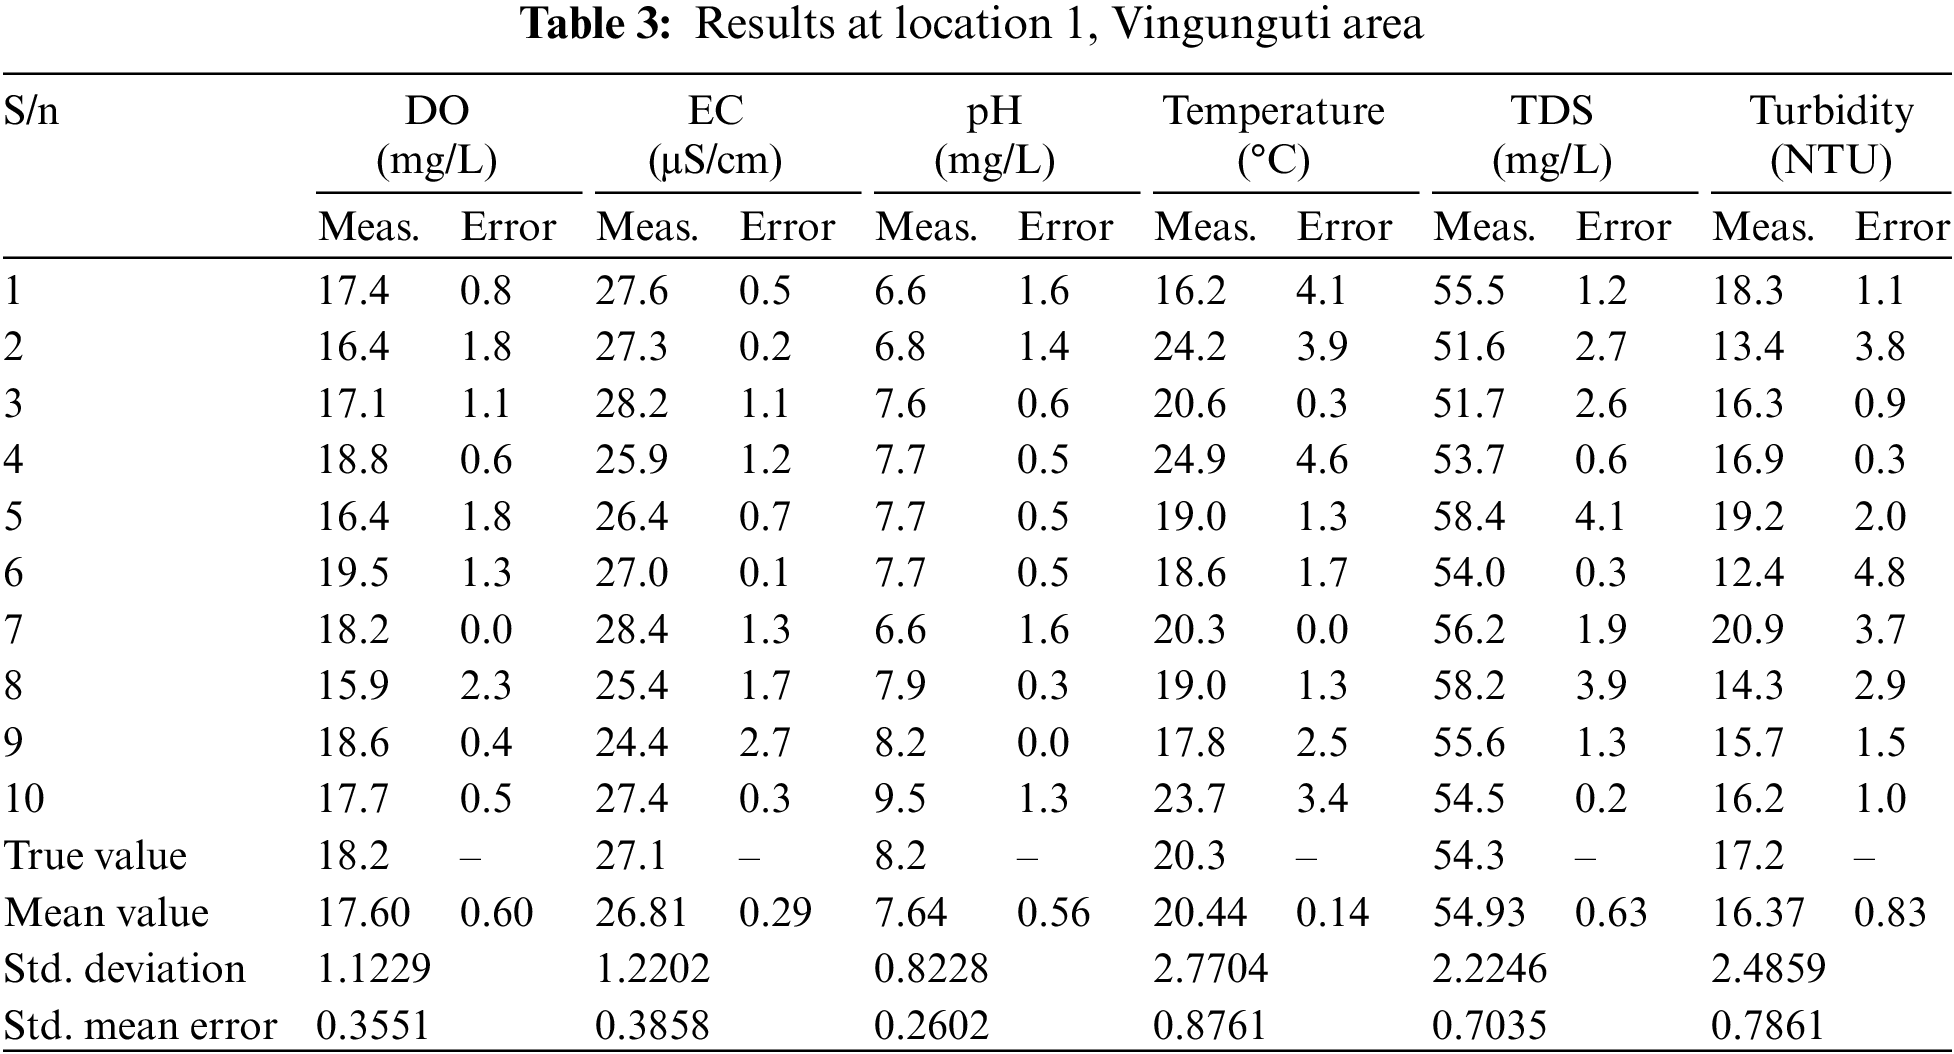
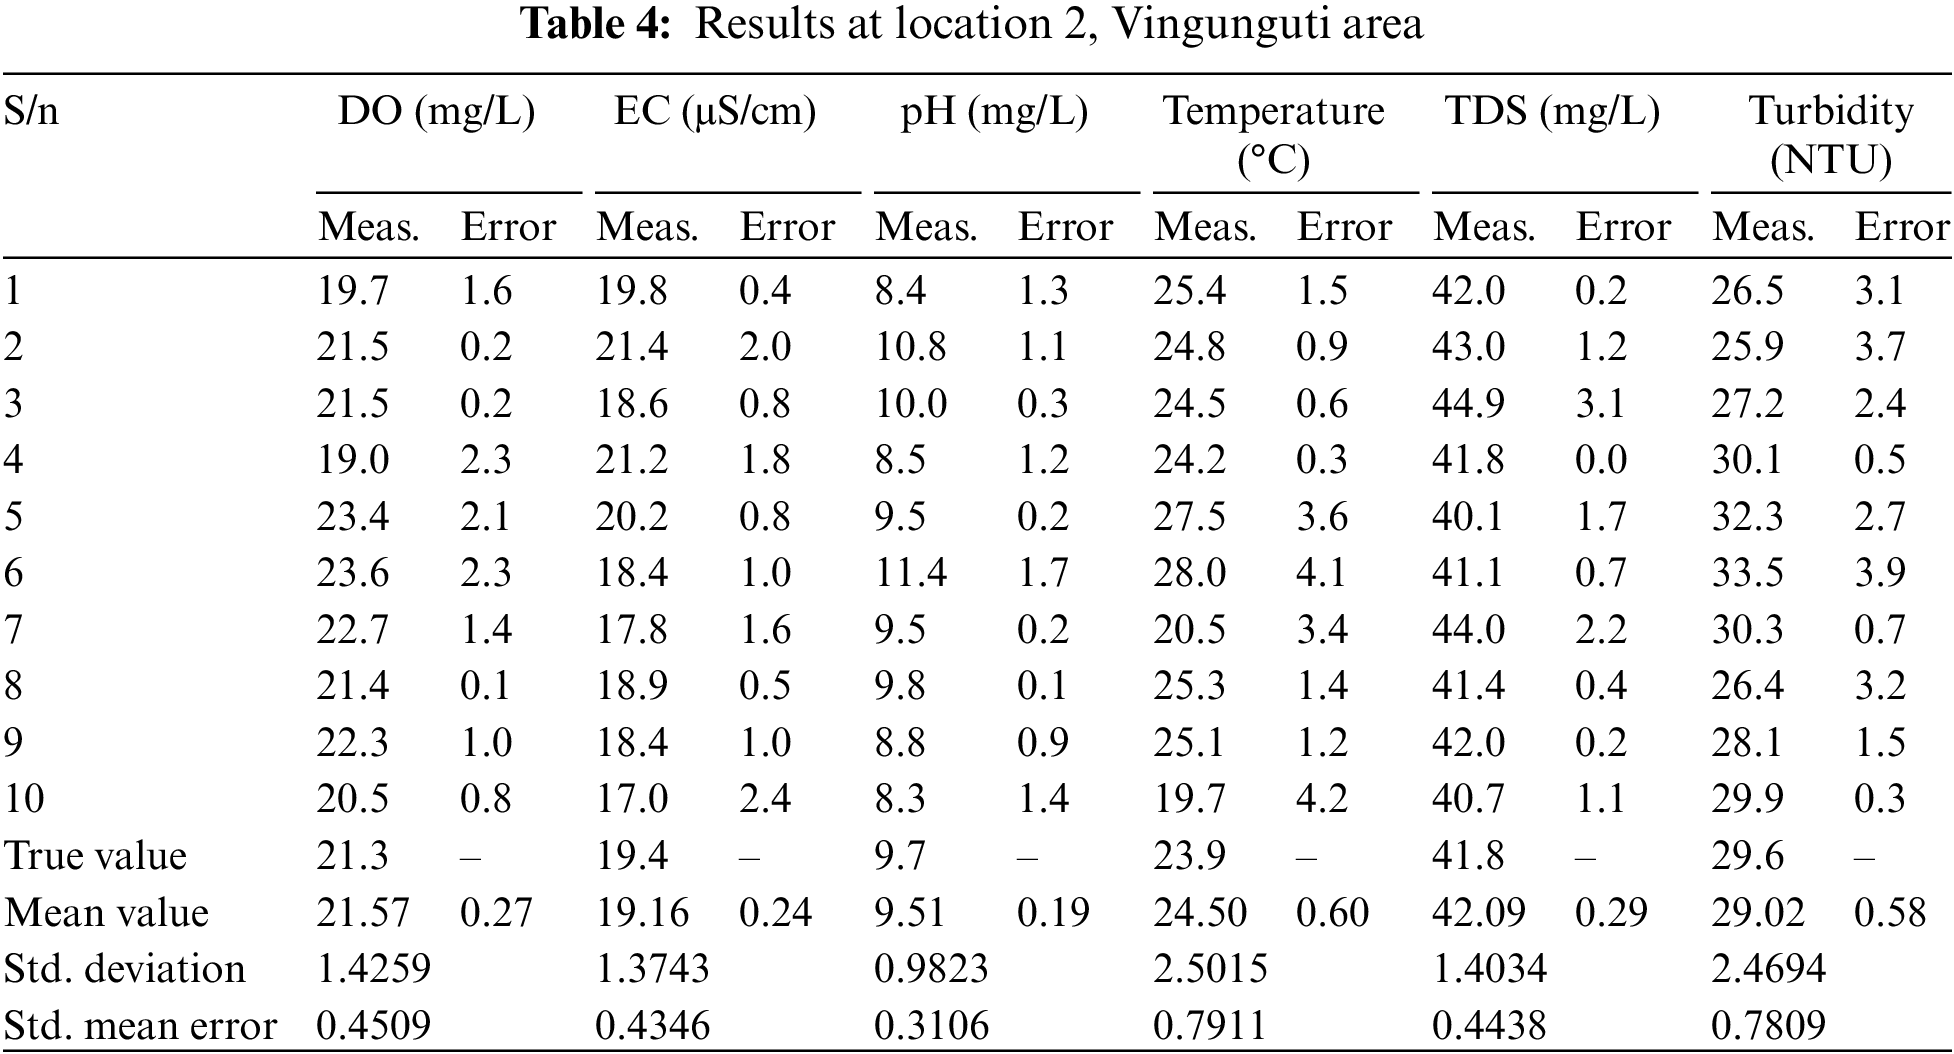
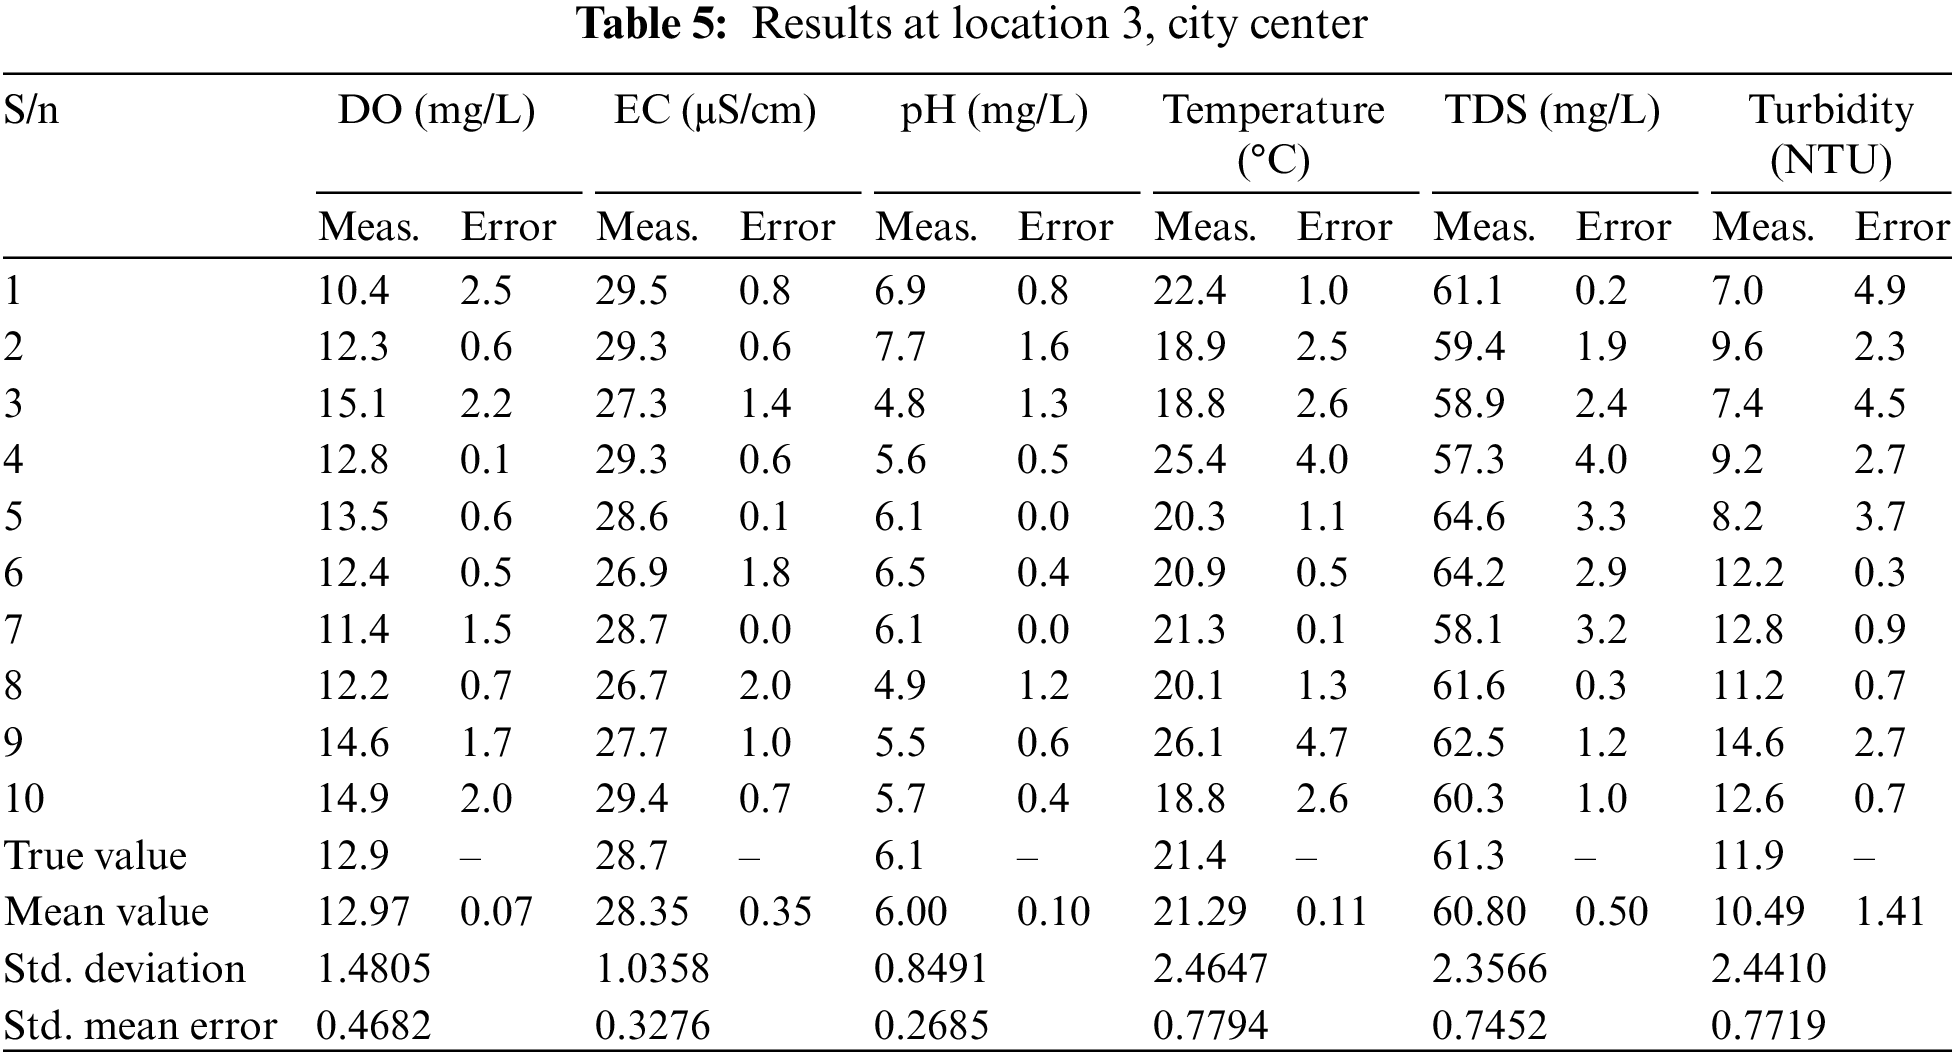
For clarification of the method used, only 10 samples are recorded. The result of analyses on the rainwater samples indicated that at those locations the mean (average) values of 10 samples were giving good estimations according to the standards as shown in Table 2. It was also observed that the turbidity in all three locations is high, especially at locations 1 and 2 (industrial areas). This could be due to urban runoff, waste discharge, etc. However, despite being in industrial areas, the pH values in those areas are high means it is more alkaline than acidic compared to the pH in location 3 (non-industrialized community).
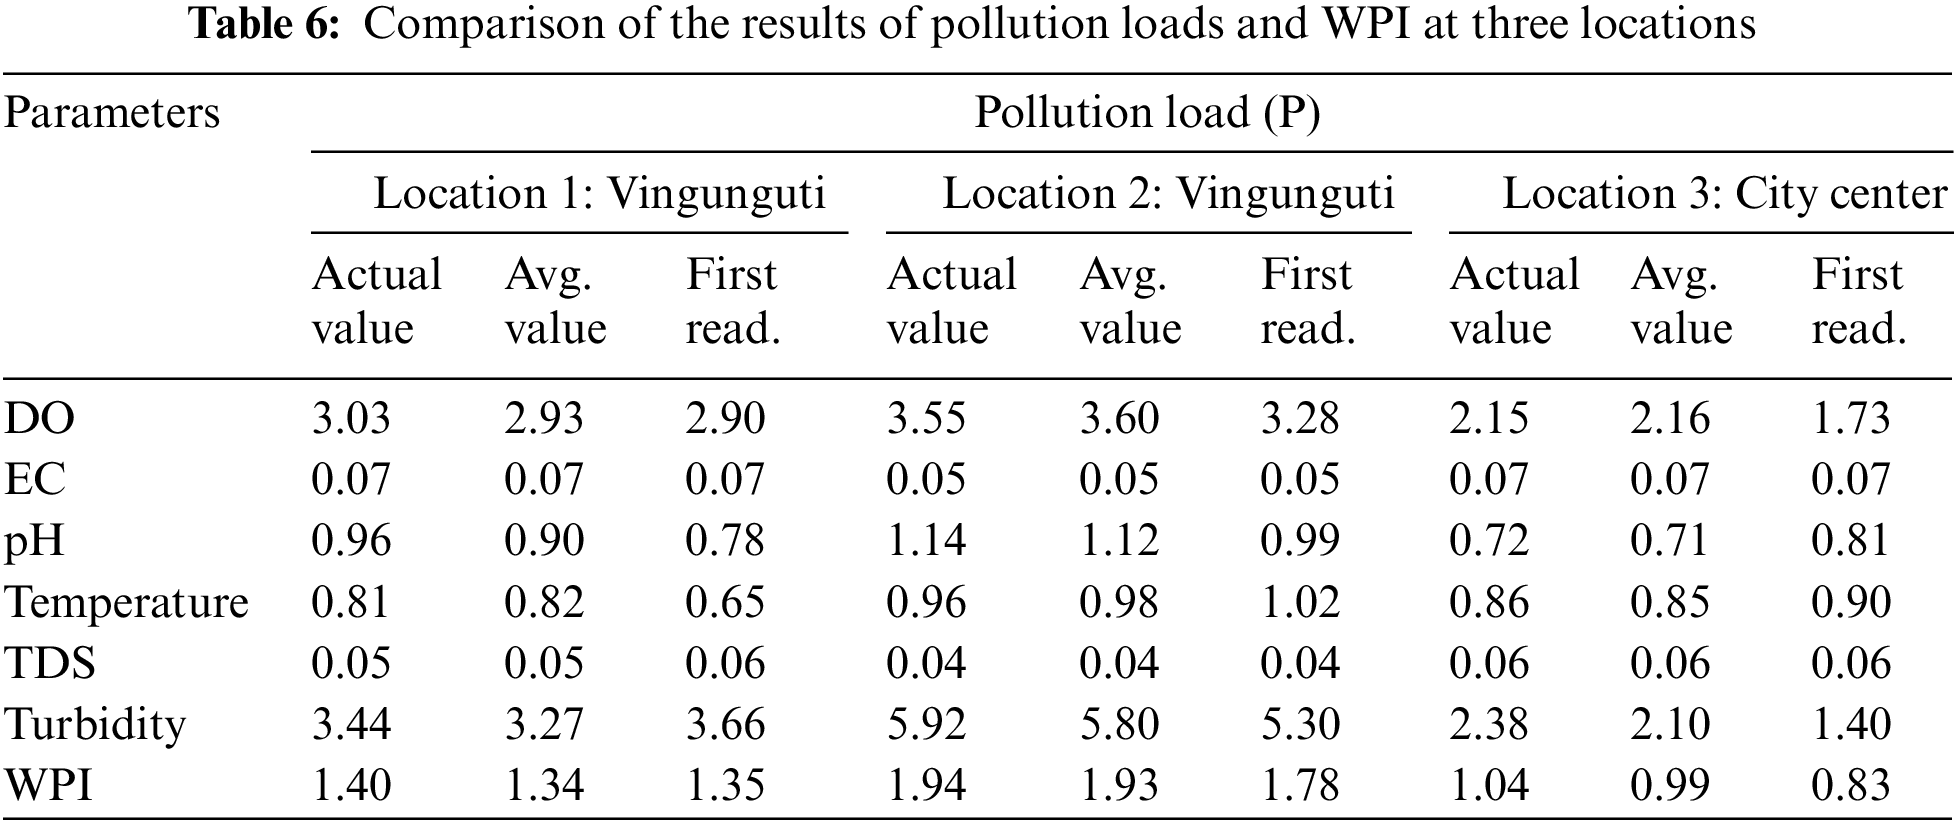
Fig. 4 depicts the WPI score obtained based on Eq. (1) and Table 6. Table 6 presents the comparisons of the results obtained by the proposed method (mean data value) and conventional method (first data obtained) to the true value.


Figure 4: Comparison of WPI score at the three locations: (a) location 1 (b) location 2 (c) location 3
One of the challenges in developing countries is to overcome the problem of water shortage. There is a need for an early understanding of the pollution in rainwater cistern systems and the drastic changes in their physicochemical features. It has been noted that rainwater is probably the best water source in most developing countries like Tanzania. However, proper collection, storage, and monitoring should be considered. In this study, the statistical error and data analysis gives the proper estimation of water ecological status. The parametric data errors are minimized by averaging the number of readings. Although 10 samples of data sets were used in this paper for clarifications, practically, more samples are used that will minimize the reading errors.
The parameter water pollution load can be addressed individually during the water treatment process to improve the water pollution index and the water quality index. This study presents a comparative assessment of a new comprehensive method for evaluating the water pollution index. The study also showed that chemical, physical, and biological parameters can be used to evaluate WPI. WPI employs permissible standards to define ideal water quality. There are some limitations of WPI, for instance, the water pollution index may not carry enough information about the real quality situation of the water. Since the parameter shows the least favorable value and gives a high statistical value to the index, an index is a useful tool for communicating water pollution information to the public and legislative decision-makers.
Acknowledgement: The author thanks the ECO-Mobility Solutions research team and the Dar es Salaam Institute of Technology (DIT), for supporting the study.
Funding Statement: This research is supported by the ECO-Mobility Solutions Research Team and the Dar es Salaam Institute of Technology (DIT).
Author Contributions: The author confirms sole responsibility for the following: study conception and design, data collection, analysis and interpretation of results, and manuscript preparation.
Availability of Data and Materials: All data generated or analyzed during this study are included in this published article.
Conflicts of Interest: The author declares that they have no conflicts of interest to report regarding the present study.
References
1. J. Struk-Sokołowska, J. Gwoździej-Mazur, P. Jadwiszczak, A. Butarewicz, P. Ofman et al., “The quality of stored rainwater for washing purposes,” Water, vol. 12, no. 1, pp. 252, 2020. [Google Scholar]
2. M. García-Montoya, A. Bocanegra-Martínez, F. Nápoles-Rivera, M. Serna-González, J. M. Ponce-Ortega et al., “Simultaneous design of water reusing and rainwater harvesting systems in a residential complex,” Computer and Chemical Engineering, vol. 76, no. 4, pp. 104–116, 2015. [Google Scholar]
3. J. F. Velasco-Muñoz, J. A. Aznar-Sánchez, A. Batlles-delaFuente and M. D. Fidelibus, “Rainwater harvesting for agricultural irrigation: An analysis of global research,” Water, vol. 11, no. 7, pp. 1320, 2019. [Google Scholar]
4. J. Steffen, M. Jensen, C. A. Pomeroy and S. J. Burian, “Water supply and stormwater management benefits of residential rainwater harvesting in U.S. cities,” Journal of the American Water Resources Association, vol. 49, no. 4, pp. 810–824, 2012. [Google Scholar]
5. E. Wanjiru and X. Xia, “Sustainable energy-water management for residential houses with optimally integrated grey and rainwater recycling,” Journal of Cleaner Production, vol. 170, pp. 1151–1166, 2018. [Google Scholar]
6. A. Stec and M. Zelenáková, “An analysis of the effectiveness of two rainwater harvesting systems located in Central Eastern Europe,” Water, vol. 11, no. 3, pp. 458, 2019. [Google Scholar]
7. A. H. M. Jamal, Y. A. Tarek, A. B. Siddique, A. A. Shaikh, S. C. Debnath et al., “Development of a fabricated first-flush rainwater harvested technology to meet up the freshwater scarcity in a South Asian megacity, Dhaka, Bangladesh,” Heliyon, vol. 9, no. 1, pp. 1–13, 2023. [Google Scholar]
8. A. Ghaffarian, J. Tookey, S. M. Yusoff and N. B. Hassan, “State of the art of rainwater harvesting systems towards promoting green built environments: A review Desalinat,” Water Treatment, vol. 57, no. 1, pp. 95–104, 2016. [Google Scholar]
9. S. Lee and R. Kim, “Rainwater harvesting,” in Encyclopedia of Sustainability Science and Technology. NY, USA: Springer, pp. 8688–8702, 2012. [Google Scholar]
10. S. Yannopoulos, I. Giannopoulou and M. Kaiafa-Saropoulou, “Investigation of the current situation and prospects for the development of rainwater harvesting as a tool to confront water scarcity worldwide,” Water, vol. 11, no. 10, pp. 2168, 2019. [Google Scholar]
11. A. W. Mayo and D. A. Mashauri, “Rainwater harvesting for domestic use in Tanzania a case study: University of Dar es Salaam staff houses,” Water International, vol. 16, no. 1, pp. 1–8, 1991. [Google Scholar]
12. TNWP, “Tanzania National Water Policy 2002,” [Online]. Available: https://faolex.fao.org/docs/pdf/tan169531.pdf [Google Scholar]
13. S. He, S. Feng, A. Nag, N. Afsarimanesh, E. E. Alahi et al., “IoT-based laser-inscribed sensors for detection of sulfate in water bodies,” IEEE Access, vol. 8, pp. 228879–228890, 2020. [Google Scholar]
14. V. Lakshmikantha, A. Hiriyannagowda, A. Manjunath, A. Patted, J. Basavaiah et al., “IoT based smart water quality monitoring system,” Global Transitions Proceedings, vol. 2, no. 2, pp. 181–186, 2021. [Google Scholar]
15. C. Z. Zulkifli, S. Garfan, M. Talal, A. H. Alamoodi, A. Alamleh et al., “IoT-based water monitoring systems: A systematic review,” Water, vol. 14, no. 3621, pp. 1–29, 2022. [Google Scholar]
16. A. Grzywna and J. Sender, “The assessment of the amount of water pollution and its suitability for drinking of the tyśmienica river basin Poland,” Environmental Monitoring Assessment, vol. 193, no. 315, pp. 9034, 2021. [Google Scholar]
17. H. Qadri and R. A. Bhat, “The concerns for global sustainability of freshwater ecosystems,” in Freshwater Pollution Dynamics and Remediation. Singapore: Springer, pp. 1–13, 2020. [Google Scholar]
18. F. D. Owa, “Water pollution: Sources, effects, control, and management,” Mediterranean Journal of Social Sciences, vol. 4, no. 8, pp. 65–68, 2013. [Google Scholar]
19. A. Mammeri, A. Tiri, L. Belkhiri, H. Salhi, D. Brella et al., “Assessment of surface water quality using water quality index and discriminant analysis method,” Water, vol. 15, pp. 680, 2023. [Google Scholar]
20. F. W. Owa, “Water pollution: Sources, effects, control, and management,” Mediterranean Journal of Social Sciences, vol. 4, no. 8, pp. 65–68, 2013. [Google Scholar]
21. R. H. Tanjung, B. Hamuna and A. Alianto, “Assessment of water quality and pollution index in coastal waters of Mimika, Indonesia,” Journal of Ecological Engineering, vol. 20, no. 2, pp. 87–94, 2019. [Google Scholar]
22. N. Fahimah, I. S. Salami, K. Oginawati, S. H. Susetyo, A. Tambun et al., “The assessment of water quality and human health risk from the pollution of chosen heavy metals in the upstream Citarum River, Indonesia,” Journal of Water and Land Development, vol. 56, pp. 153–163, 2023. [Google Scholar]
23. N. Z. Popovic, J. A. Diknic, J. Z. C. Atlagic, M. J. Rakovic, N. S. Marinkovis et al., “Application of the water pollution index in the assessment of the ecological status of rivers: A case study of the Sava River,” Serbia Acta Zoologica Bulgarica, vol. 68, no. 1, pp. 97–102, 2016. [Google Scholar]
24. N. Mushtaq, D. V. Singh, R. A. Bhat, M. A. Dervash and O. Hameed, “Freshwater contamination: Sources and hazards to aquatic biota,” in Fresh Water Pollution Dynamics and Remediation. Singapore: Springer, pp. 27–50, 2020. [Google Scholar]
25. M. Hossain and P. K. Patra, “Water pollution index—A new integrated approach to rank water quality,” Ecological Indicators, vol. 117, pp. 106668, 2020. [Google Scholar]
26. WHO, Guidelines for Drinking Water Quality, 4th ed., World Health Organization, 2017. [Online]. Available: https://pubmed.ncbi.nlm.nih.gov/28759192/ [Google Scholar]
27. H. Effendi and W. Yusli, “Water quality status of Ciambulawung River, Banten Province, based on pollution index and NSF-WQI,” Procedia Environmental Sciences, vol. 24, pp. 228–237, 2015. [Google Scholar]
Cite This Article
 Copyright © 2023 The Author(s). Published by Tech Science Press.
This work is licensed under a Creative Commons Attribution 4.0 International License , which permits unrestricted use, distribution, and reproduction in any medium, provided the original work is properly cited.
 Downloads
 Citation Tools