
 Submit a Paper
 Propose a Special lssue
 Open Access
ARTICLE

Synthesis of Carbon dots from Biomass Chenpi for the Detection of Hg2+
1
Pharmaceutical and Food Molecular Science Research Team, Chemistry and Chemical Engineering, Central South University,
Changsha, 410083, China
2
Department of Food Testing and Research, Hunan Testing Institute of Product and Commodity Supervision, Changsha, 410007,
China
* Corresponding Author: Jun Xiang. Email:
(This article belongs to the Special Issue: Carbon-Based Nanomaterials from Renewable Materials: Synthesis, Properties and Applications)
Journal of Renewable Materials 2023, 11(10), 3739-3750. https://doi.org/10.32604/jrm.2023.028090
Received 29 November 2022; Accepted 26 January 2023; Issue published 10 August 2023
 View Full Text
 Download PDF
Abstract
Biomass-derived carbon dots (C-dots) are considered a very important carbon material in metal ion detection of their small environmental impact, simple preparation process, and relatively low cost. A green approach for synthesizing biomass-derived C-dots from Chenpi using a hydrothermal method without further processing is proposed in the present study. The as-synthesized C-dots show excellent fluorescence properties, superior resistance to UV irradiation photobleaching, and high photostability in salt-containing solutions. The C-dots were used in the form of label-free fluorescent probes for sensitively detecting Hg2+ selectively. The outcome relationship behaved linearly and was established based on a given range between 10–300 nM concentration, with a detection limit of 7.0 nM. This green strategy obtains a high C-dot quantum yield of 10.8% and satisfactory results in detecting Hg2+ in actual water samples.Graphic Abstract
Keywords
With rapid population growth, urbanization, and industrialization, water pollution is becoming more severe in recent years. Heavy metal pollution is an important global environmental hazard that endangers human health because of its ecotoxicity, permanence, and biotoxicity [1]. Among the various metal ions, Hg2+ easily accumulates in the human body and has strong toxicity [2]. Researchers have reported that Hg2+ is primarily absorbed through the human gastrointestinal tract, respiratory tract, skin, and other tissues, resulting in DNA damage, mitotic damage, and permanent damage to the central nervous system [3]. Therefore, it is very important to identify Hg2+ ions with high selectivity and sensitivity to protect human health and the environment. Various instrument techniques were introduced for Hg2+ detection, such as electrochemical methods, inductively coupled plasma-mass spectroscopy, and atomic absorption spectroscopy [4–6]. Although these methods can successfully detect Hg2+, the sophisticated instrumentation and complicated operation have prompted researchers to look for alternative solutions. The fluorescence method is one of the ideal alternative methods for detecting heavy metal ions due to a series of advantages, such as a rapid response time, good selectivity, sensitivity, simplicity, and visualization of the results.
Fluorophores are a vital component of fluorescence methods. In recent years, fluorescent nanomaterials (especially new fluorescent carbon nanomaterials) have gradually attracted interest due to their low toxicity and biocompatibility. Carbon dots (C-dots), sometimes called carbon quantum dots, possess a size smaller than 10 nm and are considered a new material with excellent development prospects [7]. As an outcome of their facile synthesis process and fluorescence tunability, C-dots have important applications in various areas like biological imaging, drug delivery, and detection [8]. However, it should be pointed out that these application performances can only be obtained after pretreatment like continuous functionalization, surface passivation, and heteroatomic doping, which have severely hampered its commercial application. Furthermore, the high cost of precursors and harsh synthesis conditions also affect the practical application of C-dots. Therefore, developing advanced carbon materials for detecting Hg2+ with abundant raw materials, low cost, environmentally friendly, and nontoxic are highly desirable.
Biomass, a natural material with ubiquitous advantages such as being nontoxic and cheap, is considered a potential substitute for chemical precursors. The biomass-derived C-dots are usually rich in heteroatoms, thus effectively improving fluorescence characteristics and solubility in aqueous media [9]. Chenpi is widely used in Chinese medicine and cooking, and it is prepared by drying the mature peel of white citrus and their related cultivated varieties. Chenpi is cheap and renewable biomass and contains abundant unsaturated bond structures, oxygen-containing groups, and aromatic rings. Therefore, it will be of great significance if Chenpi can be converted into C-dots [10]. However, there are few reports regarding using Chenpi as a precursor for synthesizing C-dots. Thus, the exploration of Chenpi as a precursor of C-dots is expected to further enhance its value and provide innovative ideas for developing a low-cost synthesis process of CQDs.
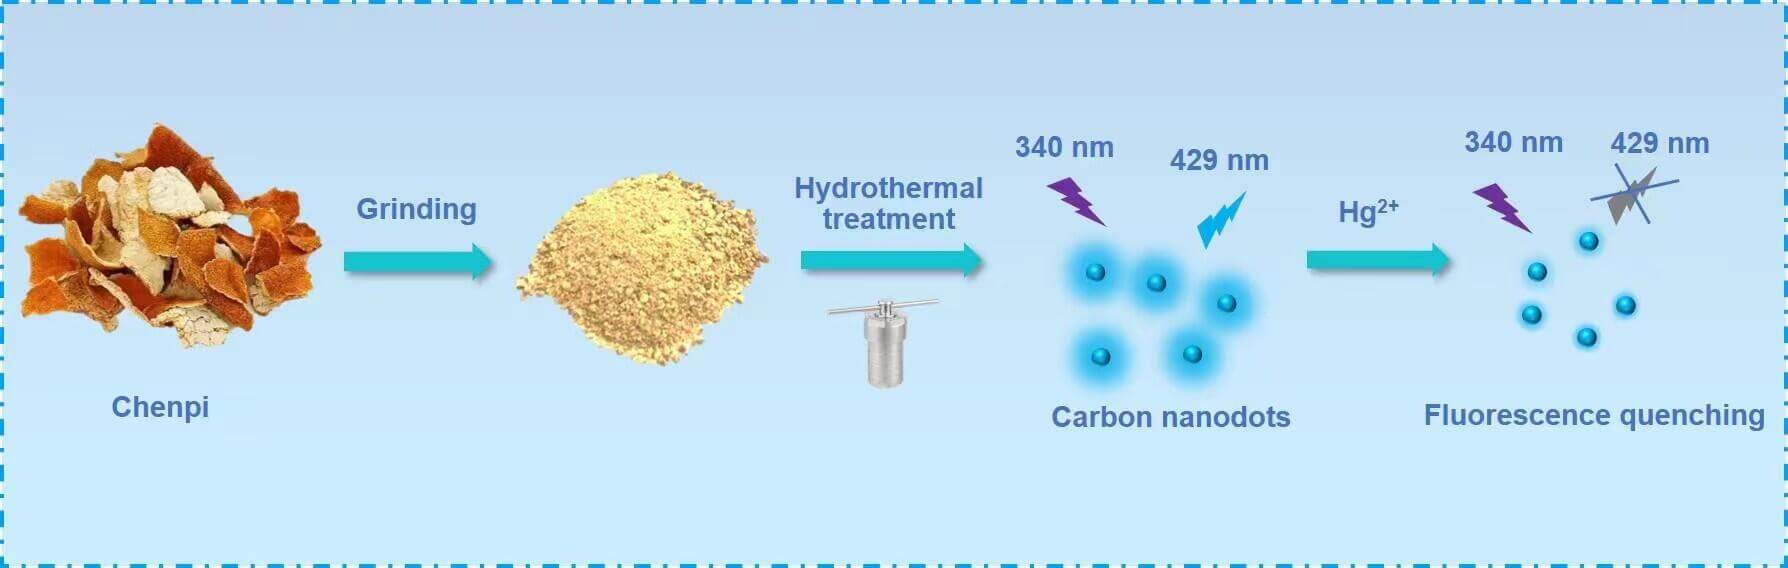
This work proposes a novel synthesis approach that has mild reaction conditions, is environmentally friendly, and uses cheap raw materials. We used orange peels as the carbon source and successfully synthesized water-soluble C-dots through a one-step hydrothermal process. It should be pointed out that synthesized C-dots have good photostability in solutions with high ionic strength and different pH values. Furthermore, these C-dots have a strong resistance to photobleaching. We also successfully developed a sensitive fluorescence analysis method to detect Hg2+ using the remarkable quenching of C-dots fluorescence in the presence of mercury ions. The synthesis and application of the C-dots are shown in Scheme 1.

Scheme 1: Synthesis process and application of C-dots derived from Chenpi biomass
All the Chenpi used in this work was purchased from a local pharmacopoeia. Before use, the Chenpi was washed and crushed. Other chemicals were purchased from Sigma Aldrich and were utilized without purification (analytical grade). Ultrapure water (≥18 MΩ cm−1; Millpore Co., USA) was used throughout the experiment.
To characterize the samples, a transmission electron microscope (TEM) was used to produce TEM images of C-dots that were further analyzed by JEOL-1230 TEM (JEOL, Japan). Fourier transform infrared (FT-IR) spectroscopy analysis was also used to characterize the C-dot samples and was performed using a USA spectrometer (Nicolet Nexus 670 FT-IR spectrometer) with a spectral area of 4000–400 cm−1. The ultraviolet visible (UV-vis) spectrum was recorded via a UV-2450 ultraviolet visible spectrophotometer (Shimadzu Company, Japan). In addition, this paper used a Thermo Fisher Scientific K-Alpha 1063 X-ray photoelectron spectrometer (USA) to conduct X-ray photoelectron spectroscopy (XPS) analysis using Al and K excitation sources. Fluorescence spectrum analysis was conducted via a F-7000 fluorescence spectrophotometer (Hitachi Co., Ltd., Japan). Quinine sulfate was used to calculate the C-dots’ fluorescence quantum yield [11].
The carbon source used in this study was Chenpi, and the C-dots were made using a hydrothermal method. First, 2.0 g dried tangerine peel powder was poured into 10 mL ultrapure water. After a period of time, when the mixture was thoroughly stirred, it was transported to an autoclave (25 mL, Teflon lined) and then warmed to 180°C in an oven for 24 h. When the temperature gradually decreased to ambient conditions, the solution was taken out and centrifuged at 12000 rpm for 20 min. Next, the deionized water was dialyzed using a dialysis membrane with a molecular weight cutoff (MWCO) of 1 kD for a total of 3 days. Finally, the solution was dispersed in deionized water for subsequent experiments. Note: Solid C-dots were obtained via a freeze-drying process to calculate the concentration of C-dots.
This paper used 10 mM phosphate buffer solution (PB) to detect Hg2+ (pH 7.0, room temperature). First, 20 µL of C-dot solution, with a final concentration of 0.6 mg mL−1, was poured into 880 µL PB buffer solution. Next, 100 µL of Hg2+ was added to the PB solution at specific concentrations. The solution was incubated at an ambient temperature of 20°C for 10 min. Then, the corresponding fluorescence emission spectrum was obtained at ambient temperature utilizing a 340 nm excitation wavelength.
2.5 Pretreatment and Preparation of Environmental Samples
In this experiment, tap water samples were obtained from different locations in the lab. The samples that were collected include river water and mountain spring water. All the water samples were subjected to a 24-h natural sedimentation treatment and filtered using filter paper with a maximum pore size of 15–20 µm to remove the suspended river and lake particles. Next, the water sample was centrifuged at 10000 rpm for 20 min. All of the collected supernatants were stored at 4°C. A 0.22 µm microporous membrane was used for sample filtration.
The size and morphology of the C-dots were examined using TEM. According to Fig. 1A, it is apparent that the C-dots have a quasi-spherical shape, and the nanoparticles are well dispersed. Approximately 100 particles were counted in order to obtain their size distribution histogram. These nanoparticles have a diameter of 8.6 ± 2.7 nm, obtained from Fig. 1B.

Figure 1: (A) TEM image of C-dots; (B) C-dots size-distribution histogram
The functional groups of the C-dots were analyzed using FT-IR spectroscopy. According to Fig. 2A, an absorption band of 3413 cm−1 corresponds to the stretching vibrations caused by different bonds, such as the N-H and O-H bonds [12]. Additionally, a strong band of 1604 cm−1 relates to the vibrations resulting from the aromatic stretching behavior of C=C. Another peak at 2933 cm−1 relates to the multiple vibrations caused by the bond stretching of C-H [13]. Moreover, another peak observed at 1760 cm−1 is related to the uneven and asymmetric vibrations caused by COO−, with the peak at 1402 cm−1 corresponding to the even and proportional stretch vibrations [14]. We also found a distinctive absorption band that can be used to classify C-N around 1209 cm−1, meaning that an N atom was doped into the C point [15]. According to the analysis, a maximum of 1071 cm−1 relates to the bending vibrations caused by the bonds in C-O [16].

Figure 2: (A) FT-IR and XPS spectra for (B) C1s, (C) N1s, (D) O1s of C-dots
The chemical configuration and surface elements of the C-dots were examined using XPS. According to Fig. S1, the primary strong peaks of the C-dots are located at 284.8, 399.7, and 531.9 eV, and are related to C1s, N1s, and O1s peaks, respectively [12]. According to the calculation and analysis results, the C, N, and O contents were 63.76%, 4.37%, and 31.86%, respectively. We deconvoluted the high-resolution C1 spectrums at different locations (284.8, 286.1, 286.6, and 287.9 eV) to obtain the corresponding peaks and assigned them to the C-C/C=C, C-OH, C-N, and C-O/C=O groups (Fig. 2B) [13]. The high-resolution N1s spectrum results were interpreted and shown in Fig. 2C. A peak at 399.7 eV was allocated to the C-N group, while 401.8 eV was allocated to N-H group [14]. The O1s spectrum in Fig. 2D shows two fitting peaks eV, of which the peak at 531.2 had been allocated to group C=O, whereas 532.4 was assigned to the group C-O [13]. The results strongly suggest that the C-dots that were synthesized were functionalized with several groups, such as amino, carboxyl, and hydroxyl groups. These functional groups can effectively enhance the C-dots water solubility needed for sensing applications in aqueous solutions [15].
3.2 Optical Properties of C-dots
The fluorescence and UV visible absorption spectrum were further examined to characterize the optical properties of the C-dots. According to Fig. 3A, the C-dots have a relatively wide UV absorption band. The characteristic absorption near 290 nm is a result of π-π∗ conversion in the C=C group. The C-dot’s maximum fluorescence excitation/emission wavelengths are 340 and 429 nm. In Fig. 3A the blue fluorescence at a wavelength of 365 nm is shown. Utilizing quinine sulfate as a reference, we were able to determine the fluorescence quantum yield and obtained a value of 10.8% [11]. Fig. S2 shows the fluorescence spectra of the C-dots with different excitation wavelengths in water. Furthermore, as the excitation wavelength was progressively increased from 260 to 440 nm the maximum emission gradually shifted from 394 to 500 nm. During this process, the emission intensity gradually decreased. The reason for this is due to the surface energy trap or the incomplete size inhomogeneity of some of the functional classes on the surface of the C-dots [14].

Figure 3: (A) Emission (chain line), fluorescence excitation (dashed line), and UV-vis (solid line) spectra of the C-dots. Inset: image of the C-dots below UV 365 nm. (B) Fluorescence emission spectra in the presence of 200 nM Hg2+ and 200 nM Hg2+ + 100 nM cysteine. The excitation wavelength is 340 nm
In our analysis, we analyzed the C-dots fluorescence stability under different experimental conditions. The research methods used include fluorescence spectrum analysis and the change of fluorescence intensity as a result of photobleaching, ionic strength, and pH value. It is clear from Fig. S3A that the fluorescence intensity reduces under alkaline and acidic conditions, with the highest value occurring at pH 7. Therefore, further sensing experiments were carried out in neutral media. We exposed the C-dots to a NaCl mixture containing various proportions to analyze the fluorescence intensity variations resulting from ionic strength. Fig. S3B shows that when the NaCl concentration gradually reaches 4.0 M, the fluorescence intensity does not significantly change. A Xe lamp measured photostability via constant UV (360 nm) irradiation exposure. The change in fluorescence intensity under continuous UV irradiation is shown in Fig. S3C. The fluorescence intensity changed minimally over 1 h, revealing that the C-dots can resist photobleaching. Moreover, the C-dots exhibit strong stability in the air when stored for a month at room temperature (Fig. S3D). According to the above data, the C-dots synthesized in this paper have excellent stability, thus, increasing their potential use in numerous applications.
3.4 Fluorescence Response of C-dots to Hg2+
There are different types of oxygen-containing functional groups (that include hydroxyl and carboxyl groups) on the surface of the C-dots, making them an excellent candidate for detecting metal ions [13,15]. In this study, Hg2+ was added to the C-dots aqueous mixture, and a thorough analysis of the fluorescence response of Hg2+ to the C-dots was conducted. According to Fig. 3B, when there is no Hg2+, the C-dots have a relatively strong fluorescence emission. In the presence of 200 nM Hg2+, the fluorescence of the C-dots is severely weakened. This analysis revealed that the efficient quenching of the C-dots fluorescence might result from the relatively sturdy chelating properties of the carboxyl group for mercury on the surface of C-dots, which gradually forms non-fluorescent complexes. Additionally, a non-radiative electron/hole recombination process occurs, quenching the static fluorescence caused by the annihilation of the electron transfer process [17,18]. This quenching mechanism has been demonstrated in previous studies, where the coupling agents such as cysteine can restore the quenched fluorescence of the C-dots [19]. Moreover, after adding cysteine to the solution, the fluorescence recovers to some extent as shown in Fig. 3B, and is consistent with our expected results. The fluorescence quenching of the C-dots occurs primarily due to the chelation between the C-surface groups and Hg2+.
3.5 Optimization of Detection Conditions
The incubation time, C-dot concentration, solution pH, and other parameters were optimized to improve the detection sensitivity. The highest fluorescence intensity value occurred when the pH was 7.0 as displayed in Fig. S3A. Based on this, we used a pH 7.0 buffer to achieve the highest fluorescence intensity. According to Fig. S4A, the fluorescence quenching rate [(F0-F)/F0] is highest when the C-dot concentration was 0.6 mg mL−1 and therefore was the best detection concentration. Furthermore, we discussed the dependence between the fluorescence quenching efficiency of Hg2+ and the reaction time (Fig. S4B). After adding 200 nM Hg2+, the fluorescence quenching gradually reaches a constant value within 10 min and, according to the above results, has rapid quenching kinetics.
3.6 The Analytical Performance
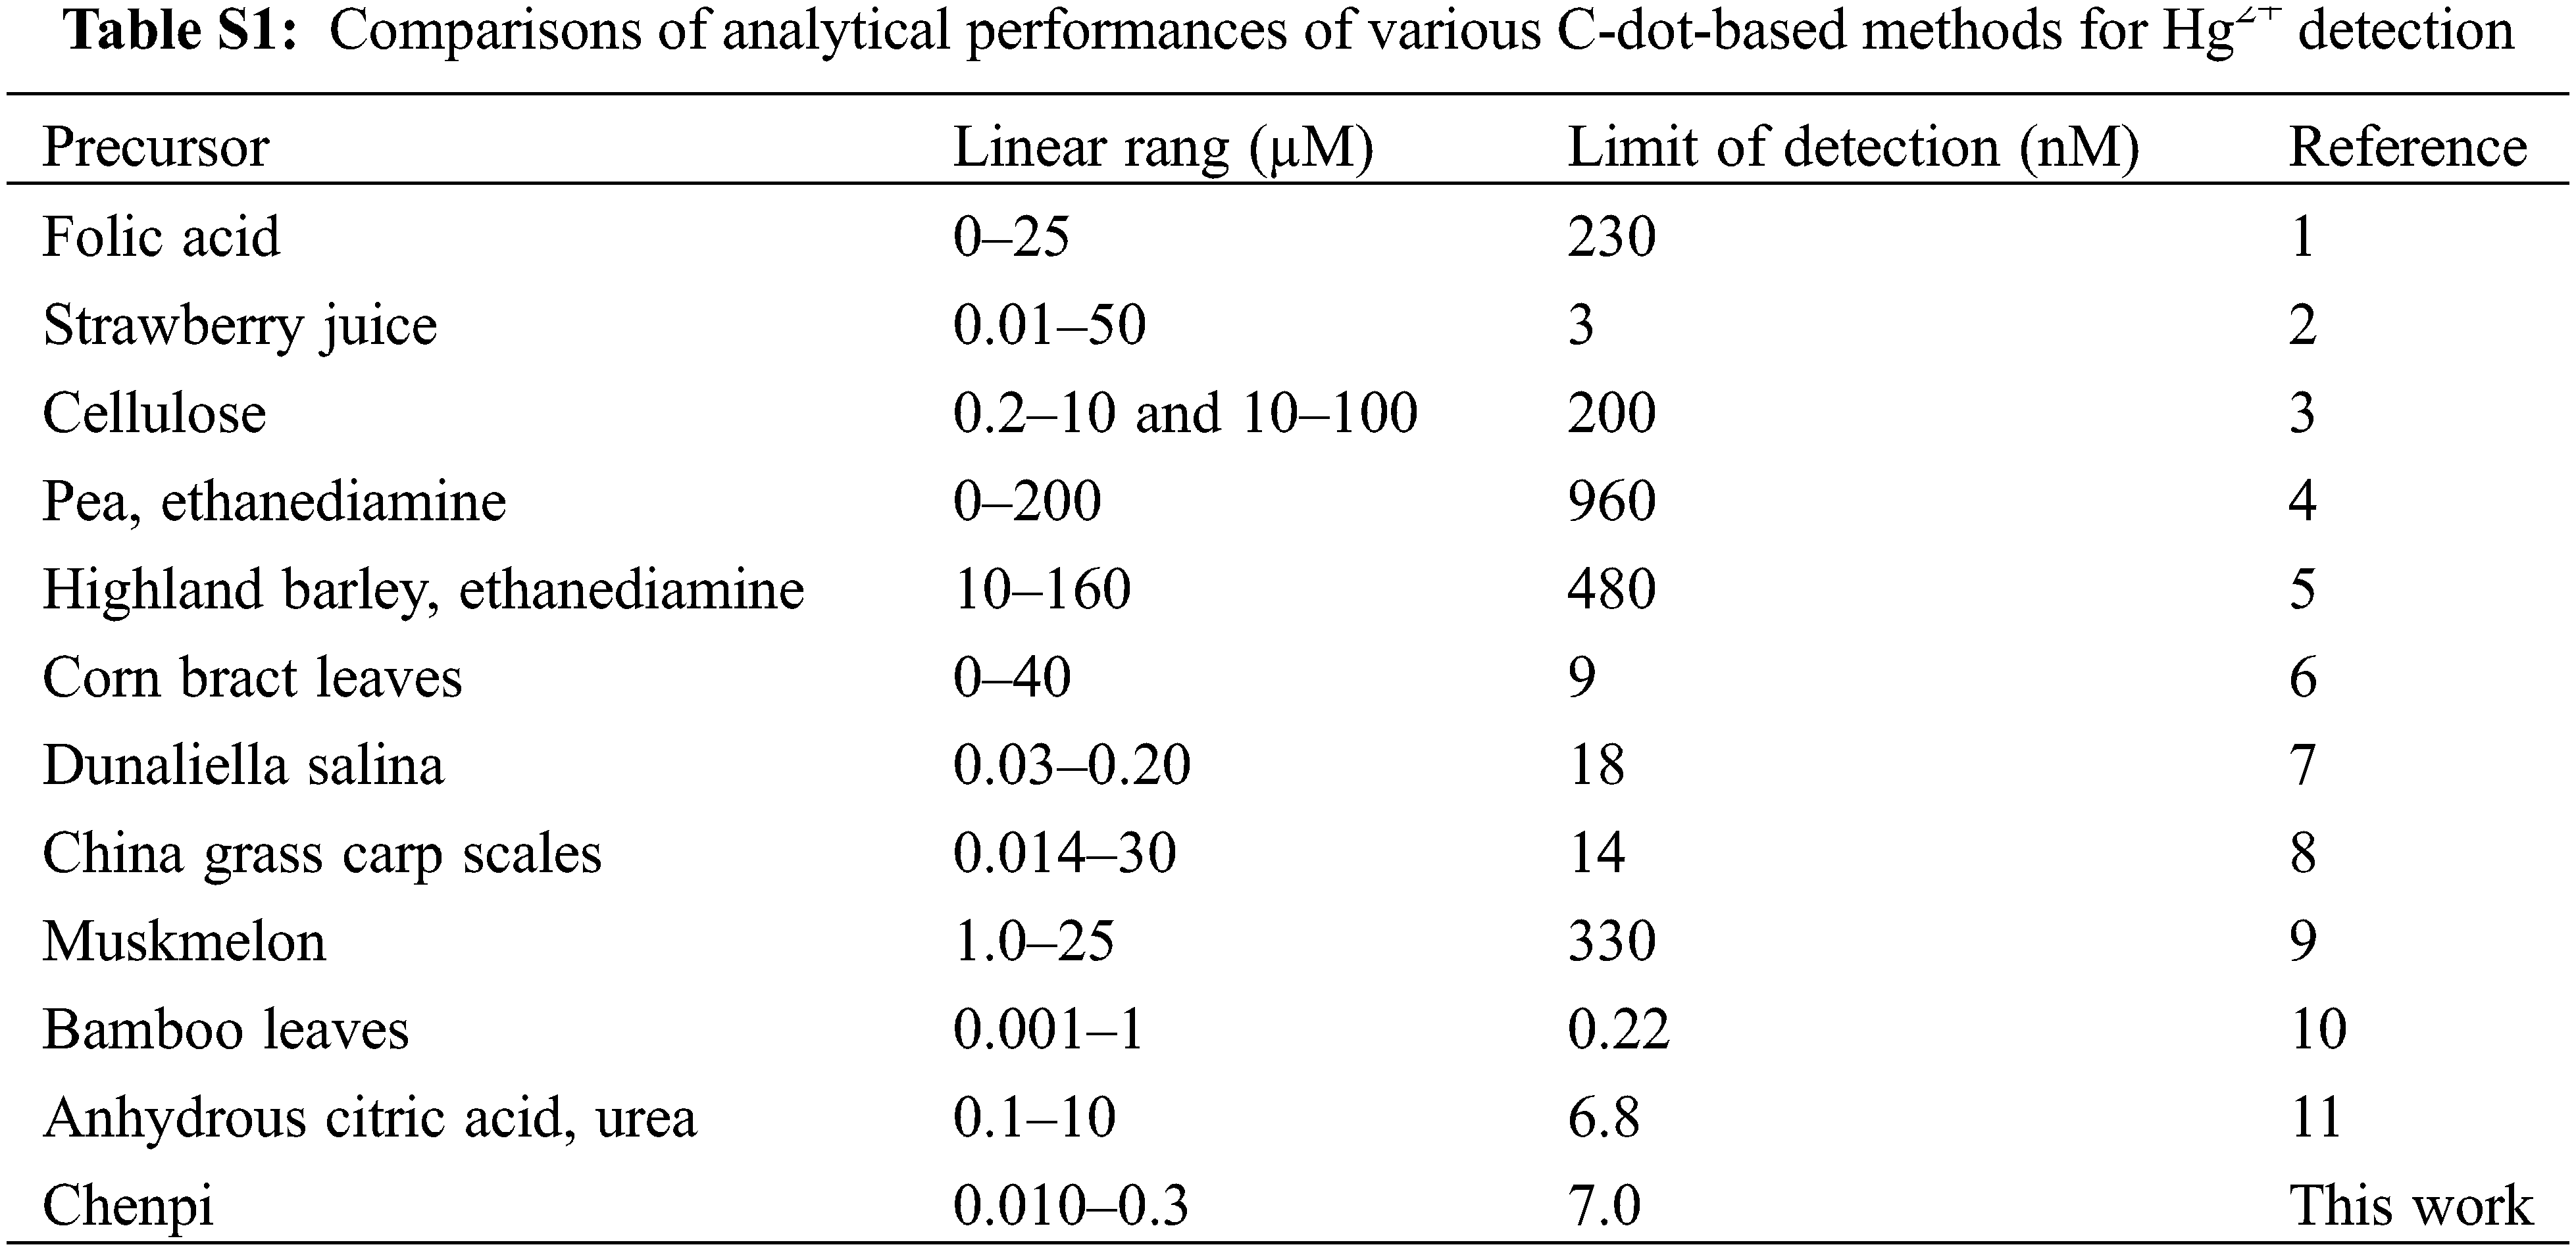
We adopt the best determination conditions to comprehensively analyze and evaluate the Hg2+ detection method proposed in this study as well as discuss its analytical performance. The fluorescence spectrum analysis results of the C-dots synthesized under various Hg2+ concentrations are shown in Fig. 4A. The fluorescence intensity of the C-dots is significantly reduced after gradually increasing the concentration of Hg2+. According to Fig. 4B, there exists a relation among the fluorescence intensities and the mercury’s mass between 10–300 nM, which appears to follow a linear behavior. The calibration equation is as follows: y = 0.0018x + 0.00567 (R2= 0.9798), where x represents the concentration of Hg2+ and y represents the fluorescence quenching rate [(F0-F)/F0]. In addition, this study calculated the limit of detection (LOD) according to a three-times standard deviation, and the result (7.0 nM) exceeded the safety level (10 nM) that is set as a standard requirement by the US Environmental Protection Agency for drinking water. These results indicate that it is an ideal candidate for detecting mercury in water specimens. Table S1 lists a comparative analysis between the results obtained in this paper and the Hg2+ detection methods previously reported [9,17,20,21–26]. The results show that this detection method is analogous or even superior to most C-dot detection methods.

Figure 4: Fluorescence spectra corresponding to the C-dots and various concentrations of Hg2+. A linear relationship exists among the fluorescence quenching rate and the Hg2+ concentration. (The error line has been magnified three times. The excitation wavelength is 340 nm)
Furthermore, careful selection can be regarded as a critical factor when evaluating the efficiency of the sensor systems. When there are representative metal ions, the fluorescence intensity will change. The influences of some of the potentially competing substances in natural water specimens include Hg2+, Al3+, Cu2+, Ca2+, Fe3+, Cd2+, Ba2+, Na+, Mg2+, Zn2+, Co2+, Pb2+, Ni2+, Mn2+, and K+ were investigated. Fig. S5 (black column) shows that the Hg2+ causes greater fluorescence quenching than the other ions. Furthermore, Hg2+ and each potentially competing substance were mixed for interference testing. As shown in Fig. S5 (red column), the other substances show negligible interference in the detection of Hg2+, showing superior selectivity for Hg2+. The results show that this detection method has good selectivity and specificity towards Ho2+, which is consistent with that reported in the iterature [27–31].
3.7 Detection of Hg2+ in Real Specimens
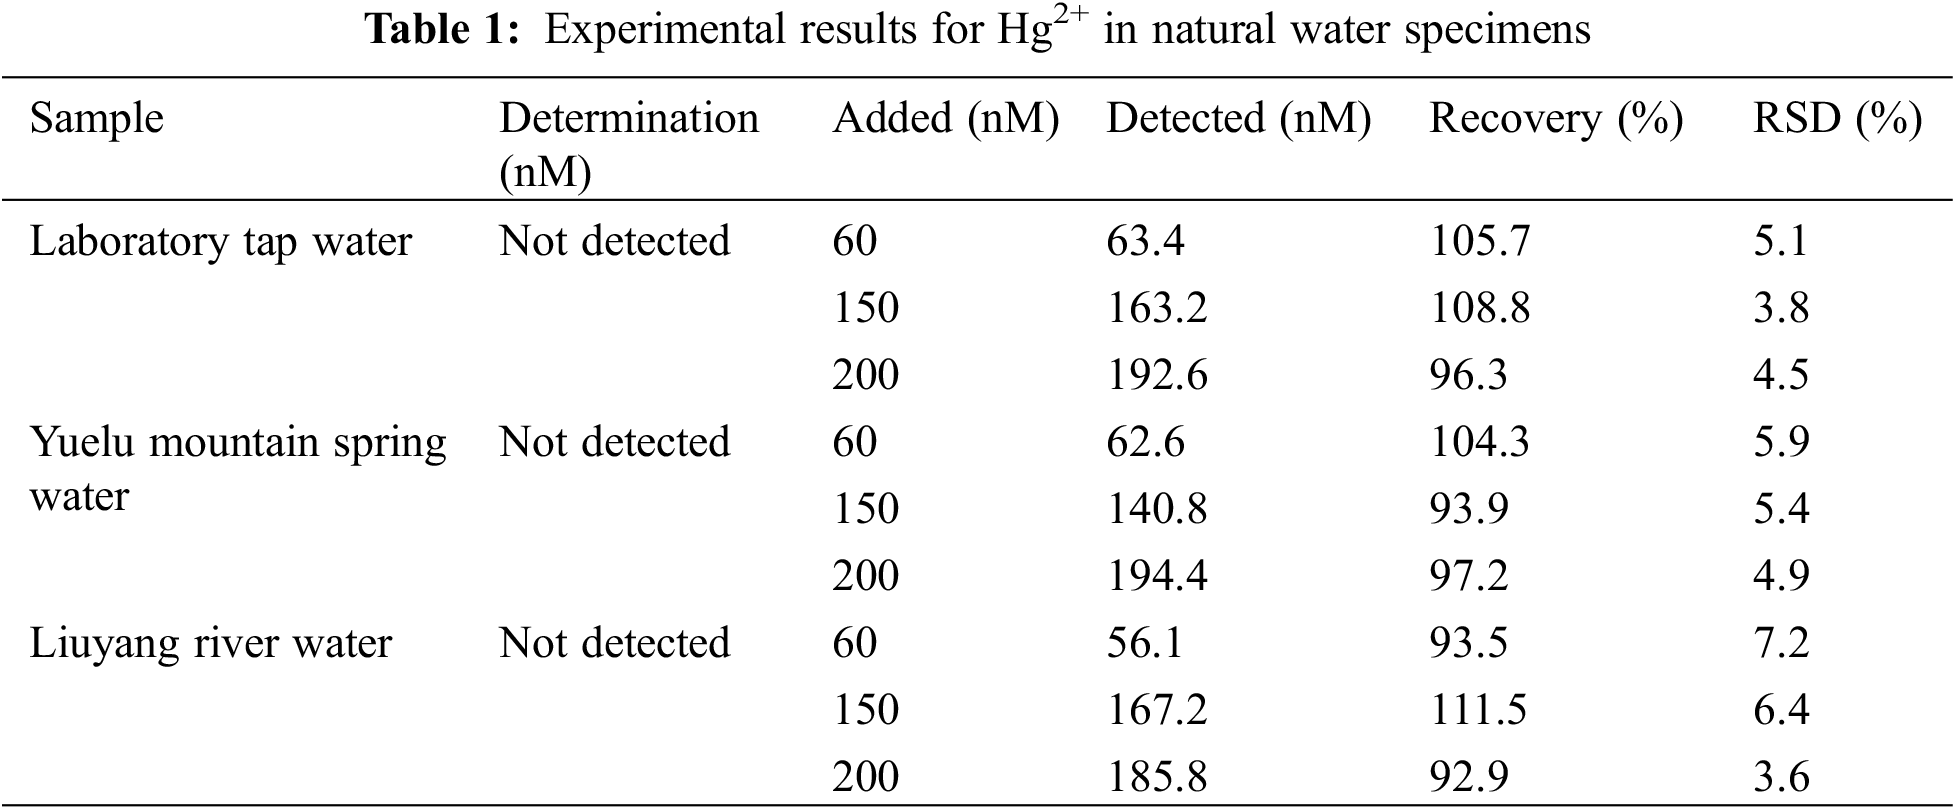
To verify the practical application of this method, we use the basic addition method to analyze and determine Hg2+ concentrations in the stream, pond, and tap water. All the water samples were subjected to a 24-h natural sedimentation treatment, and a filter paper with a maximum pore size of 15–20 µm was used to filter the suspended particles in the river and lake water. Table 1 shows that no Hg2+ in the original water samples was detected. All samples were spiked with a known amount of Hg2+, and the recovery and relative standard deviation (RSD) were calculated. According to Table 1, the recovery of all the water samples ranged from 92.9%–111.5%, and the RSD was less than 7.2%, verifying that this method can be applied to detect Hg2+ in water samples.
This study used a simple hydrothermal method and the natural biomass (Chenpi) as the required precursor material to synthesize C-dots with high fluorescence performance. During this process, chemical treatment is not required. The synthesized C-dots showed excellent photostability and can be utilized as new fluorescent probes to achieve sensitive and label-free mercury detection. The results obtained through the current study can provide innovative ideas for identifying mercury in water samples and help expand the sustainable utilization of biomass waste.
Acknowledgement: The author would like to thank AiMi Academic Services (www.aimieditor.com) for the English language editing and review services.
Funding Statement: This research was financially supported by the Development Program of Hunan Province (No. 2020SK2128).
Conflicts of Interest: The authors declare that they have no conflicts of interest to report regarding the present study.
References
1. Vareda, J. P., Valente, A. J. M., Durães, L. (2019). Assessment of heavy metal pollution from anthropogenic activities and remediation strategies: A review. Journal of Environmental Management, 246(8), 101–118. https://doi.org/10.1016/j.jenvman.2019.05.126 [Google Scholar] [PubMed] [CrossRef]
2. Li, W. C., Tse, H. F. (2015). Health risk and significance of mercury in the environment. Environmental Science and Pollution Research, 22(1), 192–201. https://doi.org/10.1007/s11356-014-3544-x [Google Scholar] [PubMed] [CrossRef]
3. Counter, S. A., Buchanan, L. H. (2004). Mercury exposure in children: A review. Toxicology and Applied Pharmacology, 198(2), 209–230. https://doi.org/10.1016/j.taap.2003.11.032 [Google Scholar] [PubMed] [CrossRef]
4. Thongsaw, A., Udnan, Y., Ross, G. M., Chaiyasith, W. C. (2019). Speciation of mercury in water and biological samples by eco-friendly ultrasound-assisted deep eutectic solvent based on liquid phase microextraction with electrothermal atomic absorption spectrometry. Talanta, 197, 310–318. https://doi.org/10.1016/j.talanta.2019.01.018 [Google Scholar] [PubMed] [CrossRef]
5. Hsu, I. H., Hsu, T. C., Sun, Y. C. (2011). Gold-nanoparticle-based graphite furnace atomic absorption spectrometry amplification and magnetic separation method for sensitive detection of mercuric ions. Biosensors and Bioelectronics, 26(11), 4605–4609. https://doi.org/10.1016/j.bios.2011.04.048 [Google Scholar] [PubMed] [CrossRef]
6. Cheng, H., Zhang, W. W., Wang, Y. C., Liu, J. H. (2018). Interfacing nanoliter liquid chromatography and inductively coupled plasma mass spectrometry with an in-column high-pressure nebulizer for mercury speciation. Journal of Chromatography A, 1575, 59–65. https://doi.org/10.1016/j.chroma.2018.09.023 [Google Scholar] [PubMed] [CrossRef]
7. Xu, Y., Li, P. P., Cheng, D., Wu, C. Y., Lu, Q. J. et al. (2020). Group IV nanodots: Synthesis, surface engineering and application in bioimaging and biotherapy. Journal of Materials Chemistry B, 8(45), 10290–10308. https://doi.org/10.1039/D0TB01881C [Google Scholar] [PubMed] [CrossRef]
8. Chan, M. H., Chen, B. G., Ngo, L. T., Huang, W. T., Li, C. H. et al. (2021). Natural carbon nanodots: Toxicity assessment and theranostic biological application. Pharmaceutics, 13(11), 1874. https://doi.org/10.3390/pharmaceutics13111874 [Google Scholar] [PubMed] [CrossRef]
9. Torres, L. S. D., Reddy, B. N. K., Kaur, I., Batra, V., Agarwal, V. (2022). Heavy metal ion detection using green precursor derived carbon dots. iScience, 25(2), 103816. https://doi.org/10.1016/j.isci.2022.103816 [Google Scholar] [PubMed] [CrossRef]
10. Yu, X., Sun, S., Guo, Y. Y., Liu, Y., Yang, D. Y. et al. (2018). Citri Reticulatae Pericarpium (ChenpiBotany, ethnopharmacology, phytochemistry, and pharmacology of a frequently used traditional Chinese medicine. Journal of Ethnopharmacology, 220(6), 265–282. https://doi.org/10.1016/j.jep.2018.03.031 [Google Scholar] [PubMed] [CrossRef]
11. Jayaweera, S., Yin, K., Hu, X., Ng, W. J. (2019). Fluorescent N/Al Co-doped carbon dots from cellulose biomass for sensitive detection of manganese (VII). Journal of Fluorescence, 29(6), 1291–1300. [Google Scholar] [PubMed]
12. Ye, Q. H., Yan, F. Y., Luo, Y. M., Wang, Y. Y., Zhou, X. G. et al. (2017). Formation of N, S-codoped fluorescent carbon dots from biomass and their application for the selective detection of mercury and iron ion. Spectrochimica Acta Part A: Molecular and Biomolecular Spectroscopy, 173, 854–862. [Google Scholar] [PubMed]
13. Xie, Y. D., Cheng, D. D., Liu, X. L., Han, A. (2019). Green hydrothermal synthesis of N-doped carbon dots from biomass highland barley for the detection of Hg2+. Sensors, 19(14), 3169. [Google Scholar] [PubMed]
14. Zhou, C., Wu, S. W., Qi, S. H., Song, W. J., Sun, C. Y. (2021). Facile and high-yield synthesis of N-doped carbon quantum dots from biomass quinoa saponin for the detection of Co2+. Journal of Analytical Methods in Chemistry, 2021, 9732364. [Google Scholar] [PubMed]
15. Gao, R., Wu, Z. B., Wang, L., Liu, J., Deng, Y. J. et al. (2020). Green preparation of fluorescent nitrogen-doped carbon quantum dots for sensitive detection of oxytetracycline in environmental samples. Nanomaterials, 10(8), 1561. [Google Scholar] [PubMed]
16. Huang, H., Lv, J. J., Zhou, D. L., Bao, N., Xu, Y. et al. (2013). One-pot green synthesis of nitrogen-doped carbon nanoparticles as fluorescent probes for mercury ions. RSC Advances, 3(44), 21691–21696. [Google Scholar]
17. Zhang, S. Y., Gao, M. J., Zhai, Y. P., Wen, J. Q., Yu, J. K. et al. (2022). Which kind of nitrogen chemical states doped carbon dots loaded by g-C3N4 is the best for photocatalytic hydrogen production. Journal of Colloid and Interface Science, 622, 662–674. [Google Scholar] [PubMed]
18. Dong, Y. Q., Pang, H. C., Yang, H. B., Guo, C. X., Shao, J. W. et al. (2013). Carbon-based dots co-doped with nitrogen and sulfur for high quantum yield and excitation-independent emission. Angewandte Chemie International Edition, 52(30), 7800–7804. [Google Scholar] [PubMed]
19. Hou, Y. X., Lu, Q. J., Deng, J. H., Li, H. T., Zhang, Y. Y. (2015). One-pot electrochemical synthesis of functionalized fluorescent carbon dots and their selective sensing for mercury ion. Analytica Chimica Acta, 866, 69–74. [Google Scholar] [PubMed]
20. Zhang, R. Z., Chen, W. (2014). Nitrogen-doped carbon quantum dots: Facile synthesis and application as a turn-off fluorescent probe for detection of Hg2+ ions. Biosensors and Bioelectronics, 55, 83–90. [Google Scholar] [PubMed]
21. Huang, H. L., Ge, H., Ren, Z. P., Huang, Z. J., Xu, M. et al. (2021). Controllable synthesis of biocompatible fluorescent carbon dots from cellulose hydrogel for the specific detection of Hg2+. Frontiers in Bioengineering and Biotechnology, 2021(9), 617097. [Google Scholar]
22. Xie, Y. D., Wang, S. S., Fu, N., Yang, Y., Liu, X. L. et al. (2020). Green preparation of carbon dots for Hg2+ detection and cell imaging. Materials Express, 10(11), 1777–1787. [Google Scholar]
23. Zhao, J. J., Huang, M. J., Zhang, L. L., Zou, M. B., Chen, D. X. et al. (2017). Unique approach to develop carbon dot-based nanohybrid near-infrared ratiometric fluorescent sensor for the detection of mercury ions. Analytical Chemistry, 89(15), 8044–8049. [Google Scholar] [PubMed]
24. Singh, A. K., Singh, V. K., Singh, M., Singh, P., Khadim, S. R. et al. (2019). One pot hydrothermal synthesis of fluorescent NP-carbon dots derived from Dunaliella salina biomass and its application in on-off sensing of Hg (IICr (VI) and live cell imaging. Journal of Photochemistry and Photobiology A: Chemistry, 376, 63–72. [Google Scholar]
25. Liu, G. H., Jia, H. S., Li, N., Li, X. Y., Yu, Z. Y. et al. (2019). High-fluorescent carbon dots (CDs) originated from China grass carp scales (CGCS) for effective detection of Hg(II) ions. Microchemical Journal, 145, 718–728. [Google Scholar]
26. Wang, L., Yu, L., Ge, H., Bu, Y., Sun, M. et al. (2022). A novel reversible dual-mode probe based on amorphous carbon nanodots for the detection of mercury ion and glutathione. Microchemical Journal, 175, 107181. [Google Scholar]
27. Liu, H., Xu, H., Li, H. (2022). Detection of Fe3+ and Hg2+ ions by using high fluorescent carbon dots doped with S and N as fluorescence probes. Journal of Fluorescence, 32(3), 1089–1098. [Google Scholar] [PubMed]
28. Liu, Y., Su, L., Wang, S., Guo, Z., Hu, Y. (2022). A ratiometric fluorescence sensor based on carbon quantum dots realized the quantitative and visual detection of Hg2+. Luminescence, 37(2), 220–229. [Google Scholar] [PubMed]
29. Tang, K., Chen, Y., Tang, S., Wu, X., Zhao, P. et al. (2023). A smartphone-assisted down/up-conversion dual-mode ratiometric fluorescence sensor for visual detection of mercury ions and l-penicillamine. The Science of the Total Environment, 856, 159073. [Google Scholar] [PubMed]
30. Hao Guo, N. W., Peng, L., Chen, Y., Liu, Y., Li, C. et al. (2022). A novel ratiometric fluorescence sensor based on lanthanide-functionalized MOF for Hg2+ detection. Talanta, 250, 123710. [Google Scholar] [PubMed]
31. Singh, S., Kansal, S. K. (2022). Dual fluorometric detection of Fe3+ and Hg2+ ions in an aqueous medium using carbon quantum dots as a “turn-off” fluorescence sensor. Journal of Fluorescence, 32(3), 1143–1154. [Google Scholar] [PubMed]
Appendix

Figure S1: XPS survey spectra of the C-dots
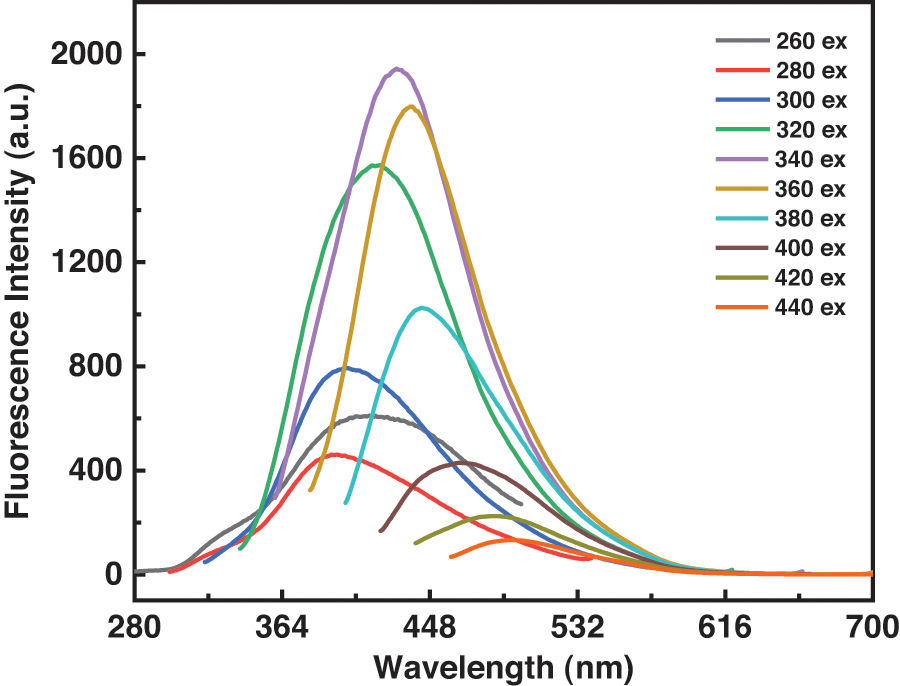
Figure S2: Fluorescence emission spectra of the C-dots at different excitation wavelengths
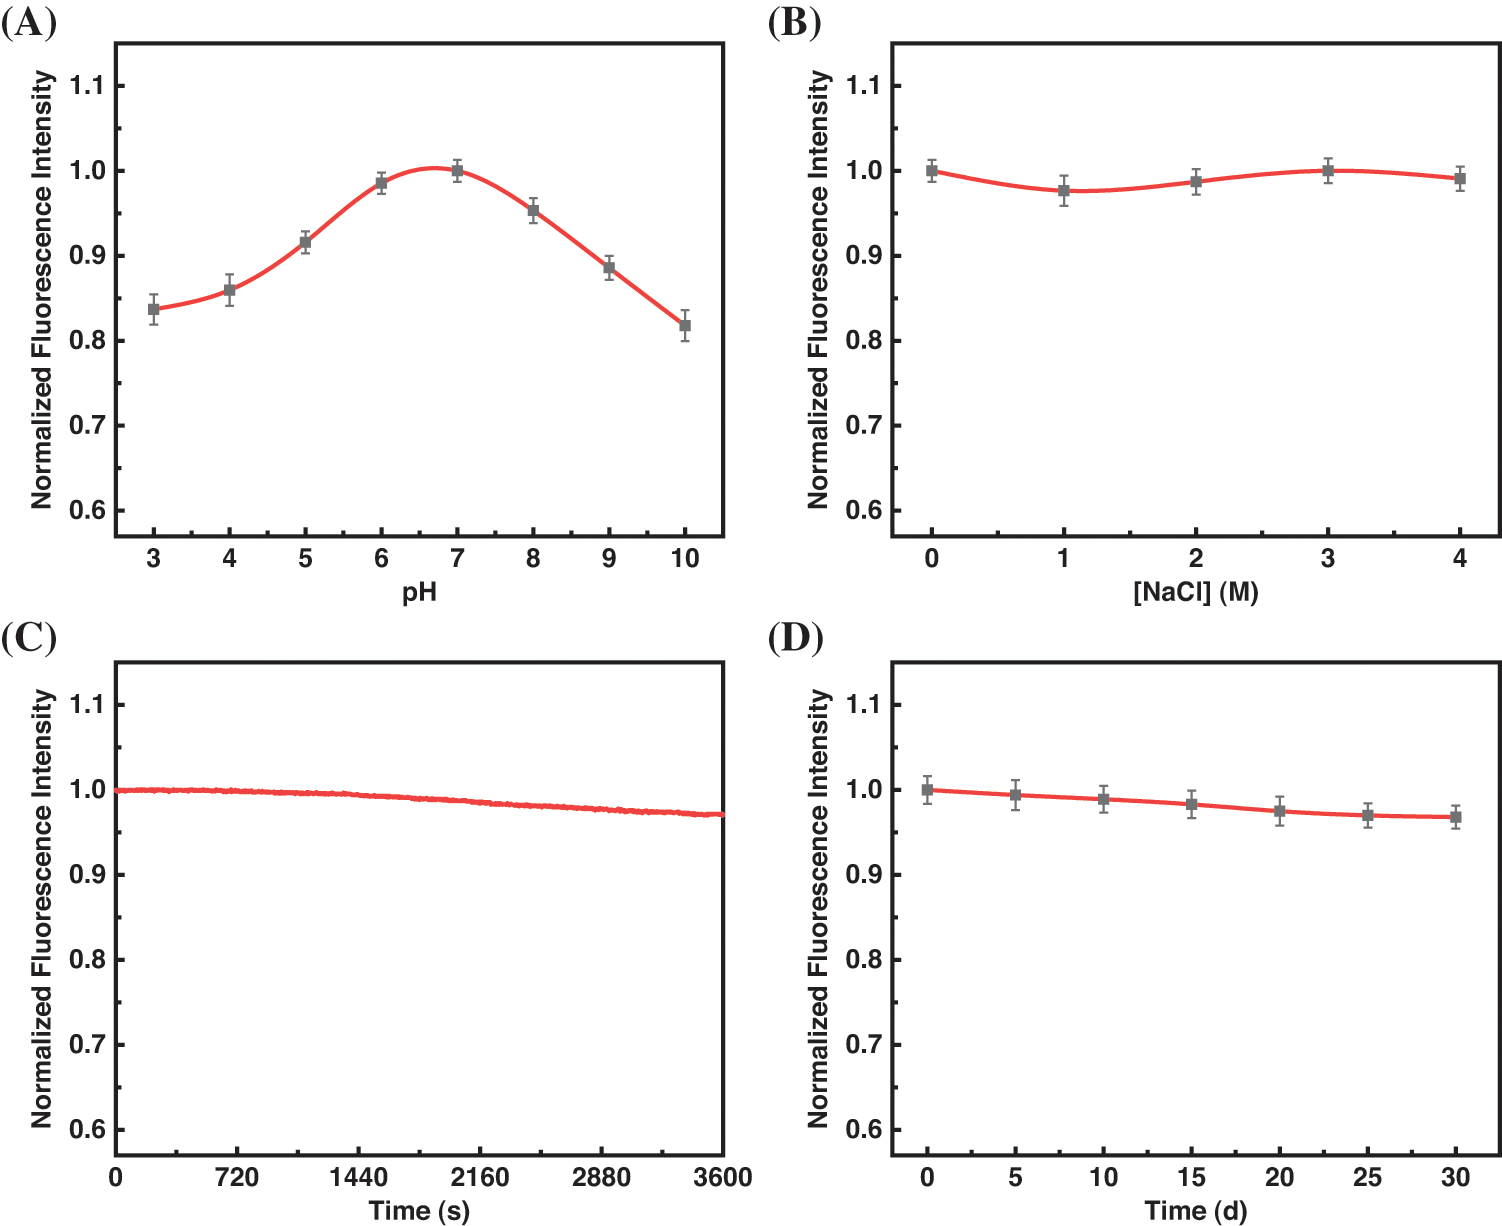
Figure S3: Normalized fluorescence intensity of the C-dots (A) at different pH, (B) in the presence of different concentrations of NaCl, (C) continuous excitation with a 150 W Xe lamp for 60 min, and (D) at room temperature for a mouth (The error bars were magnified by a factor of three. The excitation wavelength is 340 nm; emission wavelength is 429 nm)

Figure S4: Effects of (A) various C-dot concentrations, and (B) incubation time on the fluorescence responses of the proposed method for Hg2+ detection (F0 and F correspond to the fluorescence intensity of the C-dots in the absence and presence of Hg2+, respectively. The error bars were magnified by a factor of three. The excitation wavelength is 340 nm; emission wavelength is 429 nm)

Figure S5: The interference of the C-dot solution for the detection of Hg2+ (200 nM) in the presence of other metal ions (2 µM) (The error bars were magnified by a factor of three. The excitation wavelength is 340 nm; emission wavelength is 429 nm)
Cite This Article
 Copyright © 2023 The Author(s). Published by Tech Science Press.
This work is licensed under a Creative Commons Attribution 4.0 International License , which permits unrestricted use, distribution, and reproduction in any medium, provided the original work is properly cited.
 Downloads
 Citation Tools