
 Submit a Paper
 Propose a Special lssue
 Open Access
ARTICLE
Research on Performance Optimization of Liquid Cooling and Composite Phase Change Material Coupling Cooling Thermal Management System for Vehicle Power Battery
1
Changsha University of Science & Technolog, Changsha, 410114, China
2
Hunan Province Key Laboratory of Intelligent Manufacturing Technology for High-Performance Mechanical Equipment,
Changsha, 410114, China
3
Central South University, Changsha, 410083, China
* Corresponding Author: Gang Wu. Email:
Journal of Renewable Materials 2023, 11(2), 707-730. https://doi.org/10.32604/jrm.2022.022276
Received 02 March 2022; Accepted 16 May 2022; Issue published 22 September 2022
 View Full Text
 Download PDF
Abstract
The serpentine tube liquid cooling and composite PCM coupled cooling thermal management system is designed for 18650 cylindrical power batteries, with the maximum temperature and temperature difference of the power pack within the optimal temperature operating range as the target. The initial analysis of the battery pack at a 5C discharge rate, the influence of the single cell to cooling tube distance, the number of cooling tubes, inlet coolant temperature, the coolant flow rate, and other factors on the heat dissipation performance of the battery pack, initially determined a reasonable value for each design parameter. A control strategy is used to regulate the inlet flow rate and coolant temperature of the liquid cooling system in order to make full use of the latent heat of the composite PCM and reduce the pump’s energy consumption. The simulation results show that the maximum battery pack temperature of 309.8 K and the temperature difference of 4.6 K between individual cells with the control strategy are in the optimal temperature operating range of the power battery, and the utilization rate of the composite PCM is up to 90%.Keywords
Nomenclature
| | cooling tube’s sectional width [m] |
| | cooling tube’s sectional height [m] |
| | battery’s specific heat capacity [kJ kg−1 K−1] |
| | CPCM’s specific heat capacity [kJ kg−1 K−1] |
| | cooling tube’s specific heat capacity [kJ kg−1 K−1] |
| | coolant’s specific heat capacity [kJ kg−1 K−1] |
| | fluent equivalent diameter [m] |
| | CPCM’s specific enthalpy [J K−1] |
| | CPCM’s specific sensible heat |
| | natural convection coefficient [W m−2K−1] |
| | battery’s thermal conductivity [W m−1 K−1] |
| | CPCM’s thermal conductivity [W m−1 K−1] |
| | cooling tube’s thermal conductivity [W m−1 K−1] |
| | coolant’s thermal conductivity [W m−1 K−1] |
| | hydrostatic pressure [Pa] |
| | battery’s specific volume heat generation rate |
| | Reynolds number |
| | ambient temperature [K] |
| | battery’s temperature [K] |
| | CPCM’s temperature [K] |
| | CPCM’s initial temperature [K] |
| | CPCM’s liquid phase point temperature [K] |
| | Time [s] |
| | cooling tube’s inner wall temperature [K] |
| | cooling tube’s temperature [K] |
| | cooling tube’s outer wall temperature [K] |
| | CPCM’s solid phase point temperature [K] |
| | coolant’s temperature [K] |
| | coolant’s dynamic viscosity |
| | coolant’s velocity vector [m s−1] |
| | coolant’s flowing speed [m s−1] |
| x, y, z | Cartesian coordinates [m] |
| | nabla operator |
| | CPCM’s liquid fraction [%] |
| | CPCM’s latent heat [J] |
| | battery’s density [kg m−3] |
| | CPCM’s density [kg m−3] |
| | coolant’s density [kg m−3] |
| | cooling tube’s density [kg m−3] |
| | Cooling tube outlet temperature [K] |
As one of the three major components of new energy vehicles, the performance of the power battery directly affects the power, economy, safety, and range of the vehicle. From lead-acid batteries to lithium-ion batteries, energy density has been continuously improved. The market share of lithium-ion batteries is gradually increasing every year because of their long cycle life [1], high energy conversion efficiency, low self-discharge rate, and other advantages. As the energy density of lithium-ion batteries and motor performance improve, new demands are placed on the battery pack management system, particularly the thermal management of battery packs. To shorten the charging time of new energy vehicles, the research direction is to use 800–1000 V high-voltage DC fast charging [2]. In the vehicle’s climbing, rapid acceleration and load conditions, the battery pack needs to be discharged quickly at a rate of 5C or even higher, which all inevitably leads to a short period of rapid heating of the battery pack. The temperature greatly affects battery performance. In low temperature conditions [3], electrolyte activity is reduced, directly leading to increased resistance [4], prompting the battery pack to prematurely reach the end voltage. When charging at low temperatures [5], lithium ions are transferred to the surface of the negative electrode to form lithium dendrites, whose further growth pierces the diaphragm and leads to capacity loss [6] and even the risk of internal short circuit [7]. When the lithium ion works in a high-temperature environment, the battery capacity decays significantly, and there is a risk of thermal runaway [8] or even explosion [9] at high discharge rates. Therefore, to ensure the stable operation of the battery pack and extend its service life, it is necessary to design an efficient battery thermal management system.
The BTMS (battery thermal management system) combines battery heat production mechanism with heat transfer mechanism to solve the problems of thermal runaway and lithium dendrites encountered by the battery under extreme conditions, thus improving the overall battery performance. Its main goal is to ensure that the battery pack operates within the optimal temperature range of 20°C–40°C [10]. Secondary to this is improving the temperature uniformity of the battery pack [11], the uniformity of the internal temperature of a single cell and the uniformity of the temperature between individual cells in the battery pack. Accordingly, the different cooling media can be divided into air cooling [12,13], PCM (phase change material) cooling [14,15], heat pipe cooling [16,17] and liquid cooling [18,19].
Considering the low thermal conductivity of air, air cooling can no longer meet the demand for charging and discharging high energy density battery packs at high rates. Liquid cooling heat dissipation systems have become one of the most important cooling methods used in electric vehicles due to their high thermal conductivity and high specific heat capacity [20] (water [21], glycol [22], mineral oil [23]). According to whether the cooling medium is in direct contact with the battery can be divided into two kinds: direct cooling and indirect cooling. The indirect battery cooling system must include a cooling plate [24], cooling tube or sheath to separate the battery from the coolant in order to avoid the electrical short circuits and chemical corrosion. The addition of cooling tubes not only increases the cost and complexity of the battery pack, but also reduces the overall thermal conductivity and increases the temperature uniformity of the battery pack. Therefore, Lai et al. [25] explored the structural aspects to increase the contact area with the battery, the number of cooling tubes, the coolant flow rate, and the coolant temperature, and found that the coolant flow rate and contact area increase can effectively control the maximum temperature of the battery, but the temperature difference between the battery pack and the power consumption of the pump is larger. To further improve the cooling effect, Liu et al. [26] used new coolants such as liquid metal, such as PCM nanoemulsion [27] and two-phase refrigerant [28], and the experiments show that the cooling effect is significantly improved at the same power consumption.
To eliminate the adverse effects of indirect cooling, reduce the structure’s complexity, cost, manufacturability and maintainability. At the same time, direct cooling is the best choice to meet the comprehensive requirements of system heat dissipation, compactness and thermal runaway suppression. Wu et al. [29] designed a direct cooling thermal management system with negative pressure suction of insulating silicone oil, in which the silicone oil flows over the entire surface of the cell to dissipate heat uniformly and is compact compared to direct cooling. It also has higher heat dissipation efficiency and air isolation capability, which can effectively control the propagation of thermal runaway. Wang et al. [30] used highly insulated No. 10 transformer oil as an immersion coolant and found that increasing the coolant flow rate and quality can extend the operating time of the optimal operating range of the battery pack and reduce the maximum temperature and temperature difference of the battery pack. Direct cooling has been successfully applied to data center servers and electronic devices, etc. Automotive power batteries have not been used on a large scale due to sealing requirements, reliability and safety uncertainties.
PCM cooling as a new thermal management application solution, PCM can absorb a large amount of heat during the phase change process PCM applied to the battery pack benefits from the fact that it does not require additional energy consumption, its simple structure is suitable for all shapes of batteries and it provides excellent control of the temperature uniformity of the battery pack. However, there are also significant disadvantages, as its low thermal conductivity leads to poor thermal conductivity of the system, and heat is absorbed rather than dissipated. It usually performs well in the first cycle, and local heat build-up will occur in successive cycles. Many attempts have been made to improve the thermal conductivity of organic PCMs, such as adding expanded graphite [31], graphene [32], metal nanoparticles [33], carbon fibers [34], and foam metals [35] to PCMs. In addition, to improve the practicality of PCM, polymeric materials [36] with higher melting points are often added as support frames to inhibit PCM leakage. Lin et al. [37] formulated a flexible ternary PCM composed of high thermal conductivity polymer, paraffin wax and expanded graphite. The addition of polymer and expanded graphite forms a laminar structure that not only prevents leakage of liquid paraffin wax, but also improves thermal conductivity and resistance to deformation. The thermal conductivity of the composite PCM is even as high as 2.671–10.019 W m−1K−1, which is 6.183–23.192 times higher than that of pure paraffin wax. Pan et al. [38] designed and prepared a composite PCM composed of cut copper fiber sintered skeletal porous metal material and paraffin wax, and the scales and grooves appeared on the surface of copper fiber during cutting effectively increased the surface area.
To satisfy the demand for safe operation under faster charging and discharging rates of battery packs, researchers have tried to couple conventional thermal management methods to achieve the effect of complementary advantages. For example, PCM-liquid coupled cooling [39,40], PCM-heat pipe coupled cooling [41,42], heat pipe-air-cooled coupled cooling, air-cooled-liquid-cooled coupled cooling [43], all can control the battery pack temperature below 323 K. However, it is a challenge to balance the cooling efficiency of each cooling method in the coupling system. Zhuang et al. [44] designed a honeycomb arrangement of PCM coupled with a micro-channel cooling plate thermal management system. The addition of the cooling plate effectively solves the thermal aggregation caused by the low thermal conductivity of PCM, and the temperature between power cells has good consistency. Heat is rapidly transferred out of the battery pack by liquid cooling, even before reaching the PCM phase change temperature, which means that all heat is stored in the PCM sensible heat. Zheng et al. [45] applied PCM coupled with liquid cooling to a cylindrical cell and analyzed the effects of flow direction, coolant flow rate, thermal insulation interlayer and the presence or absence of PCM on the thermal performance at 8-C discharge rate. The addition of the thermal insulation interlayer eliminated the harmful heat conduction between adjacent cooling tubes, and the addition of PCM and the alternating flow of adjacent cooling tubes greatly improved the cell pack temperature uniformity. Nevertheless, the variation of the phase change spacing of the PCM has little effect on the cooling performance of the coupling system, and the latent heat of the PCM is difficult to fully utilize. These results indicate that the latent heat utilization of PCM is not high in an efficient coupled thermal management system, and even high thermal conductivity materials can be used instead of PCM. But it is the latent heat of PCM that makes the battery pack temperature more uniform and, at the same time, makes the power consumption of liquid cooling lower. Therefore, when designing a liquid-cooled-PCM coupled thermal management system, the utilization rate of PCM latent heat should be fully considered, and liquid-cooled recovery of PCM latent heat should be timely to prevent thermal aggregation.
Aiming to solve the challenge of thermal management under the high rate of battery pack discharge, this study proposes a new liquid-cooled-PCM coupled thermal management system. In which the composite PCM is the main heat dissipation material, so that the battery is always in the optimal operating temperature range with proper temperature uniformity during 8C discharge, and the liquid cooling is responsible for timely recovery of latent heat from the composite PCM. Monitoring points are set in the battery pack to observe the temperature change, and the coolant flow rate and temperature in the liquid cooling are adjusted according to the temperature change to reduce unnecessary power consumption and improve the utilization of the composite PCM. Firstly, experimental and numerical simulations are conducted to compare the thermal characteristics of a single power cell to verify the reliability of the numerical model. Next, the thermal characterization of the coupled liquid-cooled-PCM thermal management system is investigated over a cycle. Then the effects of PCM thickness, coolant flow rate, number of cooling tubes, and other factors on the thermal performance are analyzed, and each design parameter is initially determined. Finally, the control strategy of the liquid-cooled-PCM coupled thermal management system is introduced, and the results are analyzed and compared with the conventional coupled system.
2 Thermal Management System Description
Fig. 1 below shows the conceptual design of the liquid and CPCM (composite phase change material) in the battery pack. The battery pack consists of 24 18650 Li-ion cells, 2 aluminum cooling tubes (3 × 6 mm cross-section), and the CPCM [46]. The size of the single cell is 65 mm in height and 18 mm in diameter. The nominal capacity of the battery is 2000 mAh, and the electrode material is lithium cobaltate ternary material. The shell material is nickel-plated steel. The rated voltage is 3.7 V, the maximum charging voltage is 4.2 V, and the maximum continuous discharge current is 10 A. Compared with a round tube of the same size, the surface area of the square tube is significantly larger than the round tube. The increase in surface area means that the heat exchange area between the cooling tube and CPCM also increases, thus increasing the heat exchange between them and improving the heat dissipation performance of the battery pack. There are two important reference indicators for the selection of PCM: latent heat of phase change and phase change temperature. In this study [47], paraffin wax was selected as the PCM, and its latent heat of phase change and phase change temperature are 196.8 J/g, and 302–307 K. In addition, paraffin wax is very stable and exhibit, no subcooling and phase separation during the phase change, as well as a small volume change before and after the phase change. The coolant flow in adjacent cooling tubes is reversed to ensure the temperature uniformity of the battery pack. The coolant is a 50% water-glycol mixture, which has better resistance to cold weather than water, and the relevant physical parameters are shown in Table 1.
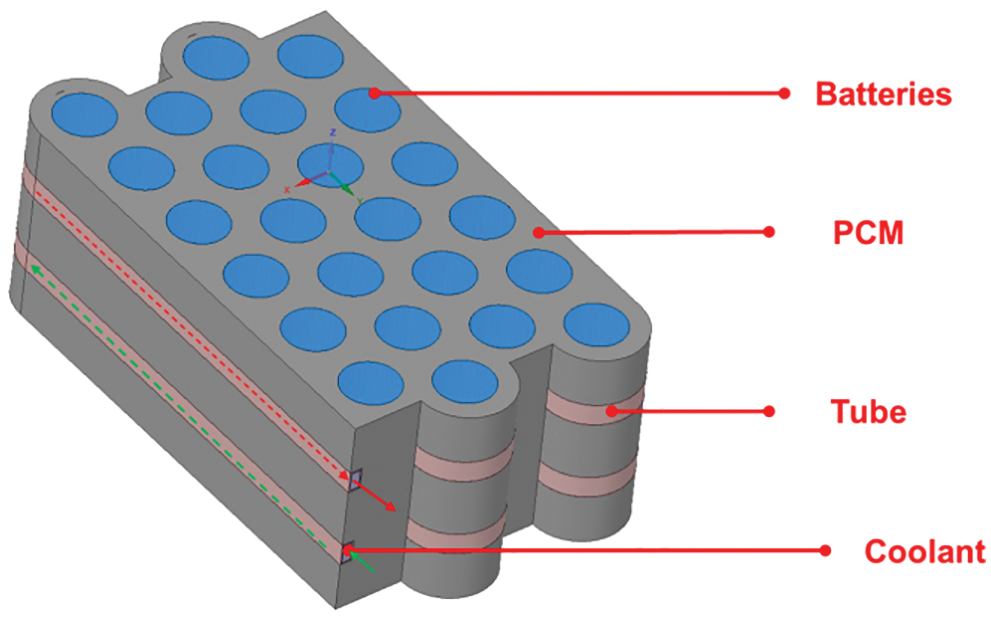
Figure 1: Schematic diagram of the battery pack

The battery pack model is mainly composed of a Li-ion battery, a CPCM, a cooling tube and cooling liquid. The heat generation of the battery is a non-stationary and non-uniform process, and the internal structure of the battery is complex and the thermal properties change continuously with the influence of the ambient temperature and other factors, which makes it difficult to establish a very accurate internal thermal model of the battery structure [48]. During the numerical analysis, it is assumed that the battery is a uniformly heated whole in all internal locations, and the thermal properties and thermal conductivity do not change in each direction, ignoring the heat transfer process radiation. The thermal properties of the internal structure of the cell are shown in Table 2 below.

The inlet flow rate of coolant is 0.01–0.04 m/s, from which the Reynolds number value can be calculated to be between 118.4–436.6, which belongs to the laminar flow state. It is also assumed that there is no slip on the inner wall of the cooling tube and that the coolant is set to 0 pressure outlet to inhibit backflow.
The heat generated by the battery discharge is directly transferred to the CPCM, which is stored directly through latent heat. When the liquid cooling is activated due to the existence of a temperature difference, the heat in the CPCM is then transferred to the coolant carried out of the battery module. The contact thermal resistance between each material is ignored in the simulation process. According to the law of energy conservation, it is known that the energy conservation equation of the battery is as follows:
where is
For the CPCM heat transfer using the enthalpy-porous medium method, the volume fraction
where
The coolant in the pipeline should follow the laws of conservation of mass, conservation of momentum and conservation of energy.
where
The cooling tube follows the conservation of energy equation.
Boundary conditions between the cell and the composite PCM.
The boundary conditions of the contact surface between the composite PCM and the cooling tube are as follows:
The cooling tube and coolant contact surface boundary conditions are defined as follows:
Boundary conditions between the composite PCM and the environment.
In order to verify the accuracy of the heat generation model of the single power cell, some researches compared the numerical model temperature variation with the experimental result temperature variation. Lai et al. [25] conducted a 10A constant current discharge (5C discharge rate) battery temperature rise characteristic test on a single power battery with a continuous discharge of 720 s and obtained a large amount of experimental data. This paper uses the same type of power battery, so its experimental data is cited. Fig. 2 shows the curves of experimental data and numerical simulation over time, in which the maximum temperature error and average temperature error are 1.451 and 0.349 K, respectively. The numerical simulation results better reflect the temperature rise characteristics of the battery under a large discharge rate, so the established heat generation model can be applied to the subsequent battery thermal management research.
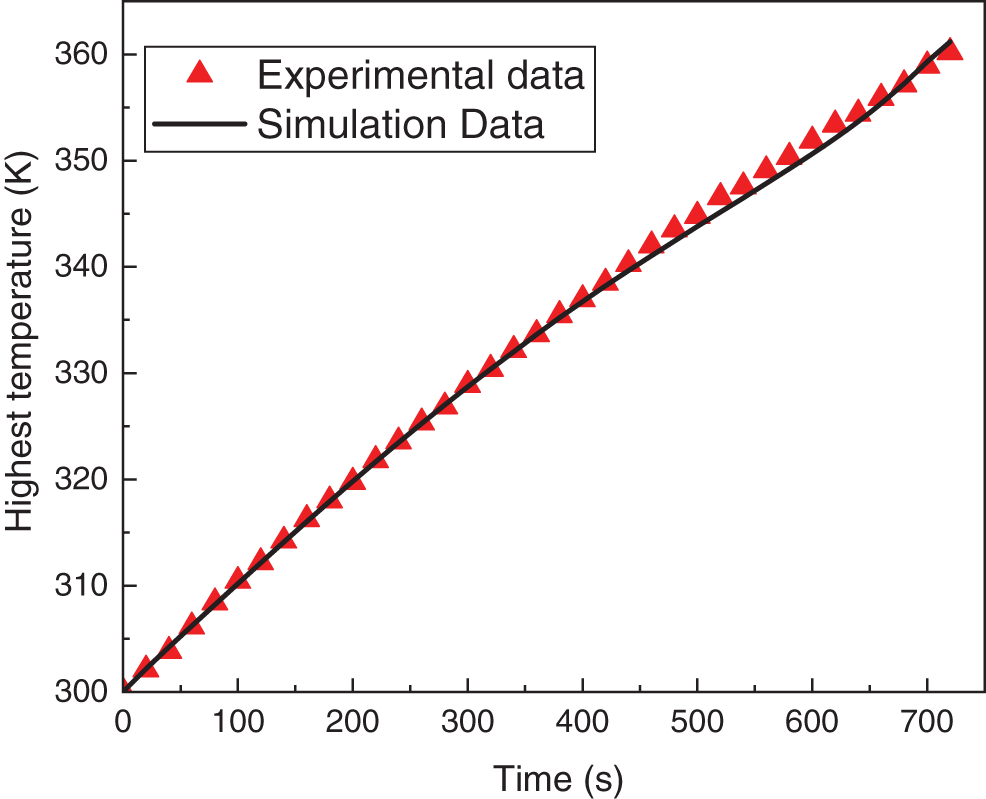
Figure 2: The curves of experimental data and numerical simulation over time
The grid-independent body meshes 238,768, 313,713, and 431,498 are chosen for grid-independent analysis. Fig. 3 shows the expected maximum temperature response of the battery pack within one cycle. It can be seen that there is almost no difference in the maximum temperature of the battery pack at the end of discharge for numerical simulations with different grid numbers. Using a lower number of grids reduces the computation time in addition to the computer memory, so the number of body grids chosen for the study is 238,768.

Figure 3: (a) Temperature vs. time curves of system for different grid numbers (b) Schematic diagram of the grid
To verify the correctness of the simulation of the liquid-cooled-CPCM coupled battery pack thermal management system, it is assumed that the liquid-cooled module does not work, and the battery pack relies only on CPCM cooling. The experimental data of the CPCM battery thermal management system designed by Huang et al. [47] are cited to compare the findings, as shown in Fig. 4. In the discharge cycle, both thermal management systems are continuously discharged at a rate of 5C for 720 s. Although the initial temperatures are different, the trends of the highest temperatures from 0–540 s are identical between the two systems. The increase in the slope of the curve after 540 s due to the depletion of the CPCM latent heat in the coupled system is a good reflection of the correctness of the simulation of the liquid-cooled-CPCM coupled thermal management system, and the addition of the liquid-cooled module only enhances the thermal performance of the coupled system. The addition of the liquid-cooled module only enhances the thermal performance of the coupled system.
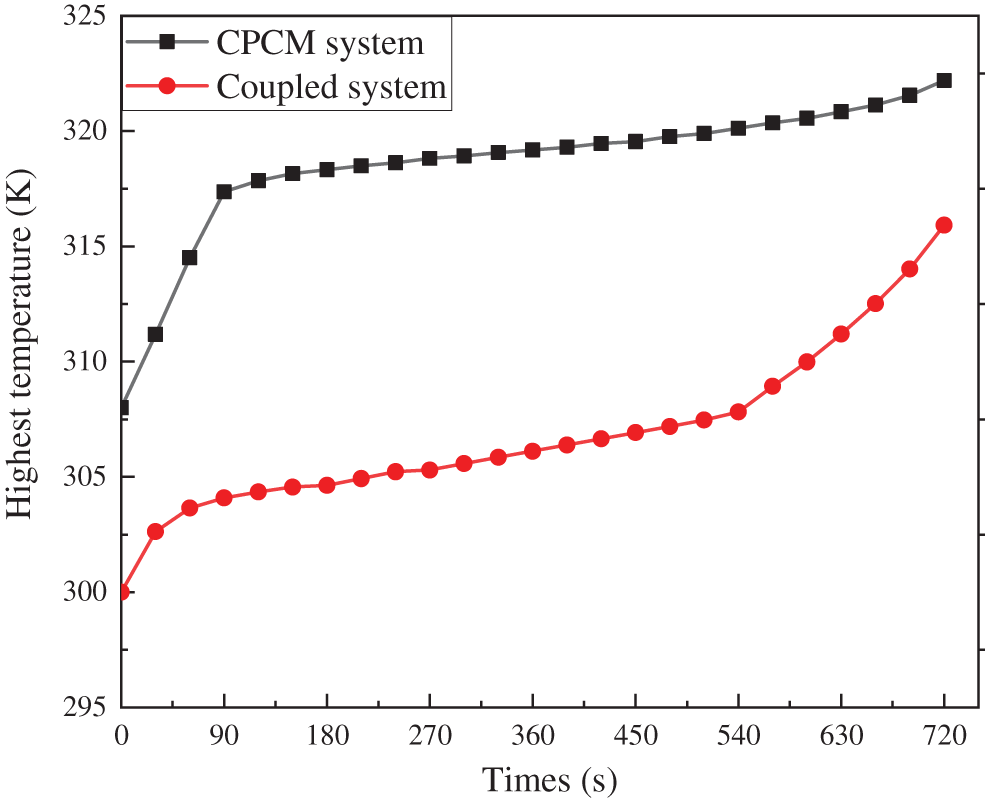
Figure 4: Simulation correctness verification
3.1 Thermal Characteristics of the Cooling System
A numerical simulation is performed to verify the thermal performance of the liquid-CPCM cooling coupled battery thermal management system compared to a CPCM cooling only battery thermal management system. Initial conditions are uniform: the battery is discharged at 5C in one cycle of 720 s, the coolant inlet temperature is 300 K, and the inlet velocity is constant at 0.02 m/s. Fig. 5a shows the cell temperature at the end of the 5C discharge rate and the composite PCM liquid fraction variation curve with time. At the beginning of the 0–50 s discharge, the cell needs to break the internal equilibrium state for ions in order to form a pathway, when the transfer rate is slow. Externally, it shows high internal resistance and a rapid rise in battery temperature. During the middle of the 50–600 s discharge, there is not much change in internal resistance, and the temperature rise is linear. At the end of the 600–720 s discharge, the electrolyte itself is affected by the reduction of lithium-ion concentration, which shows that the internal resistance increases and the temperature rises sharply.

Figure 5: (a) Time-dependent maximum temperature and liquid fraction curves for CPCM and CTMS (b) Time-dependent temperature difference curves for PCM and CTMS
At the end of the discharge of the CPCM cooling system, the CPCM is almost dissolved and the highest temperature of the battery module has reached 315 K. Meanwhile, Fig. 6b shows that because the heat cannot be transferred in time, thermal aggregation has occurred in the middle of the battery pack, in which the temperature of the center of the battery pack is 9 K higher than that of the outermost battery. The huge temperature difference between the single battery and the single power source is extremely likely to cause the single power battery to thermal runaway during long-therm use, which will lead to a chain reaction and fire.

Figure 6: (a) Battery pack temperature cloud at the end of discharge of CPCM (b) Liquid fraction at the end of discharge of CPCM
As shown in Fig. 7, compared with the CPCM cooling system, the highest temperature of the battery module of coupled system never exceeds 310 K even at the end of discharge moment, keeping the temperature difference between individual cells within 5 K, which fully meets the design requirements of the battery pack. By comparing the liquid fraction of the two simulated composite PCMs, it shows that CTMS cannot only extend the action time of CPCM, but also bring the heat absorbed by CPCM out of the battery pack in time to maintain the overall temperature uniformity.

Figure 7: (a) Temperature of the battery at the end of the coupling system discharge (b) The liquid fraction at the end of the coupling system’s discharge
3.2 Effect of PCM Geometric Parameters
In this section, the effect of distance (d) on the cooling performance of the battery pack is investigated, and four sets of comparison tests are designed with distances of 1, 2, 3 and 4 mm, respectively. When the distance from a single cell to the cooling tube is decreased the heat absorbed by the CPCM can be carried out of the cell faster, and the cooling efficiency of liquid cooling will be improved as the distance decreases. Fig. 8 shows the variation of the maximum temperature at different distances from the cell to the cooling tube.

Figure 8: The variation of the maximum temperature at different distances from the cell to the cooling tube
Fig. 9a shows the variation of the maximum temperature at different distances in one cycle, and Fig. 9b shows the variation of the temperature difference at different distances in one cycle. At the end of a d = 1 mm discharge, the internal resistance of the battery increases and the latent heat of CPCM is almost completely consumed, which leads to the maximum temperature of d = 1 mm exceeding 313 K and the temperature difference of 8 K failing to meet the design requirements due to the low thermal conductivity of CPCM. On the contrary, the temperature change of the battery pack from d = 2 mm to d = 4 mm, the increase in the distance from the single cell to the cooling tube makes the volume of the filled CPCM increase, and the liquid fraction of CPCM is inversely proportional to the increase of the distance under the same heat absorption. Having a larger distance between the single cell and the cooling tube helps to reduce the pack temperature difference, but increasing the CPCM volume inevitably leads to a decrease in CPCM utilization and pack energy density.

Figure 9: (a) Variation of the maximum temperature of the battery pack in one cycle at different distances (b) Variation of the temperature difference of the battery pack in one cycle at different distances (c) Variation of the liquid fraction of the battery pack in one cycle at different distances
Fig. 9c shows the change curve of CPCM liquid fraction at different distances in one cycle. The increase in resistance at the end of the discharge moment leads to a sharp rise in temperature, and the composite PCM material of cell group d = 1 mm has completely melted, and d = 2 mm to d = 4 mm is kept below 80%. In summary, the single cell to cooling tube d = 2 mm is selected.
3.3 The Effect of Liquid Cooling-Related Parameters
In this section, the effects of the number of cooling tubes, coolant flow rate and coolant flow direction in liquid cooling on the thermal performance of the battery pack are studied, and the other parameters are kept constant when the studied parameters are changed.
3.3.1 The Effect of the Number of Cooling Tubes
Appropriately increasing the number of cooling tubes, battery CTMS thermal performance is significantly enhanced. In this section, the effect of the numbers of cooling tubes on the cell module is investigated by setting up comparative tests with the number of cooling tubes of 1, 2, 3, 4 and 5, respectively, under other conditions. As shown in Figs. 10 and 11 below, the maximum temperature, temperature difference and CPCM liquid fraction curves of the battery pack show that the maximum temperature and liquid fraction of the battery pack decrease with the increase of the number of cooling tubes. At the end of discharge, when the number of cooling tubes is 1, the outlet side cell temperature is already as high as 310 K which is much higher than the CPCM phase change temperature, and the CPCM liquid fraction is as high as 90%. If the battery continues to discharge, the temperature difference of the battery will be further enlarged. When the number of cooling tubes is increased from 2 to 5, the maximum temperature of the battery pack drops to 307 K, and the liquid phase ratio remains at about 70%, and the temperature difference is effectively controlled within 5 K. The increase in the number of cooling tubes will also make the system more complex, and the manufacturing cost and weight will increase accordingly. Considering that the number of cooling tubes can basically meet the research demand when the number of cooling tubes is 2, the number of cooling tubes is chosen to be 2.

Figure 10: (a) Temperature difference and maximum temperature curve with time for various pipe counts (b) Time-dependent liquid fraction curve for various pipe counts

Figure 11: (a) Temperature cloud of battery with cooling tube number 1 (b) Temperature cloud of battery with cooling tube number 2 (c) Temperature cloud of battery with cooling tube number 3 (d) Temperature cloud of battery with cooling tube number 4 (e) Temperature cloud of battery with cooling tube number 5
3.3.2 Effect of Coolant Flow Rate
Under the assumption that changing the inlet flow rate will affect the cell temperature and CPCM utilization, six different inlet flow rates of 0.01, 0.02, 0.03, 0.04, 0.05 and 0.06 m/s are set at a constant inlet temperature of 300 K. Fig. 12 shows the maximum temperature and liquid fraction variation curves at the end of discharge at different inlet flow rates. Fig. 13 below shows the temperature clouds of the battery module at different inlet flow rates. The maximum temperature of the battery module has a significant decrease with the increase of inlet flow rate. The speed from 0.01 to 0.06 m/s decreases maximum temperature by 4 K. After the velocity reaches 0.03 m/s, the further increase in velocity has almost zero effect on the maximum temperature. From Fig. 12, it can be found that the CPCM liquid fraction is inversely proportional to the increase in inlet flow rate. At the end of the discharge at a low speed of 0.01 m/s, the CPCM has dissolved up to 94%, at which time the composite PCM can only transfer heat through itself. If the heat is not transferred to the liquid cooling in time and exported in time, it will easily cause local heat accumulation. The inlet flow rate is increased from 0.03 to 0.06 m/s and the maximum liquid fraction only reaches 85%, which does not fully utilize the latent heat absorption of CPCM, but the overall temperature performance of the battery pack is excellent. In summary, it can be seen that the inlet flow rate increases the temperature of the battery pack, which allows it to be effectively controlled in the best range, but at the same time, it reduces the utilization of the latent heat of the composite PCM and increases the pump power consumption. In summary, the cooling system’s inlet flow rate is 0.03 m/s.

Figure 12: Variation curve of maximum temperature and liquid fraction at the end of discharge under different cooling rates

Figure 13: Temperature clouds at different flow rates
3.3.3 Effect of Coolant Flow Direction
When all the cooling tubes flow in the same direction, it will cause a large temperature difference between the inlet and outlet, leading to high cell temperatures near the outlet. The large temperature difference between the inlet and outlet causes the inconsistency of the individual cells to be gradually amplified during use, thus accelerating the performance degradation of some individual cells in some cases and eventually leading to the premature failure of the Li-ion battery pack. To eliminate this problem, an alternating flow scheme with adjacent cooling tubes is proposed. Fig. 14 shows the battery pack temperature cloud at the end of discharge. In Fig. 15, the cell pack temperature difference and liquid fraction change curve with time, the highest temperature on the outlet side in the same direction flow has reached 309.4 K, while the two CPCM liquid phase rate are very close to control at 85%. However, the temperature difference in the same direction flow has exceeded the 5 K design requirement, while the alternating flow temperature difference still performs well. Therefore, it is necessary for the system to use alternating flow.

Figure 14: The battery pack temperature cloud at the end of discharge

Figure 15: Cell pack temperature difference and liquid fraction change curve with time
3.3.4 Influence of Inlet Coolant Temperature
A lower inlet coolant temperature helps to reduce the battery pack temperature more rapidly, but a lower inlet temperature leads to a large temperature difference near the inlet and outlet, which directly poses a greater challenge to the battery pack temperature control. To investigate the effect of inlet temperature on the cell pack temperature distribution, four inlet temperatures (from 296–302 K) were selected to study the thermal effects. Fig. 16 is temperature clouds with different inlet temperatures at the end of discharge. It is clear that the cell pack temperature improves significantly as the inlet coolant temperature decreases, especially as the temperature of the central cell gradually decreases. The reason for this is that the higher inlet coolant temperature leads to a rapid and complete melting of the CPCM, and the heat that should have been carried out of the cell pack by the coolant is thus not realized.

Figure 16: Temperature clouds with different inlet temperatures at the end of discharge
While the lower inlet coolant temperature is highly significant for temperature control, it also exposes some more serious problems. It can be seen from Fig. 17 that the temperature difference and liquid phase rate of the battery pack at the end of discharge moment are coated. When the inlet temperature is 296 K, the temperature difference in the initial stage of discharge directly reaches 3 K, and then steadily increases to 6 K at the end of discharge, which obviously does not meet the design requirements. Meanwhile, it can be found from the liquid phase rate variation curve with time that the utilization rate of CPCM is inversely proportional to the decrease in inlet coolant temperature, and the lowest utilization rate is only 70%.

Figure 17: (a) Temperature difference curve with time (b) Liquid fraction vs. time curve
Therefore, it can be concluded that the proper increase of inlet coolant temperature can not only make the battery pack temperature uniformity better, but also improve the latent heat utilization rate of CPCM.
3.4 Optimization of Liquid Cooling Control Strategy
The above studies are based on the optimal operating temperature of the battery and a constant flow rate of 0.03 m/s, which not only leads to unnecessary energy consumption but also does not fully utilize the latent heat of the CPCM. The system needs to be adjusted to cope with the complex operating conditions of the vehicle, such as rapid acceleration and high rates of discharge at high loads, as well as cold and high temperature environments. Therefore, the control strategy of the system needs to be optimized to make full use of the latent heat of the CPCM to reduce energy consumption while maintaining good thermal performance at all temperatures.
The variables that can be controlled by liquid cooling are the inlet flow rate and the inlet temperature. The main function of liquid cooling is to carry the heat transferred from the battery to the CPCM out of the battery pack. When the battery pack temperature falls short of the CPCM phase change temperature, the coolant runs at a very low flow rate or even at a speed of zero, allowing the battery to quickly reach the proper operating temperature by its own heat production. When the battery pack temperature reaches the CPCM phase change temperature range, the coolant flow rate can be increased appropriately to extend the CPCM action time. When the CPCM phase change temperature is exceeded, the coolant flow rate can be further increased while the CPCM curing can be accelerated by changing the inlet temperature, thus using the CPCM latent heat to keep the cell temperature uniform. Therefore, the temperature of the CPCM can be used as an indicator to control the coolant flow rate and inlet temperature. Six monitoring points are selected in the middle section of the battery pack, and the positions shown in Fig. 18a.
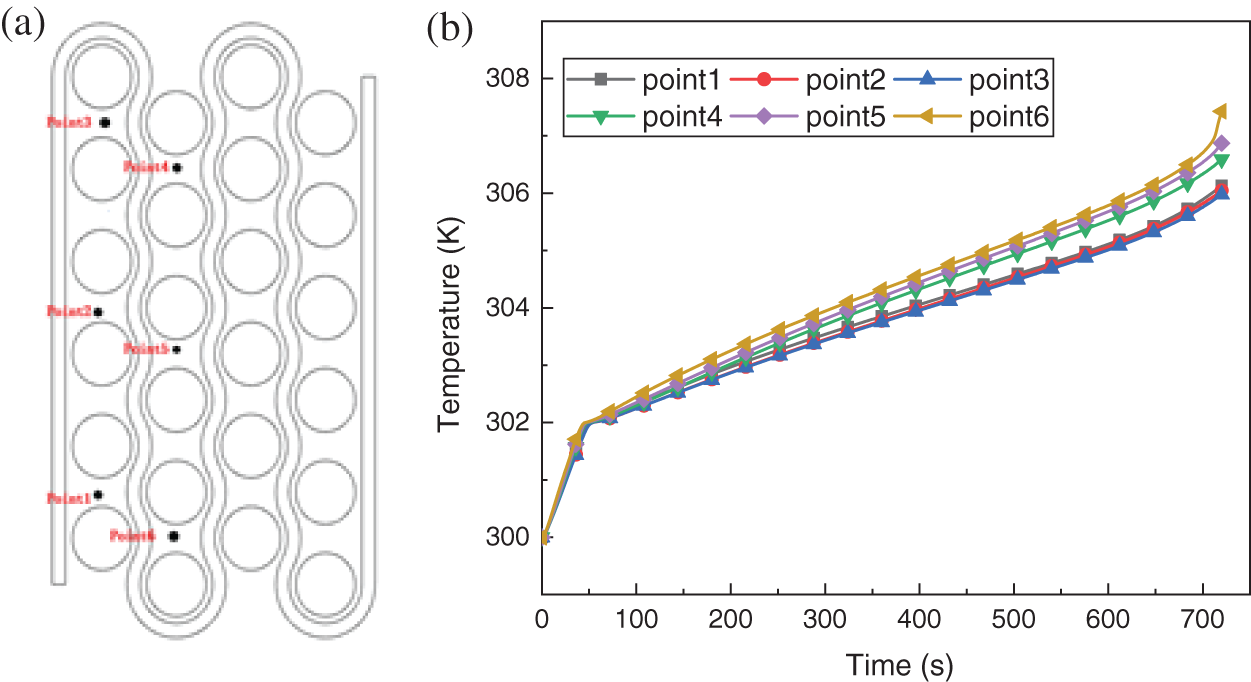
Figure 18: (a) Location map of monitoring points (b) Temperature variation curve of monitoring points with time
The temperature profile variation of the monitored points at an inlet flow rate of 0.03 m/s is shown in Fig. 18b. As illustrated in Fig. 18b, all monitoring points reach the CPCM minimum phase change temperature of 302 K almost simultaneously, with point 6 maintaining the highest temperature throughout the discharge process. The main reason is that the battery pack adopts a symmetric structure and the adjacent coolant flows alternately. Point 6 is located in the middle of the whole flow, where the CPCM latent heat recovery ability is even worse compared with other regions. Therefore point 6 can represent the worst area for battery pack heat dissipation.
Based on the effect of liquid cooling on the battery pack, the flow rate of coolant can be changed at the right time according to the temperature of point 6. The cooling rate of liquid cooling is controlled by a segmentation function with the following control equation:
Controlling the temperature difference between the battery pack and the coolant outlet temperature curve change with the same trend, It is also found that the temperature difference between the inlet and outlet can significantly control the temperature difference between the battery packs. Therefore, the outlet temperature can be used as a trigger point to control the inlet temperature, and the control equation is as follows:
UDF of control strategy for inlet temperature and flow rate compiled by C language based on Eqs. (17) and (18), to verify the effectiveness of the designed liquid cooling control strategy, simulation analysis is performed under the conditions of constant parameters. Fig. 19a shows the comparison of the maximum temperature and temperature difference between the control strategy cooling system and the initial coupling system simulation. According to the law of power, the battery temperature change in the initial stage is still used 0.03 m/s, while the temperature rise in the middle of the discharge is more slowly, at this time, it can reduce energy consumption by reducing the inlet flow rate, while increasing the inlet temperature to reduce the temperature difference. The difference between the two highest temperatures at the end of discharge is about 1 K. Both are in the best working range of the power cell, and the temperature difference of the control cooling strategy system is 0.2 K lower than that of the initial coupling system to maintain at 4.5 K. Fig. 19b shows the change of liquid fraction of both, initial coupling system itself has a good liquid fraction kept at about 85%, and the control strategy cooling system further utilizes the PCM latent heat value to reach 92% on top of this. In summary, it can be seen that the control cooling strategy system can not only reduce the pump energy consumption but also make further use of the CPCM latent heat while ensuring the battery pack works under optimal temperature conditions.

Figure 19: (a) Maximum temperature and temperature difference curve with time (b) Variation curve of liquid fraction with time
A liquid-cooled and composite PCM coupled thermal management system is designed for automotive power cylindrical batteries to solve the problem of difficult heat dissipation under high charge and discharge rates of the battery pack. The CPCM-only thermal management system and the coupled liquid-cooled and CPCM thermal management system are compared through numerical simulation to verify the effectiveness of the coupled system. The effects of the number of liquid-cooled cooling tubes, coolant flow rate, coolant flow direction, and other factors on the heat dissipation performance of the battery pack are further analyzed. In addition, a control strategy for the liquid-cooled system is proposed, and the numerical analysis verifies the effect of the control strategy. The following conclusions can be drawn:
(1) An appropriate increase in the number of cooling tubes and coolant flow rate can significantly improve the cooling performance of the battery pack. The heat dissipation performance improvement is not significant after the number of cooling tubes exceeds 2 and the coolant flow rate exceeds 0.03 m/s. The increase in the number of cooling tubes or coolant velocity brings about lower cell temperature and a lower PCM liquid fraction at the end of charge. The design of liquid cooling systems should be carefully considered to meet the balance between thermal performance and structural complexity in coupled systems.
(2) The alternating flow of coolant can effectively improve the temperature uniformity of the battery pack. The alternate flow eliminates the problem of high temperatures on the outlet side when flowing in the same direction, keeping the overall temperature difference of the battery pack within a safe range.
(3) Properly increasing the inlet coolant temperature not only improves the cell pack temperature uniformity, but also increases the utilization of CPCM latent heat.
(4) The application of a liquid cooling control strategy can improve the utilization of latent heat and reduce the energy consumption of CPCM. By compiling the UDF function to obtain the most drastic temperature change monitoring point, the coolant inlet temperature and flow rate are dynamically adjusted to reduce unnecessary energy consumption while improving the battery pack temperature uniformity.
Funding Statement: We gratefully acknowledge the financial support provided National Natural Science Foundation of China with Grant No. 51976016, Natural Science Foundation of Hunan Province, China with Grant No. 2020JJ4616, Research Foundation of Education Bureau of Hunan Province (18B149).
Conflicts of Interest: The authors declare that they have no conflicts of interest to report regarding the present study.
References
1. Zhang, X., Li, Z., Luo, L., Fan, Y., Du, Z. (2022). A review on thermal management of lithium-ion batteries for electric vehicles. Energy, 238, 121652. DOI 10.1016/j.energy.2021.121652. [Google Scholar] [CrossRef]
2. Nikolaos, W., Jakob, S., Alexander, F., Leo, W., Xue, L. A. (2021). Review of fast charging strategies for lithium-ion battery systems their applicability for battery electric vehicles. Journal of Energy Storage, 44, 103306. DOI 10.1016/j.est.2021.103306. [Google Scholar] [CrossRef]
3. Hu, X., Zheng, Y., Howey, D. A., Perez, H. E., Pecht, M. (2020). Battery warm-up methodologies at subzero temperatures for automotive applications: Recent advances and perspectives. Progress in Energy and Combustion Science, 77, 100806. DOI 10.1016/j.pecs.2019.100806. [Google Scholar] [CrossRef]
4. Jiang, Z. Y., Li, H. B., Qu, Z. G., Zhang, J. F. (2022). Recent progress in lithium-ion battery thermal management for a wide range of temperature and abuse conditions. International Journal of Hydrogen Energy, 47(15), 9428–9459. DOI 10.1016/j.ijhydene.2022.01.008. [Google Scholar] [CrossRef]
5. Wu, S., Xiong, R., Li, H., Nian, V., Ma, S. (2020). The state of the art on preheating lithium-ion batteries in cold weather. Journal of Energy Storage, 27(2), 101059. DOI 10.1016/j.est.2019.101059. [Google Scholar] [CrossRef]
6. Guo, S., Yang, R., Shen, W., Liu, Y., Guo, S. (2021). DC-AC hybrid rapid heating method for lithium-ion batteries at high state of charge operated from low temperatures. Energy, 238, 121809. DOI 10.1016/j.energy.2021.121809. [Google Scholar] [CrossRef]
7. Zhang, J. M., Liu, H., Zheng, M. X., Chen, M. Y. (2021). Numerical study on a preheating method for lithium-ion batteries under cold weather conditions using phase change materials coupled with heat films. Journal of Energy Storage, 47, 103651. DOI 10.1016/j.est.2021.103651. [Google Scholar] [CrossRef]
8. Feng, X., Ouyang, M., Liu, X., Lu, L., Xia, Y. et al. (2017). Thermal runaway mechanism of lithium ion battery for electric vehicles: A review. Energy Storage Materials, 10, 246–267. DOI 10.1016/j.ensm.2017.05.013. [Google Scholar] [CrossRef]
9. Liao, Z., Zhang, S., Li, K., Zhang, G., Habetler, T. G. (2019). A survey of methods for monitoring and detecting thermal runaway of lithium-ion batteries. Journal of Power Sources, 436, 226879. DOI 10.1016/j.jpowsour.2019.226879. [Google Scholar] [CrossRef]
10. Zhi, M. Y., Rong, F., Xiong, Y., Zheng, L. L., Shan, Y. et al. (2022). Recent research progress on phase change materials for thermal management of lithium-ion batteries. Journal of Energy Storage, 45, 103694. DOI 10.1016/j.est.2021.103694. [Google Scholar] [CrossRef]
11. Zeng, Y. Q., Chalise, D., D. Lubner, S. (2021). A review of thermal physics and management inside lithium-ion batteries for high energy density and fast charging. Energy Storage Materials, 41, DOI 10.1016/j.ensm.2021.06.008. [Google Scholar] [CrossRef]
12. Kai, C., Yc, A., Ys, A., Ms, B., Sw, A. et al. (2019). Construction of effective symmetrical air-cooled system for battery thermal management. Applied Thermal Engineering, 166, 114579. DOI 10.1016/j.applthermaleng.2019.114679. [Google Scholar] [CrossRef]
13. E, J. Q., Yue, M., Chen, J., Zhu, H., Kang, S. (2018). Effects of the different air-cooling strategies on cooling performance of a lithium-ion battery module with baffle. Applied Thermal Engineering, 144, 231–241. DOI 10.1016/j.applthermaleng.2018.08.064. [Google Scholar] [CrossRef]
14. Niu, J. Y., Deng, S. Y., Gao, X. N., Niu, H. C., Fang, Y. T. et al. (2021). Experimental study on low thermal conductive and flame retardant phase change composite material for mitigating battery thermal runaway propagation. Journal of Energy Storage, 47, 103557. DOI 10.1016/j.est.2021.103557. [Google Scholar] [CrossRef]
15. Chen, J., Kang, S., E, J. Q., Huang, Z., Liao, G. (2019). Effects of different phase change material thermal management strategies on the cooling performance of the power lithium-ion batteries: A review. Journal of Power Sources, 442, 227228. DOI 10.1016/j.jpowsour.2019.227228. [Google Scholar] [CrossRef]
16. E, J. Q., Zhao, X. H., Liu, H., Chen, J., Zuo, W. et al. (2016). Field synergy analysis for enhancing heat transfer capability of a novel narrow-tube closed oscillating heat pipe. Applied Energy, 175, 218–228. DOI 10.1016/j.apenergy.2016.05.028. [Google Scholar] [CrossRef]
17. E, J. Q., Zhao, X. H., Deng, Y. W., Zhu, H. (2016). Pressure distribution and flow characteristics of closed oscillating heat pipe during the starting process at different vacuum degrees. Applied Thermal Engineering, 93, 166–173. DOI 10.1016/j.applthermaleng.2015.09.060. [Google Scholar] [CrossRef]
18. Ji, C., Wang, B., Wang, S., Pan, S., Wang, D. et al. (2019). Optimization on uniformity of lithium-ion cylindrical battery module by different arrangement strategy. Applied Thermal Engineering, 157, 113683. DOI 10.1016/j.applthermaleng.2019.04.093. [Google Scholar] [CrossRef]
19. E, J. Q., Han, D., Qiu, A., Zhu, H., Deng, Y., et al. (2018). Orthogonal experimental design of liquid-cooling structure on the cooling effect of a liquid-cooled battery thermal management system. Applied Thermal Engineering, 132, 508–520. DOI 10.1016/j.applthermaleng.2017.12.115. [Google Scholar] [CrossRef]
20. Deng, Y., Feng, C., Jiaqiang, E., Zhu, H., Chen, J. et al. (2018). Effects of different coolants and cooling strategies on the cooling performance of the power lithiumion battery system: A review. Applied Thermal Engineering, 142, 10–29. DOI 10.1016/j.applthermaleng.2018.06.043. [Google Scholar] [CrossRef]
21. Qaderi, A., Veysi, F. (2021). Investigation of a water-NEPCM cooling thermal management system for cylindrical 18650 Li-ion batteries. Energy, 244, 122570, DOI 10.1016/j.energy.2021.122570. [Google Scholar] [CrossRef]
22. Ping, P., Zhang, Y., Kong, D., Du, J. (2021). Investigation on battery thermal management system combining phase changed material and liquid cooling considering non-uniform heat generation of battery. Journal of Energy Storage, 36, 102448. DOI 10.1016/j.est.2021.102448. [Google Scholar] [CrossRef]
23. Wang, Y., Rao, Z., Liu, S., Li, X., Xiong, R. (2021). Evaluating the performance of liquid immersing preheating system for lithium-ion battery pack. Applied Thermal Engineering, 190, 116811. DOI 10.1016/j.applthermaleng.2021.116811. [Google Scholar] [CrossRef]
24. E, J. Q., Xu, S., Deng, Y., Zhu, H., Zuo, W. et al. (2018). Investigation on thermal performance and pressure loss of the fluid cold-plate used in thermal management system of the battery pack. Applied Thermal Engineering, 145, 552–568. DOI 10.1016/j.applthermaleng.2018.09.048. [Google Scholar] [CrossRef]
25. Lai, Y. X., Wu, W. X., Chen, K., Wang, S. F., Xin, C. (2019). A compact and lightweight liquid-cooled thermal management solution for cylindrical lithium-ion power battery pack. International Journal of Heat and Mass Transfer, 144, 118581. DOI 10.1016/j.ijheatmasstransfer.2019.118581. [Google Scholar] [CrossRef]
26. Liu, Z., Wang, H., Yang, C., Zhao, J. (2020). Simulation study of lithium-ion battery thermal management system based on a variable flow velocity method with liquid metal. Applied Thermal Engineering, 179(3), 115578. DOI 10.1016/j.applthermaleng.2020.115578. [Google Scholar] [CrossRef]
27. Wang, F. X., Cao, J. H., Ling, Z. Y., Zhang, Z. G., Fang, X. M. (2020). Experimental and simulative investigations on a phase change material nano-emulsion-based liquid cooling thermal management system for a lithium-ion battery pack. Energy, 207, 118215. DOI 10.1016/j.energy.2020.118215. [Google Scholar] [CrossRef]
28. Hong, S. H., Dong, S. J., Park, S., Yun, S., Kim, Y. (2020). Thermal performance of direct two-phase refrigerant cooling for lithium-ion batteries in electric vehicles. Applied Thermal Engineering, 173, 115213. DOI 10.1016/j.applthermaleng.2020.115213. [Google Scholar] [CrossRef]
29. Wu, S. Q., Li, L., Lin, W. B., Lei, L., Zhang, Q. C. (2021). Effect analysis on integration efficiency and safety performance of a battery thermal management system based on direct contact liquid cooling. Applied Thermal Engineering, 201, 117788. DOI 10.1016/j.applthermaleng.2021.117788. [Google Scholar] [CrossRef]
30. Wang, H., Tao, T., Xu, J., Shi, H., Mei, X. et al. (2022). Thermal performance of a liquid-immersed battery thermal management system for lithium-ion pouch batteries. Journal of Energy Storage, 46, 103835. DOI 10.1016/j.est.2021.103835. [Google Scholar] [CrossRef]
31. Xing, C., Fei, Z., Wen, Y. B., Yang, G. B., Yu, Z. B. (2021). A hybrid thermal management system with liquid cooling and composite phase change materials containing various expanded graphite contents for cylindrical lithium-ion batteries. Applied Thermal Engineering, 200, 117702. DOI 10.1016/j.applthermaleng.2021.117702. [Google Scholar] [CrossRef]
32. Zhao, X., E, J. Q., Wu, G., Deng, Y., Han, D. et al. (2019). A review of studies using graphenes in energy conversion, energy storage heat transfer development. Energy Conversion and Management, 184, 581–599. DOI 10.1016/j.enconman.2019.01.092. [Google Scholar] [CrossRef]
33. Raja, E., Talal, A., Sofiene, M., Gaber, A., Salem, A. et al. (2021). Experimental investigations on thermophysical properties of nano-enhanced phase change materials for thermal energy storage applications. Alexandria Engineering Journal, 61(9), 7037–7044. DOI 10.1016/j.aej.2021.12.046. [Google Scholar] [CrossRef]
34. Samimi, F., Babapoor, A., Azizi, M., Karimi, G. (2016). Thermal management analysis of a Li-ion battery cell using phase change material loaded with carbon fibers. Energy, 96, 355–371. DOI 10.1016/j.energy.2015.12.064. [Google Scholar] [CrossRef]
35. Heyhat, M. M., Mousavi, S., Siavashi, M. (2020). Battery thermal management with thermal energy storage composites of PCM, metal foam, fin and nanoparticle. Journal of Energy Storage, 28, 101235. DOI 10.1016/j.est.2020.101235. [Google Scholar] [CrossRef]
36. Pradyumna, G., Stanislav, L., Aditya, D., Salgado, R. et al. (2014). Graphene-enhanced hybrid phase change materials for thermal management of Li-ion batteries. Journal of Power Sources, 248, 37–43. DOI 10.1016/j.jpowsour.2013.08.135. [Google Scholar] [CrossRef]
37. Lin, X., Zhang, X., Liu, L., Liang, J., Liu, W. (2022). Polymer/expanded graphite-based flexible phase change material with high thermal conductivity for battery thermal management. Journal of Cleaner Production, 331, 130014. DOI 10.1016/j.jclepro.2021.130014. [Google Scholar] [CrossRef]
38. Pan, M., Zhong, Y. (2018). Experimental and numerical investigation of a thermal management system for a Li-ion battery pack using cutting copper fiber sintered skeleton/paraffin composite phase change materials. International Journal of Heat & Mass Transfer, 126, 531–543. DOI 10.1016/j.ijheatmasstransfer.2018.06.014. [Google Scholar] [CrossRef]
39. Cao, J. H., Yi, W., Ling, Z. Y., Fang, X. M., Zhang, Z. G. (2021). Upgrade strategy of commercial liquid-cooled battery thermal management system using electric insulating flexible composite phase change materials. Applied Thermal Engineering, 199, 117562. DOI 10.1016/j.applthermaleng.2021.117562. [Google Scholar] [CrossRef]
40. Yi, F., E, J. Q., Zhang, B., Zuo, H., Wei, K. et al. (2022). Effects analysis on heat dissipation characteristics of lithium-ion battery thermal management system under the synergism of phase change material and liquid cooling method.Renewable Energy, 181, 472–489. DOI 10.1016/j.renene.2021.09.073. [Google Scholar] [CrossRef]
41. Karimi, D., Hosen, S. M., Behi, H., Khaleghi, S., Akbarzadeh, M. et al. (2021). A hybrid thermal management system for high power lithium-ion capacitors combining heat pipe with phase change materials. Heliyon, 7(8), e07773. DOI 10.1016/j.heliyon.2021.e07773. [Google Scholar] [CrossRef]
42. Leng, Z., Yuan, Y., Cao, X., Zeng, C., Zhong, W. et al. (2021). Heat pipe/phase change material thermal management of Li-ion power battery packs: A numerical study on coupled heat transfer performance. Energy, 240, 122754. DOI 10.1016/j.energy.2021.122754. [Google Scholar] [CrossRef]
43. Yang, W., Zhou, F., Zhou, H. B., Wang, Q. Z., Kong, J. Z. (2020). Thermal performance of cylindrical lithium-ion battery thermal management system integrated with mini-channel liquid cooling and air cooling. Applied Thermal Engineering, 175, 115331. DOI 10.1016/j.applthermaleng.2020.115331. [Google Scholar] [CrossRef]
44. Zhuang, Y. J., Chen, T. T., Chen, J. T., Li, J. B., Guan, M. T. et al. (2021). Thermal uniformity performance of a hybrid battery thermal management system using phase change material and cooling plates arrayed in the manner of honeycomb. Thermal Science and Engineering Progress, 26, 101094. DOI 10.1016/j.tsep.2021.101094. [Google Scholar] [CrossRef]
45. Alexander, L., Swaminthan, N. (2019). Optimisation with adiabatic interlayers for liquid-dominated cooling system on fast charging battery packs. Applied Thermal Engineering, 147, 636–646. DOI 10.1016/j.applthermaleng.2018.10.090. [Google Scholar] [CrossRef]
46. Kong, D. P., Peng, R. Q., Ping, P., Du, J. (2019). A novel battery thermal management system coupling with PCM and optimized controllable liquid cooling for different ambient temperatures. Energy Conversion and Management, 204, 112280. DOI 10.1016/jenconman.2019.112280. [Google Scholar] [CrossRef]
47. Huang, R., Li, Z., Hong, W. H., Wu, Q. C., Yu, X. L. (2020). Experimental and numerical study of PCM thermophysical parameters on lithium-ion battery thermal management. Energy Reports, 6, 8–19. DOI 10.1016/j.egyr.2019.09.060. [Google Scholar] [CrossRef]
48. Chen, J., E, J. Q., Kang, S., Zhao, X., Zhu, H. Z. et al. (2019). Modeling and characterization of the mass transfer and thermal mechanics of the power lithium manganate battery under charging process. Energy, 187, 115924. DOI 10.1016/j.energy.2019.115924. [Google Scholar] [CrossRef]
Cite This Article
 Copyright © 2023 The Author(s). Published by Tech Science Press.
This work is licensed under a Creative Commons Attribution 4.0 International License , which permits unrestricted use, distribution, and reproduction in any medium, provided the original work is properly cited.
 Downloads
 Citation Tools