
 Submit a Paper
 Propose a Special lssue
 Open Access
ARTICLE
Quantitative Extraction of p-Coumaric Acid and Ferulic Acid in Different Gramineous Materials and Structural Changes of Residual Alkali Lignin
State Key Laboratory of Pulp and Paper Engineering, School of Light Industry and Engineering, South China University of Technology, Guangzhou, 510640, China
* Corresponding Authors: Wu Lan. Email: ; Fengxia Yue. Email:
(This article belongs to the Special Issue: Process and Engineering of Lignocellulose Utilization)
Journal of Renewable Materials 2023, 11(2), 555-566. https://doi.org/10.32604/jrm.2023.025701
Received 27 July 2022; Accepted 18 August 2022; Issue published 22 September 2022
 View Full Text
 Download PDF
Abstract
Ferulic acid (FA) and p-coumaric acid (pCA) in bagasse, wheat straw, corn straw, and corncob were extracted by alkaline hydrolysis and characterized by gas chromatography (GC) and gas chromatography-mass spectrometry (GC-MS). It was found that the FA and most of the pCA in gramineous biomass could be dissociated and released after being treated with 1 M NaOH at 100°C for 4 h. The yields of pCA/FA in bagasse, wheat straw, corn straw, and corncob determined by GC-FID are 39.8/11.5, 13.7/11.0, 28.0/11.0, and 35.1/14.5 mg/g, respectively. The raw materials and the treated solid residues were characterized by gel-state 2D Heteronuclear Single Quantum Coherence Nuclear Magnetic Resonance (2D HSQC NMR). It was found that only a small amount of lignin was detected in the residue after alkali treatment, indicating that the alkali treatment conditions can effectively cleave the FA and pCA. Additionally, the lignin in the alkali solution was recovered and characterized by 2D HSQC NMR. The FA was not able to be detected by NMR, whereas a small amount of pCA remained in the alkali lignin. This study reveals the structural change of residual lignins during the quantitative isolation of FA and pCA, which is essential for the selective isolation of pCA/FA and valorization of residual alkali lignin.Graphic Abstract
Keywords
Ferulic acid (FA) and p-coumaric acid (pCA) are typical hydroxycinnamic acid structures that widely exist in the cell wall of gramineous plants. Normally, they are both involved in the lignification process during plant cell wall development. As reported, FA and pCA are incorporated into lignin by ester linkages via the dehydrogenated free-radical coupling, which produces the cross-linking between lignin and polysaccharides [1,2]. The presence of FA and pCA in gramineous lignin significantly impacts its structure and application properties. Nowadays, producing lignin-derived platform chemicals by catalytic degradation is a promising way for lignin application. The ester bonds between FA (or pCA) and carbohydrates in grass lignins are easily broken or chemically changed during the degradation process, increasing the diversity and the monomeric products [3,4]. In particular, FA has excellent antioxidant and free radical scavenging capacity, and pCA exhibits antibacterial and lipid-lowering functions [5]. FA and pCA have promising applications in food, drug, cosmetics, etc. Therefore, efficient extraction of FA and pCA from gramineous raw materials is a crucial way to get FA and pCA for a future application while promoting the application of agricultural and forestry wastes.
At present, FA and pCA are mainly obtained from gramineous plants through enzymatic hydrolysis, organic solvent extraction, and chemical hydrolysis [6]. FA can be selectively recovered from plant cell walls through the synergistic action of xylanase/pectinase and FA esterase. However, it is a time-consuming and costly method [7]. Organic solvent extraction usually involves high solvent consumption. Compared to the enzymatic hydrolysis and organic solvent extraction, chemical hydrolysis is more efficient in isolating FA and pCA from plant raw materials. The most commonly used chemical hydrolysis are acid, alkali, and acid/base two-step hydrolysis. It is noted that hydrolysis under acidic conditions can destroy the glycosidic bonds between polysaccharides [8,9], and the soluble mono- and oligosaccharides complicate the purification process [10]. In addition, the condensation reaction of lignin more easily happens under acid conditions [11]. Considering the residual lignin reactivity, alkaline hydrolysis is more suitable for FA and pCA isolation [12].
The hydrolysis efficiency of FA and pCA in the alkaline treatment is essential for isolating and quantifying these two hydroxycinnamic acids. At the same time, the complete release of FA and pCA is of great significance for the evaluation of active ingredients and the chemical composition analysis of raw materials. For example, a series of chemical treatment methods are used to delignify biomass in the pulp and paper industry. And the ester bond structures from FA and pCA in the raw lignin will increase the reagent consumption. In the subsequent bleaching stage, the residual FA and pCA containing unsaturated double bonds that existed in pulp and paper are significant incentives for the cost of bleaching agents and cause the brightness reversion of paper [13,14]. Besides, lignin degradation and condensation occur during the alkaline treatment for the quantitative isolation of FA and pCA. However, the corresponding structural changes of lignin are still not clear.
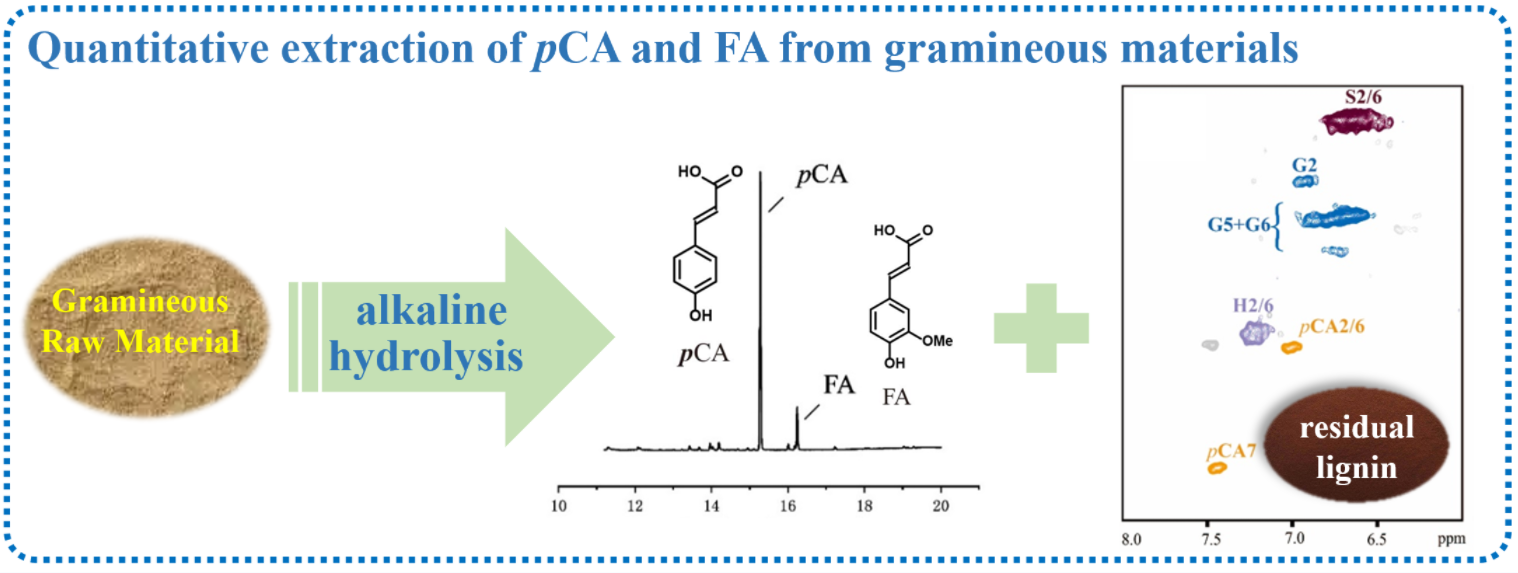
Herein, we reported the quantitative isolation of FA and pCA from four different samples and analyzed them by GC-MS and GC-FID. The solid residual and isolated alkali lignin after alkaline treatment were characterized by 2D HSQC NMR to reveal the structural change of lignin during the extraction of FA and pCA, Fig. 1.

Figure 1: Schematic of extraction and characterization of pCA, FA, and residual lignin
Ferulic acid standard (99%) was purchased from Shanghai Shifeng Biochemical Co., Ltd. (China). p-Coumaric acid (99%), sodium hydroxide (99%), ethanol (95%), dichloromethane (99%), ethyl acetate (EtOAc) (99%), pyridine (99%), bis(trimethylsilyl) trifluoroacetamide (BSTFA) (98%) were purchased from Shanghai Macklin Biochemical Co., Ltd. (China). Sugarcane bagasse, wheat straw, and corn stove/corncob used in this study were provided by Nanen sugar Paper Co., Ltd. (Xinping, Yunnan Province, China), Jiaxiang County (Jining, Shandong Province, China), and Taobao (online retail), respectively. All raw materials were cut into pieces, grounded, and sieved to collect the 40–60 mesh. Then the grounded powders were dewaxed by ethanol aqueous solution (80%) extraction at 80°C for 8 h (twice) and dichloromethane extraction at 30°C for 15 h.
The lignin contents of four different samples were determined by the L-cysteine dissolution method according to the previous study [15]. The lignin contents of bagasse, wheat straw, corn stover, and corncob were 20.5%, 16.5%, 15.8%, and 12.3%, respectively.
2.3 Alkali Hydrolysis of Gramineous Raw Materials
1 g of dry raw material was put into a sealed glass vial with 20 mL of 1 M NaOH solution and kept stirring for 1–8 h at 100°C. After the reaction, the vial was cooled down and filtered to collect the filtrate by 200 mesh screen and the hydrolysis residue. The residue was washed with deionized water 3 times, combined with the filtrates, and then adjusted the pH to 3 with 1 M HCl. The filtrate was extracted with ethyl acetate. The supernatant was collected by centrifugation 3 times at 10000 rpm. The upper organic phase was filtered with a 0.22 μm membrane and evaporated under reduced pressure. The extracted hydrolysis product was silylated in pyridine using bis (trimethylsilyl) trifluoroacetamide (BSTFA) at 50°C for 40 min. The silylated product was characterized by GC-FID and GC-MS. In addition, the alkali lignin obtained by acidic precipitation was collected and freeze-dried for NMR characterization.
The structure of the extracted hydrolysis products, including FA and pCA, was identified by the GC-MS with Shimadzu SH-Rxi Sil column (GCMS-TQ8040, SHIMADZU). The procedure was as follows: the gasification temperature was set as 250°C. 1 μL of the sample was injected with split mode (split ratio 20:1). The oven temperature was held at 80°C for 5 min and then was programmed to 280°C (heating rate 15 °C/min) and kept for 10 min. The ion source temperature was 250°C. The MS scanning range was 50–800 m/z.
The quantitative analysis of FA and pCA was carried out by gas chromatography (SHIMADZU GC-FID Nexis GC-2030) equipped with SH-Rxi-1ms column with an FID detector. The concentration-response value correction curve was measured by the detector response values of FA and pCA standard solutions at different concentration gradients. The same temperature program was used for GC-MS determination. High-purity nitrogen was used as the carrier gas. The hydrogen flow rate of the flame ion detector was 40 mL/min. The airflow rate was 200 mL/min. The detector temperature was 300°C.
GC-FID, combined with the concentration gradient calibration curve method, was used for a more accurate quantitative analysis of products with known structures. The calibration curve of the concentration detector response value was plotted. The concentration was calculated through the detector response value of the product to be tested.
Y is the response value of the detector; C is the sample concentration (unit: ppm)
2.6 2D HSQC NMR Characterization
2D HSQC NMR for whole cell wall (WCW) and solid residue. 0.5 g of dry raw materials (solid residue) was ball-milled for 48 h (milling by a planetary ball mill at 300 rpm for 5 min with 5 min intervals). 100 mg of ball-milled sample was added into a 2 mL glass vial with 1 mL of mixed deuterated reagent (DMSO-d6:pyridine-d5 4:1, v/v). The sample was sonicated for 10 min and then transferred to an NMR tube. The HSQC spectrum was recorded on a Bruker 500 MHz NMR. The pulse program was hsqcetgpsi2 with NS as 64, TD2 as 1024, TD1 as 256, and D1 as 1.5 s. The obtained spectrum was analyzed and processed by topspin software, The signal of DMSO (
2D HSQC NMR for alkali lignin. 60 mg of lignin sample was dissolved in an NMR tube with 0.6 mL DMSO-d6. The 2D HSQC NMR determination procedure was the same as WCW.
c(x) is the content of a structure relative to the total aromatic ring in the lignin structure, and A is the characteristic signal area of a structure in the spectrum (calculated as one hydrogen unit).
5 mg of lignin sample was dissolved in 0.5 mL of acetic anhydride: pyridine (1:1, v/v). The mixture was reacted at room temperature for 24 h in the dark. After the reaction, the mixture was transferred to a 50 mL round bottom flask, quenched by ethanol, and evaporated under reduced pressure at 50°C to remove the solvents. The acetylated product was dissolved in chromatographic grade tetrahydrofuran solvent and filtered with a 0.22 μm membrane. The sample concentration was 2 mg/mL. Polystyrene standard samples (the minimum weight average molecular weight is 208 g/mol and the maximum is 49,000 g/mol) were used for molecular weight calibration. The molecular weight of the product was determined by tetrahydrofuran phase gel permeation chromatography (GPC, Agilent1260) [16].
3.1 Quantification of FA and pCA
Alkaline hydrolysis could cleave the ester bonds between lignin and FA (or pCA) to release the FA and pCA monomers. The alkaline hydrolysis products were extracted by EtOAc to recover the released FA and pCA for isolation and quantification [8]. The recovered hydrolysis products of bagasse were identified by GC-MS, as shown in Fig. 2. Figs. 2a and 2b show the total ion chromatography (TIC) and mass spectrometry (MS) fragment diagram of ethyl acetate extracts from bagasse after hydrolysis reaction at 100°C for 4 h. Combined with the retention time and mass spectrum fragments of FA and pCA standards, it was confirmed that FA and pCA were the main products extracted by EtOAc.

Figure 2: TIC and MS fragments of bagasse alkali hydrolysate (a) Silylated FA (b) Silylated pCA
During alkaline hydrolysis, the reaction time, temperature, and alkaline concentration are essential factors that affect the cleavage efficiency of FA and pCA. Considering the reactivity of lignin and FA/pCA under alkaline treatment, the isolation yields of FA and pCA by alkaline hydrolysis were investigated at 100°C and 1 M NaOH for varied reaction times [17]. As shown in Table 1, the yields of FA and pCA monomers increased by prolonging the hydrolysis time from 1 to 4 h. As the alkaline treatment time was prolonged to 4 h, pCA and FA monomer yielded 39.8 and 11.5 mg/g, respectively. The total mass of these two monomers accounts for 25.03% based on lignin content. By comparison, the yields of pCA and FA at 4 h are 34% and 18.5% higher than those of 1 h. However, as the reaction time was extended to 8 h, the yields of pCA and FA were slightly decreased.

Table 2 shows the isolation yield of FA and pCA from bagasse, wheat straw, corn stover, and corncob. Among these four raw materials, bagasse shows the highest yield of pCA, followed by corncob, corn stover, and wheat straw, which are 39.8, 35.1, 28.0, and 13.7 mg/g, respectively. The yield of FA in corncob hydrolysate is the highest among four different biomass, being 14.5 mg/g (11.79% based on lignin). Considering the lignin content of raw materials, the total yields of FA and pCA in bagasse, wheat straw, corn stover, and corncob are accounted for 25%, 15%, 25%, and 40%, respectively. It is evident that the FA and pCA are important components in Gramineae lignins. These results suggested that bagasse, corncob, and corn stover are all suitable raw materials for the source of FA and pCA.

3.2 2D HSQC NMR Characterization of Raw Materials and Solid Residues
The HSQC spectra of the whole cell wall gel-state samples are shown in Figs. 3 and 4. The characteristic peaks G2, G5, and G6 of G-type units were observed in the aromatic region in Fig. 3 at

Figure 3: The aromatic region of the 2D HSQC NMR spectra of whole cell wall (a) Bagasse, (b) Wheat straw, (c) Corn stover, and (d) Corncob

Figure 4: The aliphatic region of the 2D HSQC NMR spectra of whole cell wall (a) Bagasse, (b) Wheat straw, (c) Corn stover, and (d) Corncob
The signal intensity of pCA in the four grass samples was significantly stronger than that of FA. The content of pCA is about 1.5–7.0 times higher than that of FA, according to the contour integration. Among these samples, the content of pCA in bagasse is the highest by integration. In contrast, the content of pCA in wheat straw is significantly lower than that of the other three samples, consistent with the result from GC quantitation.
For a better understanding of the removal efficiency of FA and pCA under alkaline condition, the hydrolysis solid residue was also characterized by 2D HSQC NMR (Fig. 5). Neither the FA nor pCA could be observed in the aromatic area, suggesting the complete (or nearly complete) removal of FA and pCA under the alkaline treatment in 1 M NaOH at 100°C for 4 h. A small amount of G/S-type units, including G2, G5, G6, and S2/6 correlations in the aromatic area and β aryl ether linkages in the aliphatic region, were observed in the solid residue of wheat straw. By comparison, the correlations of methoxyl group are observed in the solid residues of bagasse, wheat straw, and corn stover. In contrast, the correlations of the methoxyl group completely disappeared in the solid residue of the corncob. However, no characteristic lignin peak is observed in bagasse, corn stover, and corncob residues, indicating that the lignin has been effectively removed and dissolved in the alkaline liquid (filtrate) under the alkaline hydrolysis treatment, and the low levels of residual lignin in the solid residue beyond the 2D HSQC NMR’s detection limit.

Figure 5: 2D HSQC NMR spectra of alkaline hydrolysis residue in aromatic region (a) Bagasse (b) Wheat straw (c) Corn stover (d) Corncob
3.3 2D HSQC NMR Characterization of Alkali Lignins
Alkaline hydrolysis is a common method to separate lignin and hemicellulose from lignocellulosic biomass. A large amount of lignin could be dissolved in the alkaline solution during the isolation process of FA and pCA from the gramineae raw materials. Depolymerization occurred to the lignin at varying temperatures during alkaline treatment. As shown in Fig. 6, the four different alkali lignins are composed of three units (G, S, and H units). The correlations of FA disappeared in the four different alkali lignins, whereas a small amount of pCA remained. This result indicates that FA could be completely released at 100°C with 1 M NaOH for 4 h. Although it is reported that the linkages between FA/pCA and lignin in gramineous raw materials are mainly ester and ether bonds, the reactivities of these two structures, to some extent, behave differently under alkali treatment as shown by the NMR spectra [21,22]. It suggests that there might be a certain amount of stubborn connection between pCA and lignin that remained intact during alkali treatment.

Figure 6: 2D HSQC NMR spectra of alkali lignins (a) Bagasse (b) Wheat straw (c) Corn stover (d) Corncob
Table 3 shows the molecular weights of four different alkali lignins. The molecular weights of alkali lignins are within 1100–1300 g/mmol, which is lower than that of common alkali lignin or kraft lignin [23,24]. The polydispersity is 2.2–2.6, indicating a relatively narrow molecular weight distribution. Combined with NMR analysis in the aliphatic side-chain region, trace amount of β-O-4 characteristic signals indicate that lignin was mainly degraded and dissolved without severe condensation reaction under this condition.

This paper explored the contents of FA and pCA in four different gramineous plant samples and characterized the lignin structure before and after alkali treatment. The bagasse, wheat, corn straw, and corncob released 39.8, 13.7, 28.0, 35.1 mg/g of pCA, and 11.5, 11.0, 11.0, 14.5 mg/g of FA, respectively, in 1 M NaOH at 100°C for 4 h. According to the characterization of the extracted lignin from the four gramineous plant materials by 2D HSQC NMR, the applied alkali treatment was able to completely remove FA, but not the pCA, from the lignin. Overall, this study discloses the structure of residual lignin during the quantitative extraction of FA and pCA from different gramineous materials, providing a simultaneous way for the efficient isolation of pCA, FA, and alkaline lignin.
Funding Statement: The authors are grateful for the financial support for this work from the National Natural Science Foundation of China (31870560 and 22108088) and the State Key Laboratory of Pulp and Paper Engineering (South China University of Technology), No. 202105.
Conflicts of Interest: The authors declare that they have no conflicts of interest to report regarding the present study.
References
1. del Río, J., Rencoret, J., Gutierrez, A., Kim, H., Ralph, J. (2022). Chapter one-unconventional lignin monomers—Extension of the lignin paradigm. Advances in Botanical Research, 104, 1–39. DOI 10.1016/bs.abr.2022.02.001. [Google Scholar] [CrossRef]
2. del Río, J., Rencoret, J., Gutierrez, A., Elder, T., Kim, H. et al. (2020). Lignin monomers from beyond the canonical monolignol biosynthetic pathway: Another brick in the wall. ACS Sustainable Chemistry & Engineering, 8, 4997–5012. DOI 10.1021/acssuschemeng.0c01109. [Google Scholar] [CrossRef]
3. Zhang, K. L., Li, H. L., Xiao, L. P., Wang, B., Sun, R. G. et al. (2019). Sequential utilization of bamboo biomass through reductive catalytic fractionation of lignin. Bioresource Technology, 285, 121335. DOI 10.1016/j.biortech.2019.121335. [Google Scholar] [CrossRef]
4. Liu, G. H., Zong, Z. M., Liu, F. J., Ma, Z. H., Wei, X. Y. et al. (2019). Clean and effective catalytic hydrolysis of bagasse waste to small-molecular compounds over a hydrothermally stable Ru/La(OH)3. Journal of Cleaner Production, 238, 117909. DOI 10.1016/j.jclepro.2019.117909. [Google Scholar] [CrossRef]
5. Zdunska, K., Dana, A., Kolodziejczak, A., Rotsztejn, H. (2018). Antioxidant properties of ferulic acid and its possible application. Skin Pharmacology and Physiology, 31(6), 332–336. DOI 10.1159/000491755. [Google Scholar] [CrossRef]
6. Barberousse, H., Roiseux, O., Robert, C., Paquot, M., Deroanne, C. et al. (2008). Analytical methodologies for quantification of ferulic acid and its oligomers. Journal of the Science of Food and Agriculture, 88(9), 1494–1511. DOI 10.1002/jsfa.3242. [Google Scholar] [CrossRef]
7. Jiang, K. K., Li, L. L., Long, L. K., Ding, S. J. (2018). Comprehensive evaluation of combining hydrothermal pretreatment (autohydrolysis) with enzymatic hydrolysis for efficient release of monosaccharides and ferulic acid from corn bran. Industrial Crops and Products, 113, 348–357. DOI 10.1016/j.indcrop.2018.01.047. [Google Scholar] [CrossRef]
8. Choi, M. S., Park, J. H., Min, J. Y., Lim, B. K., Lee, B. H. et al. (2008). Efficient release of ferulic acid from sweet potato (Ipomoea batatas) stems by chemical hydrolysis. Biotechnology and Bioprocess Engineering, 13(3), 319–324. DOI 10.1007/s12257-007-0139-0. [Google Scholar] [CrossRef]
9. Li, K. Y., Lai, P., Lu, S., Fang, Y. T., Chen, H. H. (2008). Optimization of acid hydrolysis conditions for feruloylated oligosaccharides from rice bran through response surface methodolgy. Journal of Agricultural and Food Chemistry, 56(19), 8975–8978. DOI 10.1021/jf801736z. [Google Scholar] [CrossRef]
10. Mathew, S., Abraham, T. E. (2004). Ferulic acid: An antioxidant found naturally in plant cell walls and feruloyl esterases involved in its release and their applications. Critical Reviews in Biotechnology, 24(2–3), 59–83. DOI 10.1080/07388550490491467. [Google Scholar] [CrossRef]
11. Abu-Omar, M. M., Barta, K., Beckham, G. T., Luterbacher, J. S., Ralph, J. et al. (2021). Guidelines for performing lignin-first biorefining. Energy & Environmental Science, 14(1), 262–292. DOI 10.1039/d0ee02870c. [Google Scholar] [CrossRef]
12. Buranov, A. U., Mazza, G. (2009). Extraction and purification of ferulic acid from flax shives, wheat and corn bran by alkaline hydrolysis and pressurised solvents. Food Chemistry, 115(4), 1542–1548. DOI 10.1016/j.foodchem.2009.01.059. [Google Scholar] [CrossRef]
13. Pan, G. X., Thomson, C. I., Leary, G. J. (2003). The role of ferulic acid removal during bleaching of wheat straw mechanical pulp with peroxygen reagents. Holzforschung, 57(3), 282–288. DOI 10.1515/hf.2003.042. [Google Scholar] [CrossRef]
14. Grabber, J. H., Hatfield, R. D., Lu, F., Ralph, J. (2008). Coniferyl ferulate incorporation into lignin enhances the alkaline delignification and enzymatic degradation of cell walls. Biomacromolecules, 9(9), 2510–2516. DOI 10.1021/bm800528f. [Google Scholar] [CrossRef]
15. Lu, F., Wang, C., Chen, M., Yue, F., Ralph, J. (2021). A facile spectroscopic method for measuring lignin content in lignocellulosic biomass. Green Chemistry, 23(14), 5106–5112. DOI 10.1039/d1gc01507a. [Google Scholar] [CrossRef]
16. Wang, J. L., Zhao, C. K., Zhang, T. H., Yang, L. J., Chen, H. L. et al. (2022). In-depth identification of phenolics fractionated from eucalyptus kraft lignin. Advanced Sustainable Systems, 6(5), 2100406. DOI 10.1002/adsu.202100406. [Google Scholar] [CrossRef]
17. Garcia, J. C., Diaz, M. J., Garcia, M. T., Feria, M. J., Gomez, D. M. et al. (2013). Search for optimum conditions of wheat straw hemicelluloses cold alkaline extraction process. Biochemical Engineering Journal, 71, 127–133. DOI 10.1016/j.bej.2012.12.008. [Google Scholar] [CrossRef]
18. Kim, H., Ralph, J. (2010). Solution-state 2D NMR of ball-milled plant cell wall gels in DMSO-d6/pyridine-d5. Organic & Biomolecular Chemistry, 8(3), 576–591. DOI 10.1039/b916070a. [Google Scholar] [CrossRef]
19. Kim, H., Ralph, J., Akiyama, T. (2008). Solution-state 2D NMR of ball-milled plant cell wall gels in DMSO-d6. Bioenergy Research, 1(1), 56–66. DOI 10.1007/s12155-008-9004-z. [Google Scholar] [CrossRef]
20. Liu, X., Zhu, R. N., Chen, T. Y., Song, P. P., Lu, F. C. et al. (2020). Mild acetylation and solubilization of ground whole plant cell walls in EmimAc: A method for solution-state NMR in DMSO-d6. Analytical Chemistry, 92(19), 13101–13109. DOI 10.1021/acs.analchem.0c02124. [Google Scholar] [CrossRef]
21. Li, M., Wan, G., Zhuan, J., Guo, C., Yun, X. et al. (2019). Determination of ferulic acid and p-coumaric acid in sugarcane bagasse. Transactions of China Pulp and Paper, 34(2). DOI 10.11981/j.issn.1000-6842.2019.02.01. [Google Scholar] [CrossRef]
22. Sun, R. C., Sun, X. F., Wang, S. Q., Zhu, W., Wang, X. Y. (2002). Ester and ether linkages between hydroxycinnamic acids and lignins from wheat, rice, rye, and barley straws, maize stems, and fast-growing poplar wood. Industrial Crops and Products, 15(3), 179–188. DOI 10.1016/s0926-6690(01)00112-1. [Google Scholar] [CrossRef]
23. Zhao, C., Li, S., Zhang, H., Yue, F., Lu, F. (2020). Structural insights into the alkali lignins involving the formation and transformation of arylglycerols and enol ethers. International Journal of Biological Macromolecules, 152, 411–417. DOI 10.1016/j.ijbiomac.2020.02.241. [Google Scholar] [CrossRef]
24. Majdar, R., Ghasemian, A., Resalati, H., Saraeian, A., Crestini, C. et al. (2020). Case study in kraft lignin fractionation: “Structurally purified” lignin fractions—The role of solvent H-bonding affinity. ACS Sustainable Chemistry & Engineering, 8(45), 16803–16813. DOI 10.1021/acssuschemeng.0c05364. [Google Scholar] [CrossRef]
Cite This Article
 Copyright © 2023 The Author(s). Published by Tech Science Press.
This work is licensed under a Creative Commons Attribution 4.0 International License , which permits unrestricted use, distribution, and reproduction in any medium, provided the original work is properly cited.
 Downloads
 Citation Tools