
 Submit a Paper
 Propose a Special lssue
 Open Access
ARTICLE

Structural and Physicochemical Properties of Dust and Their Effect on Solar Modules Efficiency in Agadir-Morocco
Materials and Renewable Energies Laboratory, University Ibn Zohr, Agadir, 80000, Morocco
* Corresponding Author: Abdellah Asbayou. Email:
Journal of Renewable Materials 2023, 11(5), 2249-2264. https://doi.org/10.32604/jrm.2023.025456
Received 13 July 2022; Accepted 19 September 2022; Issue published 13 February 2023
 View Full Text
 Download PDF
Abstract
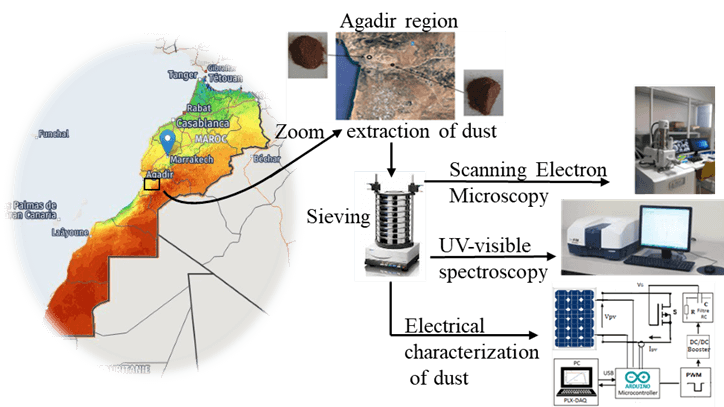
Experiments of soiling effects on the performances of a PV panel have been performed using dust collected from two sites in the region of Agadir-Morocco. The optical transmittance of the front glass was found to depend on the nature and density of dust. The nature of dust was studied by means of scanning electron microscopy and energy dispersive x-ray spectroscopy. It was found that the granulometry of dust particles depends on the study area. For a dust density of around 20 g/m², the maximum power Pmax of the solar panel decreases drastically from 30 to 20 W for the (HP) site, and no more than 14 W for the (AD) site. The diversity of the behavior of the soiled panel was explained in terms of the size of the particles collected from each area. The transmission of light across the front glass of the PV panel is more affected when the sizes of particles are small.Graphic Abstract
Keywords
Morocco is strongly affected by climate change (CC), suffering a strong vulnerability to global warming, with the forests, agriculture, fishing, water supplies, and tourism being among the most vulnerable ecosystems. For instance, Morocco, which hosted the Climate Change Conference COP22 in 2016 has signed the COP21 Paris Agreement, aiming at keeping in this century a global temperature rise well below 2°C [1]. The adoption of a new green energy policy will enable the country to benefit from an abundant solar energy potential estimated to be up to 3.000 h of sunshine per year, which is equivalent to more than 6.5 KWh/m2/day. This will contribute to a significant drop in the country’s GHG emissions. To achieve this goal, Morocco is planning to reach a share of renewable power generation, as high as 52% of installed power from RE resources by the year 2030 [2]. Photovoltaic conversion of solar energy [3] exhibits one of the best-levelized costs of electricity (LCOE) compared to other technologies. As a matter of fact, grid parity is already a reality. The background of solar energy and its significant contribution was intensively commented [4,5].
However, electrical energy production by PV modules is strongly affected by environmental factors, such as solar irradiance, ambient temperature, humidity, seasonal changes, dust, wind speed and direction [6], tilt angle, orientation, elevation, seasonal tilt adjustment, and installation location, which are critical for PV module performance [7]. One of the most important factors affecting the photovoltaic module’s degradation is the accumulation of dust on the surface of the module, which leads to a large energy loss during extended use [8]. Moreover, the continued accumulation of dust can damage the layers of the panel, reducing the performance and lifetime of the solar panel.
The impact of atmospheric dust on incident solar radiation in Morocco was reported by several studies [9,10]. So far, no past studies have focused on the influence of dust deposited on the panels installed in Agadir, on the efficiency of solar PV modules. To assess the effect of dust deposition on the productivity of solar panels, detailed information on the physical and chemical properties of dust is required [11]. Indeed, dust deposition on PV panels and its effect are related to local soil composition and industrial activities [12]. Moreover, extremely fine airborne particles are carried by the wind from distant areas and should be taken into consideration. The composition of dust in desert areas is almost mineral, dominated by quartz (SiO2), calcite (CaCO3), and hematite (Fe2O3) [12]. The performance of PV panels depends on the amount of dust covering their surface [13]. For example, it was found that a significant loss of about 9% in the average daily power [14].
This paper aims to investigate the structural, chemical, and physical properties of dust collected on the ground of the Agadir-Morocco region. The novelty of this research is to perform a complete physical-chemical analysis of the dust particles deposited in the study area, to understand their effect on the performances of PV panels. This document is structured as follows. Section 1 introduces and discusses several previous studies published and related soiling effects. The study area is presented in Section 2. Section 3 is devoted to the sample characterization techniques. Finally, Section 4 summarizes the physical properties and chemical composition of the dust, and its interaction with the solar panels under the solar conditions of the study area.
The region of Agadir, the district capital of Souss-Massa, is located on the southern Atlantic side of Morocco in the foothills of the Anti-Atlas. The area chosen for our investigations is situated at the following geographical coordinates: 30°25′ North, and 9°36′ West. The type of dust targeted was collected from two sites in the plain of Souss-Massa, namely: the site of Adrar AD (30°25′37.6" N, 9°32′24.1" W) and the site of Halieutic-Park HP (30°24′48.4" N, 9°24′04.5" W) (Fig. 1).
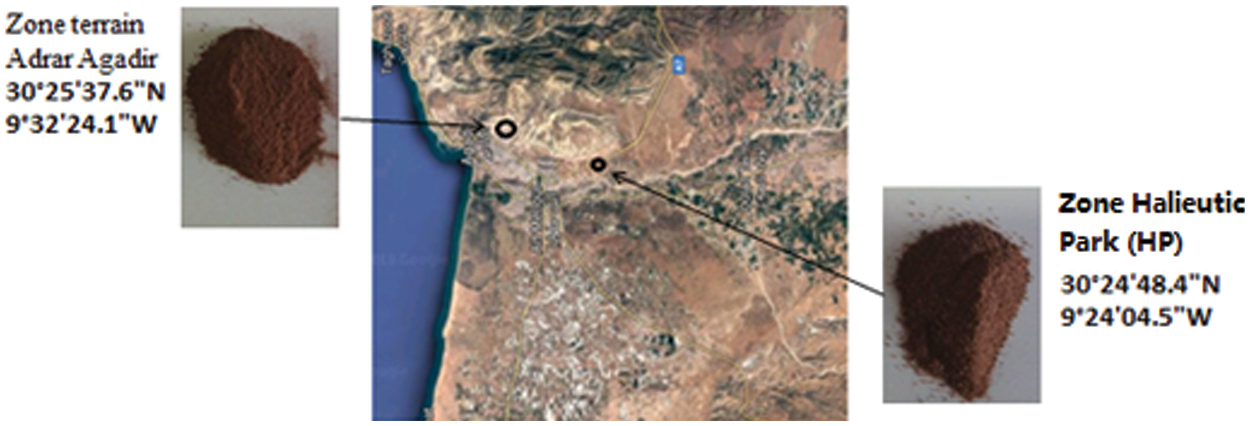
Figure 1: Geographical position of the study area
Besides the interesting solar potential ranging from 5 to 5.3 kWh/m2 [15], the study area is hosting intensive industrial, touristic and agricultural activities. Such activities are likely to contribute to the soiling of PV panels.
3 Experimental Procedures and Methodology
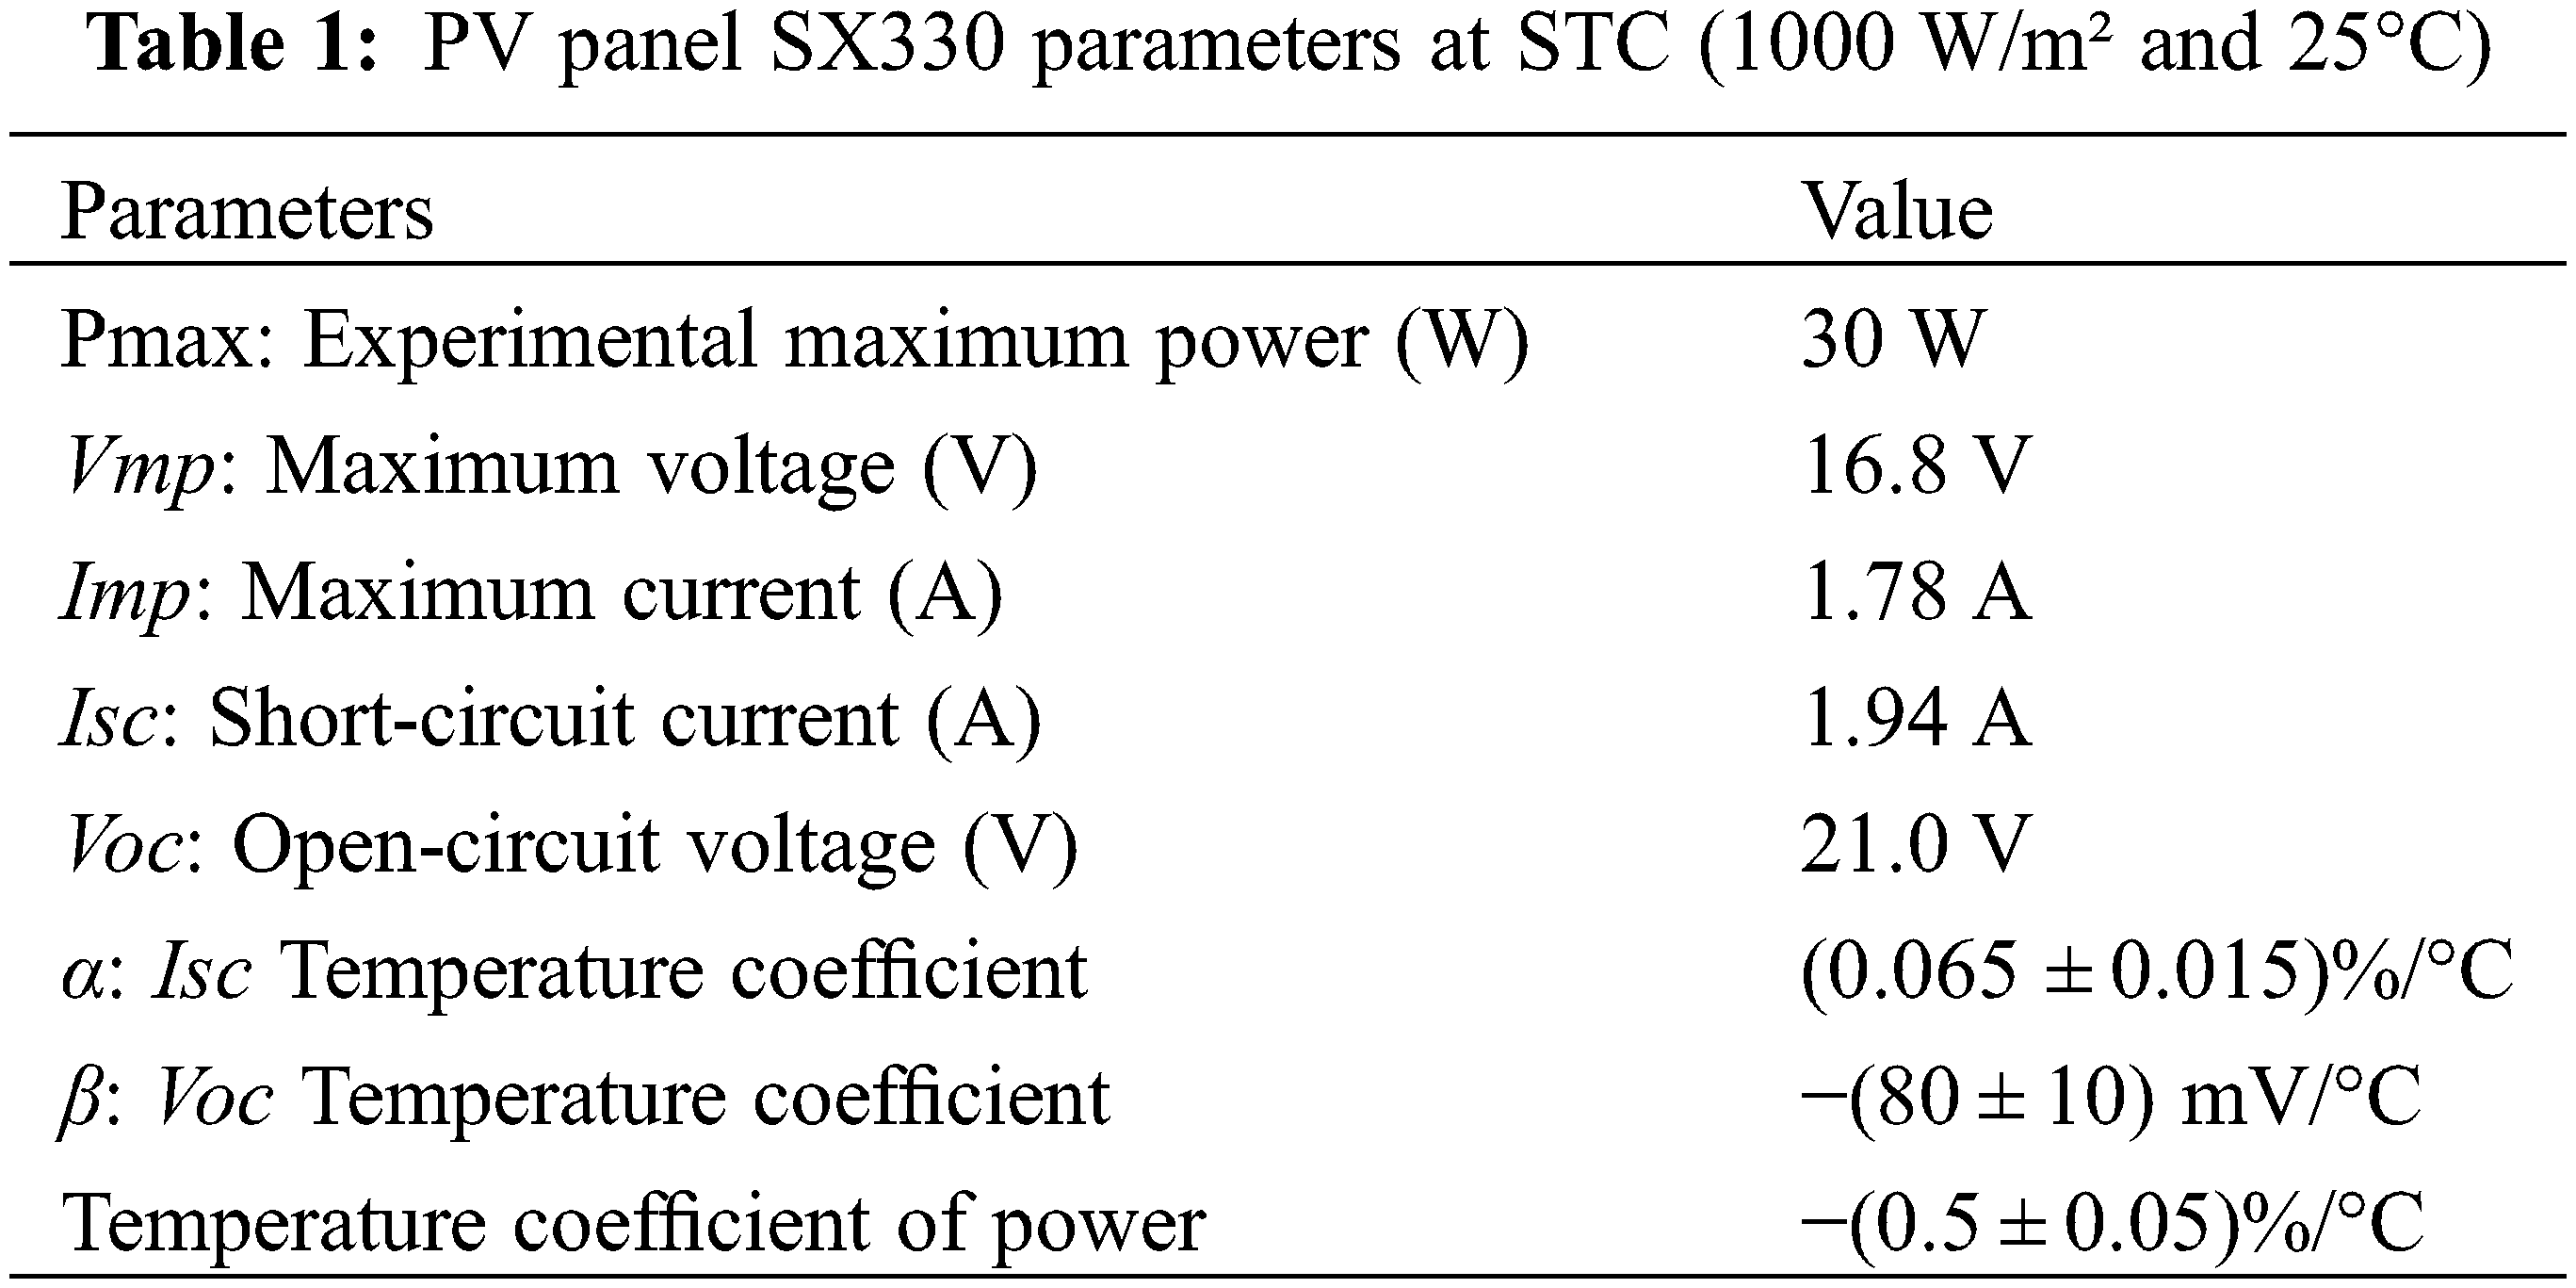
In order to study the optical and chemical properties of dust, deposited on solar panels, two soil samples were collected from the area of Agadir-Morocco in the Souss-Massa plain. The following experimental protocol was adopted. Upon collected, the dust samples were sieved to get a fine powder of less than 100 μm particles in diameter [16]. The particles were then placed on the solar module SX330J as atest panel. Table 1 shows the electrical parameters of the PV module supplied by the manufacturer.
Two analytical techniques were used to reach the physco-chemical properties of the collected dust. Scanning Electron Microscopy (SEM) and Energy Dispersive Spectroscopy (EDS). The morphology of the particles, and their chemical composition were studied using a JeolEO100 equipped with a Jeol EDX detector. The size and the mass percentage of the main constituents of each sample, such as quartz silicates Si2O, and the oxides (CaO, Al2O3, MgO, K2O, TiO2, Fe2O3, FeO, P2O5) were calculated. The influence of the deposited dust on the panel was assessed by the measure of the optical transmittance (Fig. 2) of light across glass samples covered by dust. JASCO V730 UV-Vis spectrophotometer was used to compare the evolution of optical transmittance of light (300 to 1100 nm) as a function of dust density [17]. For this purpose, three samples of tempered glass, with different thicknesses of 1.2, 1.8, and 2.4 mm. The evolution of PV module performances as a function of dust density is performed with an Arduino UNO board, as a unit of acquisition, control, and transfer of data (Ipv and Vpv), in real-time, to a computer via the PLX-DAQ tool [18]. The Arduino module generates a PWM signal, then this signal is injected into an RC filter to control the variation of the voltage VGS of the MOSFET [19].
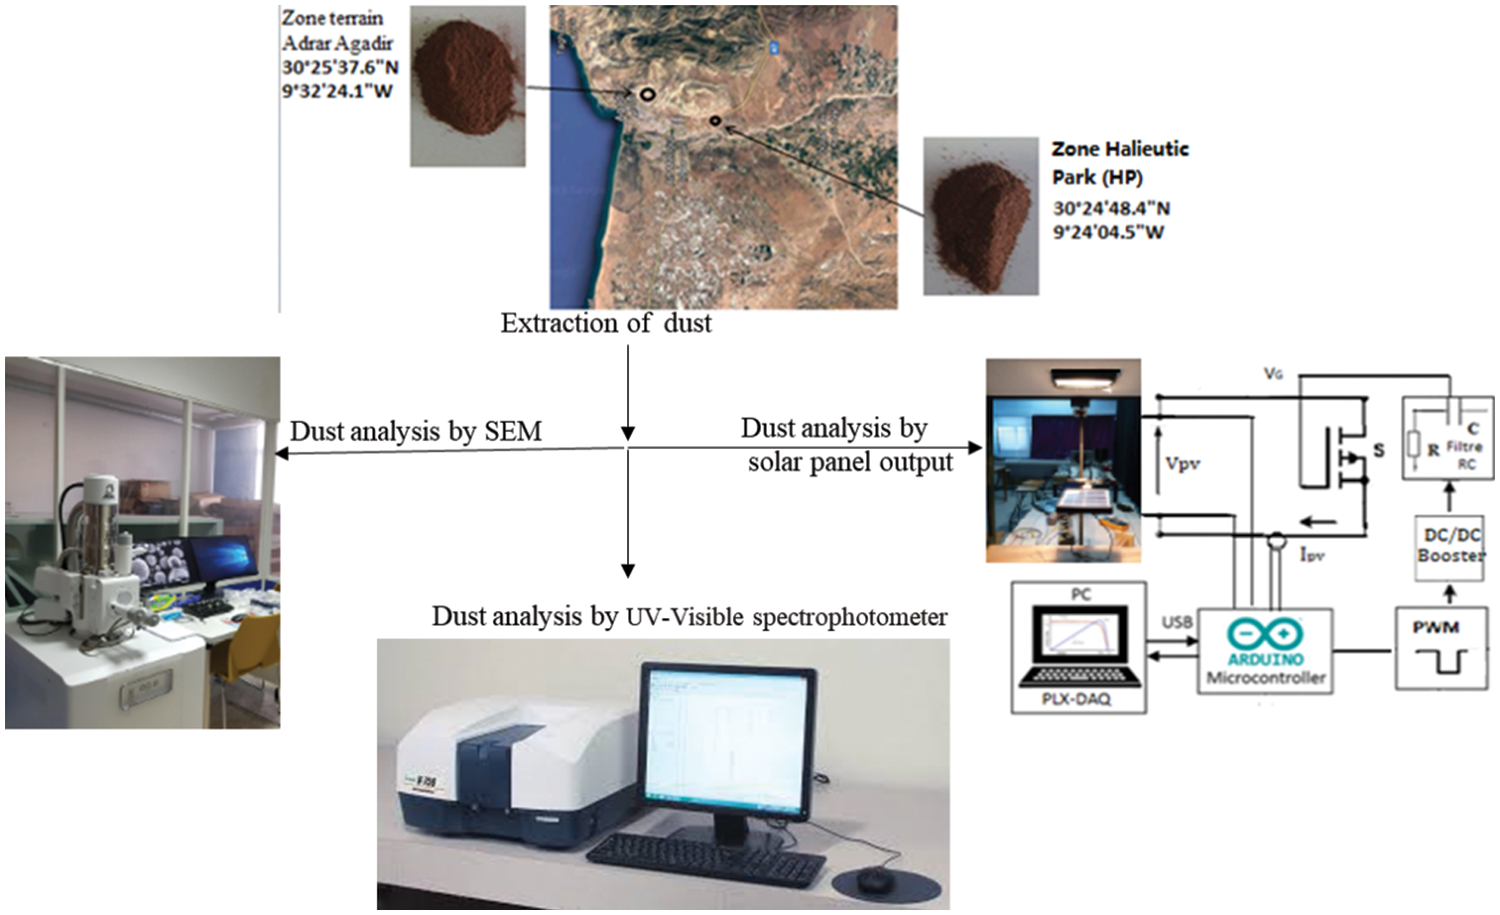
Figure 2: Methodology to assess the influence of soiling effects
The measurements of the current Ipv and the voltage Vpv of the PV output under test were performed using an Arduino-compatible current and voltage sensors. The PV panel temperature is measured by a thermocouple, while the irradiance is measured by a FI 109SM solarimeter. The experimental conditions are summarized below:
1-Irradiation: 890 w/m²,
2-Temperature of the panel between 25°C to 28°C,
3-Normal incidence of light is on the solar panel,
4-Size of the dust considered in the study is less than 100 μm.
The deposition of the dust was assumed to be uniform on the panel.
Much attention has been paid to the accuracy of the used methods in this study. For the optical investigations, spectral measurements were performed several times and were found to be reproducible. More details on scanning electron microscopy and UV-Vis spectroscopy can be found in [20].
The tool developed to the acquisition of electrical has undergone a calibration process based on a digital multimeter tester DGM-360 [21]. This device exhibits a resolution on the voltage of 0.01 V in the range of 4 to 60 V and on the current intensity a resolution of 0.001 A for intensity measurements up to 6 A. The uncertainty given by the manufacturer is 0.02% [22].
4.1 Optical Transmittance of Tempered Glass without Dust
Fig. 3 shows optical transmittance and absorption spectra recorded on three samples of glass, in order to understand the effect of thickness on the optical properties.
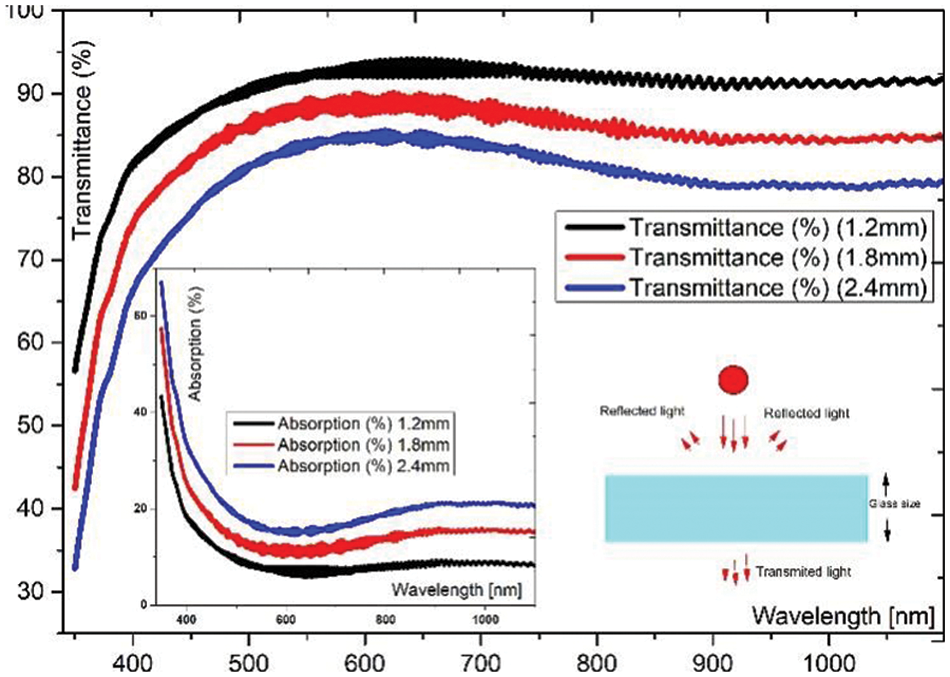
Figure 3: Absorption and Transmittance of three glass samples vs. wavelength
According to the results of Fig. 3, we can discern that the optical transmittance of the samples decreases when the thickness increases, while the absorption of the samples increases. As the average thickness of solar panel front glass is about 2–4 mm [23–25], the glass sample with a thickness of 2.4 mm was selected to assess the effect of dust on optical transmittance and absorption.
4.2 Optical Transmittance of Tempered Glass with Dust
In this section, an amount of dust of 3.45 g/m², was collected from the two areas previously mentioned. A pedological study was previously carried out by Watteeuw et al. [26]. The type of soil in the Adrar area (AD) is different from the type of soil in the Halieutic-Park area (HP).
Fig. 4 shows the influence of soiling on the transmittance and absorption spectra of three samples.
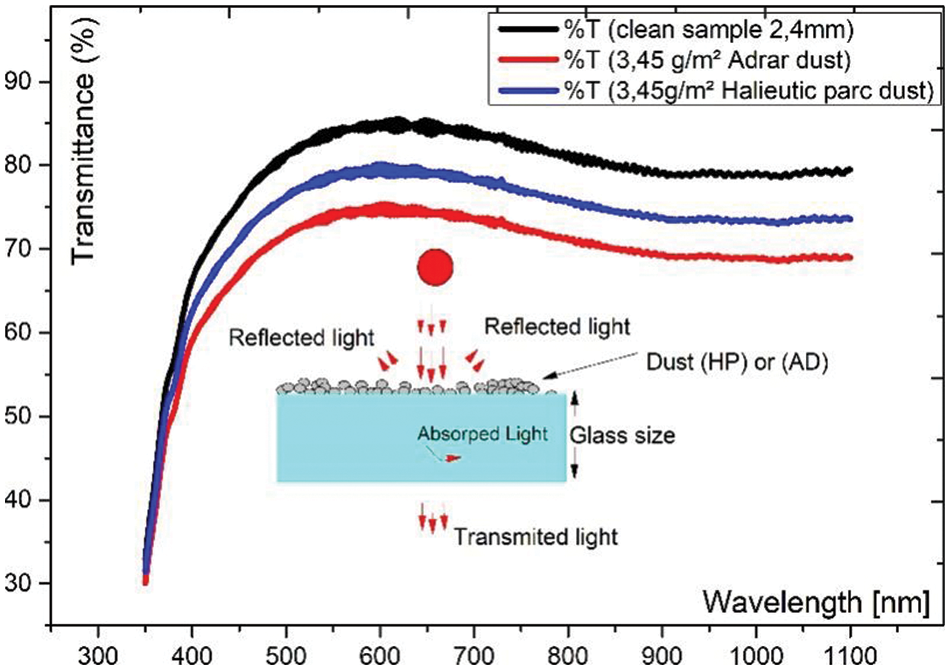
Figure 4: Evolution of the transmittance factor T (%) vs. wavelength
These results show the impact of soiling on optical transmittance. A net drop in transmittance is observed depending on the origin of the dust. A granulometric and chemical study was performed to compare the nature of the components of the two dust samples.
4.3 Granulometric Study of the Dust
A granulometric study [27] based on the classification of the particles of each sample after sieving was performed. Soil particle size analysis involves the determination of the proportion of particles of different sizes. This method is usually used to determine particle size in soils, sediments, and solid wastes [28]. A portion of the sample is separated by shaking on a series of stacked sieves; the contents of each sieve are then balanced. The fraction of the sample collected by each sieve is then related to the total sample weight [29]. Tables 2 and 3 show the results of dust size depending on the weight upon a series of sieving steps of 100 g of each dust sample,


According to Tables 2 and 3, the load of dust existing in the Adrar (AD) sample is higher than its counterpart in the of Halieutic-Park (HP) sample. This observation may answer the difference in optical transmittance shown in Fig. 4.
The histograms of Figs. 5 and 6 led to similar conclusions. Indeed, the percentage of particles with a diameter lower than 100 μm was 8.90% for dust in (AD) sample compared to only 5.60% in the case of dust in (HP) sample.
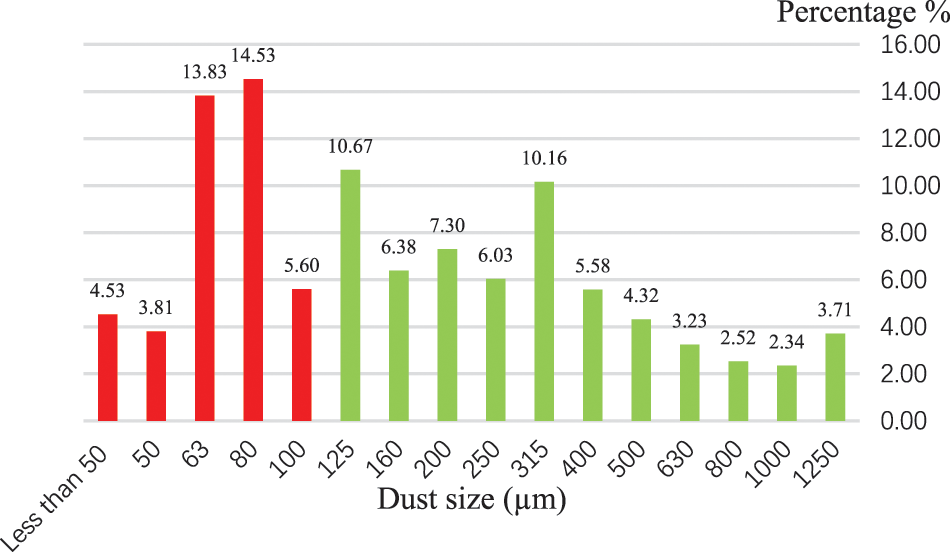
Figure 5: Histogram representing the percentage of each particle size for HP dust
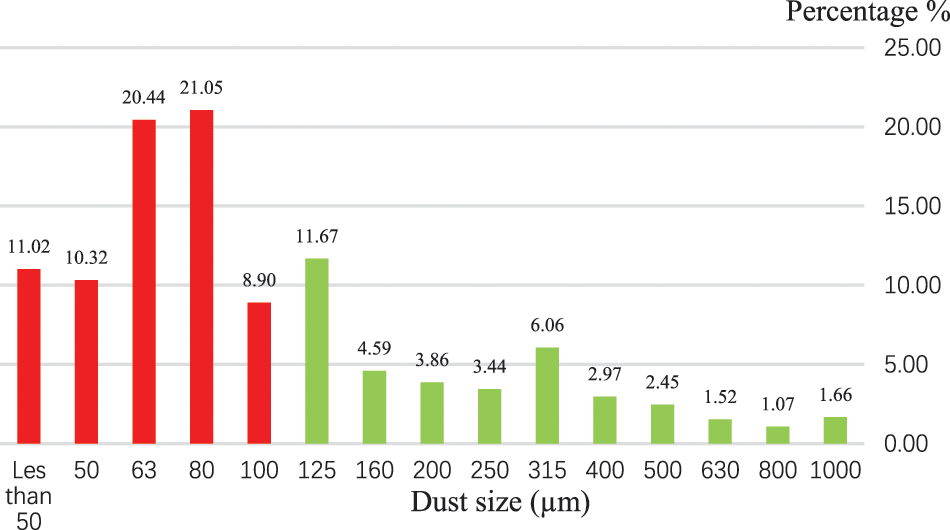
Figure 6: Histogram representing the percentage of each particle size for AD dust
Table 4 shows that the average particle size of dust in the Halieutic-Park (HP) area is too much larger than in the Adrar (AD) area. These findings are responsible of the difference in optical transmittance reported previously. The small dust particles tend to block more light with fewer voids and therefore contribute more to the weakening of optical transmittance and therefore the lowering of the PV panel performances [30].

4.4 Chemical Composition of the Dust Studied
The size and distribution of the dust have a major impact on the shading effect and therefore on the degradation of PV performance, as small particles tend to block more sunlight radiation, with less void between particles, and therefore contribute more to the deterioration of PV performance [30]. This can be explained by the fact that smaller particles are more uniformly distributed than larger particles [31], resulting in greater light scattering, especially at low intensities [32].
Fig. 7 shows the morphology of the two dust samples, obtained by scanning electron microscopy. These micrographs indicate that the average size of the grains in picture (a) related to the dust of (HP) sample is bigger than that of image (b) which represents the dust of (AD) sample.
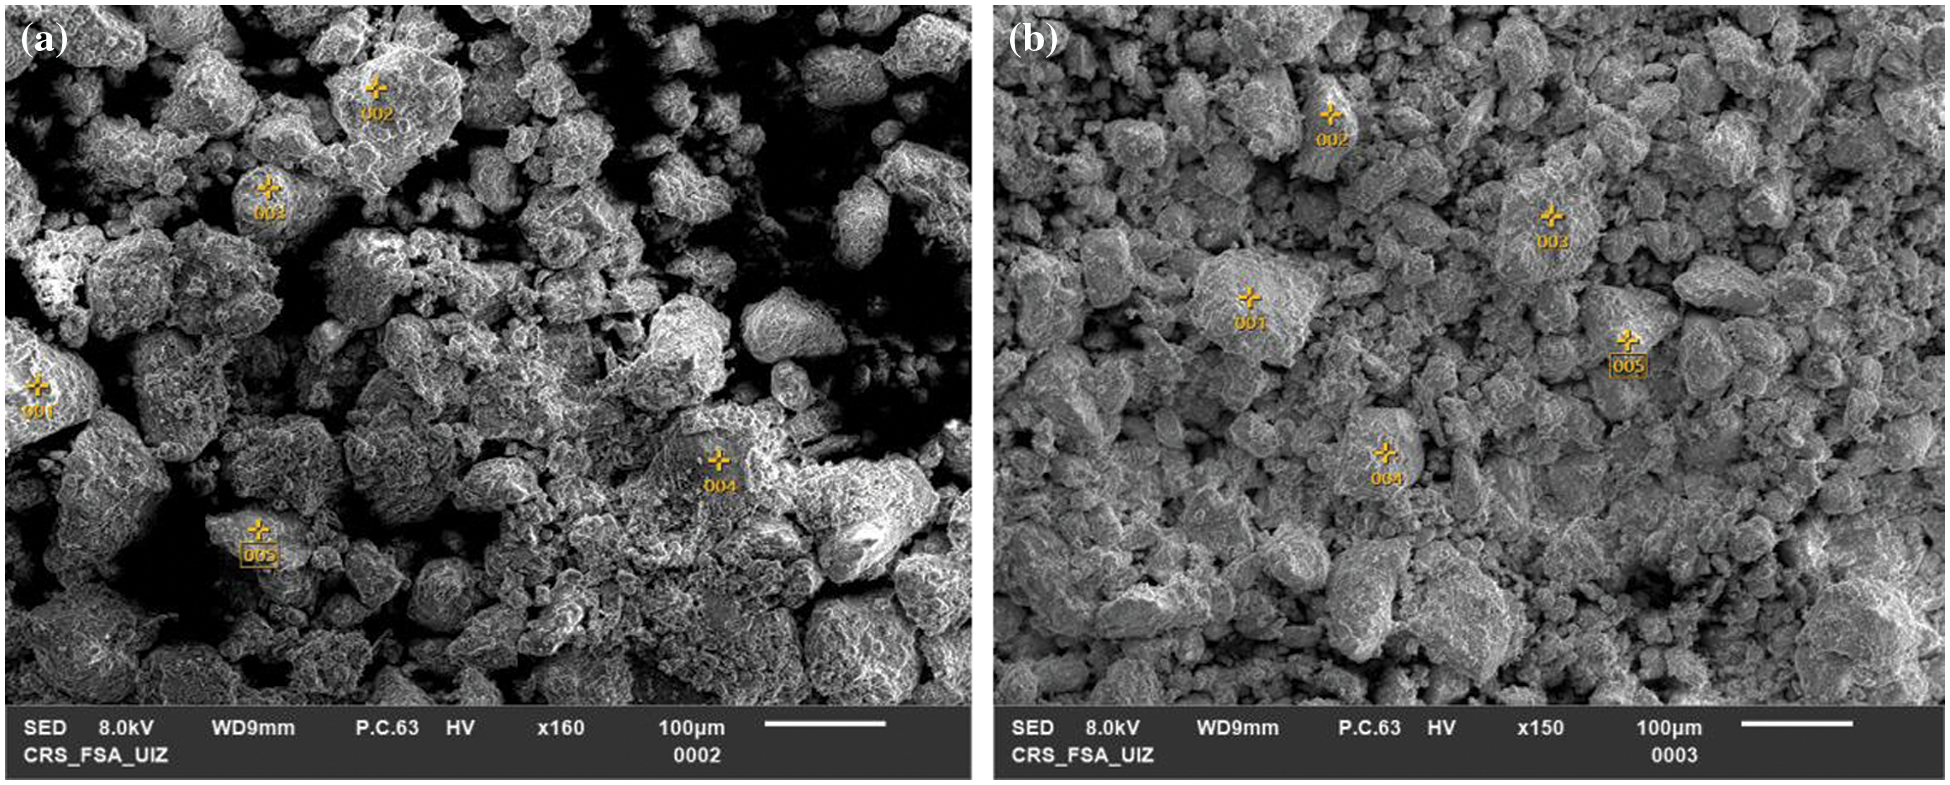
Figure 7: SEM micrographs of dust, (a) Halieutic-Parc (HP) dust, (b) Adrar dust (AD)
Tables 5 and 6 show the mass ratio of oxides in both samples (AD) and (HP), recorded from the five zones on the surface of each sample as shown in Fig. 7. These results illustrate that the main constituents of the dust are quartz silicates Si2O, calcium oxide CaO and oxides (Al2O3, MgO, K2O, TiO2, FeO, P2O5).

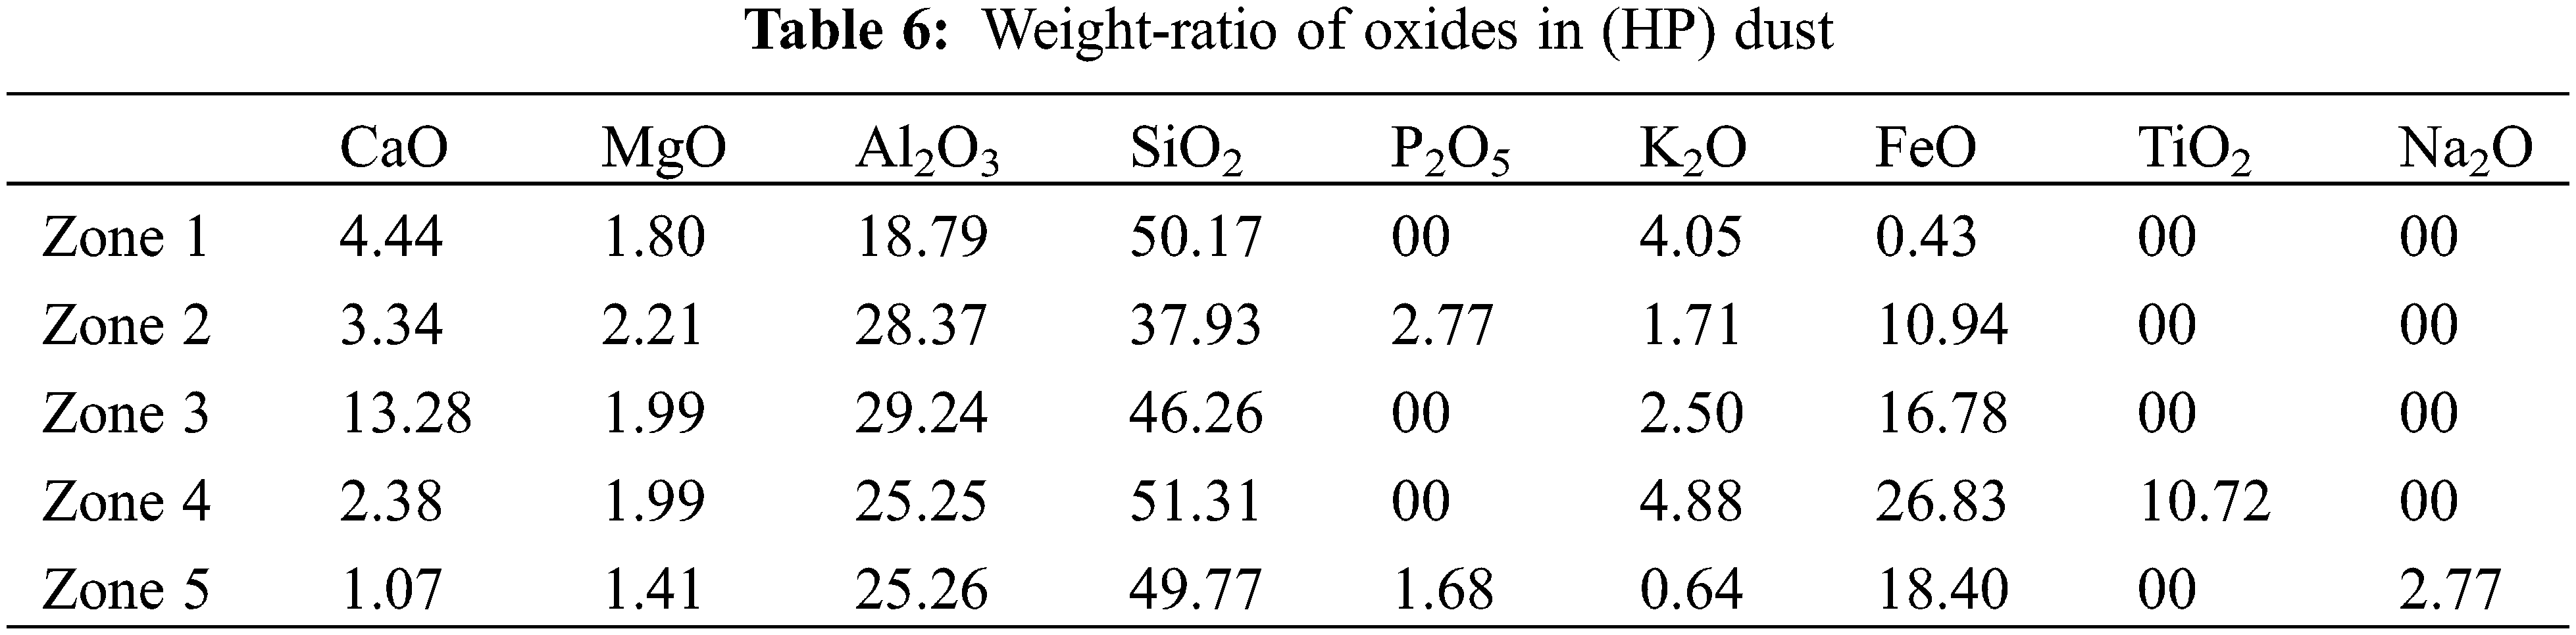
The amount of the main oxides is slightly different. Silica oxide is the dominant compound in the two samples (see Tables 5 and 6). So, we cannot explain the difference in optical transmittance by the variation of the weight-ratio of the main oxides.
Fig. 8 depicts a comparison between the average mass percentage of quartz silicates Si2O, calcium oxide CaO, and oxides (Al2O3, MgO, K2O, TiO2, FeO, P2O5) for the two samples. The share of the compounds Si2O, Al2O3, P2O5, and K2O in the Adrar (AD) sample seems to be similar to that of the Halieutic-Park (HP) dust. Bearing in mind that the silica compound is a transparent material, it does not then affect significantly the transmittance of light. The drop of optical transmittance reported above cannot be related to only the difference in chemical composition of the two samples. The size of particles is then a key factor of the attenuation of the incident light due to dust accumulation and compacity. The transmission of light across the front glass of the PV panel is more affected when the sizes of particles are small. Moreover, dust deposition is influenced by wind and gravity (surface slope) in addition to other removal and adhesion factors [33]. The degradation of a PV panel performances can be even worse in high humidity conditions when small dust particles adhere to the PV surface and form sticky layers that resist to removal by wind forces [34].
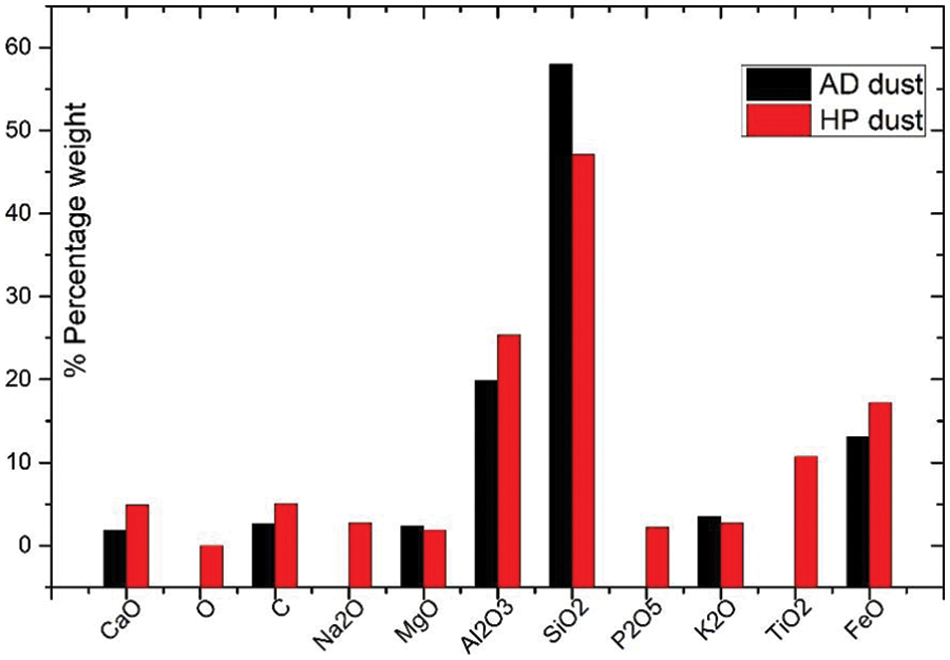
Figure 8: Comparison of the average weight-percentage of the chemical composition in the two samples
Figs. 9 and 10 show the peak intensity of the main chemical elements in our two dust samples.

Figure 9: Average peak intensity of C, O, Si, Al, Fe, Mg, Ca, K recorded on the (HP) sample
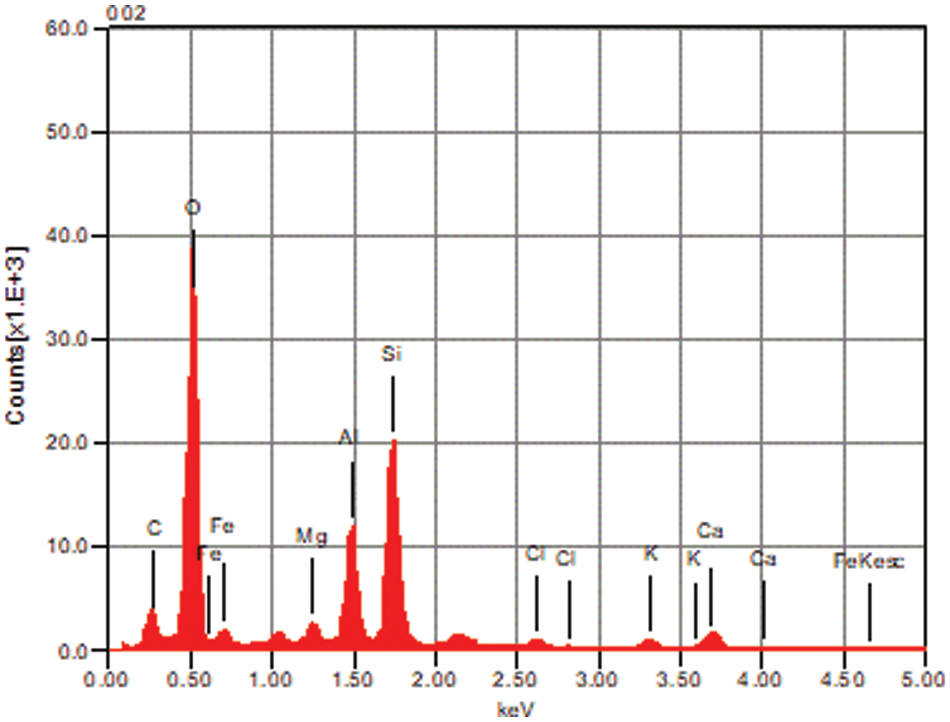
Figure 10: Average peak intensity of C, O, Si, Al, Fe, Mg, Ca, K, recorded on the (AD) sample
The main chemical elements (atoms) present in our samples are O (49%), Si (25%), Al (9.78%), Fe (8.11%), C (4.17%), Mg (1.59%), K (1.08%), Ca (1.05%), and Ti (0.67%). The proportion of these elements is similar in the two samples. Therefore, the chemical composition of seems to not strongly influence the optical losses caused by dust accumulation on the front glass of PV panels [35,36]. Dust size distribution is a major factor that controls the optical properties and then the performances of soiled solar panels.
4.5 Size Distribution of the Studied Dust
The morphology of the dust samples displayed in Fig. 7 illustrates the difference in shape and size of the particles in the two samples. Considering that in our investigation the attention is given to the particle’s sizes lower that 100 μm, as investigated by several authors [37]. The properties of dust in the atmosphere, including particle size distribution, shape, and chemical composition, can vary considerably from one location to another. The composition of dust in the air can be expected to be strongly related to the composition of dust on the ground in the local area.
On the other hand, light transmission losses caused by dust accumulated on the glass surfaces of solar panels, are strongly influenced by the particle size distribution with significantly increased losses per accumulated dust mass for smaller particles [38]. Fig. 11 provides information on the mass of particles in each sample according to the size of the dust.
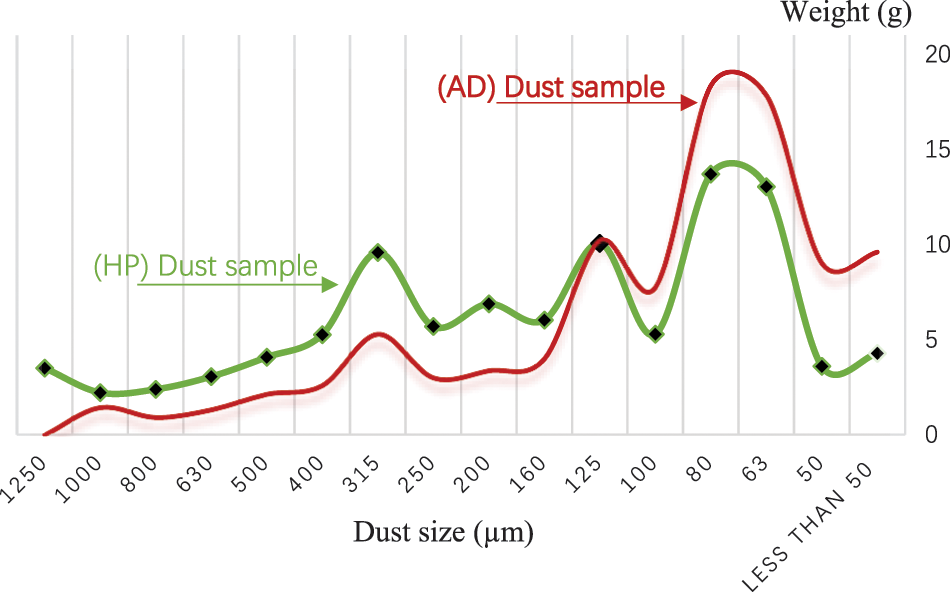
Figure 11: Weight percentage of particles in each sample according to the size
Here we notice that the Halieutic-Park (HP) sample contains heavier particles than the Adrar (AD) sample. This observation confirms the optical results reported previously. The density of dust in a sample of 100 g, which size is ranging between 0 and 100 μm in the Adrar area, is higher than that of a sample of the same mass from the Halieutic-Park area. Small particles are expected to block more light with less space, and therefore contribute more to the drop of the PV performance [39].
4.6 Influence of Soiling on Solar Panel SX330J Performances
The drop in power output caused by the accumulation of dust on the photovoltaic module surface is a big issue as reported by several authors [40,41]. Figs. 12–15 show the evolution of the maximum power recorded on a PV module soiled at various dust densities: 5, 10, 15, and 20 g/m².
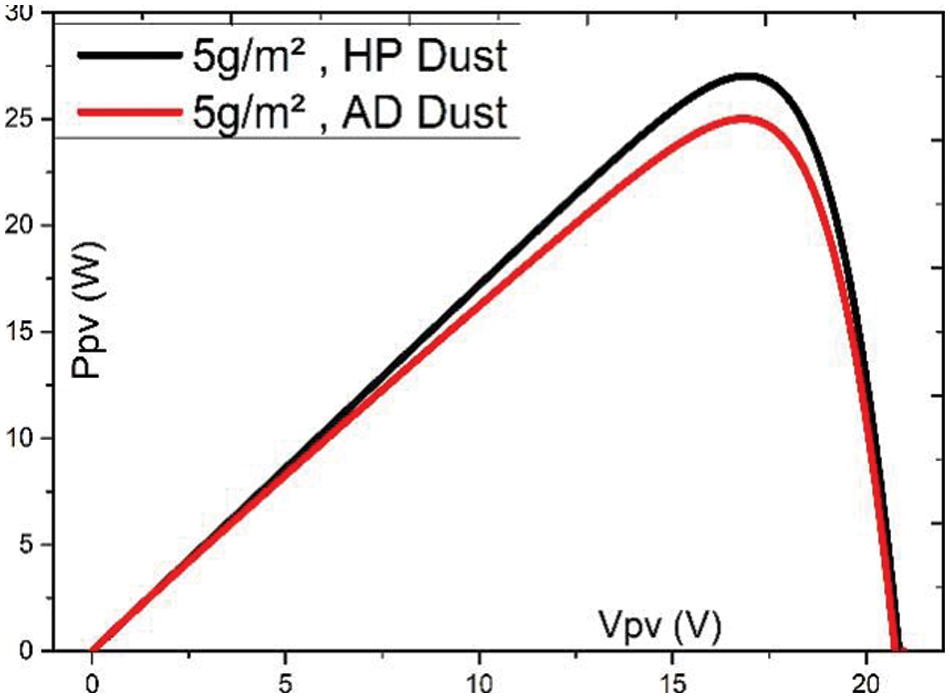
Figure 12: Effect of 5 g/m² of dust on Ppv
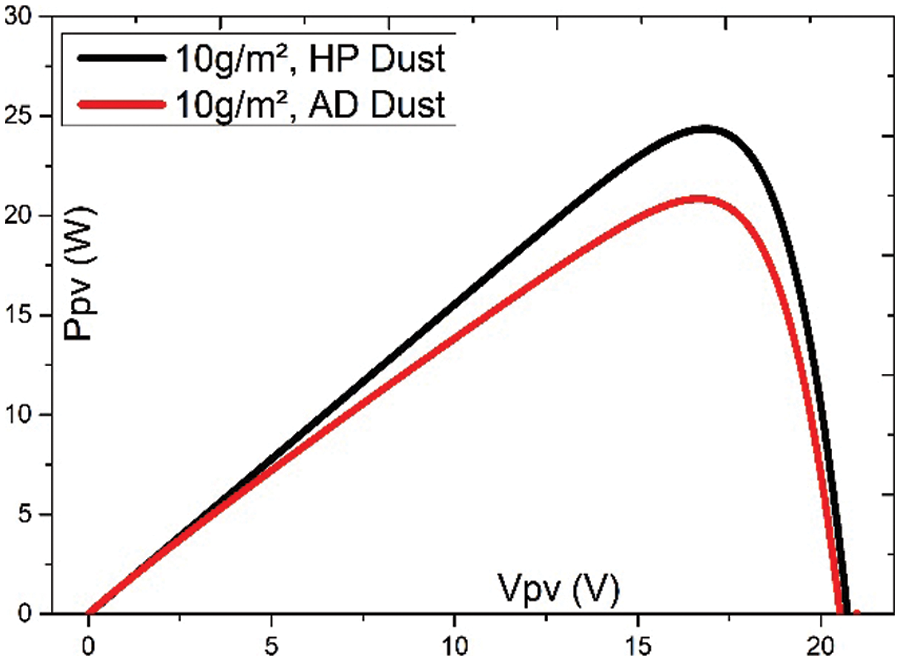
Figure 13: Effect of 10 g/m² of dust on Ppv
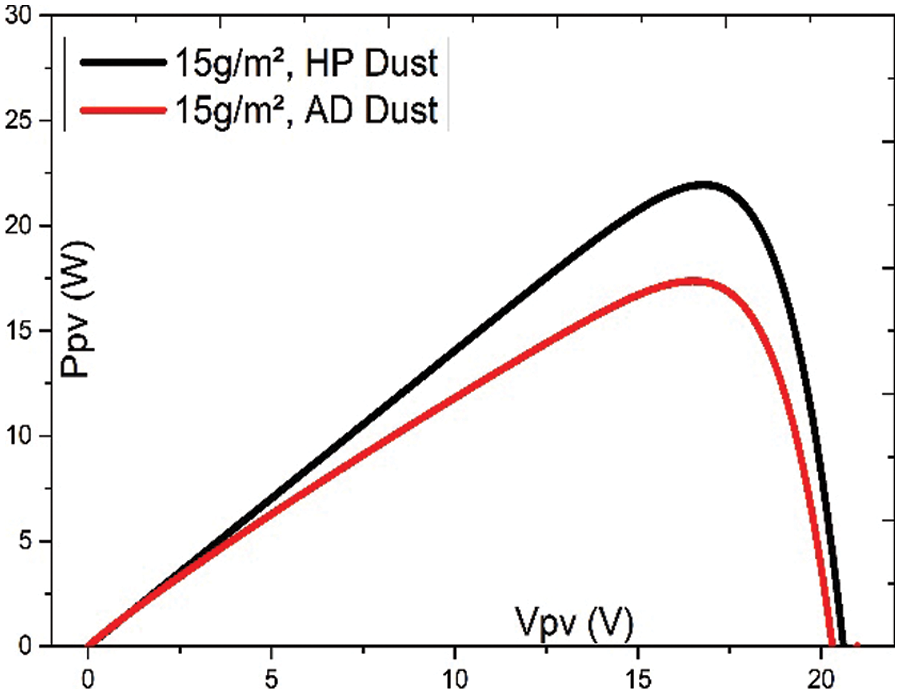
Figure 14: Effect of 5 g/m² of dust on Ppv
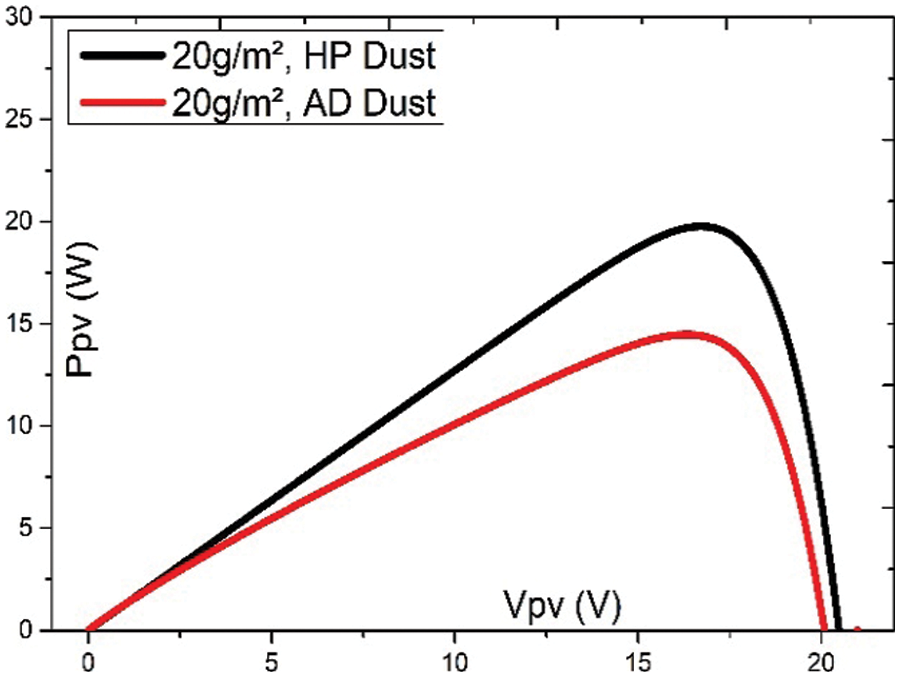
Figure 15: Effect of 10 g/m² of dust on Ppv
Fig. 16 presents the maximum power of the PV panel SX330J with the dust weight of (AD) and (HP) site.
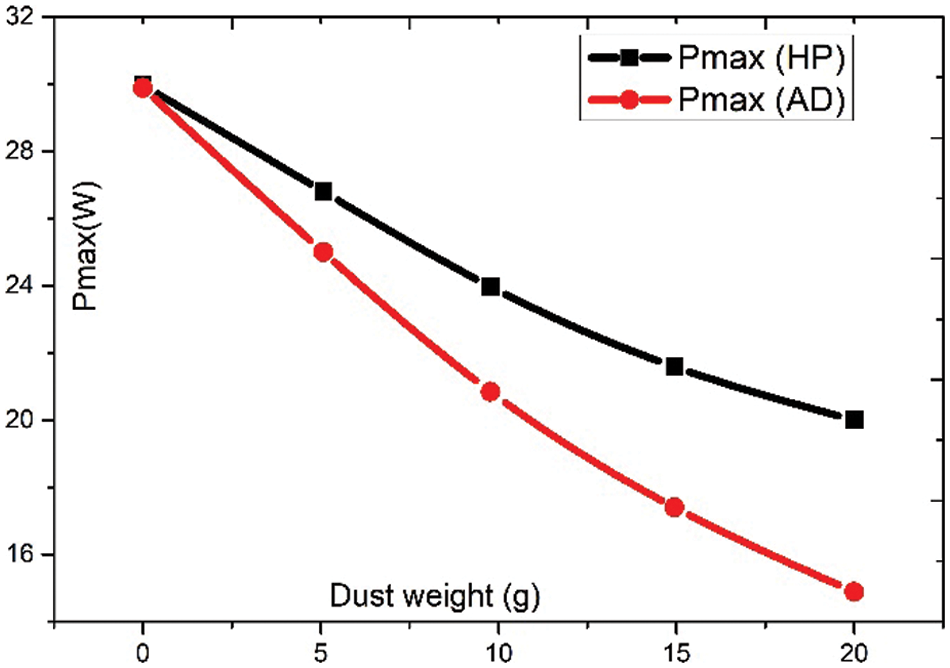
Figure 16: Maximum power (Pmax) vs. dust weight
The salient feature of our investigations is a clear decline in the maximum power output. Pmax decreases non-linearly with dust density. Our results are in good agreement with several works published by other authors [42–44]. The maximum power Pmax of our solar panel drops off from 30 W to only 20 W when the dust density is around 20 g/m² in the case of (HP) dust, and as weak as 14 W in the case of the AD dust. The observed behavior is correlated to the difference in dust distribution. Indeed, the size and distribution of the dust have a major effect on the degradation of PV performance, as small particles tend to block more sunlight radiation, with less space, and therefore contribute more to the deterioration of PV performance [30]. This can be explained by the fact that smaller particles are more uniformly distributed than larger particles [31], resulting in greater light scattering, especially at low intensities [32]. The huge loss (more than 50% in our case) of the generated PV power is a key factor of uncertainty and risk for solar production. As reported by several authors, less than 10% loss is the threshold for the need for cleaning. Such operation is inescapable for the recovery of the power [45,46].
Fig. 17 shows the variation of the conversion efficiency (η) of our PV module with the dust density for each study site.
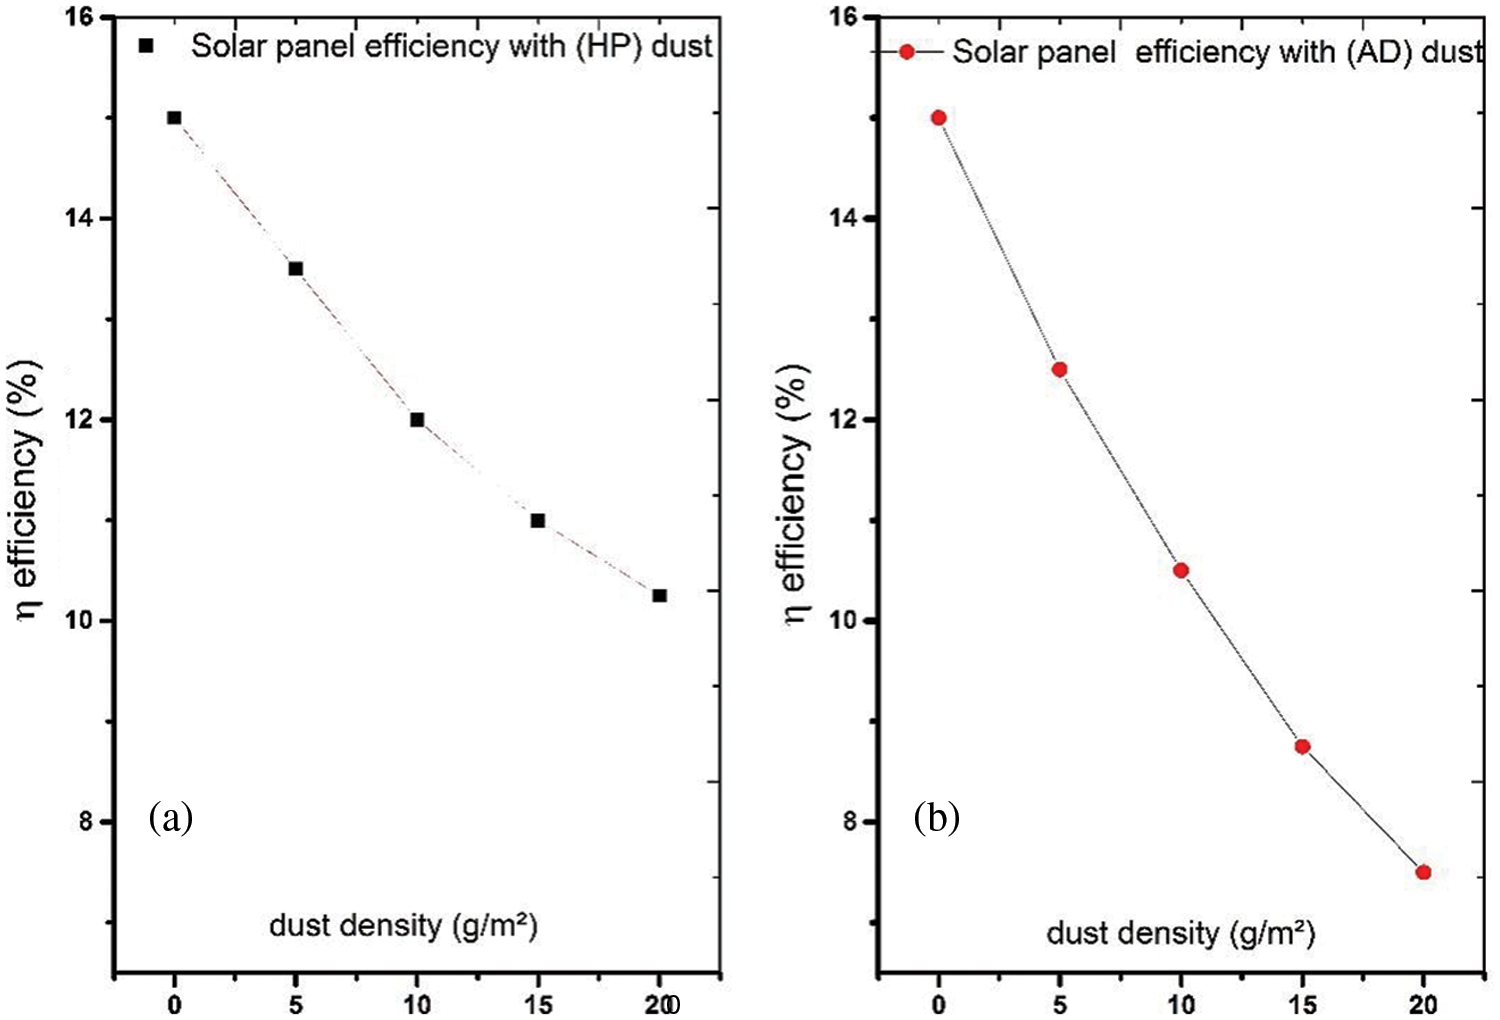
Figure 17: Variation of the solar panel efficiency with dust weight. (a) (HP) dust, (b) (AD) dust
An important drop off efficiency is recorded upon soiling depending on the density of dust. Our results are in good agreement with other reported works [47–51]. The efficiency η decreases from 15.20% to 10.11% non-linearly for dust accumulation in (HP) site while in the case of the dust of (HD) site, the efficiency decreases from 15.20% to 7.52%. In this later case, the efficiency was found to vary exponentially. Similar results [52] were reported for values of the dust density higher than 1.5 g/m².
This study deals with the influence of soiling on a PV panel. The experiments were conducted in the region of Agadir-Morocco. Dust from two sites was collected and used to assess its influence on the performances of a PV panel. It has been shown that soiling drastically affects the output of the PV panel. A drastic drop in the maximum power (Pmax) was measured upon covering the PV panel with dust depending on the nature of the dust. Pmax decreases from 30 to 20 W for the (HP) site, and no more than 14 W for the (AD) site. The difference in this behavior was explained by the difference in the size of particles collected from each area. The transmission of light across the front glass of the PV panel is more affected when the size of particles is smaller. Our findings are in good agreement with the theoretical studies published in the literature.
Funding Statement: The authors declare that they have no funding statement.
Conflicts of Interest: The authors declare that they have no conflicts of interest to report regarding the present study.
References
1. Ghezloun, A., Saidane, A., Merabet, H. (2017). The COP 22 New commitments in support of the Paris Agreement. Energy Procedia, 119, 10–16. [Google Scholar]
2. Laouina, A. (2019). Research note–The coastline in the Development of Morocco and its Atlantic Policy. Norois, 252, 41–54. DOI 10.4000/norois.9351. [Google Scholar] [CrossRef]
3. Markvart, T., Castañer, L. (2018). Principles of solar cell operation. In: McEvoy’s handbook of photovoltaics, 3rd edition. USA: Academic Press. DOI 10.1016/B978-0-12-809921-6.00001-X. [Google Scholar] [CrossRef]
4. Li, Z., Ma, T. (2022). Theoretic efficiency limit and design criteria of solar photovoltaics with high visual perceptibility. Applied Energy, 324, 119761. DOI 10.1016/j.apenergy.2022.119761. [Google Scholar] [CrossRef]
5. Akinoglu, B. G., Tuncel, B., Badescu, V. (2021). Beyond 3rd generation solar cells and the full spectrum project. Recent advances and new emerging solar cells. Sustainable Energy Technologies and Assessments, 46, 101287. [Google Scholar]
6. Maghami, M. R., Hizam, H., Gomes, C., Radzi, M. A., Rezadad, M. I. et al. (2016). Power loss due to soiling on solar panel: A review. Renewable and Sustainable Energy Reviews, 59, 1307–1316. DOI 10.1016/j.rser.2016.01.044. [Google Scholar] [CrossRef]
7. Klugmann-Radziemska, E. (2015). Degradation of electrical performance of a crystalline photovoltaic module due to dust deposition in Northern Poland. Renewable Energy, 78, 418–426. DOI 10.1016/j.renene.2015.01.018. [Google Scholar] [CrossRef]
8. Sulaiman, S. A., Singh, A. K., Mokhtar, M. M. M., Bou-Rabee, M. A. (2014). Influence of dirt accumulation on performance of PV panels. Energy Procedia, 50, 50–56. DOI 10.1016/j.egypro.2014.06.006. [Google Scholar] [CrossRef]
9. Laarabi, B., El Baqqal, Y., Dahrouch, A., Barhdadi, A. (2020). Deep analysis of soiling effect on glass transmittance of PV modules in seven sites in Morocco. Energy, 213, 118811. DOI 10.1016/j.energy.2020.118811. [Google Scholar] [CrossRef]
10. Bouaddi, S., Ihlal, A., Fernández-García, A. (2017). Comparative analysis of soiling of CSP mirror materials in arid zones. Renewable Energy, 101, 437–449. DOI 10.1016/j.renene.2016.08.067. [Google Scholar] [CrossRef]
11. Adıgüzel, E. E. Ö., Akgündoğdu, A., Ersoy Yılmaz, A. (2019). Prediction of dust particle size effect on efficiency of photovoltaic modules with ANFIS: An experimental study in Aegean region, Turkey. Solar Energy, 177, 690–702. DOI 10.1016/j.solener.2018.12.012. [Google Scholar] [CrossRef]
12. Dehghan, M., Rashidi, S., Waqas, A. (2022). Modeling of soiling losses in solar energy systems. Sustainable Energy Technologies and Assessments, 53, 102435. DOI 10.1016/j.seta.2022.102435. [Google Scholar] [CrossRef]
13. Tahereh. Z, Morteza. A. (2016). Optical and thermal modeling of a tilted photovoltaic module with sand particles settled on its front surface. Energy, 95, 51–66. [Google Scholar]
14. Yazdani, H., Yaghoubi, M. (2022). Dust deposition effect on photovoltaic modules performance and optimization of cleaning period: A combined experimental–numerical study. Sustainable Energy Technologies and Assessments, 51, 101946. DOI 10.1016/j.seta.2021.101946. [Google Scholar] [CrossRef]
15. CES-MED (2012). Morocco municipality of agadir sustainable energy action plan. Agadir-Morocco: The European Union. [Google Scholar]
16. Picotti, G., Borghesani, P., Cholette, M., Manzolini, G. (2018). Soiling of solar collectors–modelling approaches for airborne dust and its interactions with surfaces. Renewable and Sustainable Energy Reviews, 81, 2343–2357. DOI 10.1016/j.rser.2017.06.043. [Google Scholar] [CrossRef]
17. JASCO Performance Innovation Reliability. Spectrophotometers (2017). V-730 series. https://www.jasco.de/uploads/files/Brochure-Jasco-V-700-Series-LQ.pdf. [Google Scholar]
18. Nichols, D. (2017). Arduino-based data acquisition into excel, LabVIEW, and MATLAB. The Physics Teacher, 55(4), 226–227. DOI 10.1119/1.4978720. [Google Scholar] [CrossRef]
19. Asbayou, A., Agdam, M., Aamoume, A., Soussi, A., Ihlal, A. et al. (2021). Utilization of MOSFET transistor as an electronic load to trace I-V and P-V curve of a solar panel. E3S Web of Conferences, vol. 229, 01021. Agadir, Morocco. [Google Scholar]
20. Abouabassi, K., Ouafi, M., Ait Hssi, A., Atourki, L., Kirou, H. et al. (2022). Investigation on electrochemical deposition of Sb2Se3 thin films in aqueous acidic medium. Thin Solid Films, 758, 139452. DOI 10.1016/j.tsf.2022.139452. [Google Scholar] [CrossRef]
21. Handheld Digital Multimeter GDM-360 (2022). https://www.gwinstek.com/en-global/products/downloadSeriesDownNew/9914/718. [Google Scholar]
22. Asbayou, A., Aamoume, A., Elyaqouti, M., Ihlal, A., Bouhouch, L. (2022). Benchmarking study between capacitive and electronic load technic to track I-V and P-V of a solar panel. International Journal of Electrical and Computer Engineering (IJECE), 12(1), 102–113. DOI 10.11591/ijece.v12i1.pp102-113. [Google Scholar] [CrossRef]
23. Jalaly, S., Vahdani, M., Shahabadi, M., Mohamad Sadeghi, G. M. (2019). Design, fabrication, and measurement of a polymer-based anti-reflection coating for improved performance of a solar panel under a specific incident angle. Solar Energy Materials and Solar Cells, 189, 175–180. DOI 10.1016/j.solmat.2018.10.001. [Google Scholar] [CrossRef]
24. Miller, D. C., David, C., Bengoechea, J., Bokria, J. G., Köhl, M. et al. (2013). Examination of an optical transmittance test for photovoltaic encapsulation materials. In: Reliability of photovoltaic cells, modules, components, and systems VI, vol. 8825, pp. 68–79. SPIE, San Diego, California, USA. DOI 10.1117/12.2024372. [Google Scholar] [CrossRef]
25. Mambrini, T. (2014). Characterization of solar photovoltaic panels in real implementation conditions and according to different technologies (Ph.D. Thesis), pp. 63–66. Université Paris Sud-ParisXI. [Google Scholar]
26. Watteeuw, R., Janvier (1964). The soils of the souss massa plain and their schematic distribution (Ph.D. Thesis), pp. 141–185. Handbiblio, ISRIC Library. [Google Scholar]
27. Durafour, M. (2014). Sediment dynamics in coastal areas in the case of heterogeneous sediments: Application to the coastal area of Haute-Normandie (Ph.D. Thesis), pp. 120–125. Université du Havre, Paris. [Google Scholar]
28. El Ghannouchi, A. (2007). Wind dynamics in the souss-massa plain: Modelling approach to the fight against silting (Ph.D. Thesis). Mohammed V Agdal-Faculté des Sciences. [Google Scholar]
29. Mélanie, N. (2015). Classification of rocks according to their particle size (Ph.D. Thesis). Grenoble. [Google Scholar]
30. Tanesab, J., Parlevliet, D., Whale, J., Urmee, T., Pryor, T. (2015). The contribution of dust to performance degradation of PV modules in a temperate climate zone. Solar Energy, 120, 147–157. DOI 10.1016/j.solener.2015.06.052. [Google Scholar] [CrossRef]
31. Hassan Qasem, R. G., Betts, T. R., Müllejans, H., AlBusairi, H. (2012). Dust-induced shading on photovoltaic modules. Progress in Photovoltaics Research and Applications, 22(2), 218–226. DOI 10.1002/pip.2230. [Google Scholar] [CrossRef]
32. Sayyah, A., Horenstein, M. N., Mazumder, M. K. (2014). Energy yield loss caused by dust deposition on photovoltaic panels. Solar Energy, 107, 576–604. DOI 10.1016/j.solener.2014.05.030. [Google Scholar] [CrossRef]
33. Elminir, H. K., Ghitas, A. E., Hamid, R. H., El-Hussainy, F., Beheary, M. M. et al. (2006). Effect of dust on the transparent cover of solar collectors. Energy Conversion and Management, 47(18–19), 3192–3203. DOI 10.1016/j.enconman.2006.02.014. [Google Scholar] [CrossRef]
34. Durand, A., Robert, C., Andre, J. M., Bouchard, D., Bort, R. et al. (2018). Inventory of atmospheric pollutant emissions in France under the convention on long-distance transfrontier atmospheric pollution and the European directive on national emissions abatement of some atmospheric pollutants, vol. 51, no. 28, 51070062. INIS Liaison Officer for France. [Google Scholar]
35. Piedra, P., Moosmüller, H. (2017). Optical losses of photovoltaic cells due to aerosol deposition: Role of particle refractive index and size. Solar Energy, 155, 637–646. DOI 10.1016/j.solener.2017.06.047. [Google Scholar] [CrossRef]
36. Sarver, T., Al-Qaraghuli, A., Kazmerski, L. L. (2013). A comprehensive review of the impact of dust on the use of solar energy: History, investigations, results, literature, and mitigation approaches. Renewable and Sustainable Energy Reviews, 22, 698–733. DOI 10.1016/j.rser.2012.12.065. [Google Scholar] [CrossRef]
37. Drame, M. R. M., Jenkins, G., Camara, M. (2010). Observations and simulation of a Saharan Air layer event with a mid-tropospheric dust layer at Dakar, Senegal 6–7, July 2010. Journal of Geophysical Research, 116, 1–24. [Google Scholar]
38. Said, S. A. M., Hassan, G., Walwil, H. M., Al-Aqeeli, N. (2018). The effect of environmental factors and dust accumulation on photovoltaic modules and dust-accumulation mitigation strategies. Renewable and Sustainable Energy Reviews, 82, 743–760. DOI 10.1016/j.rser.2017.09.042. [Google Scholar] [CrossRef]
39. Darwish, Z. A., Sopian, K., Fudholi, A. (2021). Reduced output of photovoltaic modules due to different types of dust particles. Journal of CleanerProduction, 280, 124317. DOI 10.1016/j.jclepro.2020.124317. [Google Scholar] [CrossRef]
40. Gholami, A., Ameri, M., Zandi, M., Ghoachani, R. G., Eslami, S. et al. (2020). Photovoltaic potential assessment and dust impacts on photovoltaic systems in Iran. IEEE Journal of Photovoltaics, 10(3), 824–837. DOI 10.1109/JPHOTOV.5503869. [Google Scholar] [CrossRef]
41. Baras, A., Jones, R. K., Alqahtani, A., Alodan, M., Abdullah, K. (2016). Measured soiling loss and its economic impact for PV plants in central Saudi Arabia. Saudi Arabia Smart Grid (SASG), Jeddah, Saudi Arabia, IEEE. DOI 10.1109/SASG.2016.7849657. [Google Scholar] [CrossRef]
42. Aïssa, B., Isaifan, R. J., Madhavan, V. E., Abdallah, A. A. (2016). Structural and physical properties of the dust particles in Qatar and their influence on the PV panel performance. Scientific Repport, 6(1), 1–12. DOI 10.1038/srep31467. [Google Scholar] [CrossRef]
43. Lopez-Garcia, J., Pozza, A., Sample, T. (2016). Long-term soiling of silicon PV modules in a moderate subtropical climate. Solar Energy, 130, 174–183. DOI 10.1016/j.solener.2016.02.025. [Google Scholar] [CrossRef]
44. Seyedmahmoudian, M., Mekhilef, S., Rahmani, R., Yusof, R., Renani Rubiyah Yusof, E. et al. (2013). Analytical modeling of partially shaded photovoltaic systems. Energies, 6(1), 128–144. DOI 10.3390/en6010128. [Google Scholar] [CrossRef]
45. Pouladian-Kari, A., Eslami, S., Tadjik, A., Kirchner, L., Pouladian-Kari, R. et al. (2022). A novel solution for addressing the problem of soiling and improving performance of PV solar systems. Solar Energy, 241, 315–326. DOI 10.1016/j.solener.2022.06.012. [Google Scholar] [CrossRef]
46. Micheli, L., Fernández, E. F., Aguilera, J. T., Almonacid, F. (2021). Economics of seasonal photovoltaic soiling and cleaning optimization scenarios. Energy, 215, 119018. DOI 10.1016/j.energy.2020.119018. [Google Scholar] [CrossRef]
47. Hanifi, H., Khan, M. Z., Jaeckel, B., Hagendorf, C., Schneider, J. et al. (2020). Optimum PV module interconnection layout and mounting orientation to reduce inhomogeneous soiling losses in desert environments. Solar Energy, 203, 267–274. DOI 10.1016/j.solener.2020.04.025. [Google Scholar] [CrossRef]
48. Ullah, A., Imran, H., Maqsood, Z., Butt, N. Z. (2019). Investigation of optimal tilt angles and effects of soiling on PV energy production in Pakistan. Renewable Energy, 139, 830–843. DOI 10.1016/j.renene.2019.02.114. [Google Scholar] [CrossRef]
49. Chen, Y., Liu, Y., Tian, Z., Dong, Y., Zhou, Y. et al. (2019). Experimental study on the effect of dust deposition on photovoltaic panels. Energy Procedia, 158, 483–489. DOI 10.1016/j.egypro.2019.01.139. [Google Scholar] [CrossRef]
50. Dahlioui, D., Laarabi, B., Barhdadi, A. (2019). Investigation of soiling impact on PV modules performance in semi-arid and hyper-arid climates in Morocco. Energy for Sustainable Development, 51, 32–39. DOI 10.1016/j.esd.2019.05.001. [Google Scholar] [CrossRef]
51. Younis, A., Alhorr, Y. (2021). Modeling of dust soiling effects on solar photovoltaic performance: A review. Solar Energy, 220, 1074–1088. DOI 10.1016/j.solener.2021.04.011. [Google Scholar] [CrossRef]
52. Fan, S., Wang, X., Cao, S., Wang, Y., Zhang, Y. et al. (2022). A novel model to determine the relationship between dust concentration and energy conversion efficiency of photovoltaic (PV) panels. Energy, 252, 123927. DOI 10.1016/j.energy.2022.123927. [Google Scholar] [CrossRef]
Cite This Article
 Copyright © 2023 The Author(s). Published by Tech Science Press.
This work is licensed under a Creative Commons Attribution 4.0 International License , which permits unrestricted use, distribution, and reproduction in any medium, provided the original work is properly cited.
 Downloads
 Citation Tools