
 Submit a Paper
 Propose a Special lssue
 Open Access
ARTICLE

Experimental Mode and Vibration Comfort Analysis of High-Rise Glulam Building Floor Structure
College of Materials Science and Engineering, Nanjing Forestry University, Nanjing, 210037, China
* Corresponding Author: Zheng Wang. Email: .
(This article belongs to the Special Issue: Bio-Composite Materials and Structures-2021)
Journal of Renewable Materials 2023, 11(6), 2729-2743. https://doi.org/10.32604/jrm.2023.025867
Received 03 August 2022; Accepted 26 August 2022; Issue published 27 April 2023
 View Full Text
 Download PDF
Abstract
In order to better meet the objective requirements of the use safety of the high-rise glulam building floor structure and the living comfort of the residents, the transient excitation, environmental excitation and frequency spectrum identification methods were used to carry out experimental modal test in-site on the three rooms numbered A, B and C of the same glulam structural building. The three rooms have different functions, different floor sizes and different floor supporting structures. The research results have shown that the first-order bending frequency of the floor structure of Room A is 27.50 Hz, the transverse second-order bending frequency is 34.75 Hz, the longitudinal second-order bending frequency is 53.25 Hz, and the first-order torsional frequency is 56.25 Hz. The reinforced wooden beam at the bottom of the floor of Room A increases the transverse stiffness of the floor structure, but does not offset the anisotropy caused by the longitudinally installed glulam floors. The fundamental frequency values of the floor structures of the three rooms numbered A, B, and C are 27.5, 13 and 18 Hz, respectively. This has a relatively high innovation and reference significance for integrating the theory of structural dynamic characteristics with the dynamic testing technology, improving the design level of high-rise glulam structure buildings, and improving the living comfort of residents.Graphic Abstract
Keywords
Glulam structural building system is an important part of heavy timber structure systems [1–3]. Compared with traditional reinforced concrete and brick-concrete building structures, it has the advantages of low carbon, environmental protection, durability, sound insulation and thermal insulation performance [4,5]. Due to its excellent load-bearing capacity, glulam is very versatile in modern timber building systems and overcomes the limitation of the height of light timber structural buildings [6,7]. It can partially replace traditional reinforced concrete and brick-concrete structures, and can also be mixed with reinforced concrete [8–11].
With the improvement of living standards for residents, more and more people have put forward higher requirements for the comfort of building vibration, sound insulation and sound absorption. High-rise timber structural buildings (usually ≥24 m), especially with the increasing number of floors, will face greater challenges in terms of floor vibration and comfort level [12,13]. The impact of vibration on the human body mainly includes vibration frequency, vibration intensity (acceleration), vibration exposure time and environmental conditions, among which vibration frequency plays a major role. Accurately obtaining the vibration frequency of the building can grasp the resonance of the building and evaluate the comfort of the occupants, which is conducive to improving the design and craftsmanship. Different frequencies of vibration cause different feelings and lesions. If the vibration frequency is within the resonance frequency range of human organs, it will cause discomfort to the human body. Many researches used probabilistic methods to study the mechanical properties of materials [14–17]. For timber structural buildings, the floor is the only main structural system that has constant physical contact with the occupants. For high floors of timber structure buildings, environmental vibrations such as wind-induced vibrations have a strong impact, and the floors are prone to resonate with wind vibrations and human organs, resulting in potential safety hazards and comfort problems. This phenomenon makes it important to study the dynamic characteristics of floors in high-rise timber structures. The glulam floor is a timber structure floor supported by glulam beams and columns. Typically, floor vibration is mainly caused by continuous vibration and transient vibration [18]. The constant vibration of the floor is caused by repetitive human activity. When the periodic load is coupled with its natural frequency of the structure, it will cause the resonance phenomenon of the structure [19,20]. The instantaneous vibration of a floor structure is caused by non-sustained loads, such as a person walking or a falling body, which attenuates in proportion to the inherent damping properties of the structural system [21]. Therefore, the control of floor vibration is related to the overall applicability of the building.
The vibration characteristics of the timber structural building floor structure are affected by its stiffness, mass, damping and two-way motion of the floor [22,23]. However, due to the development trend of building construction to better utilize functional materials and reduce weight more often, the overall mass of the building is smaller and the flexibility is greater, making the question of suitability for floor vibrations increasingly important. In general, although the wooden floor structure system meets the traditional standard of deflection under uniform load, the inherent static stiffness value of the wooden floor structure is sufficient to obtain its satisfactory vibration performance. However, when it is subjected to shock and vibration, it is easy to produce a significant structural dynamic response due to the excitation of external dynamic loads such as human activities [24,25]. Wang carried out the disturbance test under concentrated load and the dynamic test under various excitations on the light wood structure floor. The results showed that the maximum deflection value was 0.620–1.256 mm, which met the standard requirements. The maximum value of the dynamic acceleration peak is 407.2 mm/s2, which also meets the comfort standards of the Standards Council of Canada [26]. Although this kind of dynamic response is not enough to endanger the safety of building structures, it often brings discomfort to people, easily affects the quality of the working environment, and reduces work efficiency [27,28]. In 2011, Xiong [29] conducted field tests on timber floors in three wood-framed buildings in order to obtain their dynamic characteristics and evaluate the vibration comfort. The results showed that the fundamental vibration period of the thirteen tested timber floors was between 9.96 and 18.70 Hz, which is sufficiently outside the frequency range of human activities excitation. In 2020, Ding et al. [30] used the environmental excitation method and impact excitation method to test six measuring points of the flooring in a two-story residential light-wood structure. Research showed that the fundamental frequencies of the building structure obtained through the calculation mode and the test mode were consistent, and both were higher than 4.5 Hz.
In order to better meet the objective requirements of the use safety of the high-rise glulam building floor structure and the living comfort of the residents, the transient excitation, environmental excitation and frequency spectrum identification methods were used to carry out experimental modal test in-site on the three rooms numbered A, B and C of the same glulam structural building. Then the dynamic characteristics and overall vibration comfort of the glulam timber structure floor were evaluated. At the same time, reasonable use and vibration reduction measures and methods were proposed.
In this study, the dynamic characteristics of the floor structures of Rooms A, B, and C of the prefabricated glulam structures in the R&D Center of Shandong Dingchi Wood Industry Group were studied. The building is located in the windy coastal city of Penglai, Shandong Province, China. It is a 4–6 storey mixed structure with a total construction area of 4778.5 m2, a length of 66.9 m, a width of 17.4 m and a maximum height of 23.55 m. It approximately satisfies the definition of a high-rise timber structural building. The building on site is shown in Fig. 1. Rooms A, B, and C are the smoking room, rehearsal room, and conference room on the fourth floor of the building, with different functions and sizes. The main research objects are shown in Table 1. In addition, the supporting structures of the floors of the three rooms are different. The selection of these three specific floors for research covers the main structural forms of the wooden structure building, and is also representative of the most safety-requiring rooms.
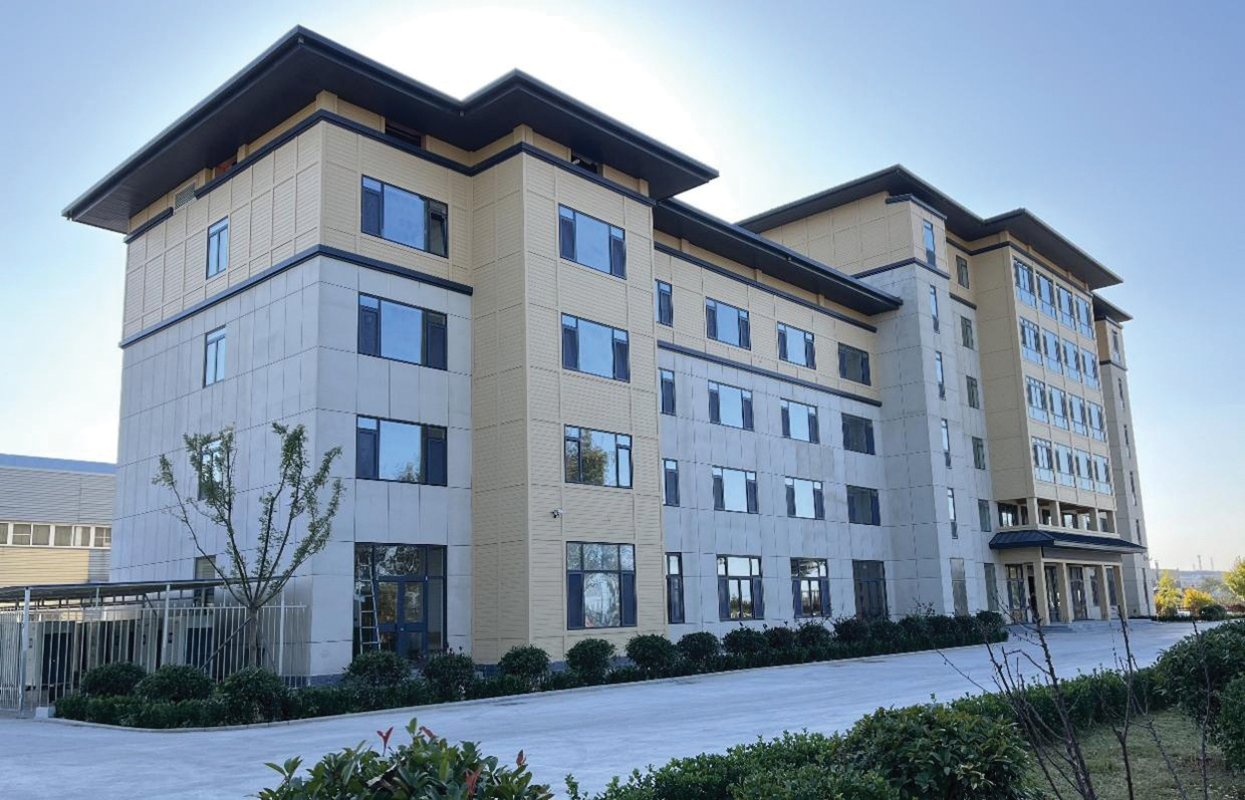
Figure 1: R&D Center of Shandong Dingchi Wood Industry Group
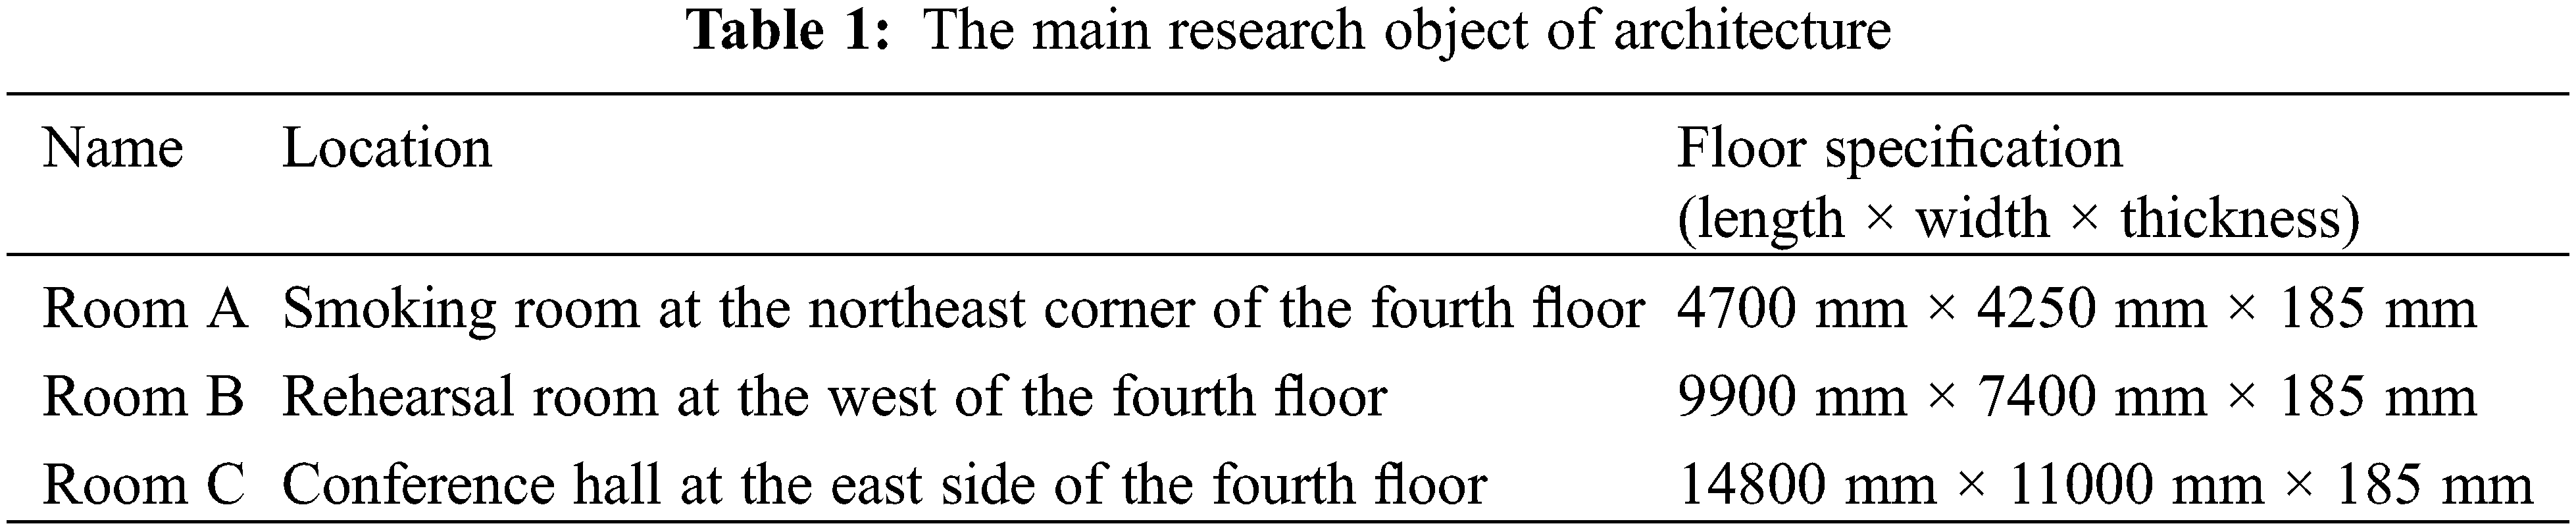
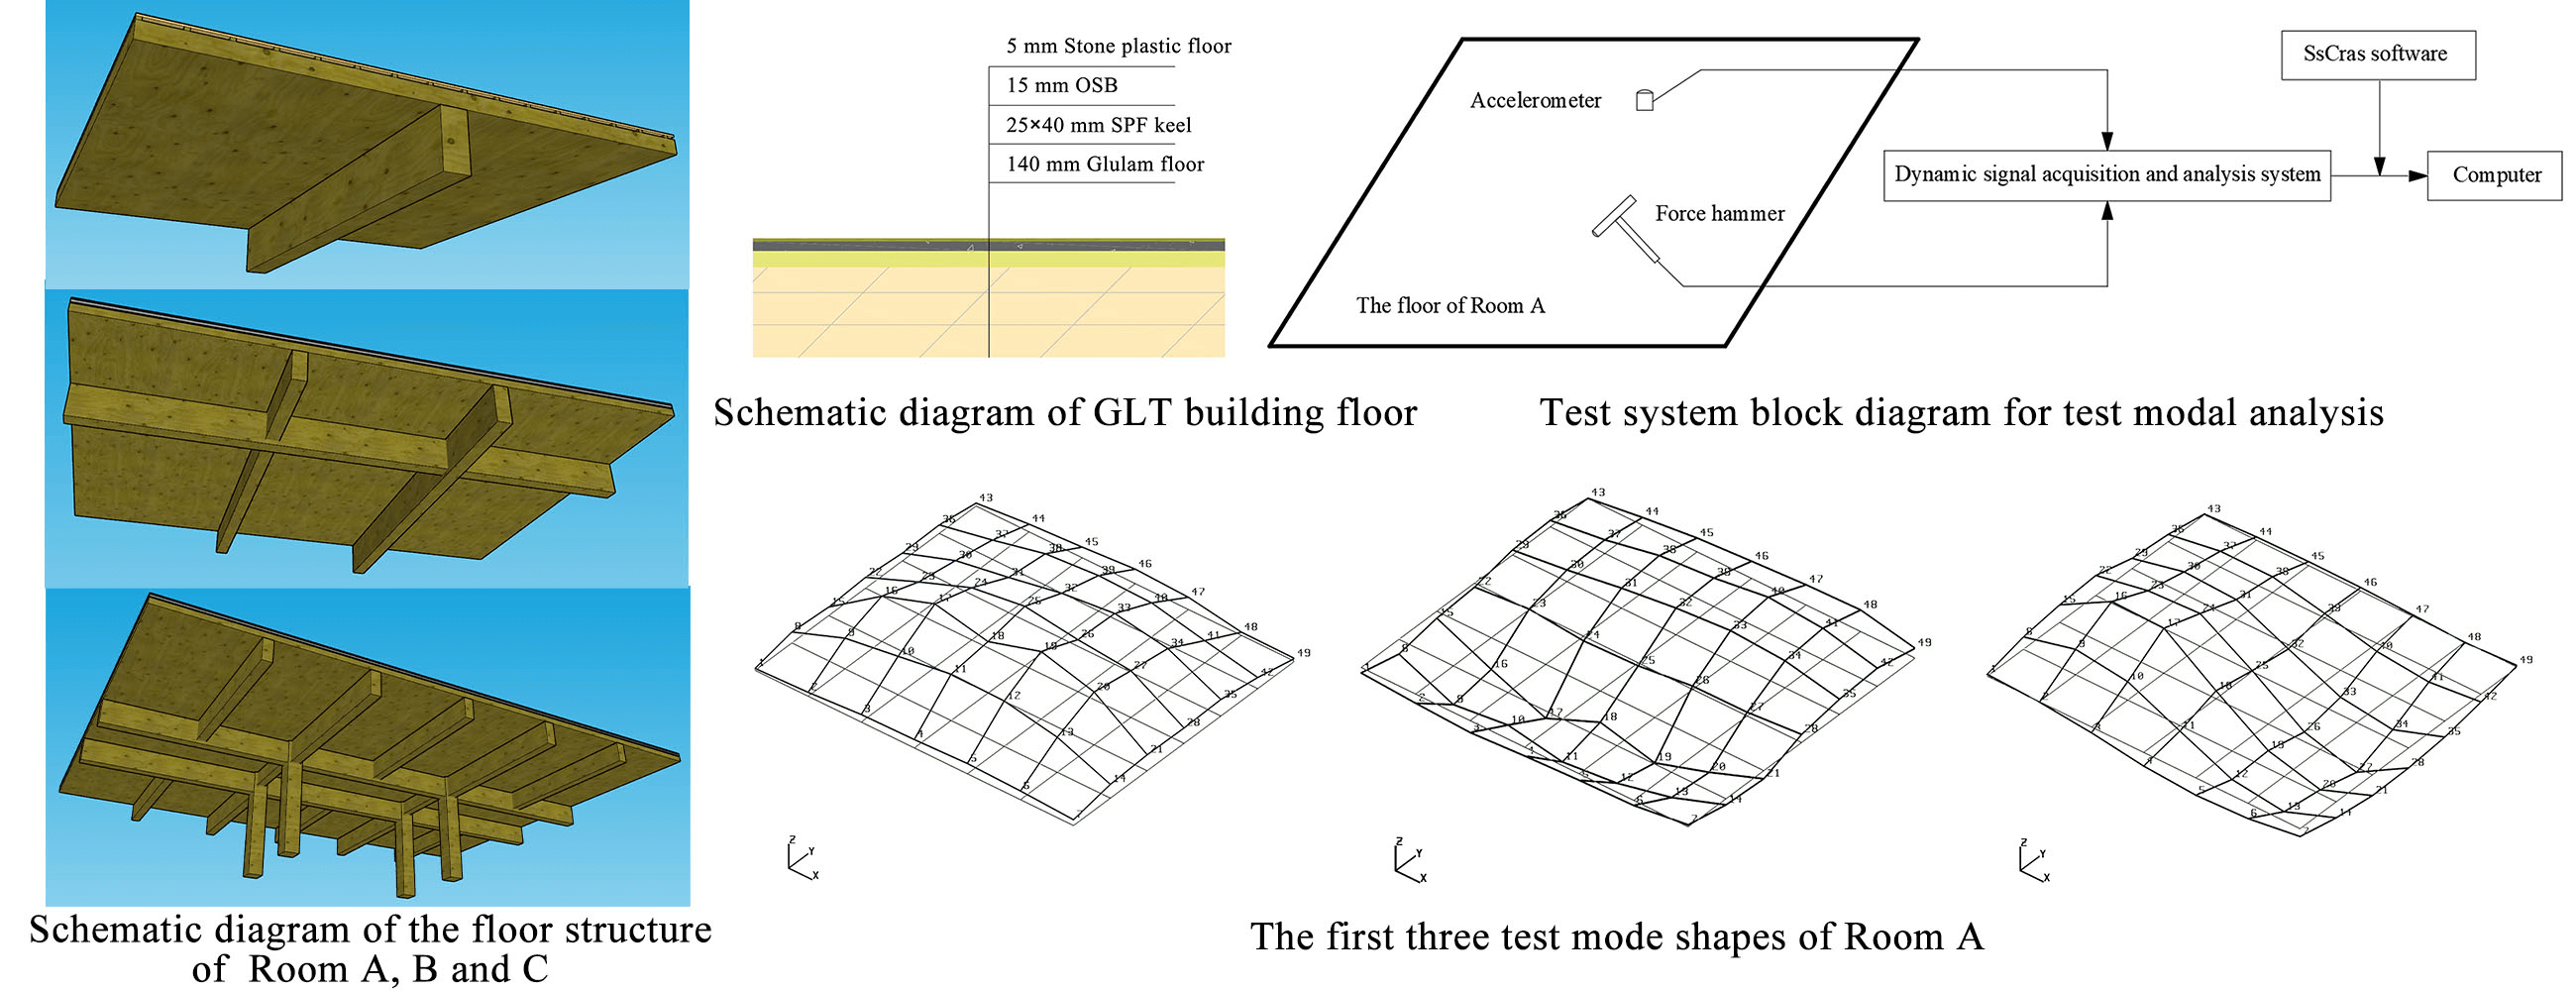
In Table 1, Rooms A, B, and C have the same main floor structure as other rooms in the building, and the difference is the number and location of the reinforced wooden beams under the floor. The schematic diagram of the floor of Rooms A, B, and C is shown in Fig. 2. The schematic diagrams of the three floors are shown in Fig. 3.
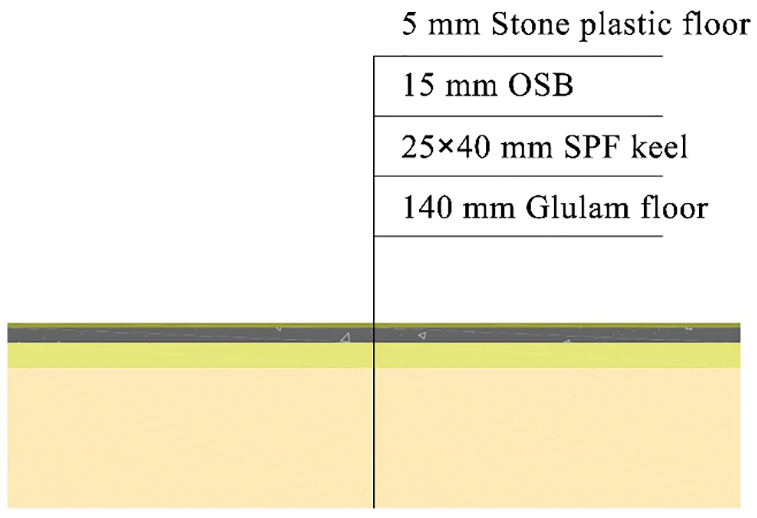
Figure 2: Schematic diagram of GLT building floor
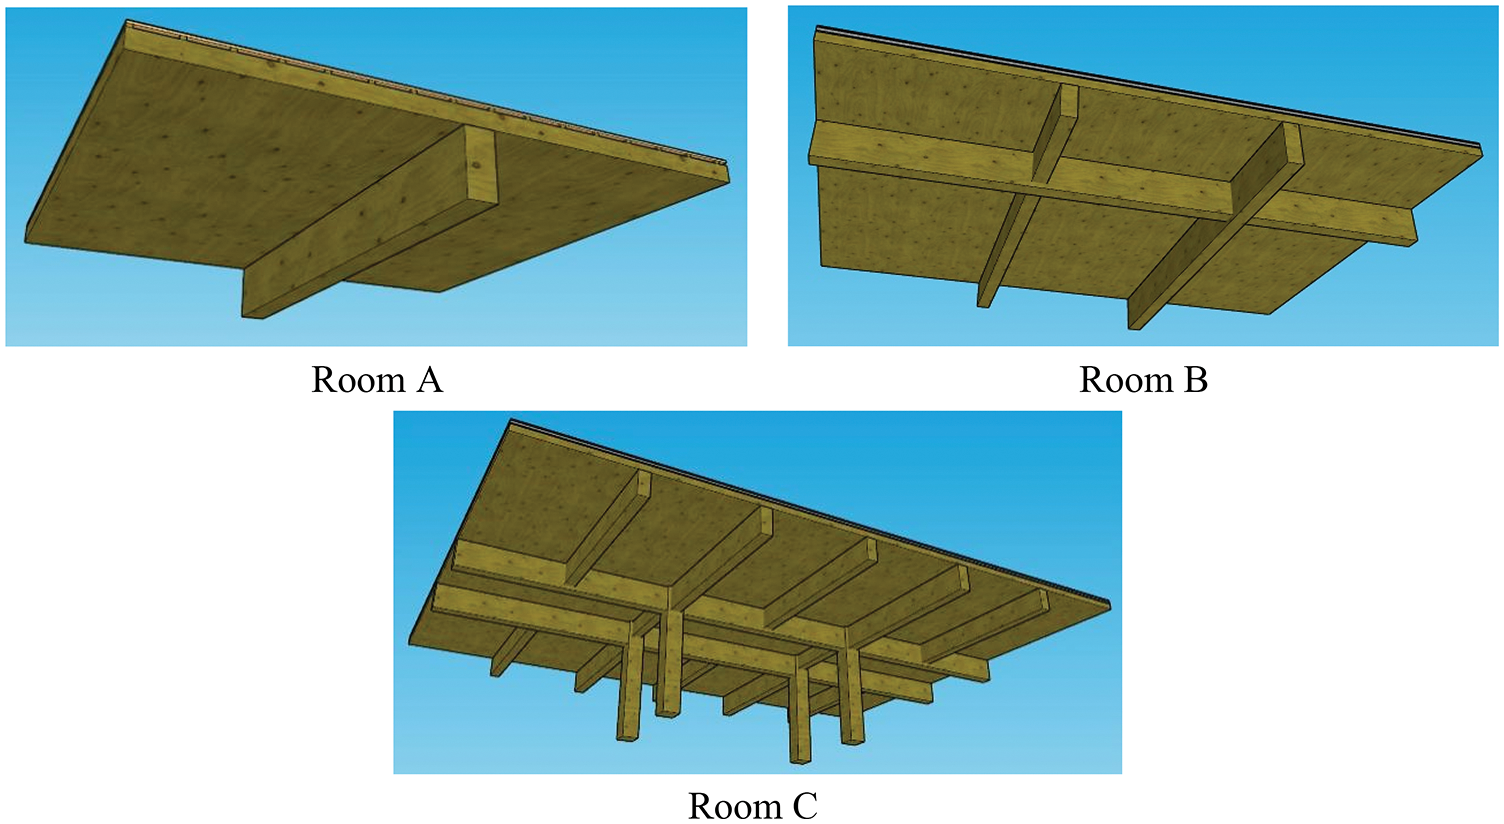
Figure 3: Schematic diagram of the floor structure of three rooms
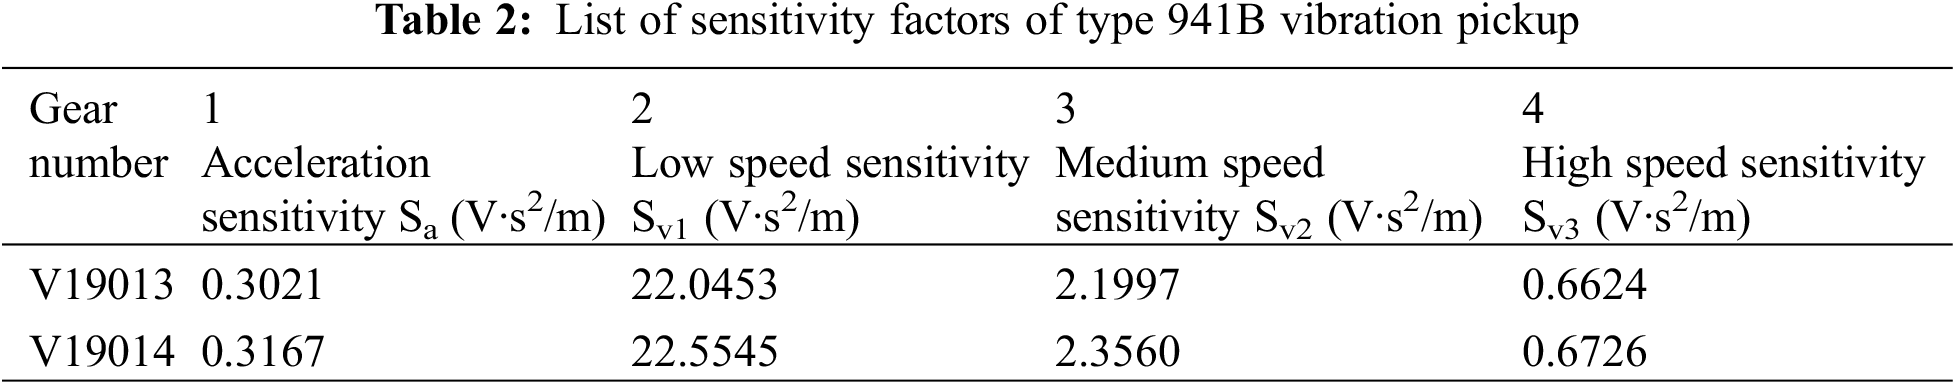
One set of CRAS vibration and dynamic signal acquisition and analysis system was used, mainly including: one set of AZ408 vibration signal acquisition box, modal analysis software MaCras and signal and system analysis software SsCras, manufactured by Nanjing Anzheng Software Engineering Co., Ltd. (China). One CA-YD-109B accelerometer was used, with a sensitivity of 2.683 PC/m·s2 and a measurement range of 0–20,000 Hz, manufactured by Jiangsu Lianneng Electronic Technology Co., Ltd. (China). Two 941B vibration pickups were used, with a size of 63 mm × 63 mm × 80 mm and a mass of 1 kg, manufactured by the Institute of Engineering Mechanics, China Earthquake Administration (China). Its sensitivity parameters are shown in Table 2. One set of JF-LC-1003 force hammer was used, with a sensitivity of 2.07 mV/kN and a measurement range of 0–30 kN, manufactured by Yangzhou Jufeng Technology Co., Ltd. (China).
3 Test Principle and Main Test Steps
The modes are the natural vibration characteristics of machinery and structures, and each mode has a specific natural frequency, damping ratio, and mode shape. The experimental modal analysis is to obtain the modal parameters of the structure through parameter identification through the input and output signals of the test acquisition system. The modal test of the floor structure of Room A adopts the fixed response of the accelerometer and the excitation of the moving force sensor. After meshing, initial parameters estimation, curve fitting, measurement direction processing, constraint equation processing, mode shape normalization and mode shape fitting, the mode shapes and modal parameters of the overall floor structure are obtained [31].
3.2.1 Modal Test of the Floor of Room A
First, the connection between the dynamic signal conditioning box and the acquisition box of the test system (ch1 is the force channel, ch2 is the accelerometer channel) and the glulam floor structure is completed. According to the actual mode shape requirements, the appropriate grid number division is selected to meet the requirements of clearly showing the first-order bending, second-order bending and first-order torsion of the floor. The floor is divided into 6 × 7 grids (600 mm × 700 mm), and the number of measurement nodes is 49, as shown in Fig. 4. The block diagram of this modal test system is shown in Fig. 5.
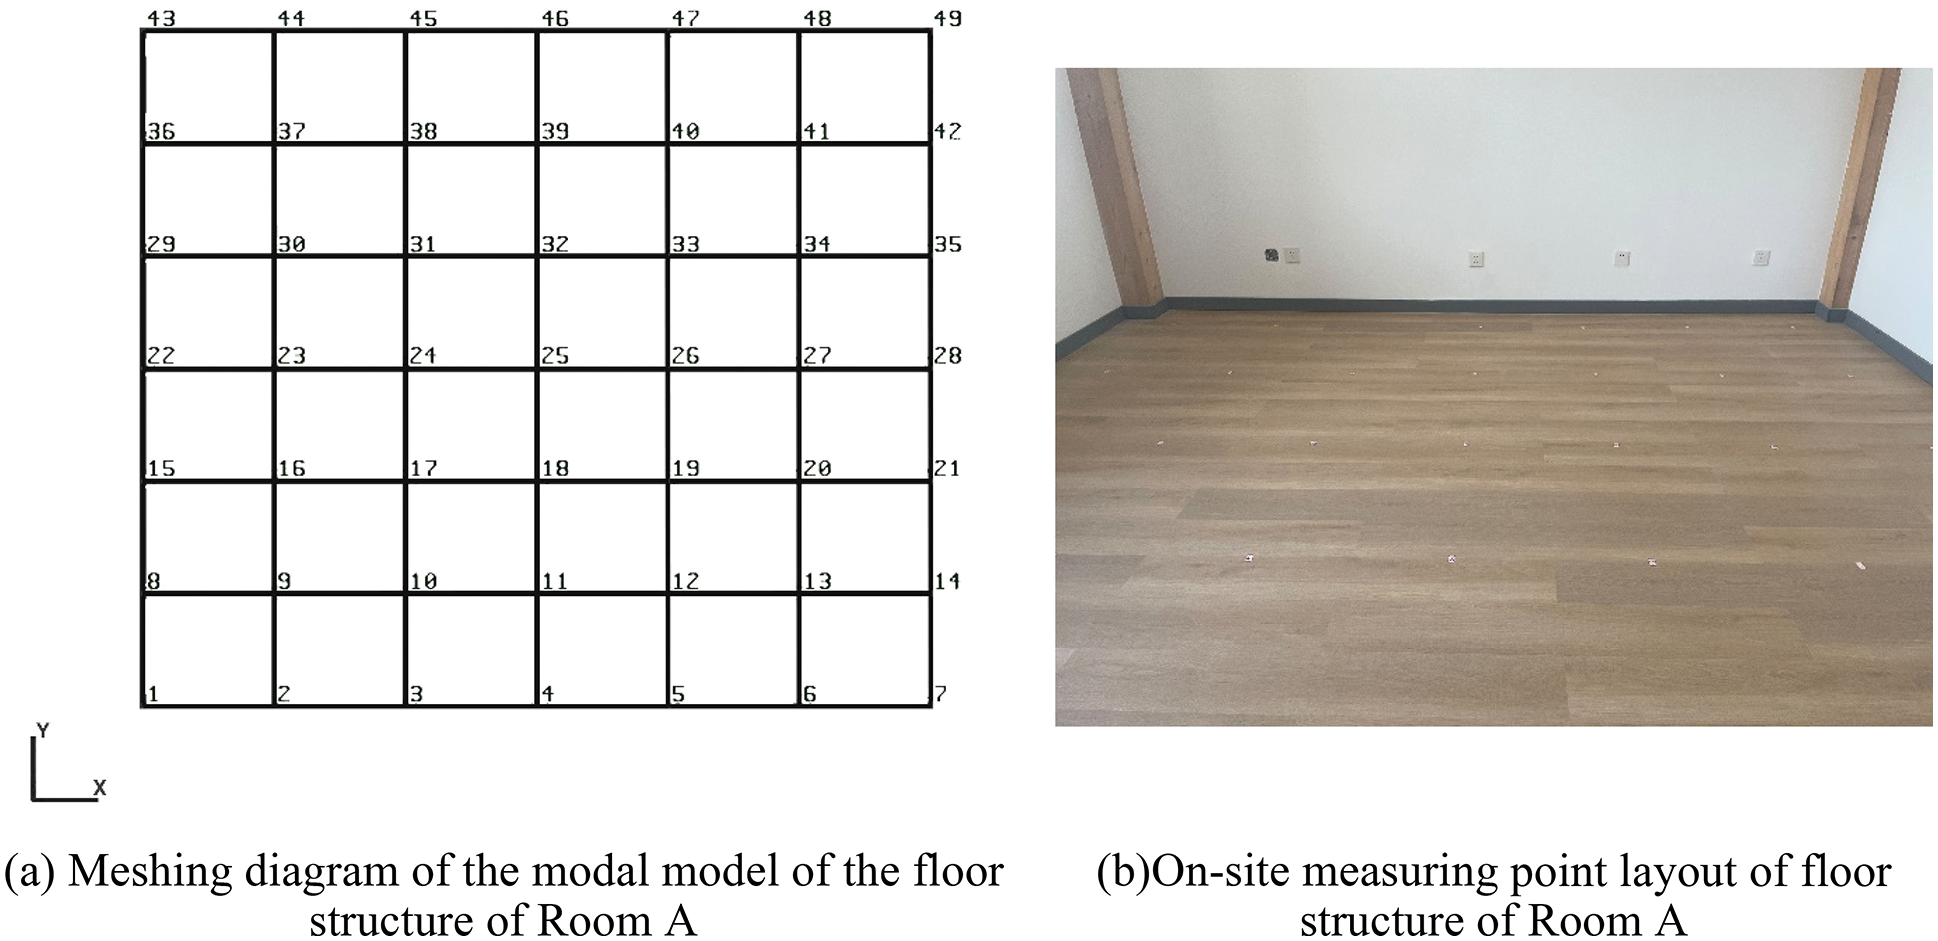
Figure 4: Grid division diagram of Room A
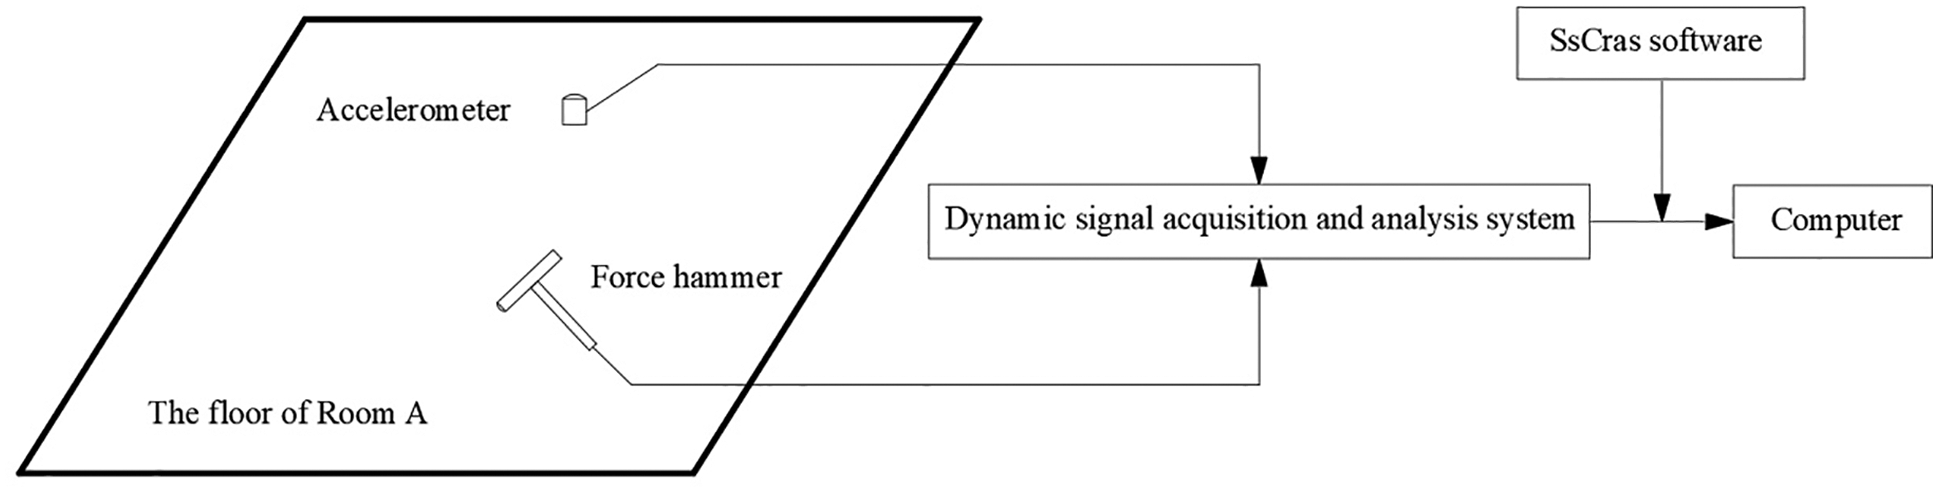
Figure 5: Test system block diagram for test modal analysis
This modal test adopts the acquisition method of fixed measurement point and moving excitation point. That is to say, the accelerometer is fixed at one point, and the force hammer performs the measurement method of running point excitation to obtain its mode shapes and its modal parameters. In Fig. 6, ch2 is connected to the accelerometer and placed at the 16th measuring point as a reference point, and the hammer connected to ch1 is moved at each point for measurement. The measurement parameters are set as: the unit of ch1 is N, the unit of ch2 is mm/s2, the voltage range is 5000 mV, the analysis frequency is 100 Hz, the average number of acquisitions is twice, the number of FFT blocks is 1024, and both channels are amplified by 10 times. During measurement, the trigger mode is selected as the negative trigger and the trigger channel is selected as the hammer channel (ch1) to prevent false triggering of the modal measurement in Room A when people walk. In the above, FFT (Fast Fourier Transformation) is a fast algorithm for discrete Fourier transform. It is obtained by improving the algorithm of discrete Fourier transform according to the odd, even, imaginary and real characteristics of discrete Fourier transform. There are many kinds of hammer heads of the force hammer, which are divided into rubber head, wool head, steel head and so on. The choice of the force hammer is to perform signal oscillography by hitting the ground with the force hammer. If it can reflect the correct excitation time domain spectrum, it can be used. The main testing process is as follows.
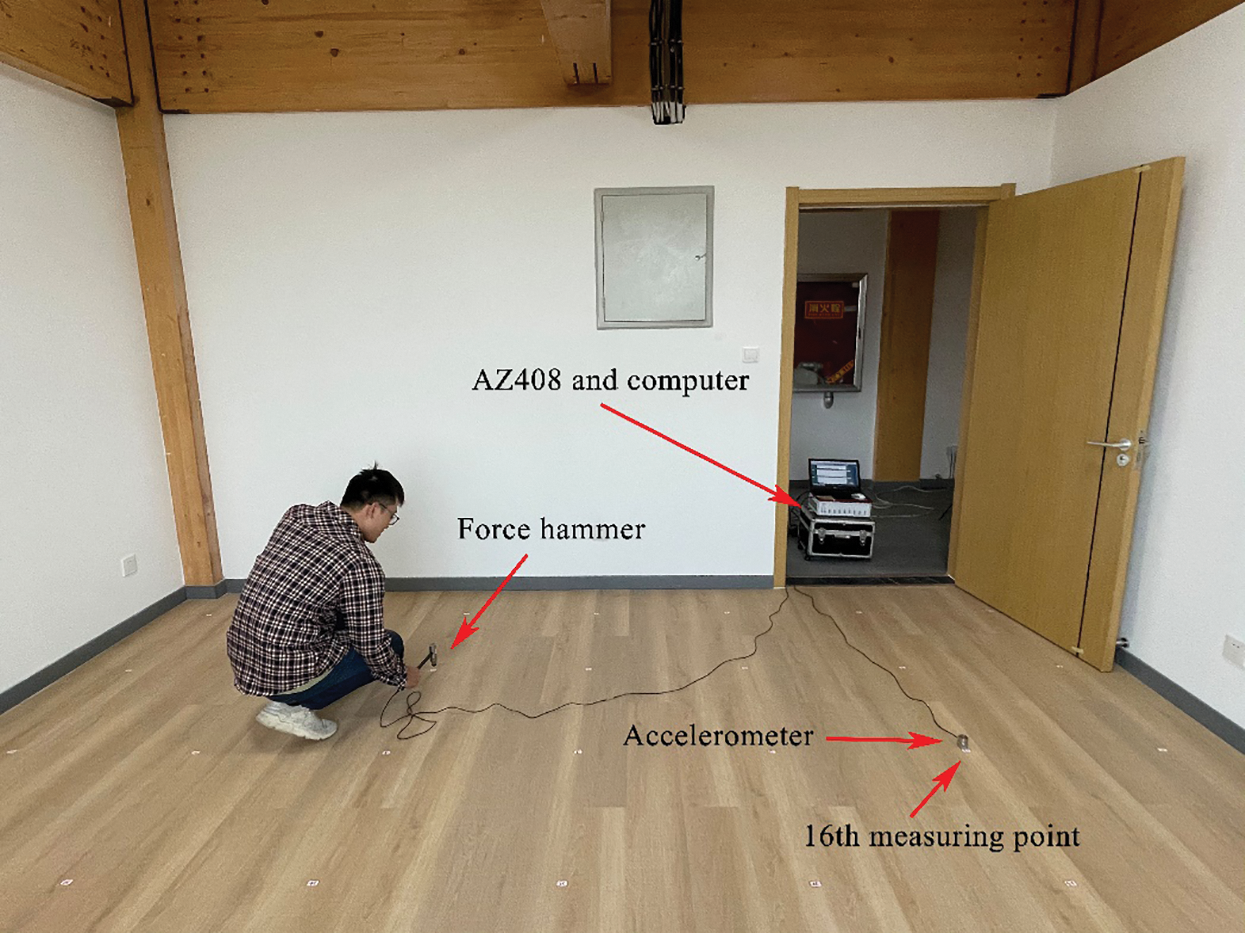
Figure 6: Vibration modal test site of the floor structure of Room A
First, the test system connections are made as shown in Fig. 5 and check the wiring. The accelerometer of ch2 is placed at point 16. Secondly, after establishing the geometric model and setting the parameters, the test point is knocked with a force hammer to perform oscillography, and the test can be performed only after the waveform is normal. Again, 49 measuring points are hit in turn by the force hammer of ch1, and the corresponding data is collected. Then, through the preliminary estimation of parameters, curve fitting, measurement direction processing, constraint equation processing, and mode shape normalization, the mode shape is simulated. Finally, the above process is re-tested once again to make it consistent. The mode shape orthogonality test diagram is shown in Fig. 7.
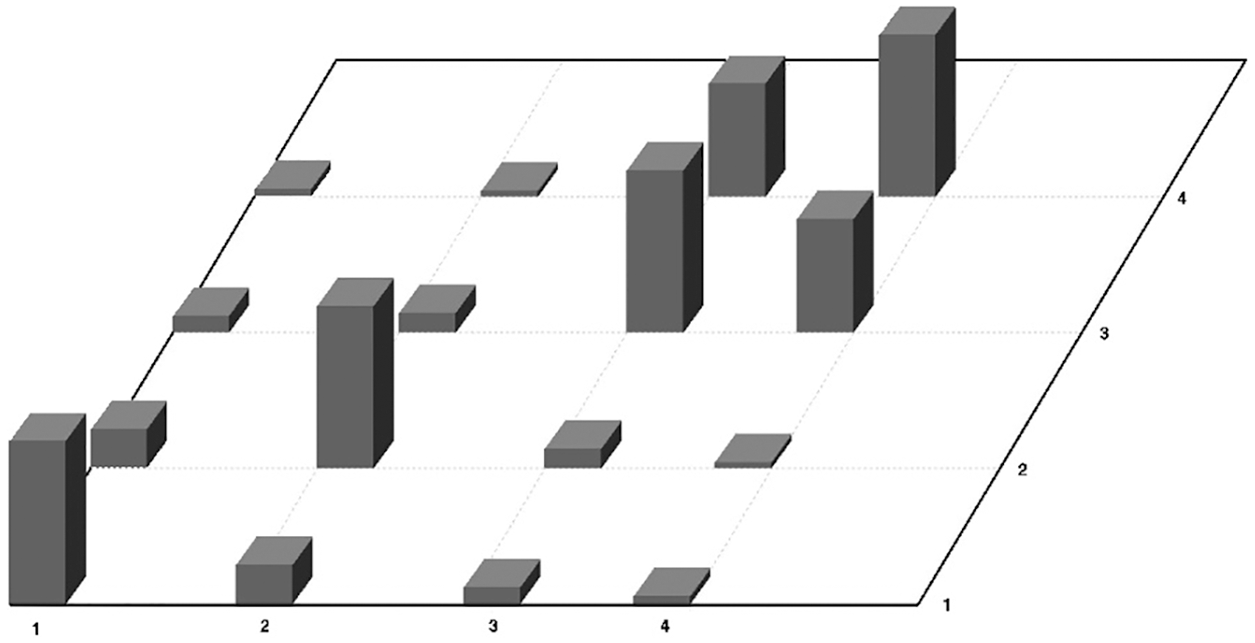
Figure 7: Mode shape orthogonality test
3.2.2 Modal Test of the Floor of Room B
The instrument connection is the same as Fig. 5. The floor of Room B is meshed. A part of the space is reserved around the floor in order to make the mode shape display clearer and more appreciable. The floor of Room B is divided into 8 × 10 grids, each with a size of 900 mm × 900 mm. A total of 99 measuring points is divided, as shown in Fig. 8.
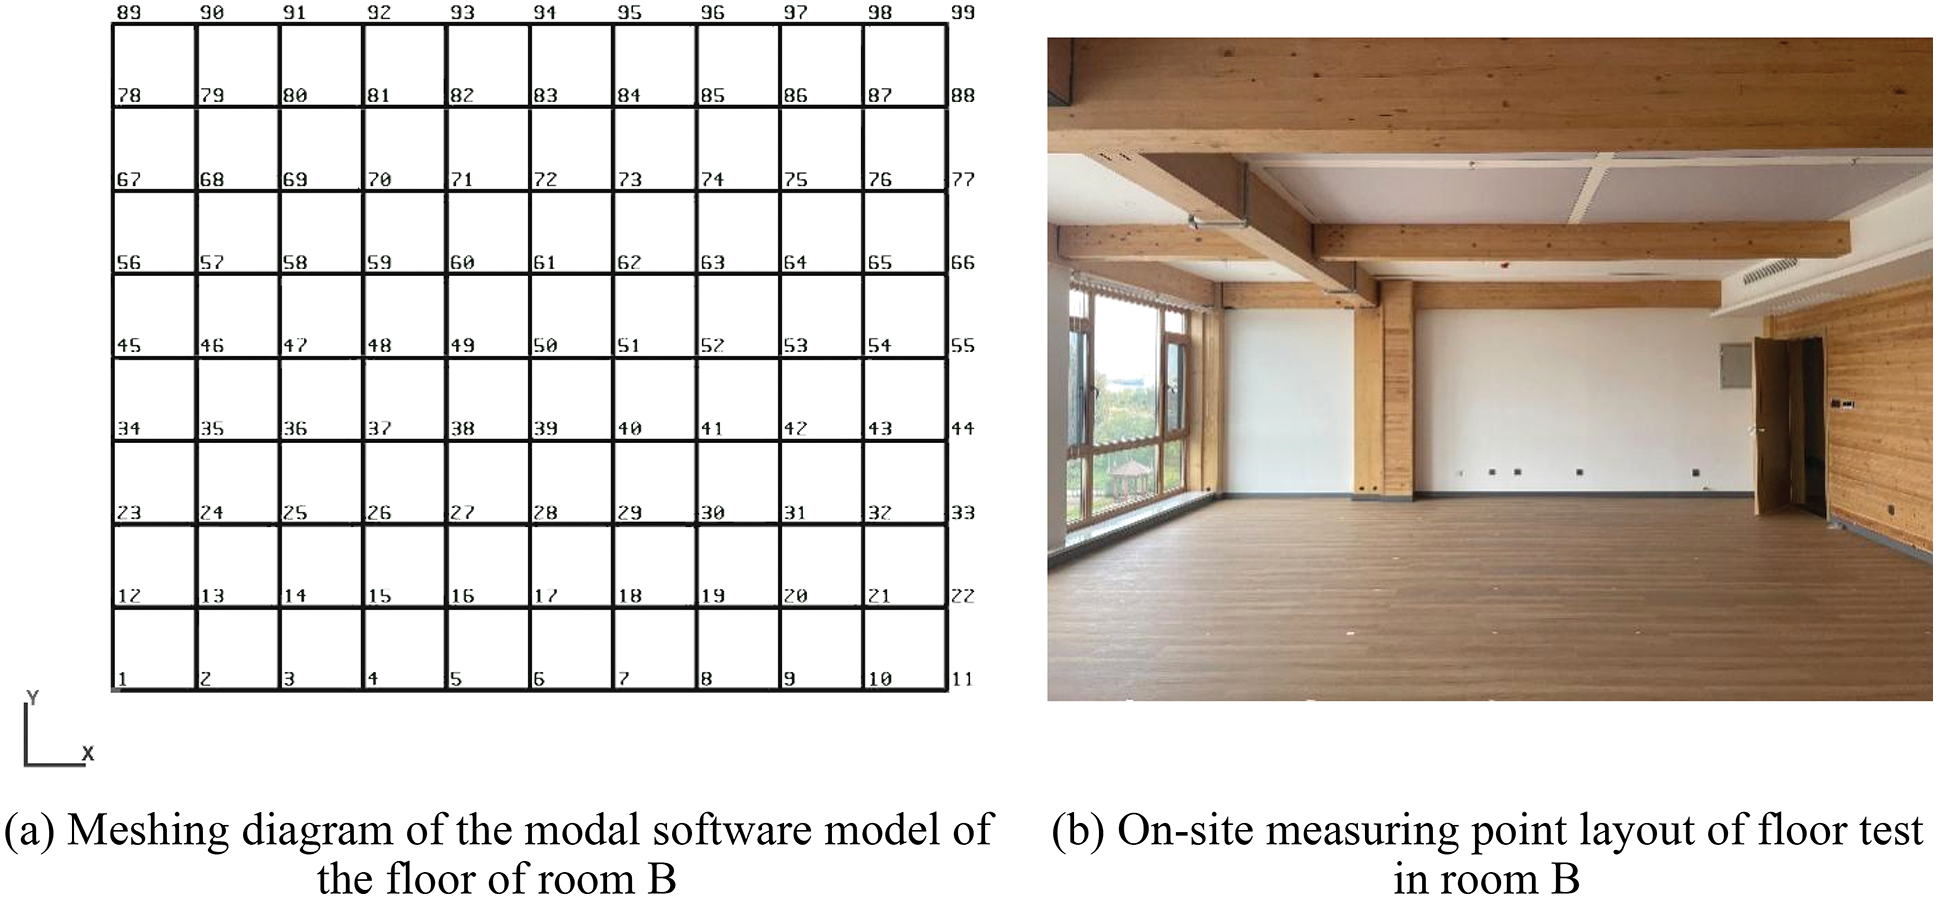
Figure 8: Grid division diagram of Room B
The modal test in Room B is acquired with two channels using MaCras software. The way that ch1 is fixed and ch2 is running is adopted. The gear of the 941B type vibration pickup is adjusted to the low speed, and it is placed vertically at the test point above the floor. Considering the mode shape factor, the reference point is selected as the 50th measuring point (the center point of the floor of Room B). The speedometer on ch1 is used as a reference point, and the speedometer on ch2 is moved for measurement. The measurement parameters are set as: the unit of is m/s, the unit of ch2 is m/s, the voltage range is 5000 mV, the analysis frequency is 100 Hz, the average number of acquisitions is 4 times, the number of FFT blocks is 1024, and both channels are amplified 100 times. The main test process is the same as Room A in Section 3.2.1.
3.2.3 Modal Test of the Floor of Room C
The instrument connection is the same as in Fig. 5. The floor of Room C is divided into 6 × 8 grids, each with a size of 1733 mm × 1800 mm. A total of 63 measuring points is divided, as shown in Fig. 9.
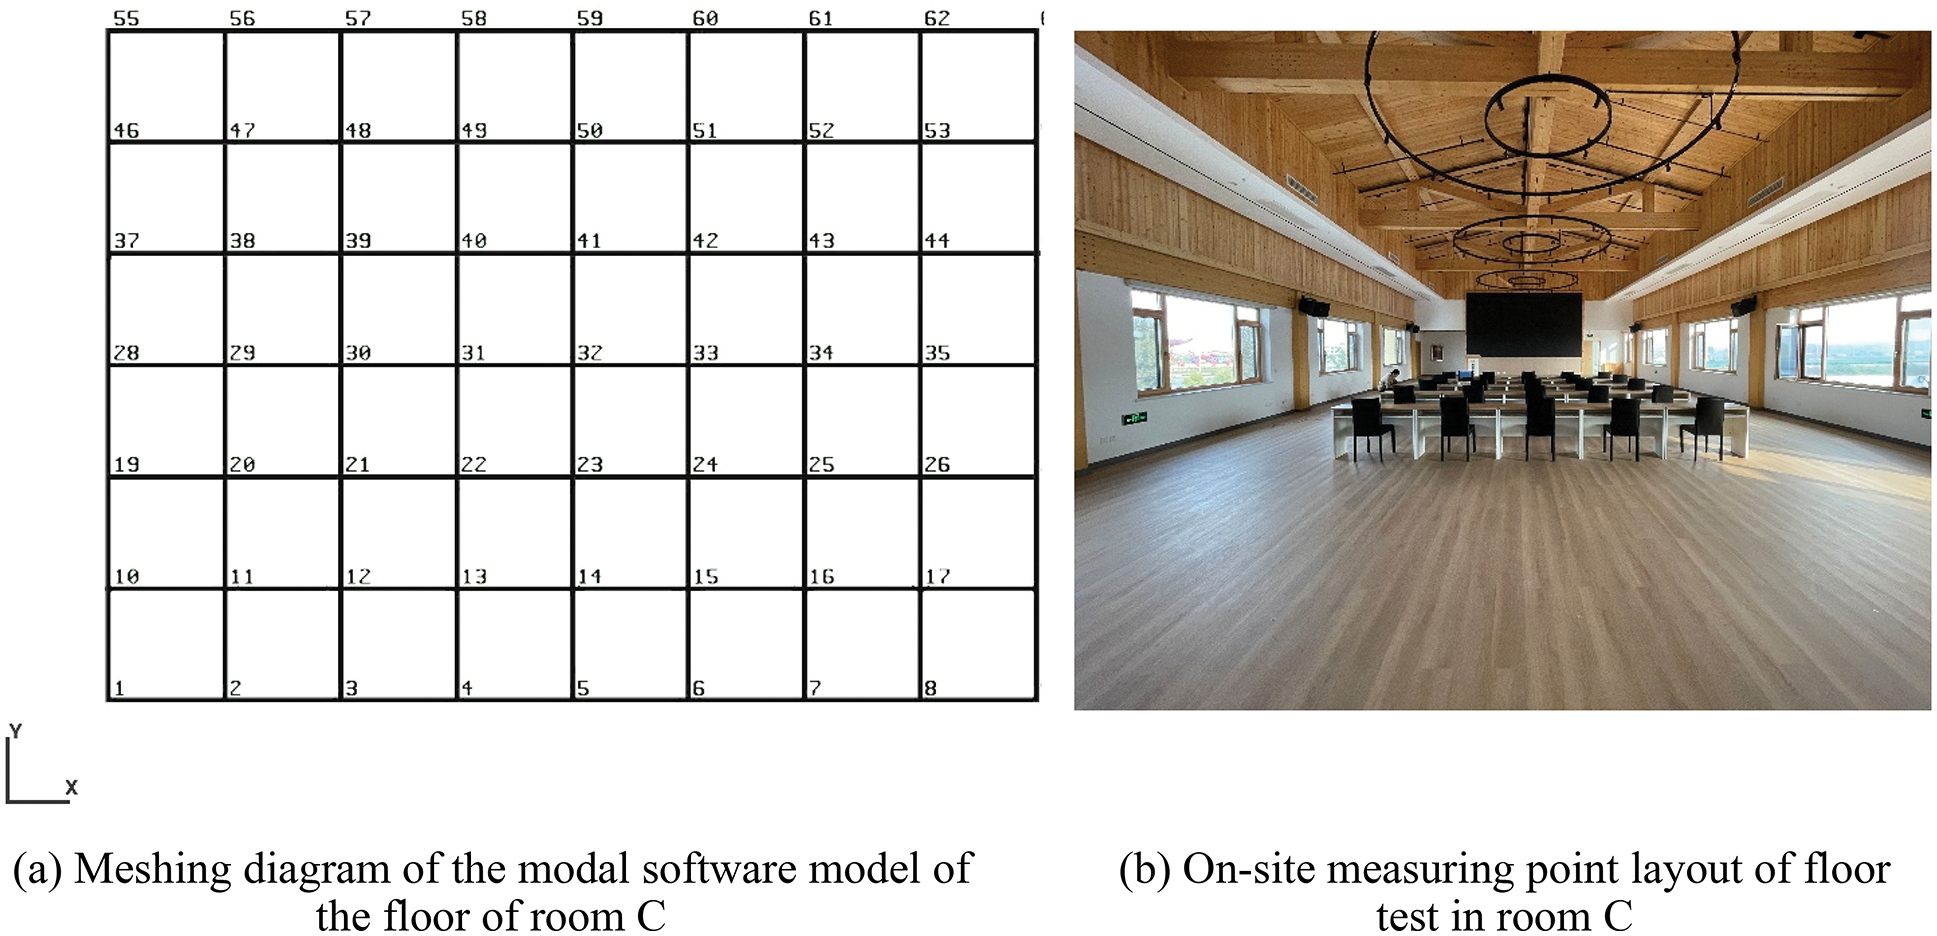
Figure 9: Grid division diagram of Room C
The first-order natural frequency test experiment of the floor structure of Room C is also used for single-channel (ch1) acquisition using SsCras software. A 109B accelerometer is connected to ch1 and is excited by a rubber hammer. In this study, a total of 8 representative measuring points 5, 17, 21, 32, 34, 42, 47, and 63 have been selected for excitation and vibration pickup, respectively. After the preliminary test, the ideal frequency spectrum cannot be obtained by knocking the measuring point where the accelerometer is placed. Therefore, after permutation and combination, a total of 56 sets of data requires to be tested. The measurement parameters are set as: the unit of ch1 is m/s2, the voltage range is 1250 mV, the analysis frequency is 100 Hz, the average number of acquisitions is 2 times, the number of FFT blocks is 1024, and the trigger control is negative. The main test process is as follows.
First, the instrument and computer are connected, and the wiring is checked. The accelerometer on ch1 is placed at measuring point 5. Secondly, after setting the parameters, the measuring point is knocked with a rubber hammer to perform oscillography, and the test can be performed only after the normal waveform. Again, the rubber hammer is used to knock seven measuring points in turn to collect data. Then, the accelerometer is moved to the other 7 measuring points, the remaining 7 measuring points are knocked to collect data. Next, the first-order natural frequency of the floor structure is identified by the frequency spectrum. Finally, the above process was re-tested once again to make it consistent.
4.1 Analysis of the Dynamic Characteristics of the Floor
The test results of the floor of Room A are preliminarily estimated, and the mode shapes of the floor are analyzed to obtain more accurate first-order bending, second-order bending and first-order torsional mode shapes in the z-direction. The results show that the first-order bending frequency is 27.50 Hz, the transverse second-order bending frequency is 34.75 Hz, the longitudinal second-order bending frequency is 53.25 Hz, and the first-order torsional frequency is 56.25 Hz, as shown in Fig. 10.
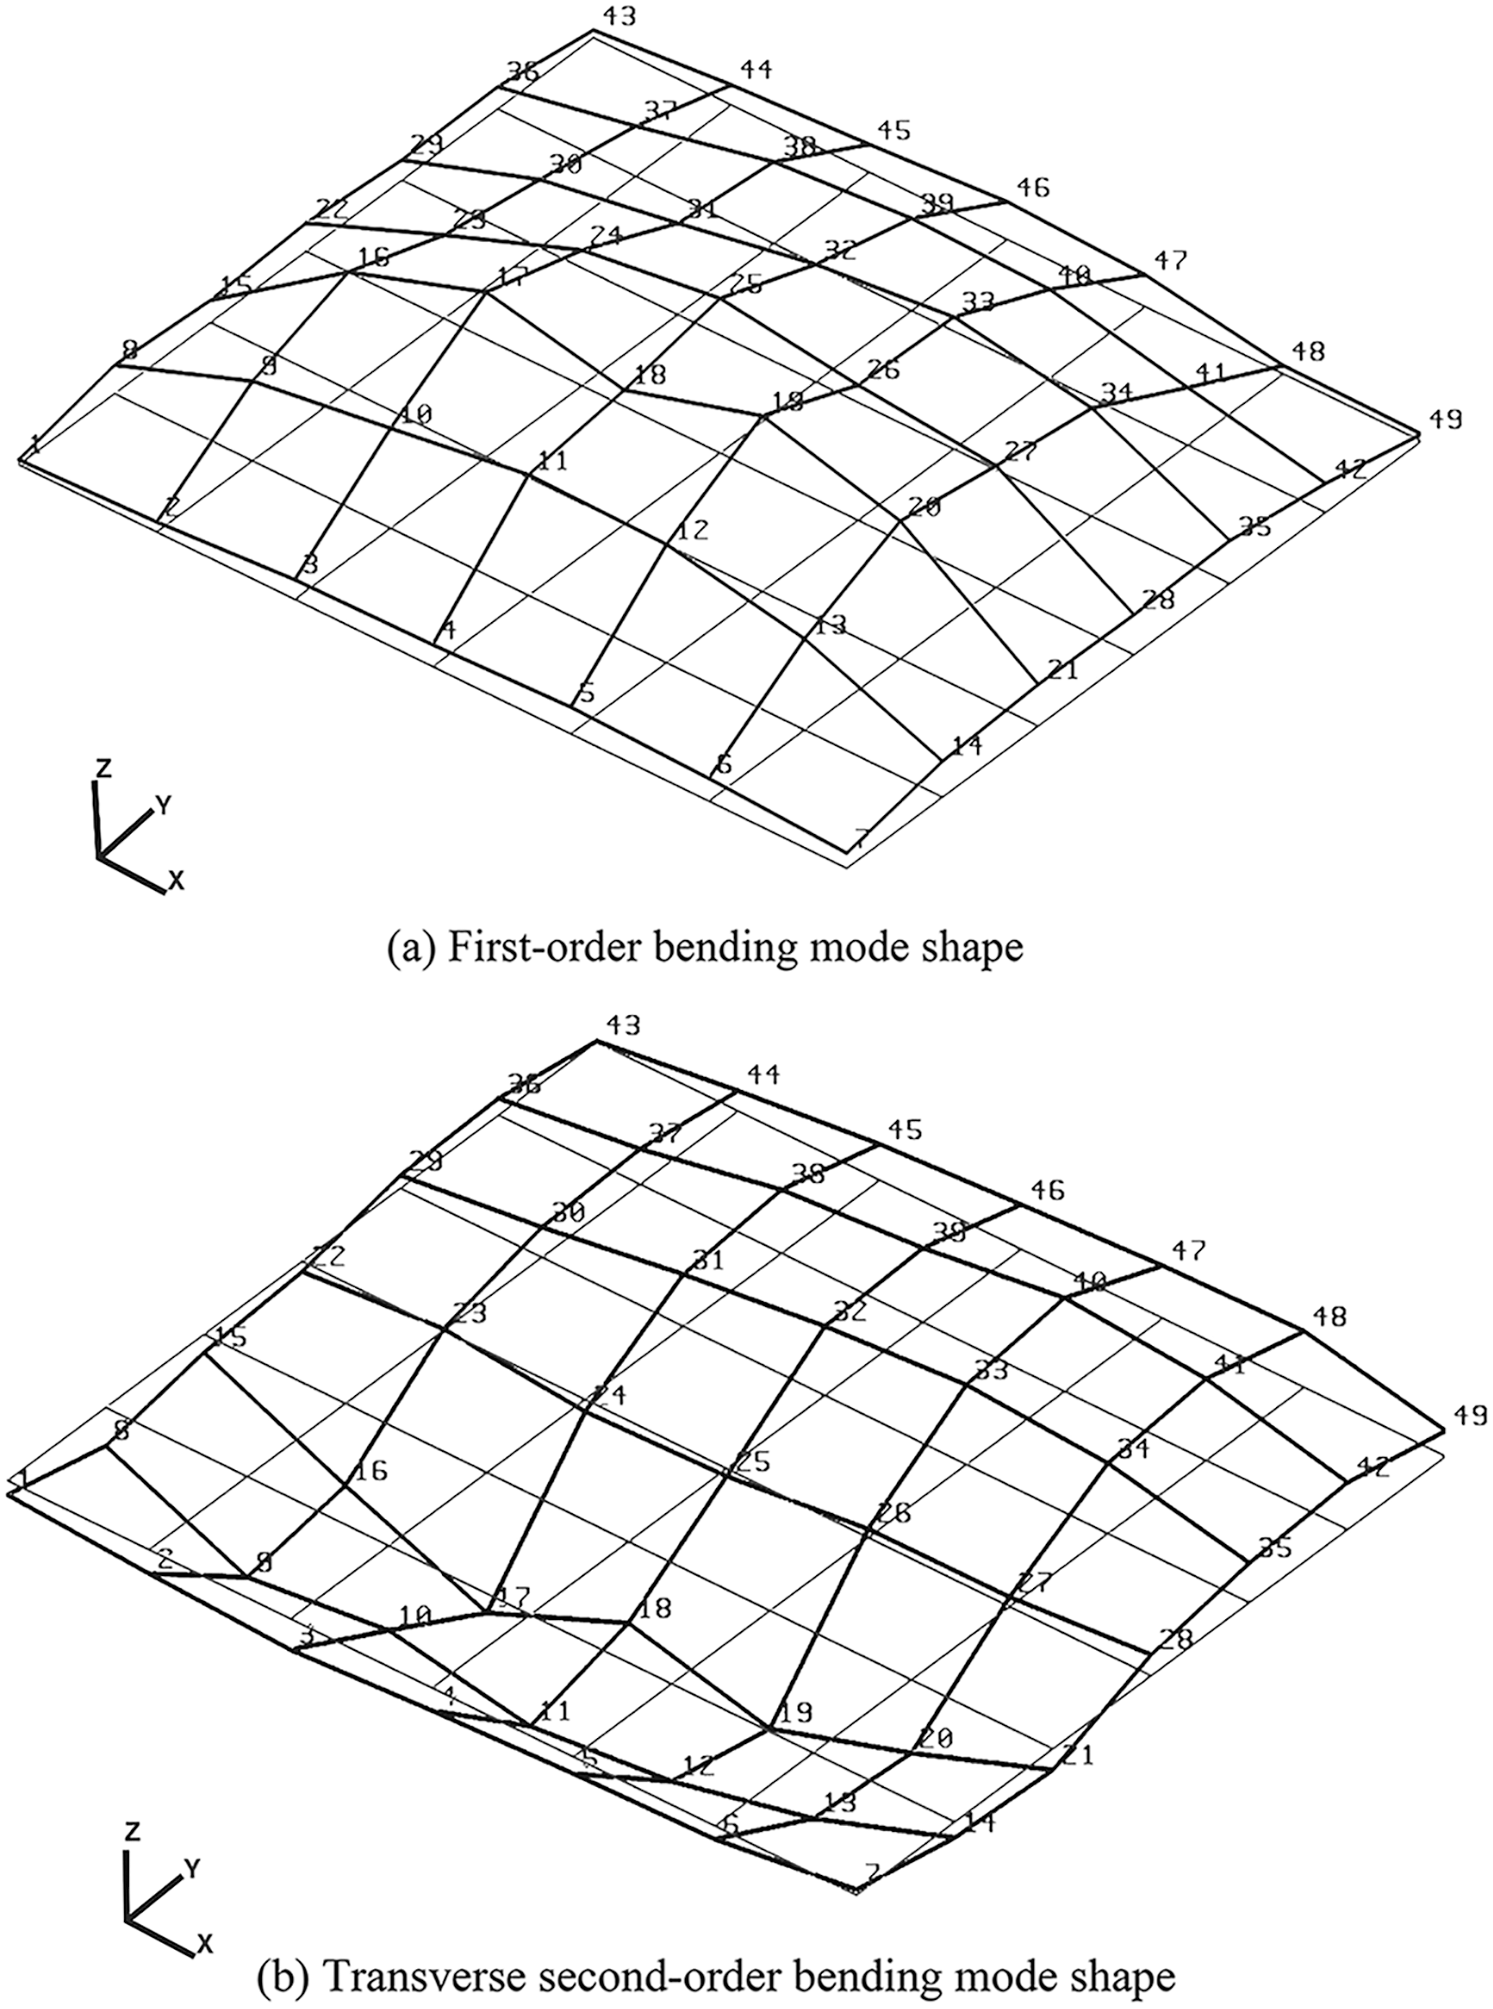
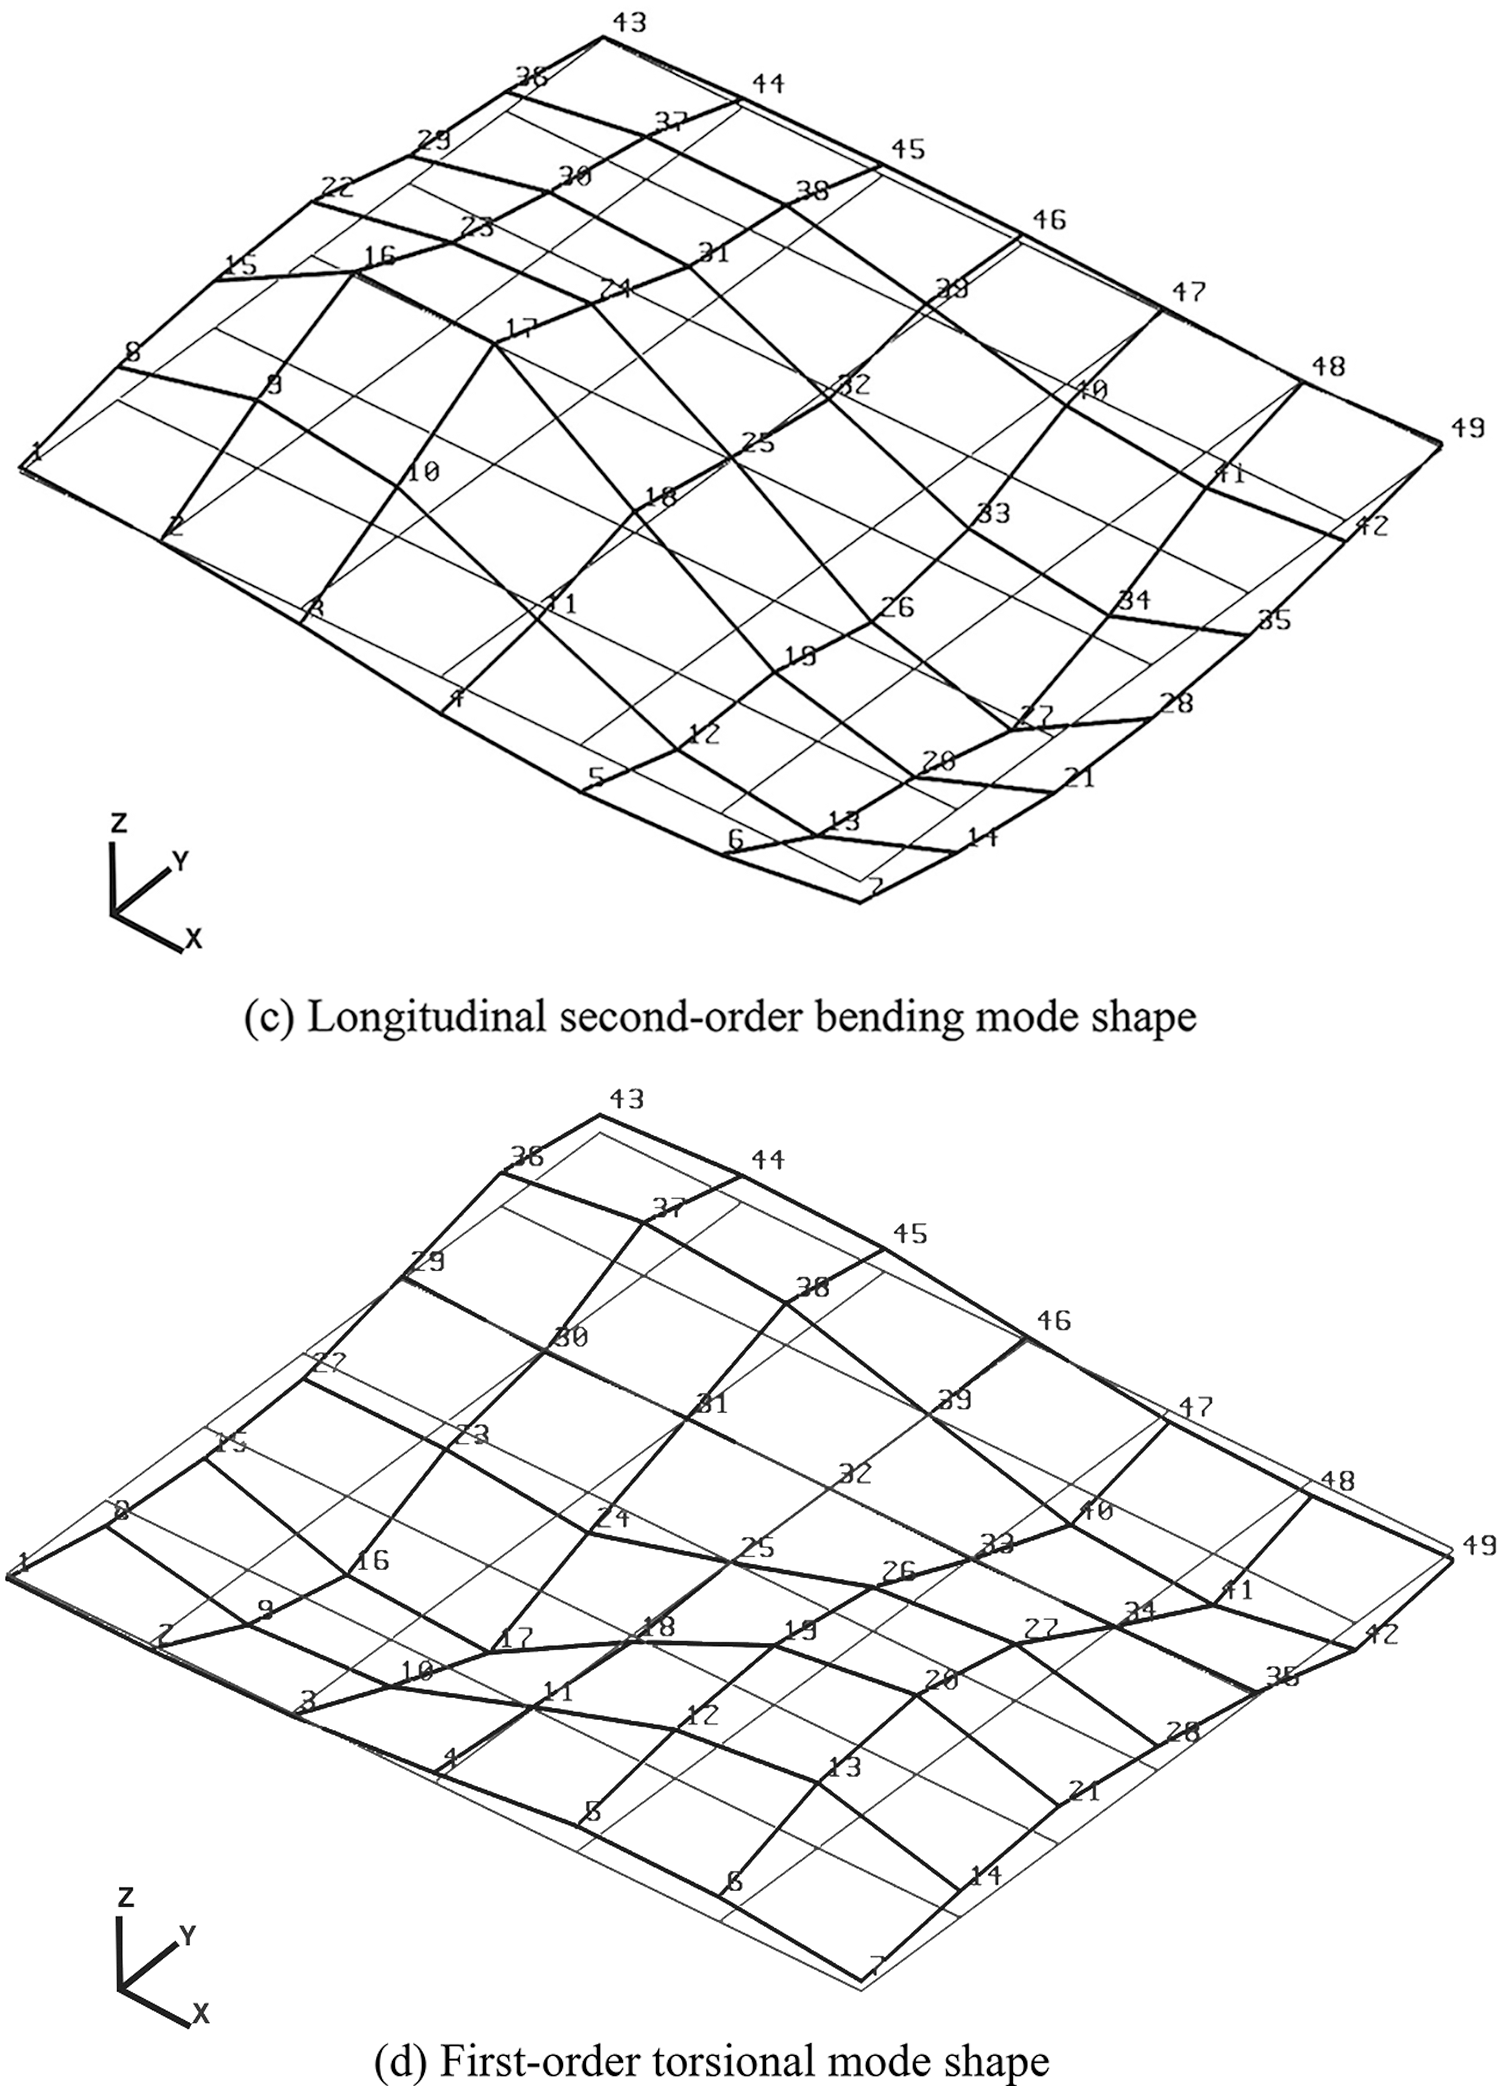
Figure 10: Test mode shapes and modal parameters of Room A
The lateral second-order bending frequency of the floor is lower than the longitudinal second-order bending frequency. This is because the reinforced beams placed at the bottom of the floor increase the lateral stiffness of the glulam floor, but do not counteract the anisotropy caused by the longitudinally aligned floors. In other words, due to insufficient connection rigidity between the reinforced beam and the floor, the overall longitudinal rigidity of the floor is larger than the lateral rigidity. The longitudinal second-order bending frequency is very close to the first-order torsional frequency in numerical value, and the resonance curve peaks shown in the RMS linear spectrum also partially overlap, which can be distinguished by the modal test.
Interestingly, in the first-order torsional mode, the transverse pitch line is at the midline and also in the vertical plane of the reinforced wooden beam. The longitudinal pitch line is not located at the midline, but is offset by one grid on the side of the window. This is because the mode shape pitch line coincides with the gap of the glulam floor, resulting in a “displacement” offset of the longitudinal pitch line of a torsional vibration mode.
The test results of the floor of Room B are preliminarily estimated. The first-order natural frequency of the floor structure is obtained as 13 Hz. The mode shape and modal parameters are shown in Fig. 11.
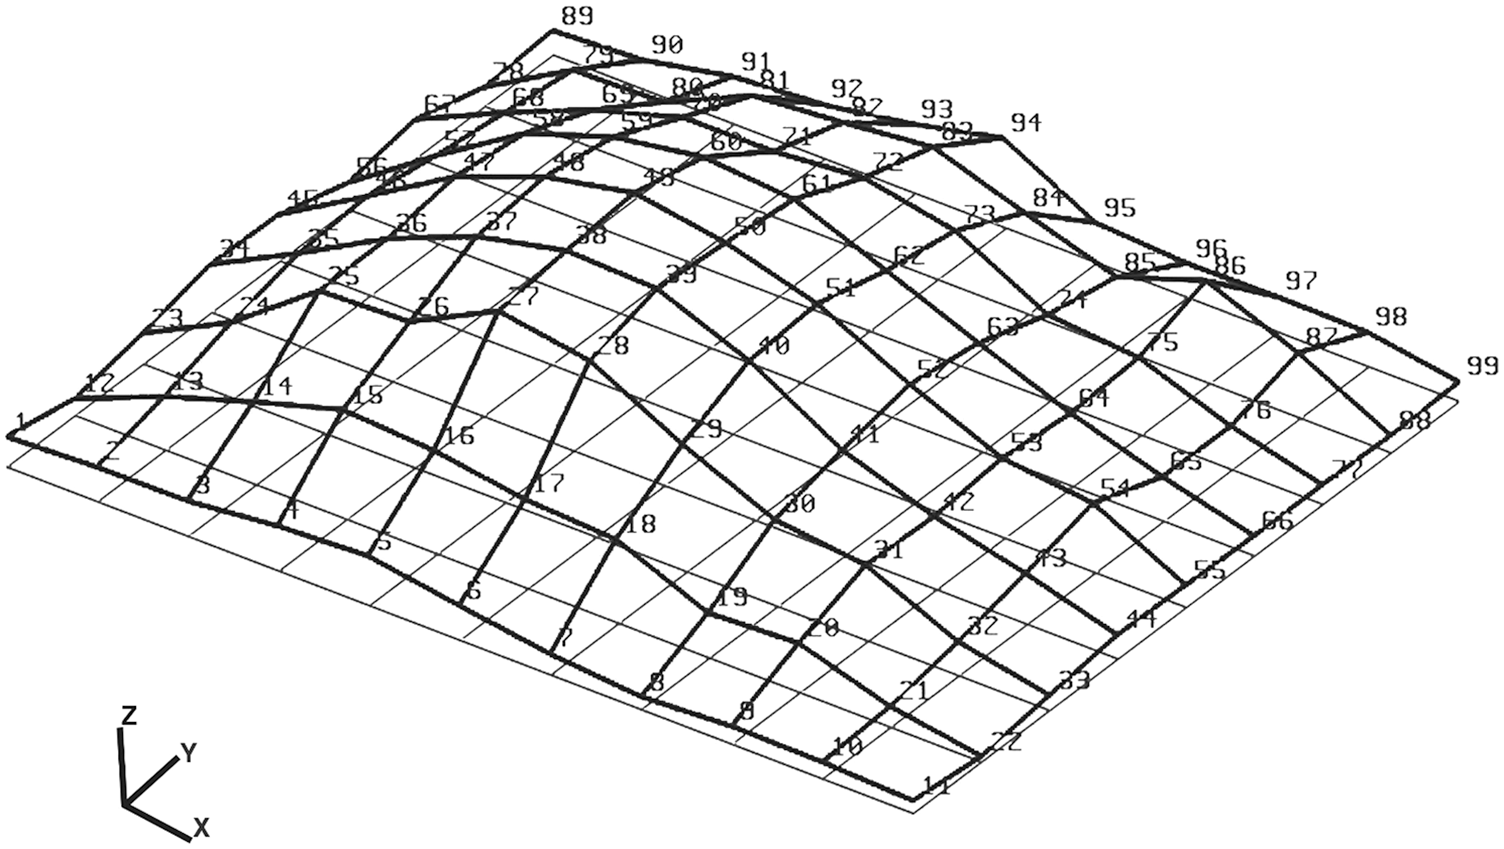
Figure 11: The first-order natural frequency mode shape of the floor structure of Room B
The first-order natural frequency test results of different measuring points of Room C are shown in Table 3.
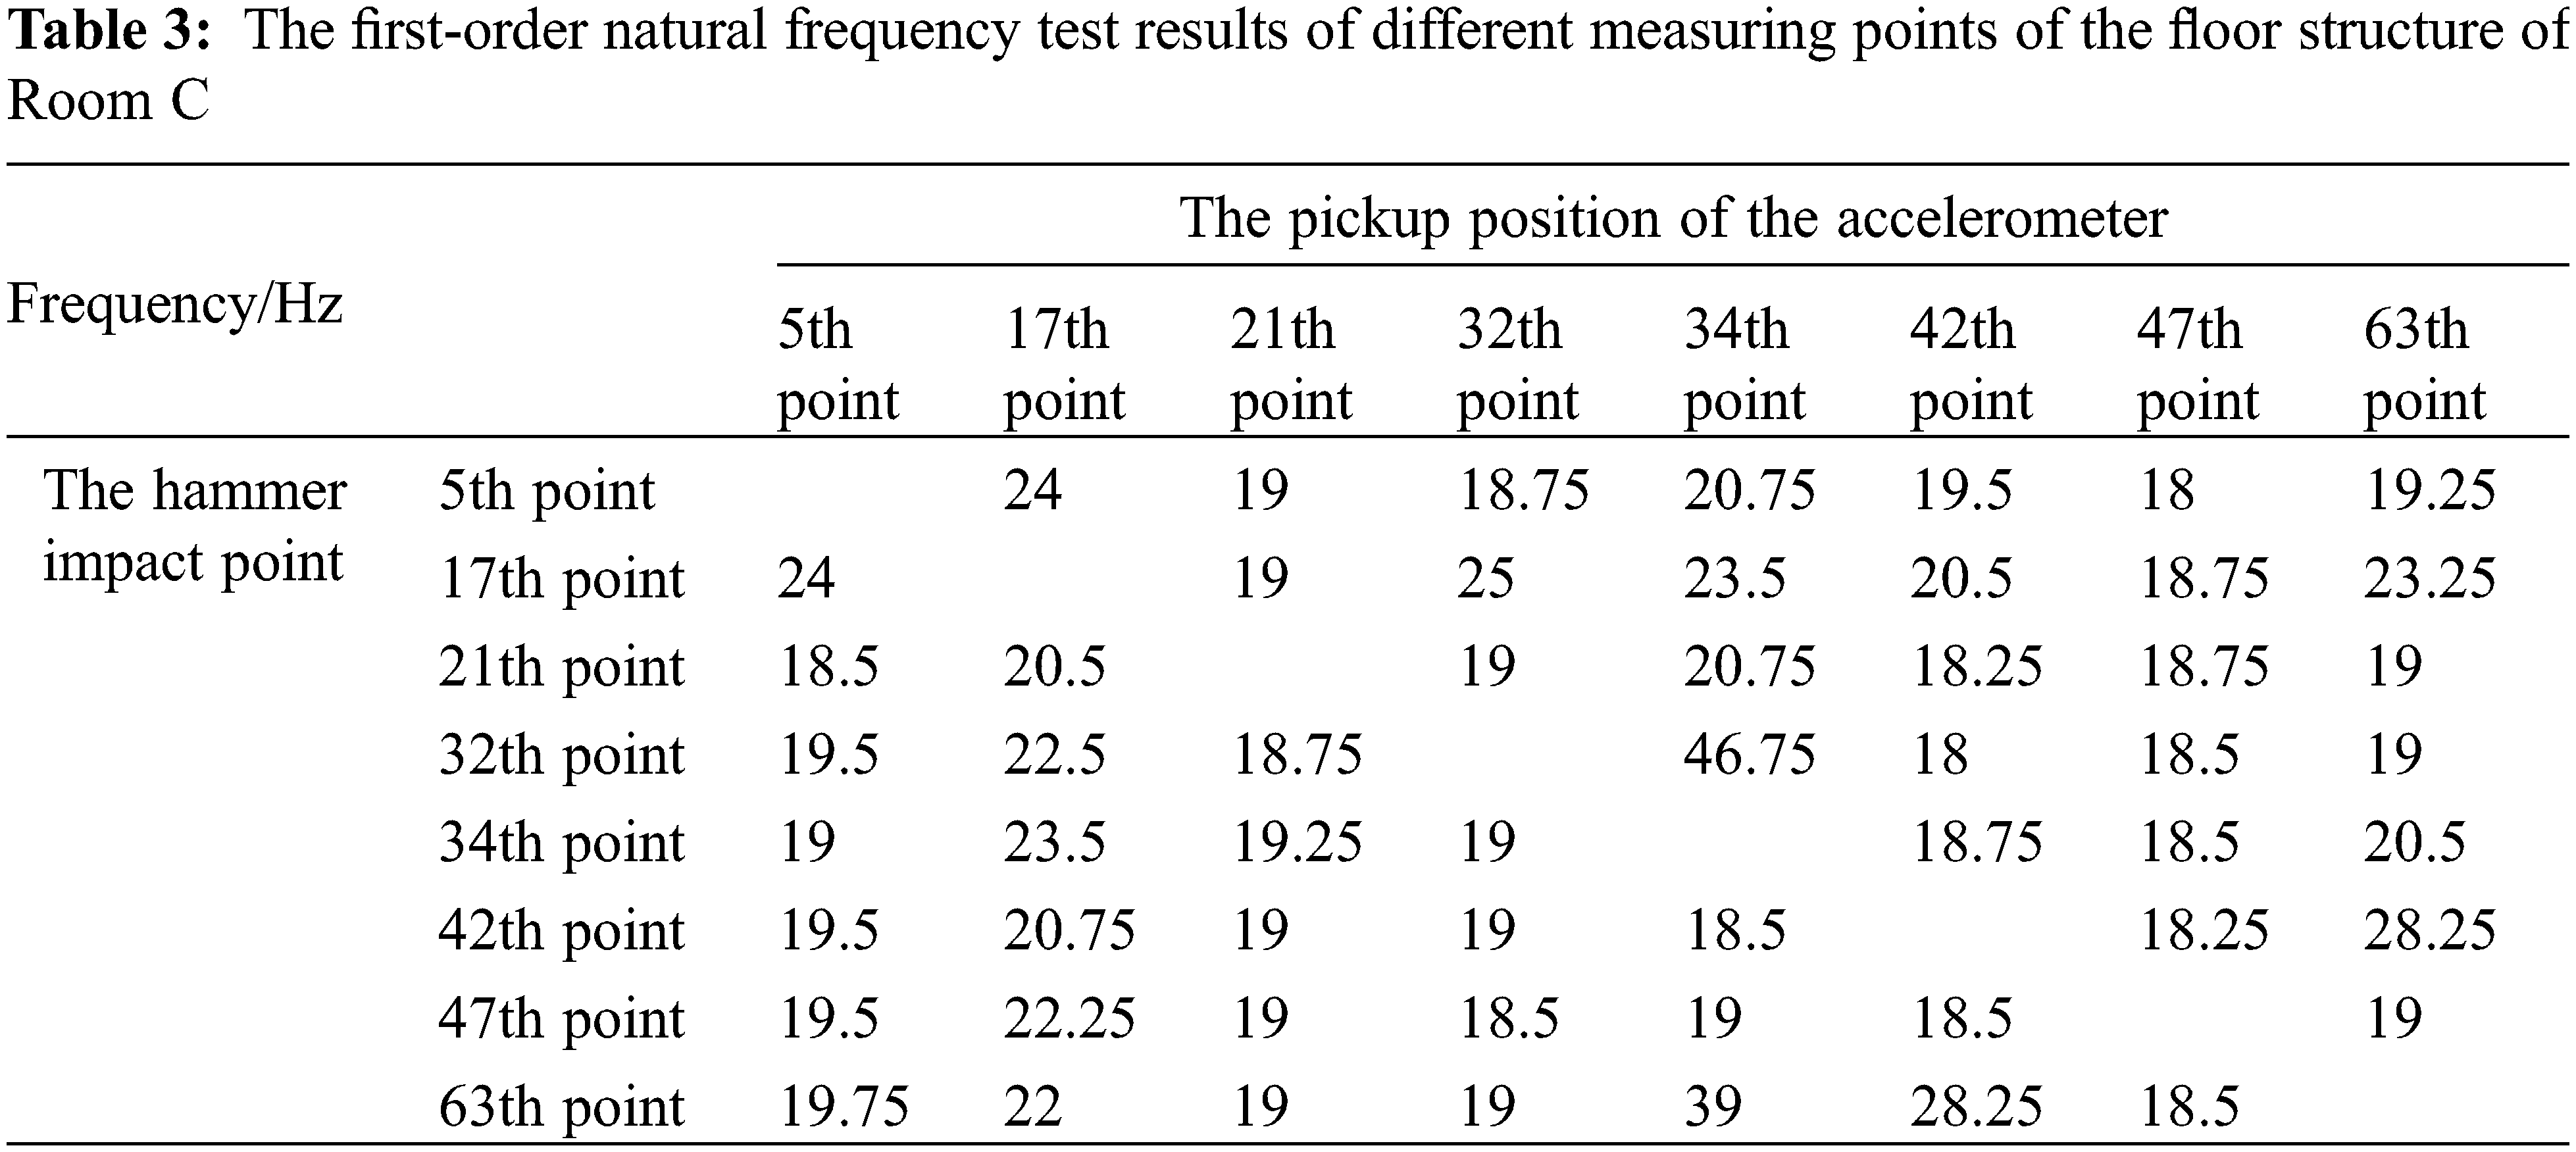
In Table 3, when the pickup position of the accelerometer is 42th point and the hammer impact point is 32th point, the fundamental frequency of 18 Hz is the minimum value. This value can be identified as the first-order natural frequency of the floor structure of Room C.
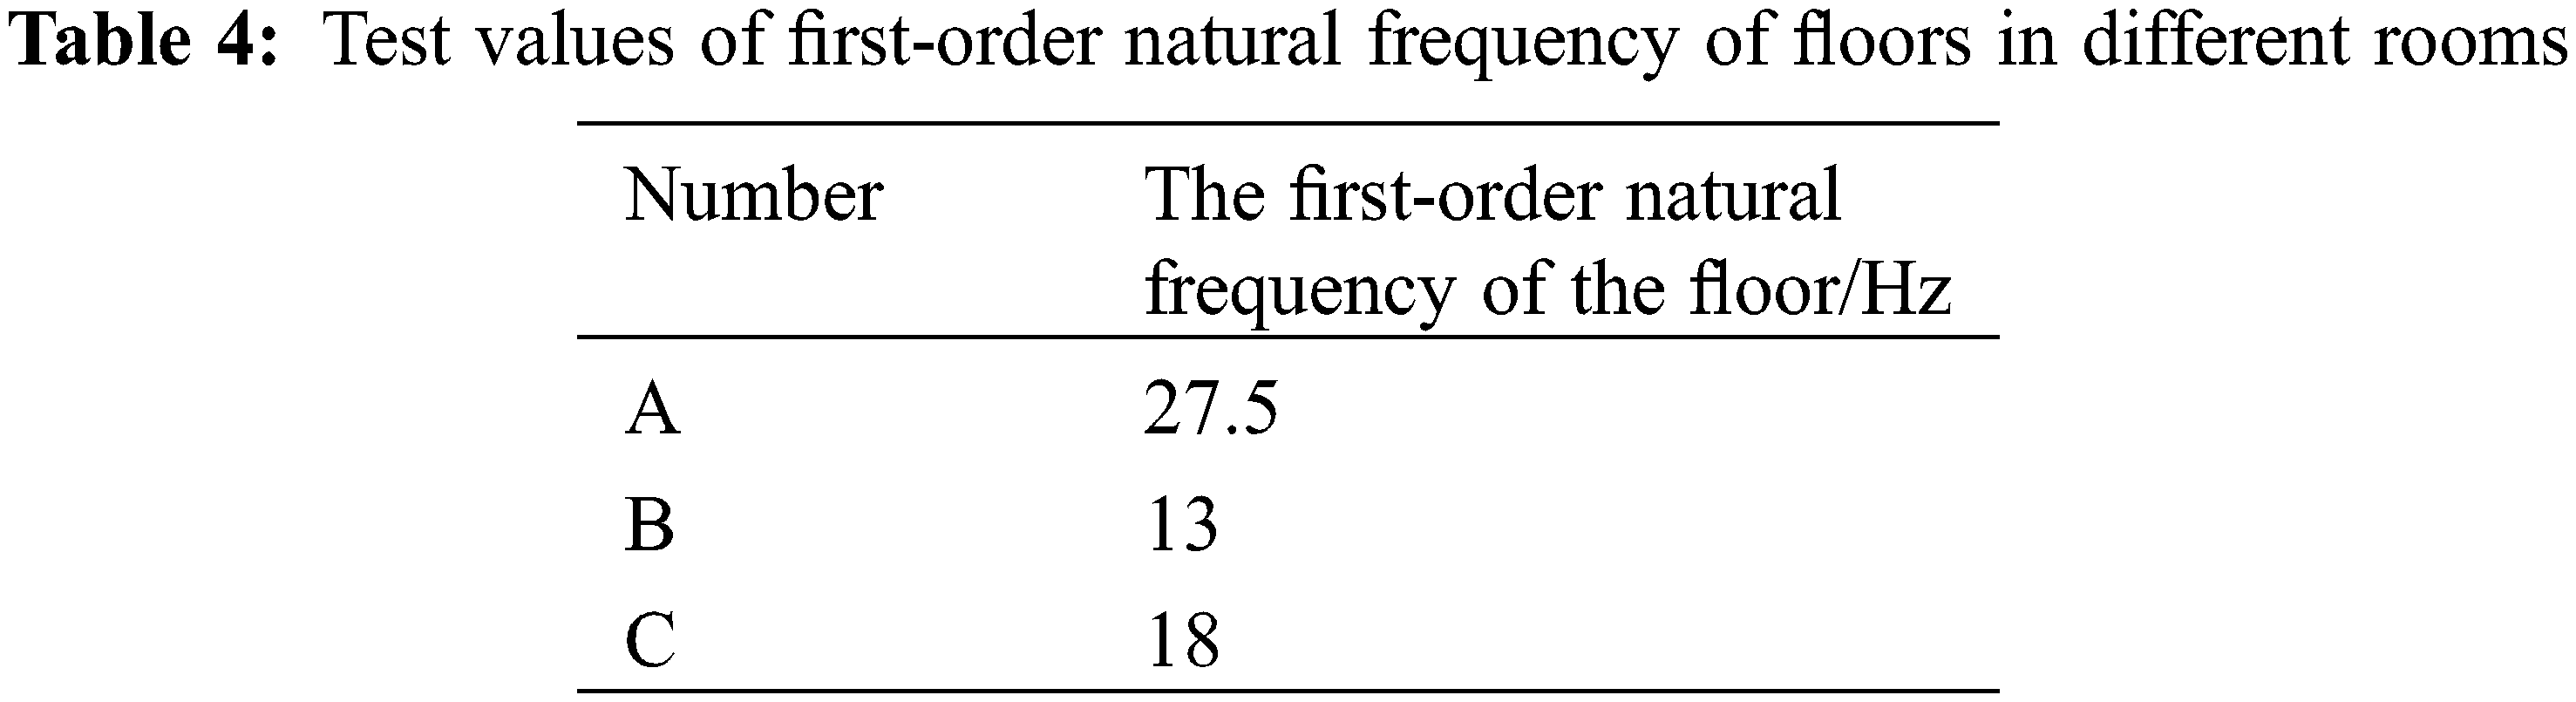
It can be seen from Table 4 that for the same high-rise glulam building, a larger floor plan size and span can make the floor lighter and more flexible, thereby reducing the value of the first-order natural frequency. These building structures are prone to obvious vibration responses under the action of machinery and people. The stiffness of the floor of Room A is the largest, and the first-order natural frequency is also the largest. The floor of Room B has 2 reinforced beams and 1 reinforced longitudinal beam, and its relative span is the largest. There are 6 transverse and 2 longitudinal reinforced beams (glulam beams) on the floor of Room C, which are intricate. Its relative span is second only to Room A, which is also an important reason for the unsatisfactory modal test results of Room C. The test results show that the reinforced wooden beam can directly affect the vibration comfort of the floor structure.
According to the suggestion of scholar Ellingwood [32], the natural frequency f/Hz and span L/m of the floor should satisfy the requirement formula:
According to the above regulations, the glulam building floor generally meets the requirements of natural frequency. Compared with steel and concrete, wood has a very strong ductility, so the rigidity of the corresponding timber structural buildings is generally poor. The first-order natural frequencies of the floors of Rooms A and C meet the maximum requirement of 15 Hz [33]. The first-order natural frequency of the floor of Room B is slightly lower, but it still meets most of the standard requirements. In general, the human body is basically not affected by the discomfort caused by the vibration of the floor. For the first high-rise timber structure office building in China, the vibration characteristic design of this floor meets the professional requirements.
It is generally believed that a wooden floor with a natural vibration frequency above 10 Hz is a lightweight floor and is prone to vibration. Its design should focus on the control of the stiffness and quality of the floor system. The approximate natural frequency [31] of the floor is calculated as follows:
In formula (1),
The transient excitation, environmental excitation and spectrum identification methods were used in this study to conduct experimental modal tests on Rooms A, B, and C of different sizes in the same glulam structural building, evaluating the dynamic characteristics and overall vibration comfort. The main conclusions are as follows:
(1) The wooden beams (reinforced components) of the floor structure of Room A in the glulam building can strengthen the overall rigidity and improve the comfort of living. From the test mode of the floor structure of Room A, the first-order bending frequency is 27.50 Hz, the transverse second-order bending frequency is 34.75 Hz, the longitudinal second-order bending frequency is 53.25 Hz, and the first-order torsional frequency is 56.25 Hz. The reinforced wooden beam placed at the bottom of the floor increase the transverse stiffness of the floor structure, but it does not offset the anisotropy caused by the longitudinally arranged glulam floors, and the overall longitudinal stiffness of the floor is larger than the transverse stiffness. There is a gap between the longitudinally arranged glulam floors, which leads to the offset phenomenon of the longitudinal pitch lines in the first-order torsional mode.
(2) The fundamental frequency values of the floor of Rooms A, B, and C with three different sizes and positions are 27.5, 13 and 18 Hz, respectively. They all meet the requirements of the relationship between natural frequency and span. Overall, the glulam structural building floor meets the comfort level requirements specified by the natural frequency of the building.
Funding Statement: The authors received no specific funding for this study.
Conflicts of Interest: The authors declare that they have no conflicts of interest to report regarding the present study.
References
1. Li, H., Wang, L. B., Wei, Y., Wang, B. J., Jin, H. (2022). Bending and shear performance of cross-laminated timber and glued-laminated timber beams: A comparative investigation. Journal of Building Engineering, 45(9), 103477. https://doi.org/10.1016/j.jobe.2021.103477 [Google Scholar] [CrossRef]
2. Li, H., Wang, L. B., Wang, B. J., Wei, P. X., Yu, W. T. et al. (2021). Preliminary evaluation of a density-based lumber grading method for hem-fir CLT manufacturing. European Journal of Wood and Wood Products, 79(4), 967–975. https://doi.org/10.1007/s00107-020-01653-3 [Google Scholar] [CrossRef]
3. Li, H., Wang, B. J., Wang, L. B., Wei, P. X., Wei, Y. et al. (2021). Characterizing engineering performance of bamboo-wood composite cross-laminated timber made from bamboo mat-curtain panel and hem-fir lumber. Composite Structures, 266, 113785. https://doi.org/10.1016/j.compstruct.2021.113785 [Google Scholar] [CrossRef]
4. Ponzo, F. C., Antonio, D. C., Nicla, L., Nigro, D. (2021). Experimental estimation of energy dissipated by multistorey post-tensioned timber framed buildings with anti-seismic dissipative devices. Sustainable Structures, 1(2), 000007. https://doi.org/10.54113/j.sust.2021.000007 [Google Scholar] [CrossRef]
5. Su, J. W., Li, H. T., Xiong, Z. H., Lorenzo, R. (2021). Structural design and construction of an office building with laminated bamboo lumber. Sustainable Structures, 1(2), 000010. https://doi.org/10.54113/j.sust.2021.000010 [Google Scholar] [CrossRef]
6. Li, H., Wang, L. B., Wei, Y., Wang, B. J. (2022). Off-axis compressive behavior of cross-laminated bamboo and timber wall elements. Structures, 35(3), 452–468. https://doi.org/10.1016/j.istruc.2021.11.009 [Google Scholar] [CrossRef]
7. Tulebekova, S., Malo, K. A., Rønnquist, A., Nåvik, P. (2022). Modeling stiffness of connections and non-structural elements for dynamic response of taller glulam timber frame buildings. Engineering Structures, 265, 114209. https://doi.org/10.1016/j.engstruct.2022.114209 [Google Scholar] [CrossRef]
8. Wang, R. S., Chen, Y. L., Chen, C. (2019). Study on the development strategies of modern timber buildings in China. China Forest Products Industry, 56(9), 1–5. https://doi.org/10.19531/j.issn1001-5299.201909001 [Google Scholar] [CrossRef]
9. Naud, N., Sorelli, L., Salenikovich, A., Cuerrier-Auclair, S. (2019). Hide details fostering GLULAM-UHPFRC composite structures for multi-storey buildings. Engineering Structures, 188(10), 406–417. https://doi.org/10.1016/j.engstruct.2019.02.049 [Google Scholar] [CrossRef]
10. Xiao, J. Z., Liu, H. R., Ding, T., Ma, G. W. (2021). 3D printed concrete components and structures: An overview. Sustainable Structures, 1(2), 000006. https://doi.org/10.54113/j.sust.2021.000006 [Google Scholar] [CrossRef]
11. Liang, R. F., Hota, G. (2021). Development and evaluation of load-bearing fiber reinforced polymer composite panel systems with tongue and groove joints. Sustainable Structures, 1(2), 000008. https://doi.org/10.54113/j.sust.2021.000008 [Google Scholar] [CrossRef]
12. Li, Z., Luo, J., He, M. J., Tao, D., Liang, F. et al. (2021). Seismic performance of multi-story glulam post-and-beam structures reinforced with knee-braces. Journal of Building Engineering, 44(1), 102887. https://doi.org/10.1016/j.jobe.2021.102887 [Google Scholar] [CrossRef]
13. He, M. J., Sun, X. F., Li, Z. (2020). Seismic performance study and design method summary for multi-storey timber structures. Building Structure, 50(5), 1–6. https://doi.org/10.19701/j.jzjg.2020.05.001 [Google Scholar] [CrossRef]
14. Wang, Z. H., Ghanem, R. (2021). An extended polynomial chaos expansion for PDF characterization and variation with aleatory and epistemic uncertainties. Computer Methods in Applied Mechanics and Engineering, 382(1–4), 113854. https://doi.org/10.1016/j.cma.2021.113854 [Google Scholar] [CrossRef]
15. Wang, Z. H., Ghanem, R. (2022). A functional global sensitivity measure and efficient reliability sensitivity analysis with respect to statistical parameters. Computer Methods in Applied Mechanics and Engineering, 55(1–3), 115175. https://doi.org/10.1016/j.cma.2022.115175 [Google Scholar] [CrossRef]
16. Peng, Y. B., Wang, Z. H., Ai, X. Q. (2018). Wind-induced fragility assessment of urban trees with structural uncertainties. Wind & Structures, 26(1), 45–56. https://doi.org/10.12989/was.2018.26.1.045 [Google Scholar] [CrossRef]
17. Meng, X. M., Zhang, D. B., Feng, P., Hu, N. (2021). Review on mechanical behavior of solar cells for building integrated photovoltaics. Sustainable Structures, 1(2), 000009. https://doi.org/10.54113/j.sust.2021.000009 [Google Scholar] [CrossRef]
18. Pereira, E., Díaz, I. M., Hudson, E. J., Reynolds, P. (2014). Optimal control-based methodology for active vibration control of pedestrian structure. Engineering Structures, 80(6), 153–162. https://doi.org/10.1016/j.engstruct.2014.08.046 [Google Scholar] [CrossRef]
19. Zhou, H. B., Jiang, Z. H., Fei, B. H., Ren, H. Q. (2008). Evolution of design criteria to prevent vibration in wood frame floor. Scientia Silvae Sinicae, 44(6), 143–147. https://doi.org/10.11707/j.1001-7488.20080624 [Google Scholar] [CrossRef]
20. Reynolds, T., Casagrande, D., Tomasi, R. (2016). Comparison of multi-storey cross-laminated timber and timber frame buildings by in situ modal analysis. Construction and Building Materials, 102(8), 1009–1017. https://doi.org/10.1016/j.conbuildmat.2015.09.056 [Google Scholar] [CrossRef]
21. Casagrande, D., Giongo, I., Pederzolli, F., Franciosi, A., Piazza, M. (2018). Analytical, numerical and experimental assessment of vibration performance in timber floors. Engineering Structures, 168(21), 748–758. https://doi.org/10.1016/j.engstruct.2018.05.020 [Google Scholar] [CrossRef]
22. Jarnerö, K., Brandt, A., Olsson, A. (2015). Vibration properties of a timber floor assessed in laboratory and during construction. Engineering Structures, 82(3), 44–54. https://doi.org/10.1016/j.engstruct.2014.10.019 [Google Scholar] [CrossRef]
23. Setareh, M. (2010). Vibration serviceability of a building floor structure. I: Dynamic testing and computer modeling. Journal of Performance of Constructed Facilities, 24(6), 497–507. https://doi.org/10.1061/(ASCE)CF.1943-5509.0000134 [Google Scholar] [CrossRef]
24. Shahnewaz, M., Dickof, C., Zhou, J. H., Tannert, T. (2022). Vibration and flexural performance of cross-laminated timber-glulam composite floors. Composite Structures, 292(3), 115682. https://doi.org/10.1016/j.compstruct.2022.115682 [Google Scholar] [CrossRef]
25. Weckendorf, J., Toratti, T., Smith, I., Tannert, T. (2016). Vibration serviceability performance of timber floors. European Journal of Wood and Wood Products, 74(3), 353–367. https://doi.org/10.1007/s00107-015-0976-z [Google Scholar] [CrossRef]
26. Wang, Y. L. (2018). Vibration performance test and analysis of the prefabricated timber buildings floor structure (Master Thesis). College of Materials Science and Engineering, Nanjing Forestry University, Nanjing. [Google Scholar]
27. Hudson, M. J., Reynolds, P. (2012). Implementation considerations for active vibration control in the design of floor structures. Engineering Structures, 44(28–30), 334–358. https://doi.org/10.1016/j.engstruct.2012.05.034 [Google Scholar] [CrossRef]
28. Zhang, B. S., Rasmussen, B., Jorissen, A., Harte, A. (2013). Comparison of vibrational comfort assessment criteria for design of timber floors among the European countries. Engineering Structures, 52(4), 592–607. https://doi.org/10.1016/j.engstruct.2013.03.028 [Google Scholar] [CrossRef]
29. Xiong, H. B., Kang, J. H., Lu, X. L. (2011). Field testing and investigation of the dynamic performance and comfort of timber floors. Journal of Asian Architecture and Building Engineering, 10(2), 407–412. https://doi.org/10.3130/jaabe.10.407 [Google Scholar] [CrossRef]
30. Ding, Y. W., Zhang, Y. F., Wang, Z., Gao, Z. Z., Zhang, T. Y. et al. (2020). Vibration test and comfort analysis of environmental and impact excitation for wooden floor structure. BioResources, 15(4), 8212–8234. https://doi.org/10.15376/biores.15.4.8212-8234 [Google Scholar] [CrossRef]
31. Ray, C., Joseph, P. (2006). Dynamics of structures. Beijing, China: Higher Education Press. [Google Scholar]
32. Ellingwood, B., Tallin, A. (1984). Structural serviceability: Floor vibrations. Journal of Structural Engineering, 110(2), 401–418. https://doi.org/10.1061/(ASCE)0733-9445(1984)110:2(401) [Google Scholar] [CrossRef]
33. Dolan, J. D., Murray, T. M., Johnson, J. R., Runte, D., Shue, B. C. (1999). Preventing annoying wood floor vibrations. Journal of Structural Engineering, 125(1), 19–24. https://doi.org/10.1061/(ASCE)0733-9445(1999)125:1(19) [Google Scholar] [CrossRef]
Cite This Article
 Copyright © 2023 The Author(s). Published by Tech Science Press.
This work is licensed under a Creative Commons Attribution 4.0 International License , which permits unrestricted use, distribution, and reproduction in any medium, provided the original work is properly cited.
 Downloads
 Citation Tools