
 Submit a Paper
 Propose a Special lssue
 Open Access
ARTICLE

Application of Wavelength Selection Combined with DS Algorithm for Model Transfer between NIR Instruments
1 College of Light Industry and Food Engineering, Nanjing Forestry University, Nanjing, 210037, China
2 Institute of Chemical Industry of Forest Products, Chinese Academy of Forestry, Nanjing, 210042, China
* Corresponding Author: Zhixin Xiong. Email:
(This article belongs to the Special Issue: Process and Engineering of Lignocellulose Utilization)
Journal of Renewable Materials 2023, 11(6), 2713-2727. https://doi.org/10.32604/jrm.2023.025817
Received 01 August 2022; Accepted 17 October 2022; Issue published 27 April 2023
 View Full Text
 Download PDF
Abstract
This study aims to realize the sharing of near-infrared analysis models of lignin and holocellulose content in pulp wood on two different batches of spectrometers and proposes a combined algorithm of SPA-DS, MCUVE-DS and SiPLS-DS. The Successive Projection Algorithm (SPA), the Monte-Carlo of Uninformative Variable Elimination (MCUVE) and the Synergy Interval Partial Least Squares (SiPLS) algorithms are respectively used to reduce the adverse effects of redundant information in the transmission process of the full spectrum DS algorithm model. These three algorithms can improve model transfer accuracy and efficiency and reduce the manpower and material consumption required for modeling. These results show that the modeling effects of the characteristic wavelengths screened by the SPA, MCUVE and SiPLS algorithms are all greatly improved compared with the full-spectrum modeling, in which the SPA-PLS result in the best prediction with RPDs above 6.5 for both components. The three wavelength selection methods combined with the DS algorithm are used to transfer the models of the two instruments. Among them, the MCUVE combined with the DS algorithm has the best transfer effect. After the model transfer, the RMSEP of lignin is 0.701, and the RMSEP of holocellulose is 0.839, which was improved significantly than the full-spectrum model transfer of 0.759 and 0.918.Keywords
Holocellulose (including cellulose and hemicellulose) and lignin are the main components of wood, and they are closely related to other properties of wood, along with its processing and utilization of it. In the paper industry, the content of holocellulose is closely related to wood pulp yield and quality, while the content of lignin is an important basis for formulating cooking and bleaching process conditions [1]. Near-infrared spectroscopy (NIRS) is a simple and fast new analytical method. With the continuous improvement of NIRS instruments, the application of chemometrics and the rapid development of computers, NIRS technology is widely used in petroleum, forestry, chemical, food and other industries [2,3]. The absorption of NIR spectral radiation is mainly caused by overtones and combinatorial bands of the fundamental stretching vibrations of O-H, C-H and N-H, which represents the main chemical bonds in biological compounds. Mathematical methods were used to construct calibrated models combining NIR spectral data and chemical component content for accurate quantitative prediction of lignin content in rice and wood [4]. Establishing a good NIRS model required a sufficient amount of sample data to optimize the method and model parameters, and the maintenance of the model required continuous investment of material resources. Therefore, it is usually assumable that the established NIRS model can be shared among different instruments [5,6]. However, the spectral response of the same sample on different instruments of the same model is not exactly the same under the same test conditions due to the different operating environments and lifetime of each instrument. As a result, the prediction error of the NIRS model built on the master instrument for the target samples may be out of the allowed range, and various model transfer methods are needed to correct the target spectra or the master model [7–9].
In recent years, many scholars have carried out a large number of model transfer studies on model sharing between different instruments, most of which are standard sample algorithms [10]. These algorithms need to select a certain number of samples to form a standard set, such as Slope/Bias algorithm (S/B) [11], Direct Standardization algorithm (DS) [12,13] and Piecewise Direct Standardization (PDS) [14]. However, due to the relatively stable storage and detection environment, the near-infrared spectrometer used in the laboratory has high wavelength accuracy and wide wavelength range, and the collected spectrum contains too much information. These collected sample spectral data inevitably contain a lot of redundant information [15], which is mixed with the component information to be measured, leading to slow modeling and poor robustness and applicability of the model. Therefore, if the characteristic wavelengths can be extracted for the components to be measured and the redundant information in the spectrum can be removed. It can not only improve the operation speed but also improve the robustness and adaptability of the transmission and prediction of the near-infrared analysis model [16]. At present, many scholars have carried out research on the problem of characteristic wavelength selection. The commonly used wavelength selection algorithms include correlation analysis (CA) [17], analysis of variance (AOV) [18], Successive Projection Algorithm (SPA) [19], Monte-Carlo of Uninformative Variable Elimination (MCUVE) [20,21], Synergy Interval Partial Least Squares (SiPLS) [22] et al. In recent years, many scholars have also published literature on model transfer combined with wavelength selection algorithm [23] and found that after wavelength selection not only can remove redundant variables and increase the stability of the model, but also can prevent over-correction problems in model transfer algorithms. Therefore, this paper studies the transfer effect of SPA, MCUVE and SiPLS wavelength selection methods combined with DS algorithm between these two instruments and compares the transfer effect with that of DS algorithm alone. The optimization strategy for sharing the near-infrared analysis models of lignin and holocellulose among different instruments provides a method reference for the application of near-infrared spectroscopy detection technology in the rapid determination of pulpwood properties.
2.1.1 Sample Preparation and Analysis of Holocellulose and Lignin Content
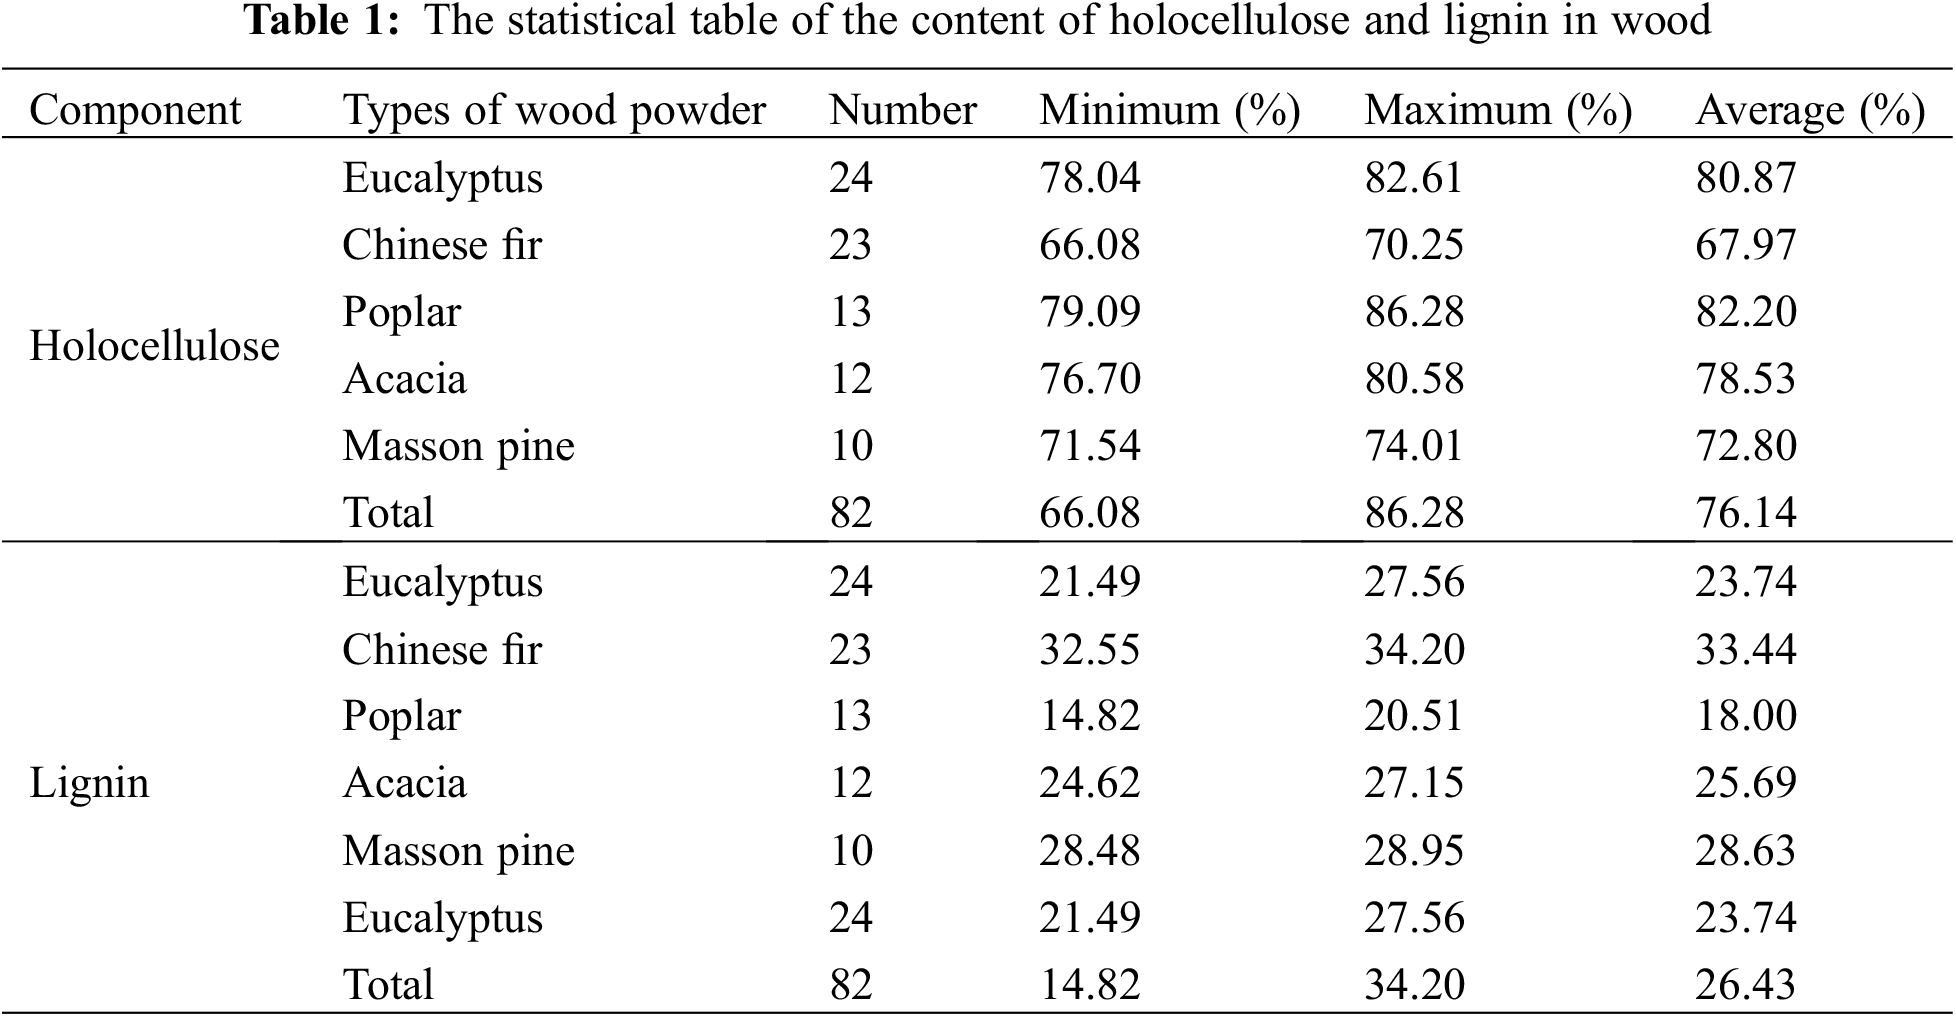
The wood powder samples used in the experiments were provided by the Institute of Chemical Industry of Forest Products, Chinese Academy of Forestry (China), with a total of 82 log samples and their holocellulose and lignin content values. The logs were cut into wood chips and ground, and then the wood powder samples with a particle size of 0.250 to 0.425 mm (40 to 60 mesh) were selected to determine their holocellulose and lignin content according to GB/T2677 (1994). The results are shown in Table 1.
2.1.2 Instrumentation and Spectral Acquisition
The experiment employed two S450 near-infrared spectrometers produced by Shanghai Lengguang Technology Co., Ltd. (China), one of which was a new instrument (target) that had just been debugged by the company, and the other was an old instrument (master) used for two years. The old and new instruments were shown in Fig. 1. This type of instrument was a grating scanning near-infrared spectrometer, using an indium gallium arsenide detector with a wavelength range of 900 to 2500 nm, a wavelength interval of 1 nm, and a total of 1601 wavelength points. The biggest difference between the two instruments was the production time. One of the instruments was older and has the problem of aging parts compared to the new instrument. Therefore, although the factory design and structure of the instruments were exactly the same, the models cannot be directly shared.
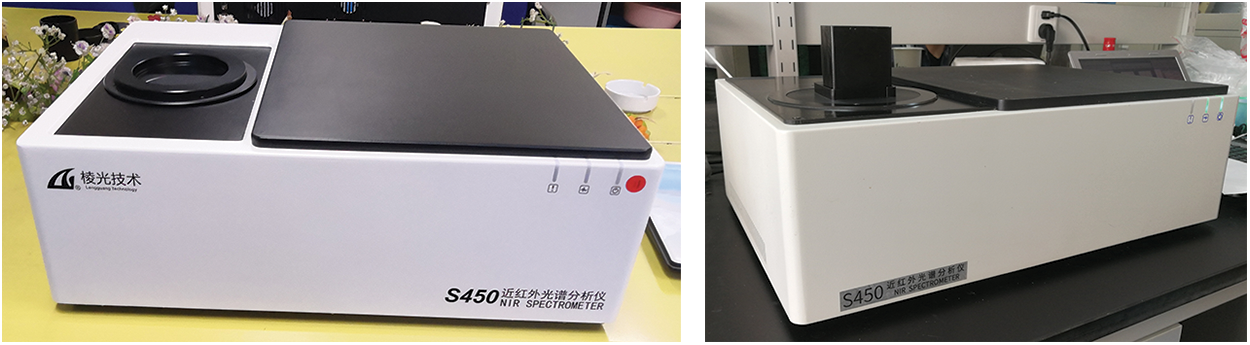
Figure 1: The physical picture of S450 (left: new target; right: old master)
Spectral collection was performed on the prepared wood powder samples on two Benchtop NIR Spectrometers. When collecting samples, the samples were placed in a measuring cup and flattened with a 50 g weight to make them evenly distributed. Normally each sample was repeatedly loaded several times to take the average spectrum as the measured results. After scanning a sample, use a brush was used to remove the residual wood powder in the sample cup so as not to avoid adverse effects on the accuracy of subsequent sample spectrum collection. Since the S450 near-infrared spectrometer was equipped with a rotating table, repeated sample loading steps can be omitted. Each sample was rotated and measured 6 times, and the average spectrum was taken as the final sample spectrum. The spectral comparison of the two instruments is shown in Fig. 2.
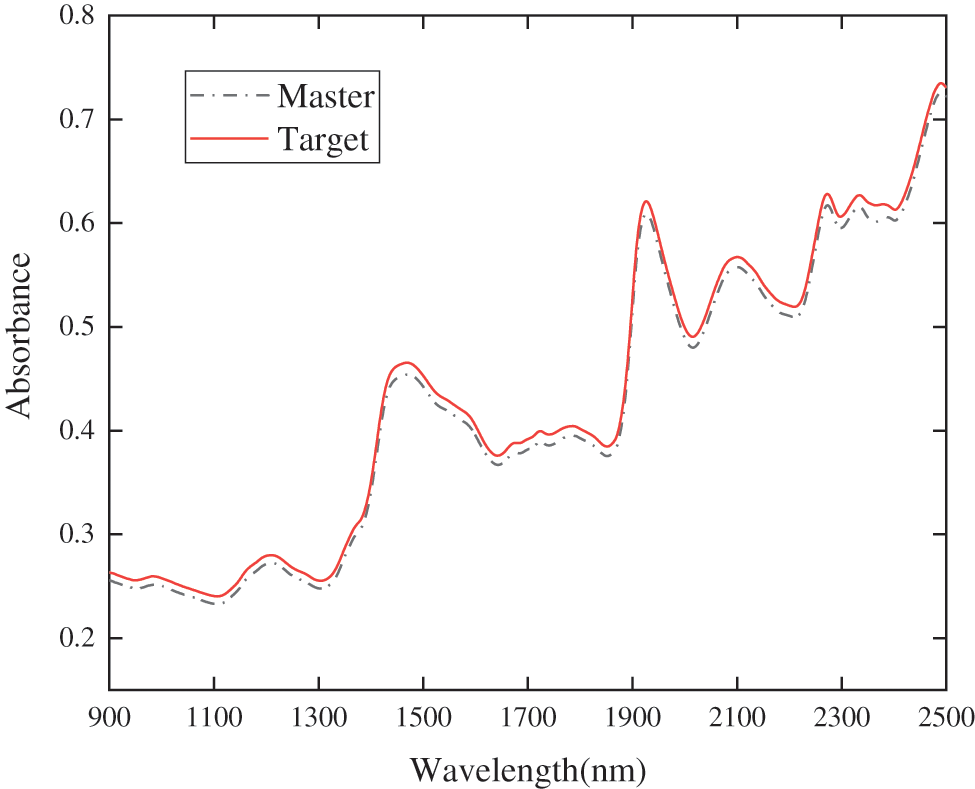
Figure 2: Comparison of two S450 spectrometers
2.2.1 SPA, MCUVE and SiPLS Wavelength Selection Algorithm
The successive projection algorithm (SPA) is a forward cyclic variable selection method [19]. Starting from a selected wavelength, the projection on the unselected wavelength is calculated in each cycle, and the wavelength with the largest projection vector is introduced into the wavelength combination. Each newly selected wavelength has the smallest linear relationship with the previous one. In the wavelength selection, it is assumed that n is the initial number of wavelengths, m is the number of wavelength points, and k(0) is the initial wavelength point. The steps of SPA calculation are as follows:
Before the start of the first iteration (Z = 1), choose any column of the wavelength vector Xj in the spectral matrix denoted as
The set of unselected column vector positions is denoted as S.
Calculate the projection of the remaining column vector
Extraction of the largest projection values of the wavelength variables ordinate.
Let
The Monte Carlo uninformative variable elimination (MCUVE) algorithm [20] combines the Monte Carlo algorithm with the uninformative variable elimination (UVE) algorithm, inheriting the idea of the UVE algorithm, and using the MC technique in the algorithm instead of the leave-one-out method for cross-validation. The specific calculation steps are as follows.
The matrix is randomly sampled n times by the MC method, N PLS models are established, and the regression coefficient bij of the jth variable of the ith model is calculated, where i = 1, 2, …, p, the expectation of recording the regression coefficient of the jth variable is bj and the variance is D(bj).
The importance of the variable is defined using the UVE method and the importance indicator S is calculated for the jth variable.
Among them, mean(bj) and std(bj) represent the mean and variance of variable j in the nth regression model, respectively.
Arrange the p variables according to the absolute value of the importance index S from large to small, and define a threshold which is less than the threshold value variables are excluded as uninformative variables, and the size of the threshold is determined by the RMSEP of the prediction set.
The basic idea of the Synergy intervals PLS (SiPLS) algorithm [22] is to divide the full spectrum band into several intervals, then by combining the intervals, the partial least squares modeling is performed on the combined intervals, and the optimal combination band is screened out according to the prediction results.
2.2.2 Direct Standardization Algorithm (DS)
An important development in the multivariate model transfer is direct standardization (DS), which relates the spectra Am measured on the master instrument to the spectra At measured on the target instrument by the transformation matrix F.
The transformation matrix F is estimated as
where A+t is the generalized inverse of At.
Once F is calculated, the spectrum of a new, unknown sample (Xunknown), measured on the target instrument, can be projected to the master instrument space, and then the property values can be predicted by the old model.
2.3 Modeling and Model Evaluation Methods
The modeling method in this study is the partial least square regression (PLSR) algorithm, and the interactive verification adopts the leave-one-out method [24]. The correlation coefficient (R), corrected standard deviation (RMSECV), predicted standard deviation (RMSEP), Akaike Information Criterion (AIC) and relative standard deviation (RPD) were used for comprehensive evaluation. Among them, the closer the correlation coefficient (R) is to 1, the better the regression or prediction results of the model. The smaller the RMSECV and RMSEP, the better the model effect is; RPD is used to verify the stability and predictive ability of the model, and RPD > 3 indicates that the model has high stability and good predictive ability [25,26]. AIC [27] is defined as
where n is the number of samples; p is the number of features of the sample, that is, the number of variables involved in the transfer of the model. The smaller the value of AIC, the more simplified the model, and the higher the transfer efficiency of the model.
3.1 Establishment of Master Model and Selection of Characteristic Wavelength
Due to the large number of wavelength points of the sample spectrum collected by S450 spectrometers, the use of full spectrum results in slower speed and more irrelevant information on whether to build an analysis model or transfer the model. The wavelength selection algorithm was used to select characteristic wavelengths for different components and remove redundant wavelengths, which can not only speed up the establishment of the analysis model but also improve the prediction accuracy of the model. Therefore, this study used SPA, MCUVE, SiPLS algorithms combined with DS method to conduct model transfer research, the results were compared with the full-spectrum model transfer prediction results.
3.1.1 Establishment of the Full Spectrum Model
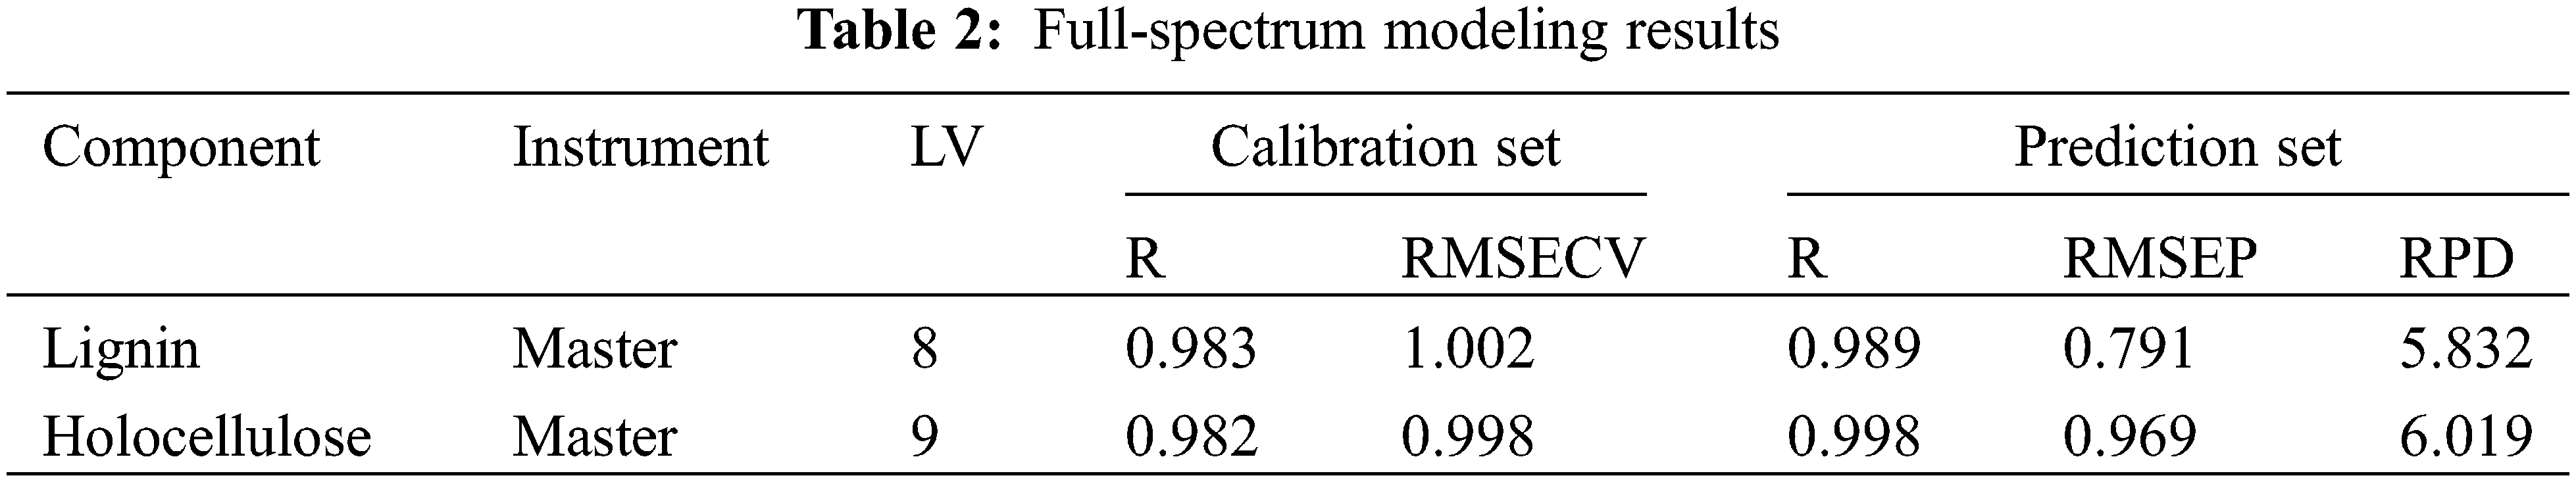
The 82 wood powder samples used in this study required the elimination of one spectrum with excessive noise due to measurement problems before dividing the correction set and prediction set. The SPXY algorithm [28,29] was used to divide the remaining 81 sample sets into a calibration set containing 61 samples and a prediction set of 20 samples, which was used for the establishment of the quantitative analysis model. The calibration set and prediction set samples of the master and the target corresponds one by one. The 61 calibration set sample spectra were preprocessed by MSC combined with 5-point MAF method to eliminate useless information, such as noise in the acquisition process [30,31]. The appropriate latent variables (LV) were selected by leave-one-out cross-validation to establish the PLS quantitative analysis model of lignin and holocellulose, respectively, and the following modeling was based on this method. The performance of the master to establish the quantitative analysis model of lignin and holocellulose and the prediction results of the master prediction set samples are shown in Table 2.
3.1.2 SPA, MCUVE and SiPLS Wavelength Selection Results
The SPA algorithm selected wavelengths for the two components of lignin and holocellulose respectively, and the threshold was set to select at least 10 wavelength points and at most 100 wavelength points. Based on the principle of minimum predicted RMSEP, 13 and 19 wavelength points were finally selected for lignin and holocellulose, respectively. The selected wavelength positions are shown in Fig. 3.
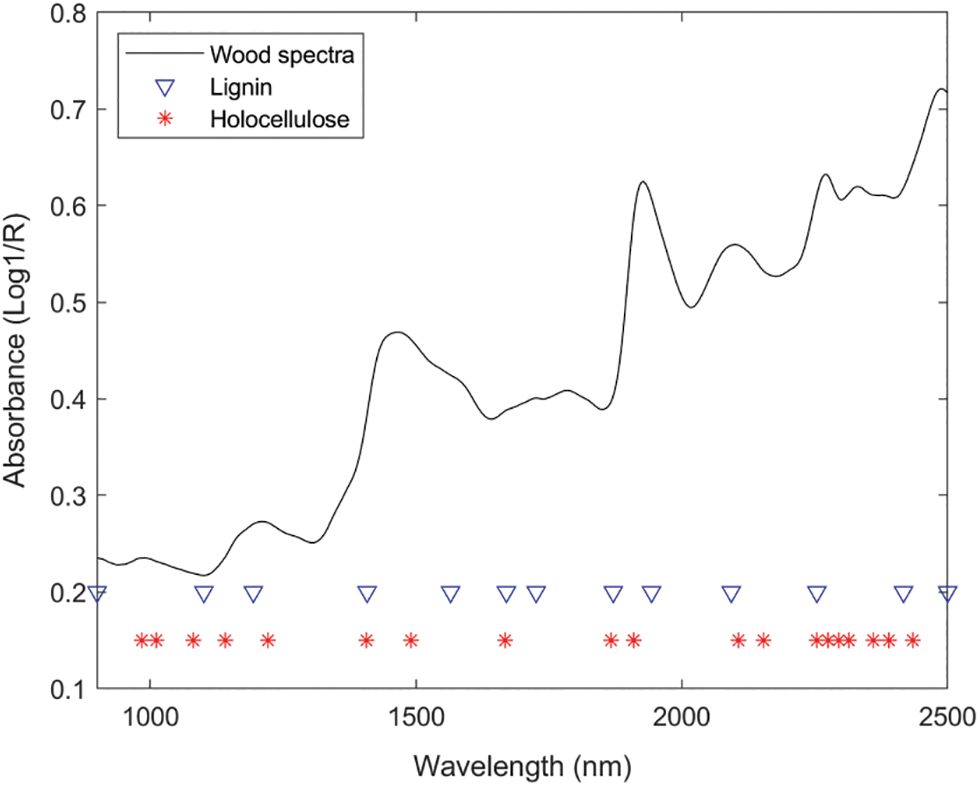
Figure 3: The optimal variables obtained from SPA
The MCUVE algorithm set the number of Monte Carlo simulations to 1000 times and used the minimum predicted RMSEP as the standard to select the wavelengths for lignin and holocellulose respectively. Finally, 607 wavelengths were selected for lignin and 639 wavelengths for holocellulose. The wavelengths selected for the two components are shown in Fig. 4.
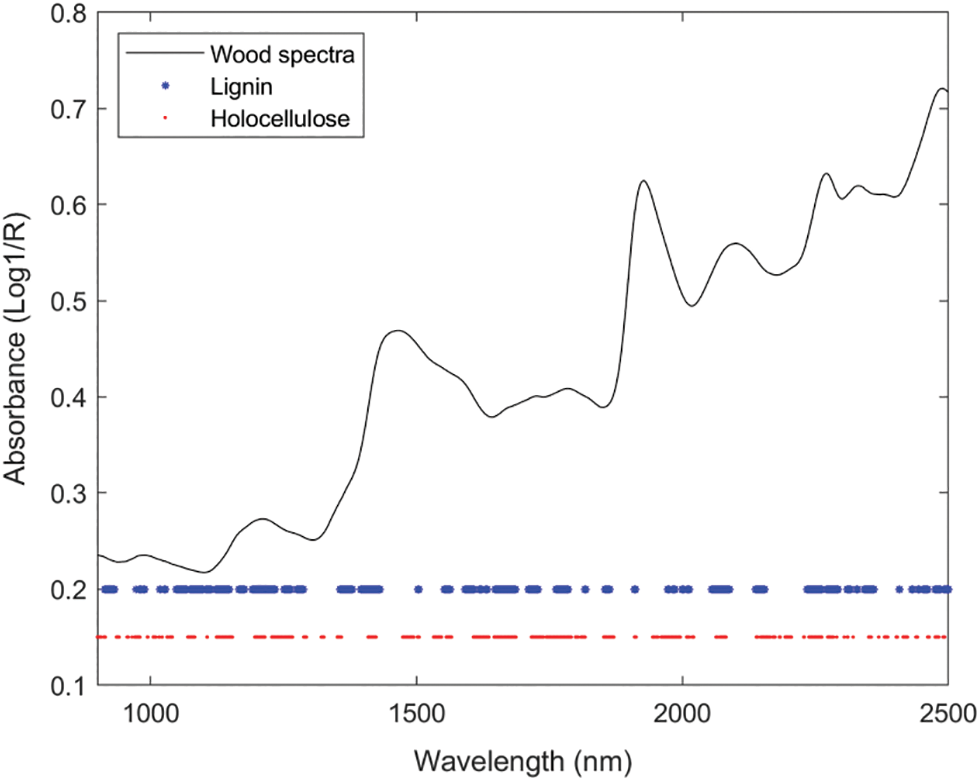
Figure 4: The optimal variables obtained from MCUVE
Different from the previous two characteristic wavelength selection methods, SiPLS was selected for the wavelength band. According to the principle of minimum RMSEP, the following best results were obtained for the two components respectively, after multiple parameter settings. For both the band selection of lignin and holocellulose, the spectral interval was divided into 16, and 4 intervals were selected for combination. When the cross-validation number was 6, a total of 400 wavelength points in the 4th, 5th, 8th, and 14th intervals were selected for lignin. The combination interval had the best prediction effect, the specific bands are shown in Fig. 5. For the best result of the selection of the holocellulose band, the spectrum was divided into 16 intervals, and 4 intervals were selected, and the cross-validation number was 7, and the best prediction result was chosen for intervals 8, 11, 12, and 14, which contain 400 wavelength points in the combination of 4 intervals. The interval positions for holocellulose are shown in Fig. 6.
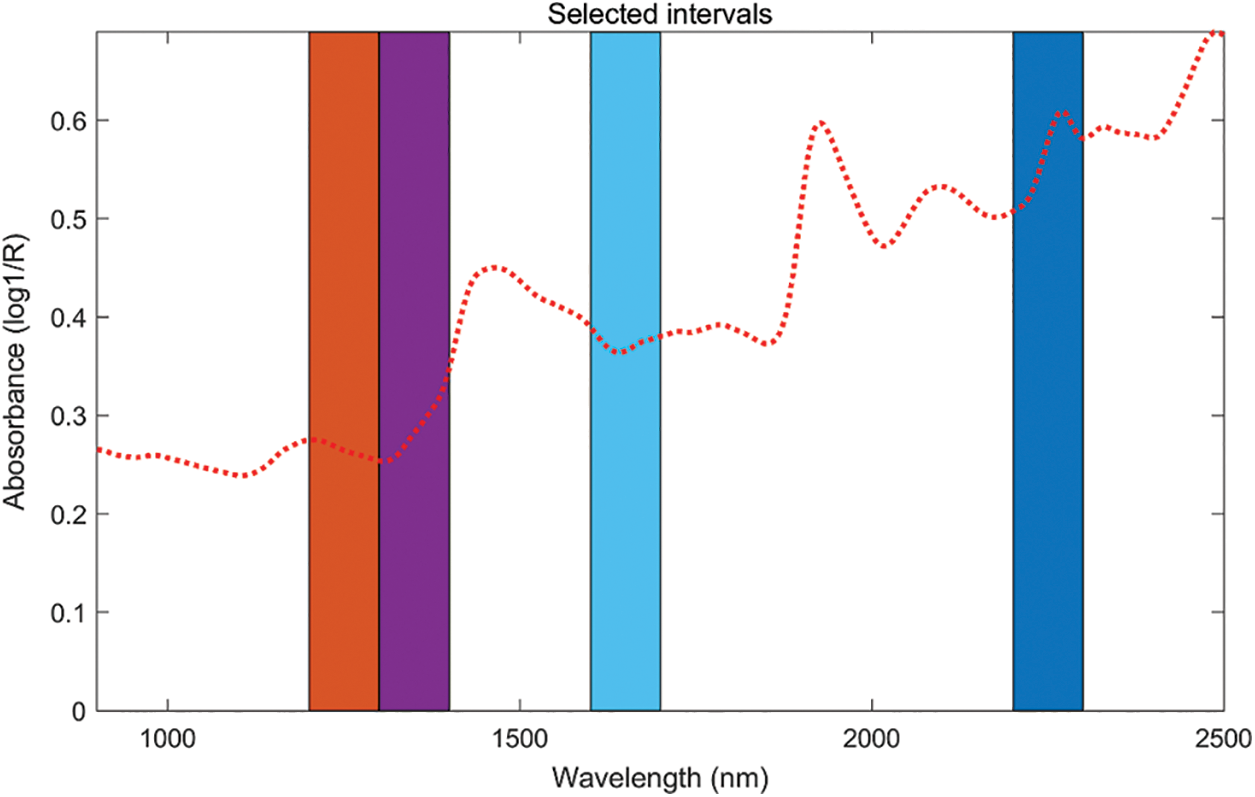
Figure 5: The selected intervals for lignin obtained from SiPLS
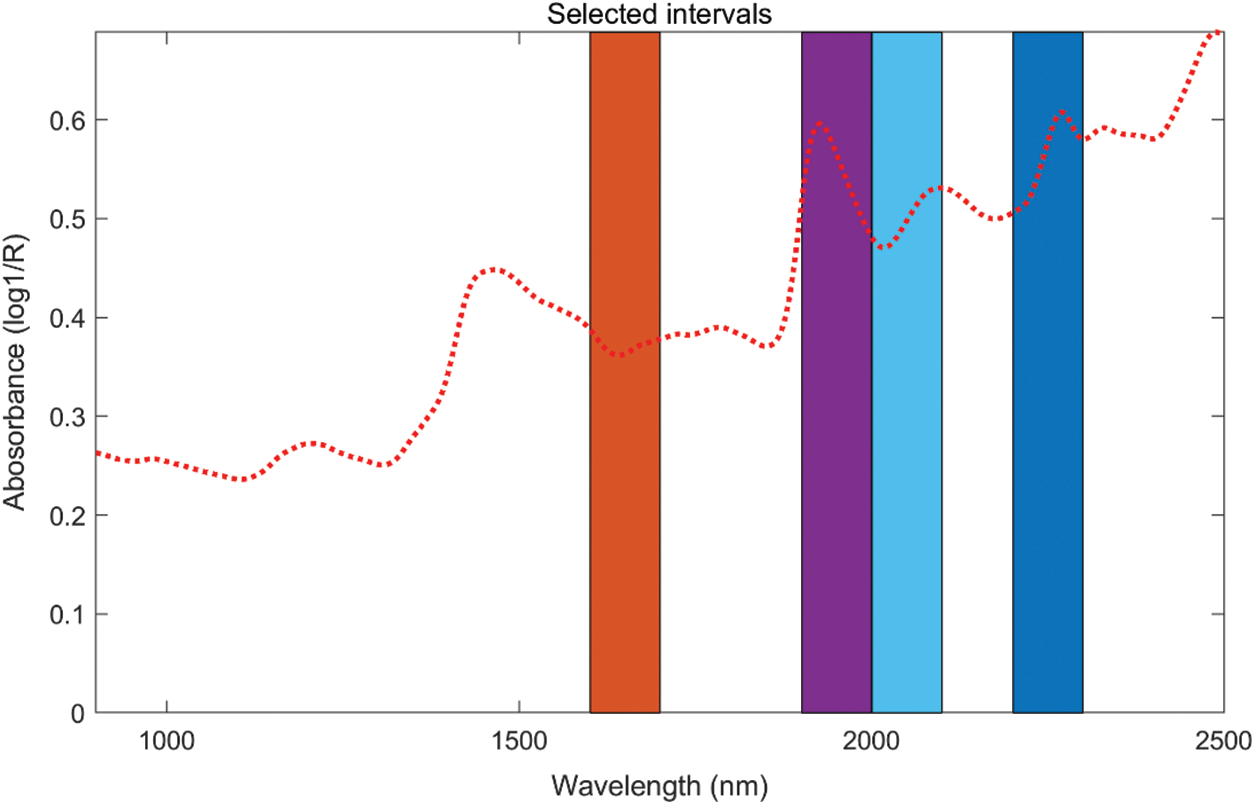
Figure 6: The selected intervals for holocellulose obtained from SiPLS
3.2 Modeling Results and Analysis of Three Algorithms of SPA, SiPLS, MCUVE
Figs. 7 and 8 show the comparison charts of characteristic wavelengths screened for lignin and holocellulose by three-wavelength selection methods, SPA, SiPLS, and MCUVE. The dotted line in Fig. 7 was the location of the characteristic functional groups of lignin [32]. It can be seen from Fig. 7 that there was secondary frequency doubling of C-H and aromatic C-H near 1170 nm, and both the SPA algorithm and the MCUVE algorithm could select this characteristic wavelength. Near 1410 and 1417 nm combined frequency of C-H, near 1680 nm contained the first-order frequency doubling of C-H and the absorption information of aromatic C-H, near 2200 nm combined frequency of C-H and C=O. Therefore, the main characteristic wavelengths for lignin could be selected by all three algorithms around these wavelength points.
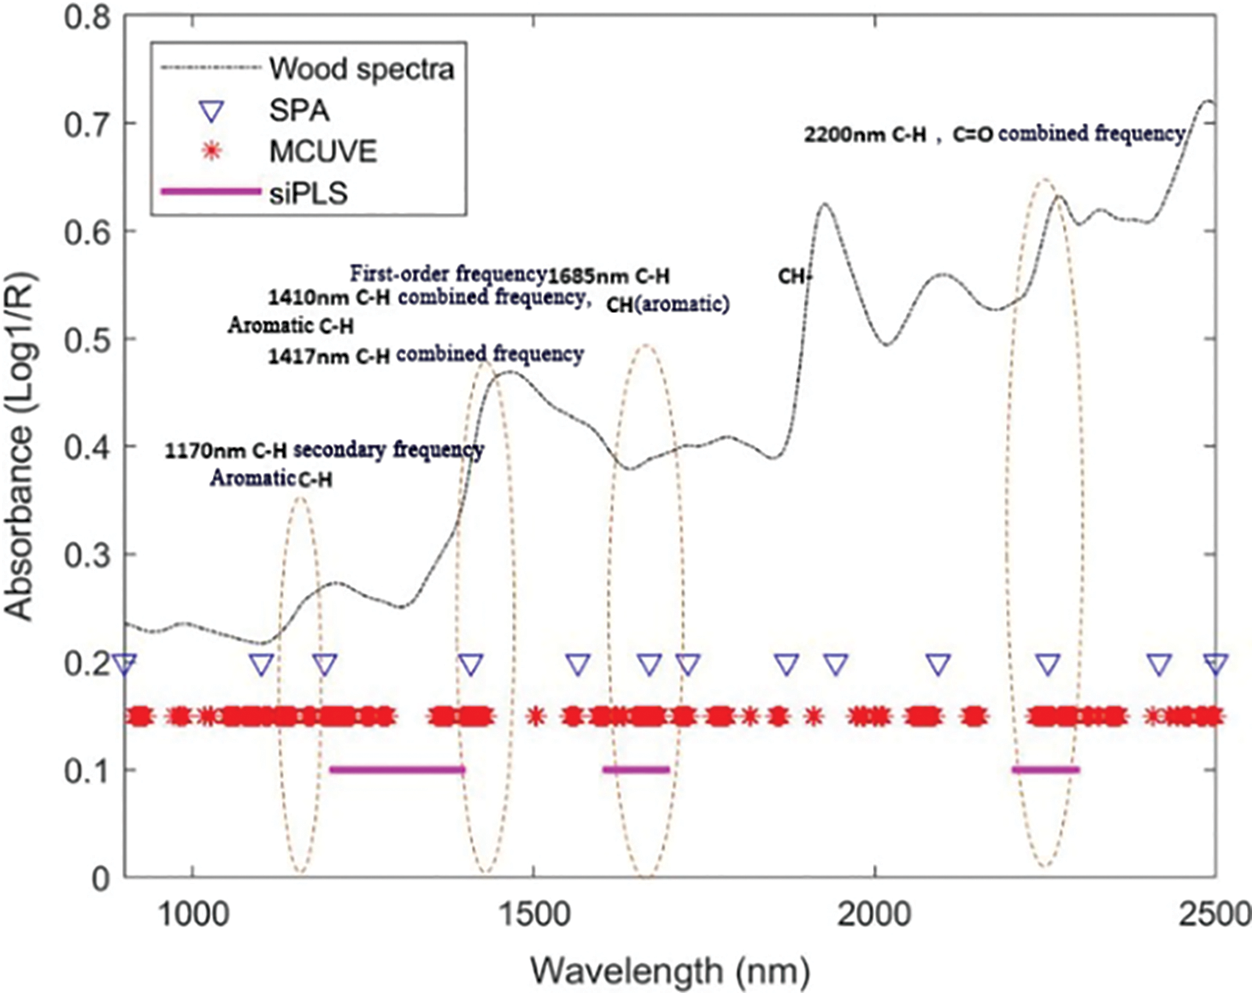
Figure 7: The optimal variables selected by SPA, MCUVE and SiPLS for the prediction of lignin
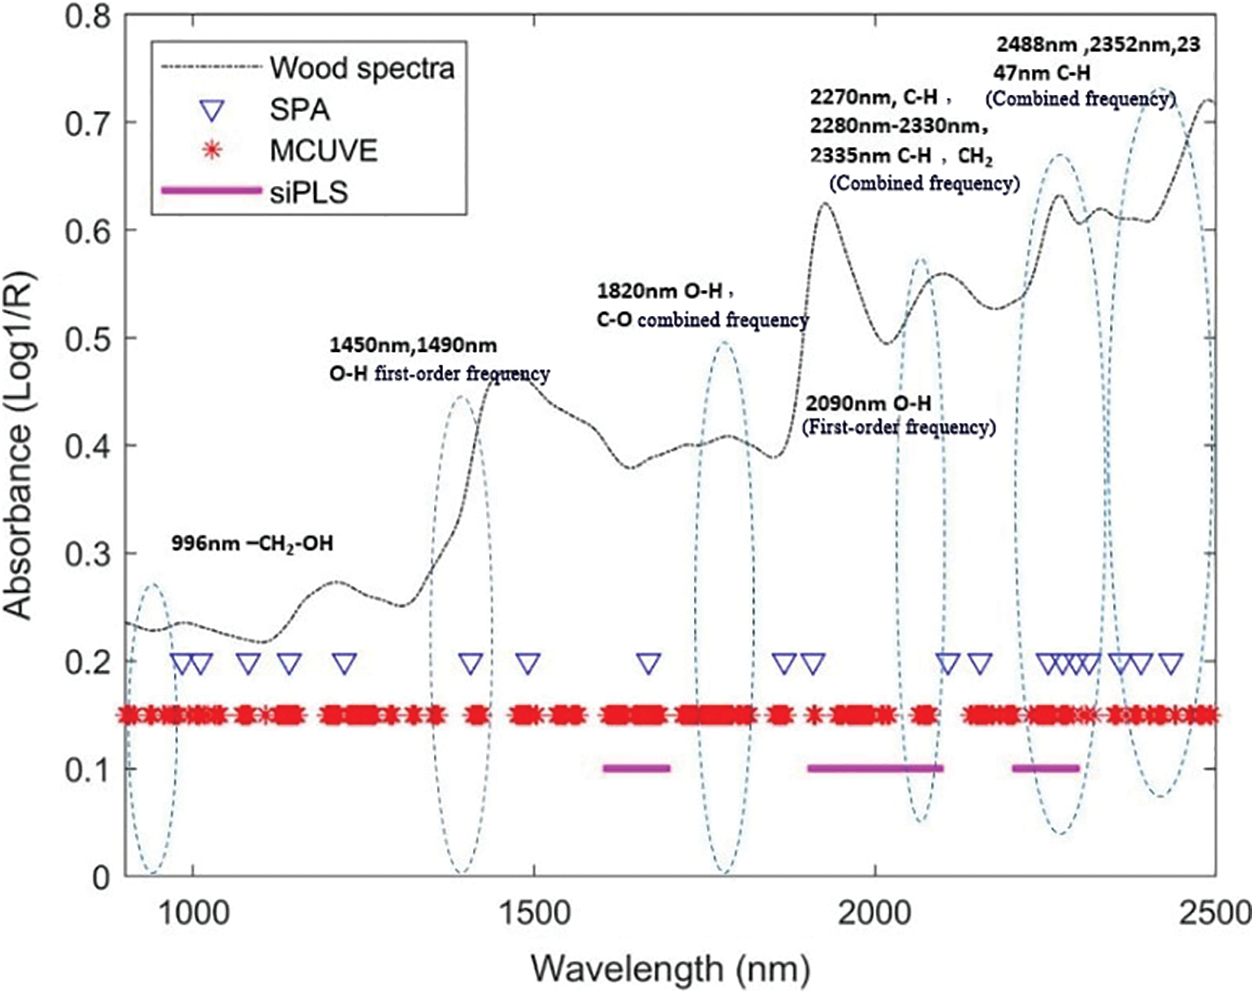
Figure 8: Comparison of the wavelengths selected by SPA, MCUVE and SiPLS for holocellulose
Fig. 8 shows the characteristic wavelengths selected by the three wavelength selection algorithms for the prediction of holocellulose. The dotted line in the figure was the position of the characteristic functional group of the holocellulose [33]. It can be seen from Fig. 8 that there was a second-order frequency doubling of O-H near 996 nm, a first-order frequency doubling of O-H near 1450 and 1490 nm, a combined frequency of O-H and C-O near 1820 nm, and C-H and C-C near 2347, 2355 and 2488 nm. These groups could be selected by SPA and MCUVE; the first-order frequency doubling of O-H near 2090 nm, C-H cellulose at 2270 nm, the combined frequency of C-H and CH2 near 2280–2330, 2335 nm. The characteristic wavelengths could be selected by all three algorithms for these functional group positions.
Table 3 shows the prediction comparison results of the three algorithms combined with PLS modeling and full spectrum modeling. It can be seen from Table 3 that the RPDs of the master model using these three algorithms and the full spectrum to predict the lignin and holocellulose content of the master samples are greater than 5.0, which indicates that the master model had good prediction performance. However, using SPA-PLS, SiPLS-PLS and MCUVE-PLS and the full-spectrum master model had poor prediction effects on the target samples directly, and the RPDs were all less than 2.5, which meant that although the master and target instruments had the same parts. The old instrument had some aging compared to the new instrument due to the different factory years, so the model transfer method was still needed to correct the differences between the two instruments.
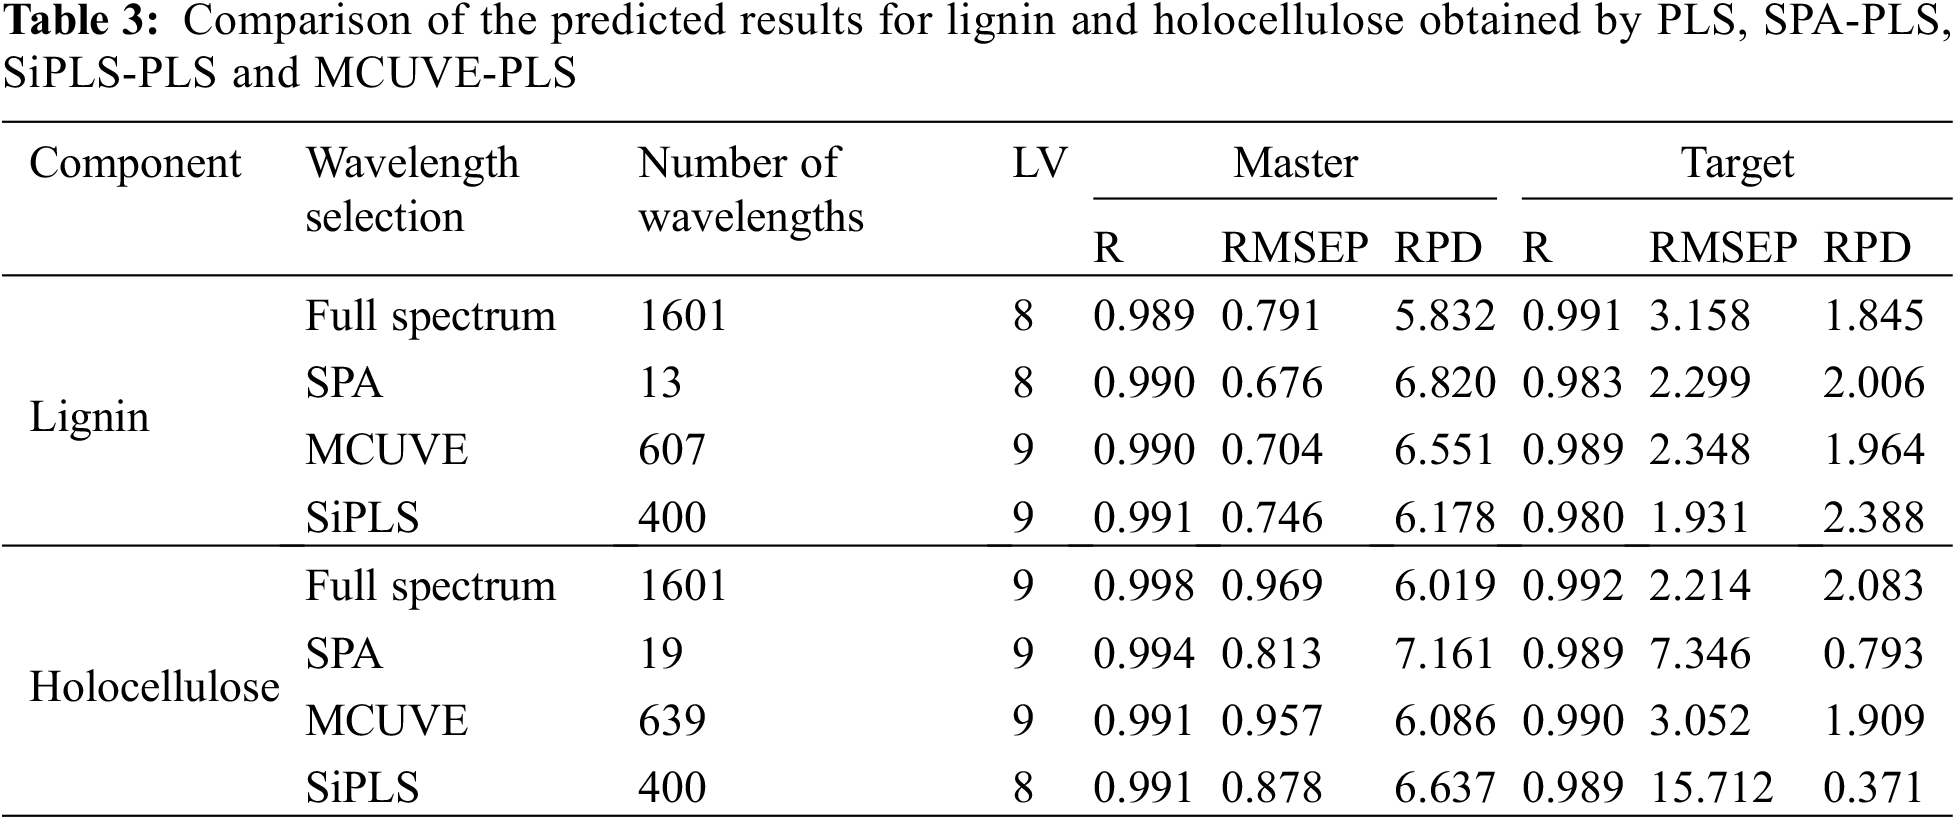
In terms of calculation principle, the SPA algorithm was based on the principle of selecting collinear minimum variables [34–36], which can greatly reduce redundant variables. Among the several wavelength selection algorithms, the SPA algorithm selected the fewest characteristic variables, 13 and 19 wavelength points were selected for lignin and holocellulose respectively, accounting for only 0.81% and 1.18% of the total spectral variables. And among several variable selection algorithms, SPA combined with PLS modeling had the best prediction effect on the master spectrum, the predicted RPD of the master spectrum for both components was greater than 6.0. This showed that the use of SPA for wavelength selection in the master modeling process can not only simplify the spectrum, but also maximize the retention of the characteristic wavelengths of the components to be measured, which greatly improved the prediction accuracy of the model. However, this model had a poor prediction effect on the target instrument. A model transfer algorithm was still required to correct for differences between instruments.
The MCUVE algorithm judged the reliability of the variable by calculating the stability value of the variable, the number of variables selected was related to the set standard [37]. In this study, 607 and 639 variables were selected for lignin and holocellulose, respectively, accounting for 37.91% and 39.91% of the total spectral variables, and the wavelength range of the characteristic functional groups of all the tested components could be selected. Compared with the full spectrum modeling, the prediction effect of MCUVE-PLS was greatly improved. However, due to a large number of wavelengths, redundant wavelengths will appear, so the prediction effect of the two components was slightly worse than that of the SPA algorithm. On the other hand, although requiring the model transfer due to its poor RPD, the MCUVE algorithm selected the largest number of wavelengths to establish a model for the master instrument, which generally also had the best prediction effect on the target and the relatively lower RMSEP meant that the model transfer was less difficult.
The SiPLS algorithm was different from the above two wavelength selection methods. Instead of selecting a single wavelength point, the spectrum was evenly divided the full spectral range into multiple bands, and then the bands were combined to establish a PLS model. With the minimum RMSEP as the standard, the optimal band combination was selected [38]. Therefore, the SiPLS method selected wavelength points in the band contained some irrelevant redundant variables, resulting in slightly worse prediction results than the SPA algorithm for the model built by this method and poor prediction results for the target instrument.
3.3 Model Transfer Results and Analysis of Holocellulose and Lignin Content in Pulp Wood
The two near-infrared instruments used in this study have high precision, a wide wavelength range, and small inter-instrument differences, which can be corrected by a simpler model transfer algorithm. However, the large wavelength range and a large number of wavelength points also lead to an increase in the amount of calculation, long operation time, and longer model transfer time. Therefore, before the model was transferred, several wavelength selection algorithms were used to simplify the variables of the master spectral data. The SPXY algorithm was used to select 10, 15, 20, 25, and 30 data from all the samples numbered correspondingly measured on the master instrument and two target instruments, respectively as the transfer set. Since the wavelength selection algorithm can eliminate the collinearity between wavelength points, the total number of wavelengths after wavelength selection was very small, it was not necessary to use the CCA and PDS algorithms, and a simple DS algorithm can be used to obtain a better model transfer effect. The prediction results of the master model for the target samples are shown in Table 4.
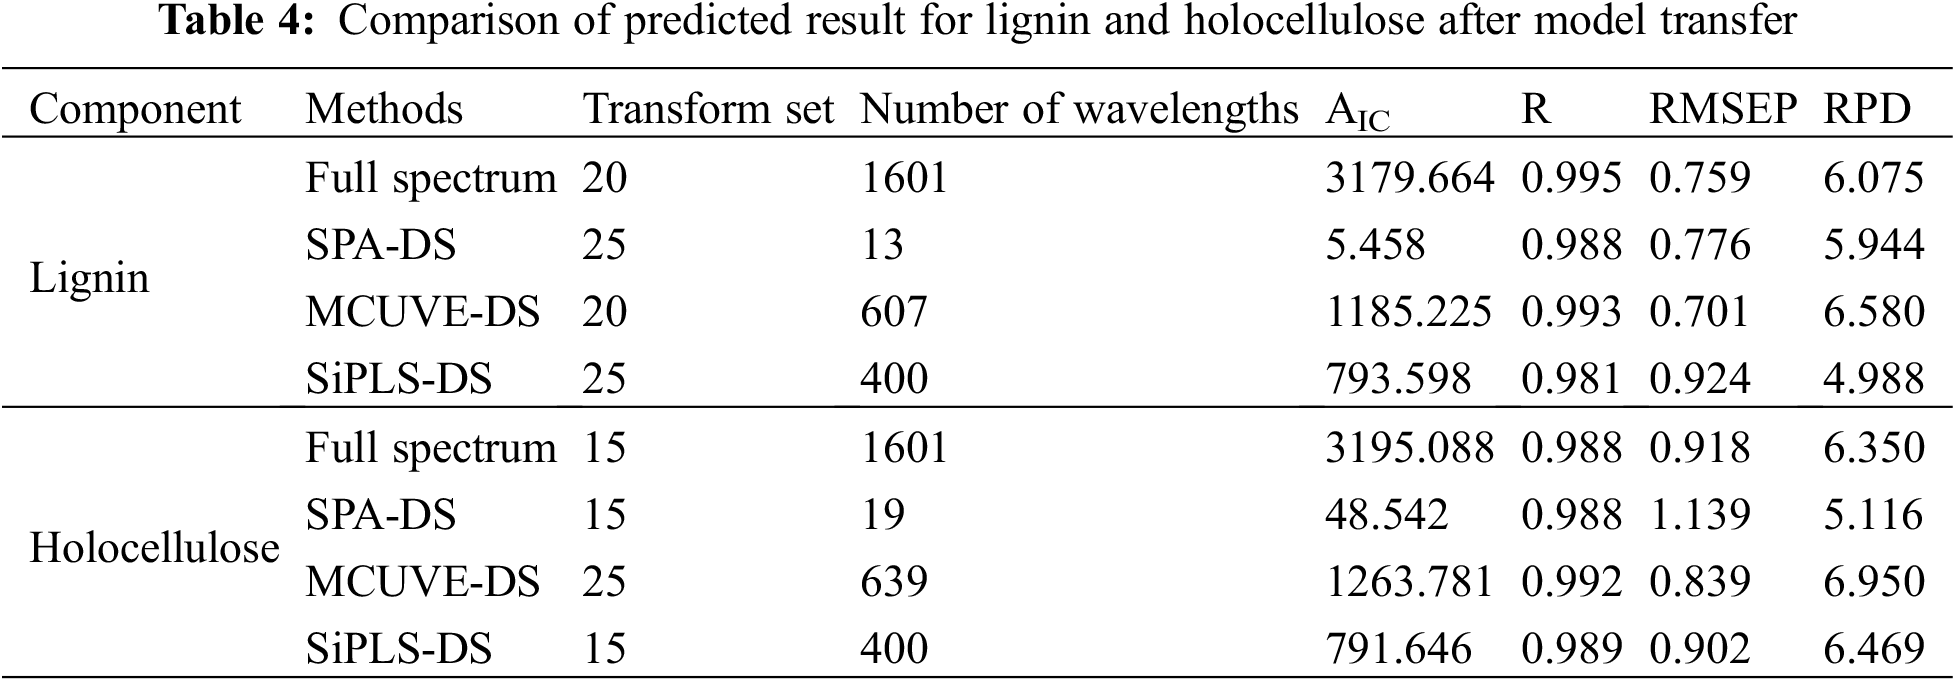
It can be seen from Table 4 that 20 and 15 transfer set samples need to be selected respectively in the full spectrum model transfer process for lignin and holocellulose, and the RPDs were all greater than 6.0, indicating the satisfied transfer performance. The SPA-DS method involved the least wavelength variables in the model transfer process for the two components, and the AIC values were reduced from 3179.664 and 3195.088 to 5.458 and 48.542, respectively, and the model transfer process was greatly simplified. However, the model transfer accuracy for these two components was slightly worse than that of the MCUVE-DS and full spectrum methods. This was because wavelength selection calculations were calculated only for the master spectrum, and the characteristic wavelength of the target was slightly offset from the master. The wavelength filtered out by SPA algorithm was too small to contain the characteristics of holocellulose in the target spectrum, resulting in poor model transfer effect.
Although the MCUVE algorithm was not the best in the prediction process of the master model, this method combined with the DS algorithm had the best transfer effect, and the prediction accuracy of the target lignin and holocellulose had been greatly improved compared with that of full-spectrum and SPA-DS methods. The AIC values were reduced from 3179.664 and 3195.088 to 1185.225 and 1263.781, respectively, indicating that the model transfer efficiency of the MCUVE-DS method was significantly improved. This was due to the fact that the MCUVE algorithm selected more wavelengths, avoiding the problem that the wavelengths selected by the method like the SPA algorithm cannot contain the characteristic wavelengths of the target spectra. The method selected wavelengths with higher stability and removed some redundant wavelengths. Therefore, it had better transfer effect than the full spectrum and SPA-DS methods, but its transfer efficiency was poor compared with the SPA-DS method.
The prediction accuracy of SiPLS algorithm for lignin was not very good because the near-infrared spectral characteristics of lignin were relatively scattered, and SiPLS was a band combination algorithm, which was not flexible enough compared with the two other algorithms of single point selection. However, the characteristic wavelengths of holocellulose were concentrated in the second half of the whole spectral range, which contained multiple characteristic wavelength points and the selected characteristic wavelengths in the same band, and the total number of wavelength points in the band was also more than that of the SPA algorithm. Therefore, the transfer effect of the holocellulose model is better than that of the full spectrum and the SPA algorithm. Compared with the full spectrum, the AIC values of the SiPLS-DS method for the model transfer process of the above two components decreased from 3179.664 and 3195.088 to 793.598 and 791.646, respectively, indicating that the method can simplify the model transfer process to a certain extent.
To address the problem of sharing NIR analysis models of lignin and holocellulose content in pulpwood between two different batches of NIR instruments, model transfer studies were carried out using SPA, MCUVE and SiPLS combined with DS algorithm. The results show that the spectral modeling effects of characteristic wavelength selection by the above three algorithms are greatly improved compared with full-spectrum modeling. The SPA-PLS model has the best prediction effect on the master, selects the least characteristic wavelength and has a fast calculation speed. For lignin, only 13 wavelengths were selected, 19 wavelengths were selected for holocellulose, and the RPDs were all above 6.8, but the prediction performances for target samples were poor. Using these three algorithms combined with the DS algorithm can better realize the model transfer between the two instruments and also simplify the model transfer process drastically. Among them, the model transfer strategy of MCUVE-DS algorithm has the best prediction effect and is obviously better than the effect of the full spectrum model transfer. The model transfer result of SPA on holocellulose is not as good as that of the full-spectrum model, which also means that to ensure a satisfying model transfer, the number of wavelengths in the transferred model should not be too small.
Acknowledgement: The authors would like to express their gratitude to the Institute of Forest Products and Chemical Industry of the Chinese Academy of Forestry for the samples provided, and to Yunchao Hu and Zhijian Liu for the sample spectra collected.
Funding Statement: The authors are grateful for the support of the Fundamental Research Funds of Research Institute of Forest New Technology, CAF (CAFYBB2019SY039).
Conflicts of Interest: The authors declare that they have no conflicts of interest to report regarding the present study.
References
1. Haque, M. M., Uddin, M. N., Quaiyyum, M. A., Nayeem, J., Alam, M. Z. et al. (2019). Pulpwood quality of the second generation Acacia auriculiformis. Journal of Bioresources and Bioproducts, 4(2), 73–79. https://doi.org/10.21967/jbb.v4i2.227 [Google Scholar] [CrossRef]
2. Kurata, Y. (2018). Accuracy of predicting the moisture content of three types of wood sections using near infrared spectroscopy. BioResources, 13(4), 8444–8454. https://doi.org/10.15376/biores.13.4.8444-8454 [Google Scholar] [CrossRef]
3. Wang, Y., Wang, R., Shi, L. (2022). Physical and mechanical properties of catalpa bungei clones and estimation of the properties by near-infrared spectroscopy. Journal of Renewable Materials, 10(12), 3285–3302. https://doi.org/10.32604/jrm.2022.020546 [Google Scholar] [CrossRef]
4. Hu, Z., Zhang, G., Chen, Y., Wang, Y., He, Y. et al. (2018). Determination of lignin monomer contents in rice straw using visible and near-infrared reflectance spectroscopy. BioResources, 13(2), 3284–3299. https://doi.org/10.15376/biores.13.2.3284-3299 [Google Scholar] [CrossRef]
5. Ni, L., Han, M., Luan, S., Zhang, L. (2019). Screening wavelengths with consistent and stable signals to realize calibration model transfer of near infrared spectra. Spectrochimica Acta Part A: Molecular and Biomolecular Spectroscopy, 206(16), 350–358. https://doi.org/10.1016/j.saa.2018.08.027 [Google Scholar] [PubMed] [CrossRef]
6. Qiao, L., Lu, B., Dong, J., Li, B., Zhao, B. et al. (2020). Total volatile basic nitrogen content in duck meat of different varieties based on calibration maintenance and transfer by use of a near-infrared spectrometric model. Spectroscopy Letters, 53(1), 44–54. https://doi.org/10.1080/00387010.2019.1690523 [Google Scholar] [CrossRef]
7. Zhang, L., Li, Y., Huang, W., Ni, L., Ge, J. (2020). The method of calibration model transfer by optimizing wavelength combinations based on consistent and stable spectral signals. Spectrochimica Acta Part A: Molecular and Biomolecular Spectroscopy, 227(19), 117647. https://doi.org/10.1016/j.saa.2019.117647 [Google Scholar] [PubMed] [CrossRef]
8. Huang, Z., Sanaeifar, A., Tian, Y. A., Liu, L., Zhang, D. et al. (2021). Improved generalization of spectral models associated with Vis-NIR spectroscopy for determining the moisture content of different tea leaves. Journal of Food Engineering, 293(1), 110374. https://doi.org/10.1016/j.jfoodeng.2020.110374 [Google Scholar] [CrossRef]
9. Huang, H., Liu, S., Ullah, J., Sun, Z., Liu, C. et al. (2020). Model maintenance of RC-PLSR for moisture content measurement of dried scallop. Transactions of the ASABE, 63(4), 891–899. https://doi.org/10.13031/trans.13728 [Google Scholar] [CrossRef]
10. Liu, Y., Cai, W., Shao, X. (2016). Linear model correction: A method for transferring a near-infrared multivariate calibration model without standard samples. Spectrochimica Acta Part A: Molecular and Biomolecular Spectroscopy, 169, 197–201. https://doi.org/10.1016/j.saa.2016.06.041 [Google Scholar] [PubMed] [CrossRef]
11. Wang, A., Yang, P., Chen, J., Wu, Z., Jia, Y. et al. (2019). A new calibration model transferring strategy maintaining the predictive abilities of NIR multivariate calibration model applied in different batches process of extraction. Infrared Physics & Technology, 103, 103046. https://doi.org/10.1016/j.infrared.2019.103046 [Google Scholar] [CrossRef]
12. Parrott, A. J., McIntyre, A. C., Holden, M., Colquhoun, G., Chen, Z. P. et al. (2022). Calibration model transfer in mid-infrared process analysis with in situ attenuated total reflectance immersion probes. Analytical Methods, 14(19), 1889–1896. https://doi.org/10.1039/D2AY00116K [Google Scholar] [PubMed] [CrossRef]
13. Ji, W., Viscarra Rossel, R. A., Shi, Z. (2015). Accounting for the effects of water and the environment on proximally sensed vis-NIR soil spectra and their calibrations. European Journal of Soil Science, 66(3), 555–565. https://doi.org/10.1111/ejss.12239 [Google Scholar] [CrossRef]
14. Wang, W., Huck, C. W., Yang, B. (2019). NIR model transfer of alkali-soluble polysaccharides in Poria cocos with piecewise direct standardization. NIR News, 30(5–6), 6–14. https://doi.org/10.1177/0960336019855218 [Google Scholar] [CrossRef]
15. Wang, Z., Wang, X., Zhong, G., Liu, J., Sun, Y. et al. (2022). Rapid determination of ammonia nitrogen concentration in biogas slurry based on NIR transmission spectroscopy with characteristic wavelength selection. Infrared Physics & Technology, 122(15), 104085. https://doi.org/10.1016/j.infrared.2022.104085 [Google Scholar] [CrossRef]
16. Mishra, P., Woltering, E., Brouwer, B., Hogeveen-van Echtelt, E. (2021). Improving moisture and soluble solids content prediction in pear fruit using near-infrared spectroscopy with variable selection and model updating approach. Postharvest Biology and Technology, 171(5), 111348. https://doi.org/10.1016/j.postharvbio.2020.111348 [Google Scholar] [CrossRef]
17. Xu, Z., Fan, S., Cheng, W., Liu, J., Zhang, P. et al. (2020). A correlation-analysis-based wavelength selection method for calibration transfer. Spectrochimica Acta Part A: Molecular and Biomolecular Spectroscopy, 230, 118053. https://doi.org/10.1016/j.saa.2020.118053 [Google Scholar] [PubMed] [CrossRef]
18. Li, W., Lin, L., Li, G. (2014). Wavelength selection method based on test analysis of variance: Application to oximetry. Analytical Methods, 6(4), 1082–1089. https://doi.org/10.1039/C3AY41601A [Google Scholar] [CrossRef]
19. Lu, B., Liu, N., Li, H., Yang, K., Hu, C. et al. (2019). Quantitative determination and characteristic wavelength selection of available nitrogen in coco-peat by NIR spectroscopy. Soil and Tillage Research, 191, 266–274. https://doi.org/10.1016/j.still.2019.04.015 [Google Scholar] [CrossRef]
20. Li, C., Zhao, J., Li, Y., Meng, Y., Zhang, Z. (2021). Modeling and prediction of soil organic matter content based on visible-near-infrared spectroscopy. Forests, 12(12), 1809. https://doi.org/10.3390/f12121809 [Google Scholar] [CrossRef]
21. Li, J., Huang, W., Chen, L., Fan, S., Zhang, B. et al. (2014). Variable selection in visible and near-infrared spectral analysis for noninvasive determination of soluble solids content of ‘Ya’ pear. Food Analytical Methods, 7(9), 1891–1902. https://doi.org/10.1007/s12161-014-9832-8 [Google Scholar] [CrossRef]
22. Moro, M. K., dos Santos, F. D., Folli, G. S., Romao, W., Filgueiras, P. R. (2021). A review of chemometrics models to predict crude oil properties from nuclear magnetic resonance and infrared spectroscopy. Fuel, 303(1), 121283. https://doi.org/10.1016/j.fuel.2021.121283 [Google Scholar] [CrossRef]
23. Ni, L., Chen, H., Hong, S., Zhang, L., Luan, S. (2021). Near infrared spectral calibration model transfer without standards by screening spectral points with scale invariant feature transform from master samples spectra. Spectrochimica Acta Part A: Molecular and Biomolecular Spectroscopy, 260(230), 119802. https://doi.org/10.1016/j.saa.2021.119802 [Google Scholar] [PubMed] [CrossRef]
24. Wu, X., Li, G., Liu, X., He, F. (2021). Rapid non-destructive analysis of lignin using NIR spectroscopy and chemo-metrics. Food and Energy Security, 10(3), e289. https://doi.org/10.1002/fes3.289 [Google Scholar] [CrossRef]
25. Guan, X., Liu, J., Huang, K., Kuang, J., Liu, D. (2019). Evaluation of moisture content in processed apple chips using NIRS and wavelength selection techniques. Infrared Physics & Technology, 98, 305–310. https://doi.org/10.1016/j.infrared.2019.01.010 [Google Scholar] [CrossRef]
26. Han, M., Wang, X., Xu, Y., Cui, Y., Wang, L. et al. (2021). Variable selection for the determination of the soluble solid content of potatoes with surface impurities in the visible/near-infrared range. Biosystems Engineering, 209(5), 170–179. https://doi.org/10.1016/j.biosystemseng.2021.06.019 [Google Scholar] [CrossRef]
27. Rossel, R. V., Behrens, T. (2010). Using data mining to model and interpret soil diffuse reflectance spectra. Geoderma, 158(1–2), 46–54. https://doi.org/10.1016/j.geoderma.2009.12.025 [Google Scholar] [CrossRef]
28. Liu, S., Wang, S., Hu, C., Qin, X., Wang, J. et al. (2022). Development of a new NIR-machine learning approach for simultaneous detection of diesel various properties. Measurement, 187(8), 110293. https://doi.org/10.1016/j.measurement.2021.110293 [Google Scholar] [CrossRef]
29. Li, L., Jang, X., Li, B., Liu, Y. (2021). Wavelength selection method for near-infrared spectroscopy based on standard-sample calibration transfer of mango and apple. Computers and Electronics in Agriculture, 190(1), 106448. https://doi.org/10.1016/j.compag.2021.106448 [Google Scholar] [CrossRef]
30. Yang, Y., Zhao, C., Huang, W., Tian, X., Fan, S. et al. (2022). Optimization and compensation of models on tomato soluble solids content assessment with online Vis/NIRS diffuse transmission system. Infrared Physics & Technology, 121(2), 104050. https://doi.org/10.1016/j.infrared.2022.104050 [Google Scholar] [CrossRef]
31. Guan, Y., Ye, T., Yi, Y., Hua, H., Chen, C. (2022). Rapid quality evaluation of plantaginis semen by near infrared spectroscopy combined with chemometrics. Journal of Pharmaceutical and Biomedical Analysis, 207, 114435. https://doi.org/10.1016/j.jpba.2021.114435 [Google Scholar] [PubMed] [CrossRef]
32. Hu, Z., Zhang, G., Chen, Y., Wang, Y., He, Y. et al. (2018). Determination of lignin monomer contents in rice straw using visible and near-infrared reflectance spectroscopy. BioResources, 13(2), 3284–3299. https://doi.org/10.15376/biores.13.2.3284-3299 [Google Scholar] [CrossRef]
33. Huang, C., Han, L., Liu, X., Ma, L. (2010). The rapid estimation of cellulose, hemicellulose, and lignin contents in rice straw by near infrared spectroscopy. Energy Sources, Part A: Recovery, Utilization, and Environmental Effects, 33(2), 114–120. https://doi.org/10.1080/15567030902937127 [Google Scholar] [CrossRef]
34. Tao, D., Wang, Z., Li, G., Xie, L. (2019). Sex determination of silkworm pupae using VIS-NIR hyperspectral imaging combined with chemometrics. Spectrochimica Acta Part A: Molecular and Biomolecular Spectroscopy, 208, 7–12. https://doi.org/10.1016/j.saa.2018.09.049 [Google Scholar] [PubMed] [CrossRef]
35. Hu, F., Zhou, M., Yan, P., Li, D., Lai, W. et al. (2019). Selection of characteristic wavelengths using SPA for laser induced fluorescence spectroscopy of mine water inrush. Spectrochimica Acta Part A: Molecular and Biomolecular Spectroscopy, 219, 367–374. https://doi.org/10.1016/j.saa.2019.04.045 [Google Scholar] [PubMed] [CrossRef]
36. Li, L., Guo, S. (2021). A wavelength selection model based on successive projections algorithm for pH detection of water by VIS-NIR spectroscopy. Journal of Physics: Conference Series, 1813(1), 012002–012004. https://doi.org/10.1088/1742-6596/1813/1/012002 [Google Scholar] [CrossRef]
37. Bei, C., En-rang, Z., Tuo, G. (2021). Application of various algorithms for spectral variable selection in NIRS modeling of red ginseng extraction. Spectroscopy and Spectral Analysis, 41(8), 2443–2449. https://doi.org/10.3964/J.ISSN.1000-0593(2021)08-2443-07 [Google Scholar] [CrossRef]
38. Xu, Z., Zhang, P., Wang, Q., Fan, S., Cheng, W. et al. (2022). Comparative study of different wavelength selection methods in the transfer of crop kernel qualitive near-infrared models. Infrared Physics & Technology, 123(1), 104120. https://doi.org/10.1016/j.infrared.2022.104120 [Google Scholar] [CrossRef]
Cite This Article
 Copyright © 2023 The Author(s). Published by Tech Science Press.
This work is licensed under a Creative Commons Attribution 4.0 International License , which permits unrestricted use, distribution, and reproduction in any medium, provided the original work is properly cited.
 Downloads
 Citation Tools