
 Submit a Paper
 Propose a Special lssue
 Open Access
ARTICLE

Experimental Study of Microalgae Cultivation under Selective Illumination by Ag/CoSO4 for Bioelectrode Materials Preparation
1 School of Energy and Power Engineering, Jiangsu University, Zhenjiang, 212013, China
2 School of Agricultural Engineering, Jiangsu University, Zhenjiang, 212013, China
3 Research Center of Fluid Machinery Engineering and Technology, Jiangsu University, Zhenjiang, 212013, China
4 Biomass Group, College of Engineering, Nanjing Agricultural University, Nanjing, 210031, China
5 Guangzhou Institute of Energy Conversion, Chinese Academy of Sciences, Guangzhou, China
* Corresponding Authors: Hao Chen. Email: ; Shuang Wang. Email:
Journal of Renewable Materials 2023, 11(6), 2849-2864. https://doi.org/10.32604/jrm.2023.026317
Received 30 August 2022; Accepted 04 November 2022; Issue published 27 April 2023
 View Full Text
 Download PDF
Abstract
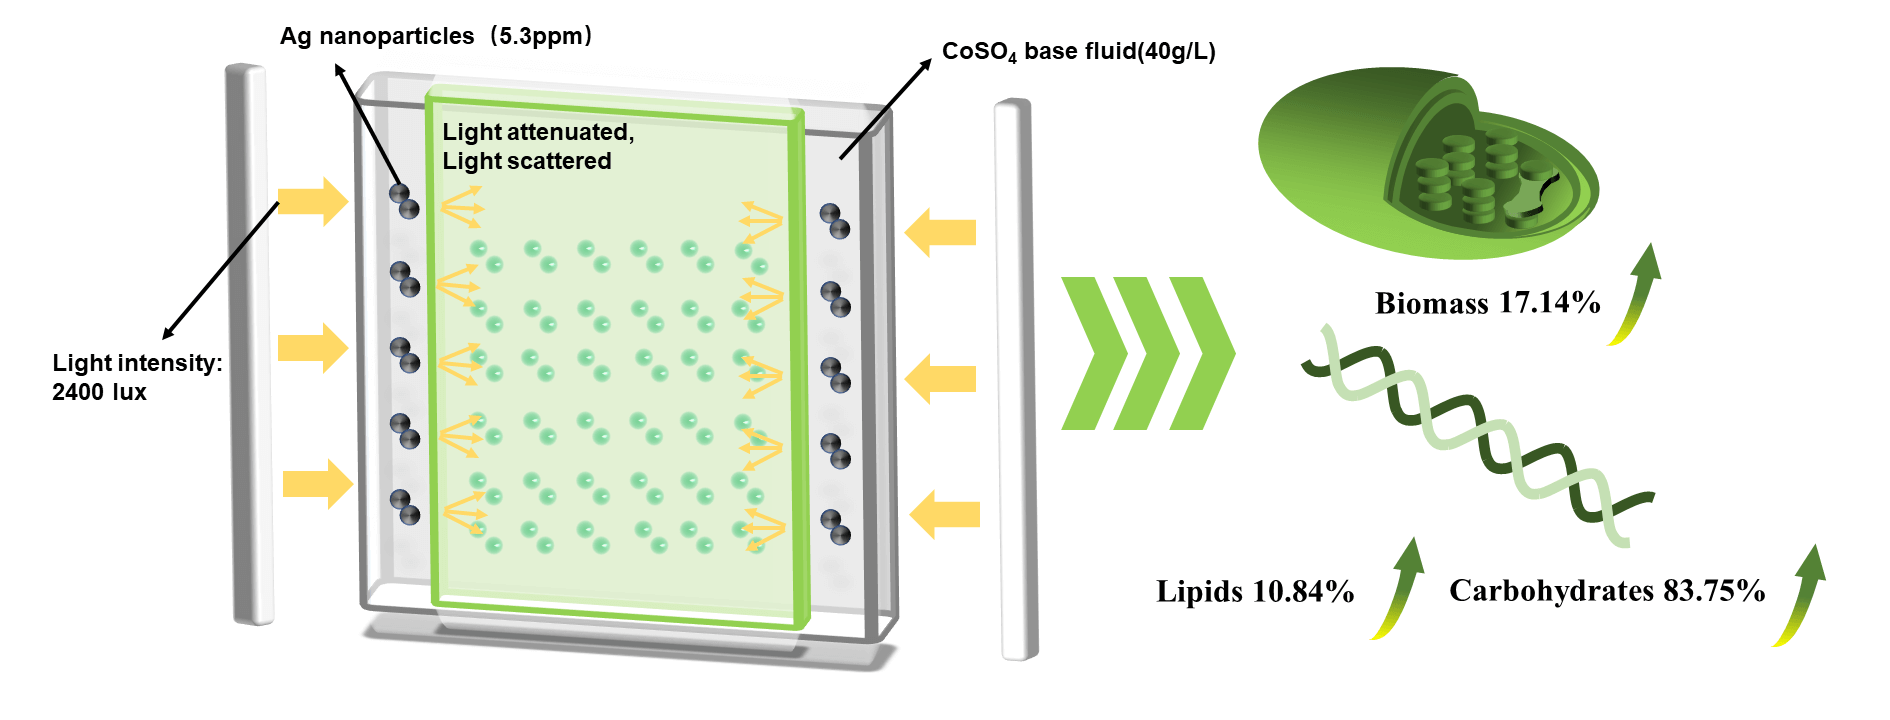
Microalgae biomass is an ideal precursor to prepare renewable carbon materials, which has broad application. The bioaccumulation efficiency (lipids, proteins, carbohydrates) and biomass productivity of microalgae are influenced by spectroscopy during the culture process. In this study, a bilayer plate-type photobioreactor was designed to cultivate Chlorella protothecoides with spectral selectivity by nanofluids. Compared to culture without spectral selectivity, the spectral selectivity of Ag/CoSO4 nanofluids increased microalgae biomass by 5.76%, and the spectral selectivity of CoSO4 solution increased by 17.14%. In addition, the spectral selectivity of Ag/CoSO4 nanofluids was more conducive to the accumulation of nutrients (29.46% lipids, 50.66% proteins, and 17.86% carbohydrates) in microalgae. Further cultured chlorella was utilized to prepare bioelectrode materials, it was found that algal based biochar had a good pore structure (micro specific surface area: 1627.5314 m2/g, average pore size: 0.21294 nm). As the current density was 1 A/g, the specific capacitance reached 230 F/g, appearing good electrochemical performance.Graphic Abstract
Keywords
Global warming has been regarded as an urgent climate problem for mankind. The most important factor contributing to the world’s warming is the production of greenhouse gases such as CO2 from the massive use of fossil fuels [1]. The development of clean, renewable energy is now necessary to curb warming and slow energy depletion. The use of biofuels is developing rapidly. By increasing the penetration of biofuels in the energy balance of all countries, the dependence on oil has been reduced, alternatives have been created, and supply security has been strengthened [2]. The development of clean, efficient, and sustainable new energy sources has therefore become a key global issue [3–5]. Microalgae have achieved high commercial value as a third-generation biofuel feedstock, with high biomass energy and high carbon sequestration capacity [5–8].
Light and CO2 are essential for the survival of algae [9,10]. CO2 provides a sufficient source of carbon for photosynthesis, which is involved in the production of various organic substances [10]. Light is a decisive factor in the growth of microalgae [11]. Existing studies have shown that different light parameters (light intensity and wavelength, photo/dark period, and light source) are known to affect microalgal growth [12]. The efficiency of photosynthesis varies with light intensity. He et al. studied the effects of different light intensities (40, 200, and 400 μmolm−2s−1) on biomass production and lipid accumulation in two microalgae, Chlorella sp. and Monoraphidium sp. [13]. Periodic changes in light and light attenuation can lead to areas of darkness in the culture environment, which can affect the light received by microalgae cells [14]. In addition, microalgae cells do not fully absorb the full wavelength of light for photosynthesis, the effective wavelength of light absorbed by photosynthesis is about 400–700 nm [15]. Kim et al. [16] found that blue light can promote C. vulgaris accumulation of fatty acids in vulgaris. However, Ra et al. [17] studied the maximum lipid content of three Nannochloropsis microalgae cultivated under red light, which reached an average of 34%. Yang et al. [18] showed that red light not only enhanced photosynthesis in Ettlia oleoabundans, a freshwater unicellular microalgae, but also enhanced the conversion of fixed carbon into triglycerides (TGAs), of which triglycerides are a necessary precursor for lipid synthesis.
Conventional laboratory microalgae culture can be controlled by adjusting the light source to achieve light intensity and light waves, but natural outdoor light cannot be artificially regulated, so an effective means of regulating natural light needs to be sought [19]. For open microalgae culture installations, the effective use of natural light to further increase the production of microalgae is a current research priority [20]. Nanofluids are mostly used in photovoltaic cell materials due to their spectral absorption properties [21]. Nanofluid is a mixture of nanoparticles and base fluid together. The nanoparticles in the nanofluid have an absorption and scattering effect on the incident light, which can greatly increase the absorption ratio and scattering capacity of the base fluid for light [22]. Chen et al. found that the spectral absorption peaks of Au nanofluids were in the range of 879-553 and 899-594 nm [23]. According to previous studies, Ag nanoparticles have strong absorption of light compared to TiO2 and SiO2 [24]. Multiple nanoparticles have different light absorption efficiencies for light waves, and the presence of multiple nanoparticles in a nanofluid results in different light scattering and light absorption effects [25].
Developing new energy storage devices that are environmentally friendly, safe, efficient, and have a long cycle life is an important direction for the development of green and clean energy [26,27] . Supercapacitors are a typical electrochemical energy storage device consisting of two electrodes separated by an ion permeable membrane and an electrolyte that connects the two electrodes [28]. Carbon materials are used as electrode materials, which have the advantages of large specific surface area, adjustable pore size and structure, high electrical conductivity, strong mechanical properties, and easy access [29]. However, high-quality carbon materials, such as fullerene, graphene, and carbon nanotube lamps, are difficult to synthesize and costly to manufacture, which are not conducive to large-scale production applications [30]. Biocarbon is a low dimensional carbon material with a unique pore structure, which has the advantages of light weight, well-developed pore structure, large specific surface area, good electrical conductivity, high temperature resistance, and corrosion resistance [31,32]. Compared with low dimensional carbon materials such as mesoporous carbon, graphene, carbon nanotubes, and graphene like materials, biochar has abundant sources, low preparation costs, and is environmentally friendly and renewable [33–35].
Nanofluid can effectively change the frequency of transmitted visible light and can be used to control light conditions in microalgae culture. Further study on electrochemical performance of microalgae. However, no relevant studies have been reported so far. Nanofluid can effectively change the wavelength of visible light. And there are few applications for further preparation of electrode materials from self-cultured microalgae. In this study, a photobioreactor was designed for the cultivation of microalgae using nanofluidic selective light wavelengths. The nanofluid is placed between the algal fluid and the light source and is used to regulate the frequency of the light. the growth rate and nutrient accumulation characteristics of algae under Ag/CoSO4 and CoSO4 were studied. The self-cultured chlorella and KOH were further pyrolyzed and activated to prepare electrode materials, and their electrochemical performance were investigated. Based on this research, this paper wants to provide a new idea for open culture of microalgae, effectively regulate the natural light to promote the growth of microalgae, and improve the yield of microalgae, and investigated the electrochemical performance of self-cultured Chlorella protothecoides.
2.1 Description of a Two-Layer Flat-Plate Photobioreactor
The microalgae culture unit is designed for this research as a lidded double-plate photobioreactor with an outer profile of 52 mm × 240 mm × 160 mm, an inner layer of 20 mm algal fluid thickness and an outer layer of 8 mm nanofluid thickness. There are also algal fluid outlets and nanofluid outlets with apertures of 6 and 4 mm on the bottom and right side (Fig. 1), respectively. At the top of the PBRs, there are 5 holes of 12 mm diameter for continuous aeration by the gas pump and precise control of the total aeration volume (0.5 vvm) by means of a gas flow meter for the atmosphere (CO2 content of 0.03%, noted as 0% CO2). The microalgae cultured in this study is Chlorella protothecoides (SAG 211-11b), purchased from the Algae Culture Centre of the Georg-August-University of Göttingen, Germany. The microalgae culture cycle was 17 days, the temperature of the photobioreactor was 25°C ± 1.5°C, the initial pH after inoculation was 7 ± 0.2, the initial optical density at 680 nm (OD680) was adjusted to 0.012 ± 0.003 and the 12/12 h photoperiod. The growth of the microalgae is monitored by recording OD680 daily during the growth process. Typically, the algal solution is extracted from the middle of the photobioreactor. In addition, the dry weight was determined using the filtration method, whereby the weight per volume of algal solution was filtered through filter paper and dried at 105°C. Total biomass productivity was also determined and calculated using the equation shown in Eq. (1).
where t is the number of days of microalgae growth and DWt is the dry weight of the microalgae on a certain day of growth.
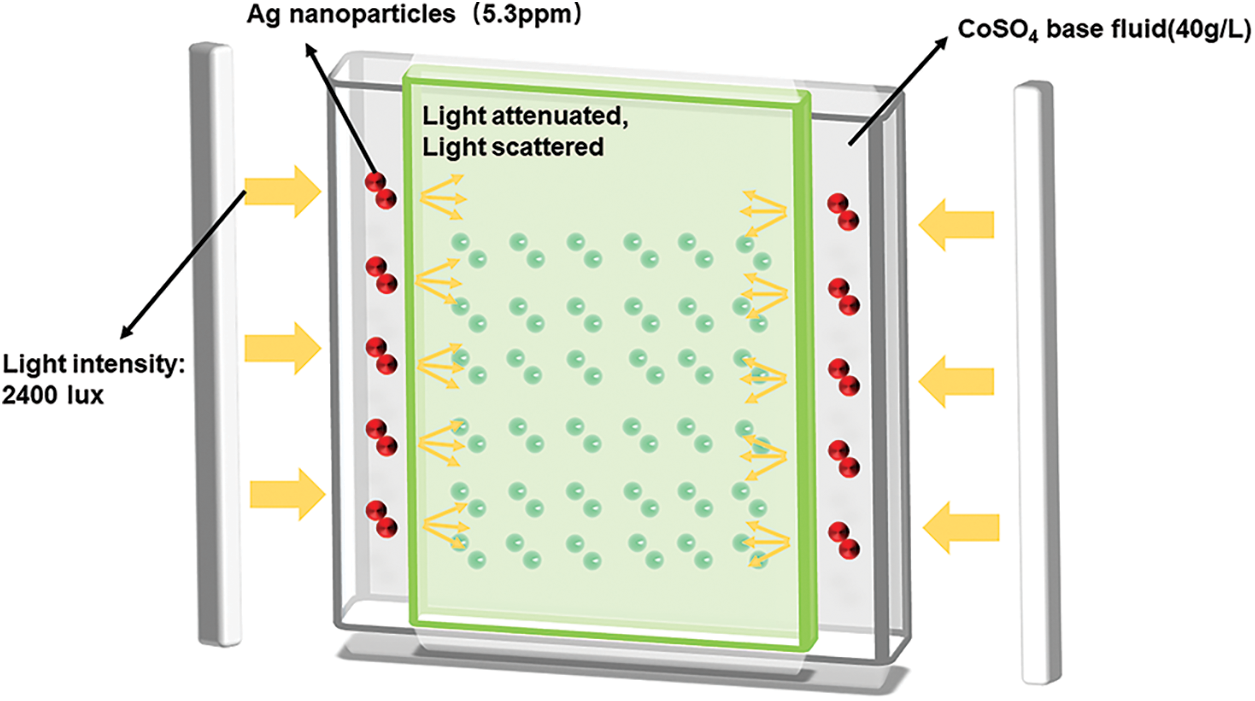
Figure 1: Schematic diagram of nanofluid device
The preparation of Ag/CoSO4 was based on Han’s [36] experiments and then further experiments with microalgae culture using Ag/CoSO4 fluid. The detail of specific test steps was shown in supporting information (Section S1).
2.2 Determination of Total Lipids, Carbohydrates and Protein Content
The lipid extraction experiment can be find in our previous study. The detailed experimental steps were shown in supporting information (Section S2) [37–40].
2.3 Pyrolysis of Biocarbon Materials
This article uses a one-step method for pyrolysis experiments. The centrifugally collected Chlorella protothecoides is dried in a 105°C oven, mixed with KOH (CV:KOH = 1:4), and then placed in a vertical tubular pyrolysis furnace for activation. N2 is stably input at a flow rate of 100 mL/min for 30 min to remove air from the reactor. Subsequently, the chlorella is heated to 800°C at a heating rate of 5 °C/min for pyrolysis and activation.
The nickel foam sheets were first cut into 1 cm × 3 cm strips and loaded into a beaker and washed with acetone, 2 mol/L hydrochloric acid solution, 1 mol/L hydrochloric acid solution, anhydrous ethanol and deionized water for 10 min, respectively. Then take out the dried sample, weigh 0.005 g of the sample and place it in a disposable 2.5 mL centrifuge tube. Add 1 mL of anhydrous ethanol and place it in an ultrasonic cleaning machine to shake for 2 h. Then add 200 μ LD-520 dispersion solution and continue shaking for 3 h. The nickel foam electrode was removed and placed in a drying oven. The biochar solution was titrated onto the 1 cm × 3 cm nickel foam electrode and covered one third of its area, then dried and titrated until the solution was completely finished in the centrifuge tube. Finally, the pieces were dried in a drying oven for 24 h. The pressed pieces were removed and awaited electrochemical testing.
Scanning electron microscopy (SEM, JSM-IT800) was used to observe the morphological changes of the surface of biochar.
The structure of biochar was characterized using ASAP2460 type fully automatic specific surface area and pore analyzer at a liquid nitrogen temperature of 77 K. The pore structure characteristics of carbon samples can be obtained through the isothermal curve of N2 adsorption desorption test.
Potassium bromide powder was used for the tablet pressing method. An appropriate amount of sample was ground with KBr (sample to potassium bromide mass ratio 1:200), made into thin slices of approximately 0.5 mm thickness by a pneumatic tablet press and analysed by a Fourier infrared spectrometer manufactured by ThermoNicolet, USA, with a scanning range of 400–4000 cm−1.
X-ray diffraction is one of the most important tools for the study of the microstructure of matter and is widely used to determine the structure of various materials and to analyse the physical phase and crystal structure of materials.
2.9 Electrochemical Testing of Electrodes Analysis
The 660E electrochemical workstation (Shanghai Chenhua Instrument Co., Ltd., China) was used to test the electrochemical performance of the electrode sheet. The test was conducted using a three electrode system, with the auxiliary electrode being a platinum electrode, the reference electrode being a mercury oxide solution, and the electrolyte being 6 mol/L of KOH solution. The voltammetric characteristic curve and charge discharge performance of the sample were tested respectively. The specific capacitance C (F/g) is calculated from the GCD curve, with the specific formula as follows:
where I indicates the discharge current; Δt indicates the discharge time; m indicates the mass of the active substance; and ΔV indicates the voltage window.
3.1 Analysis of Microalgal Growth Trends
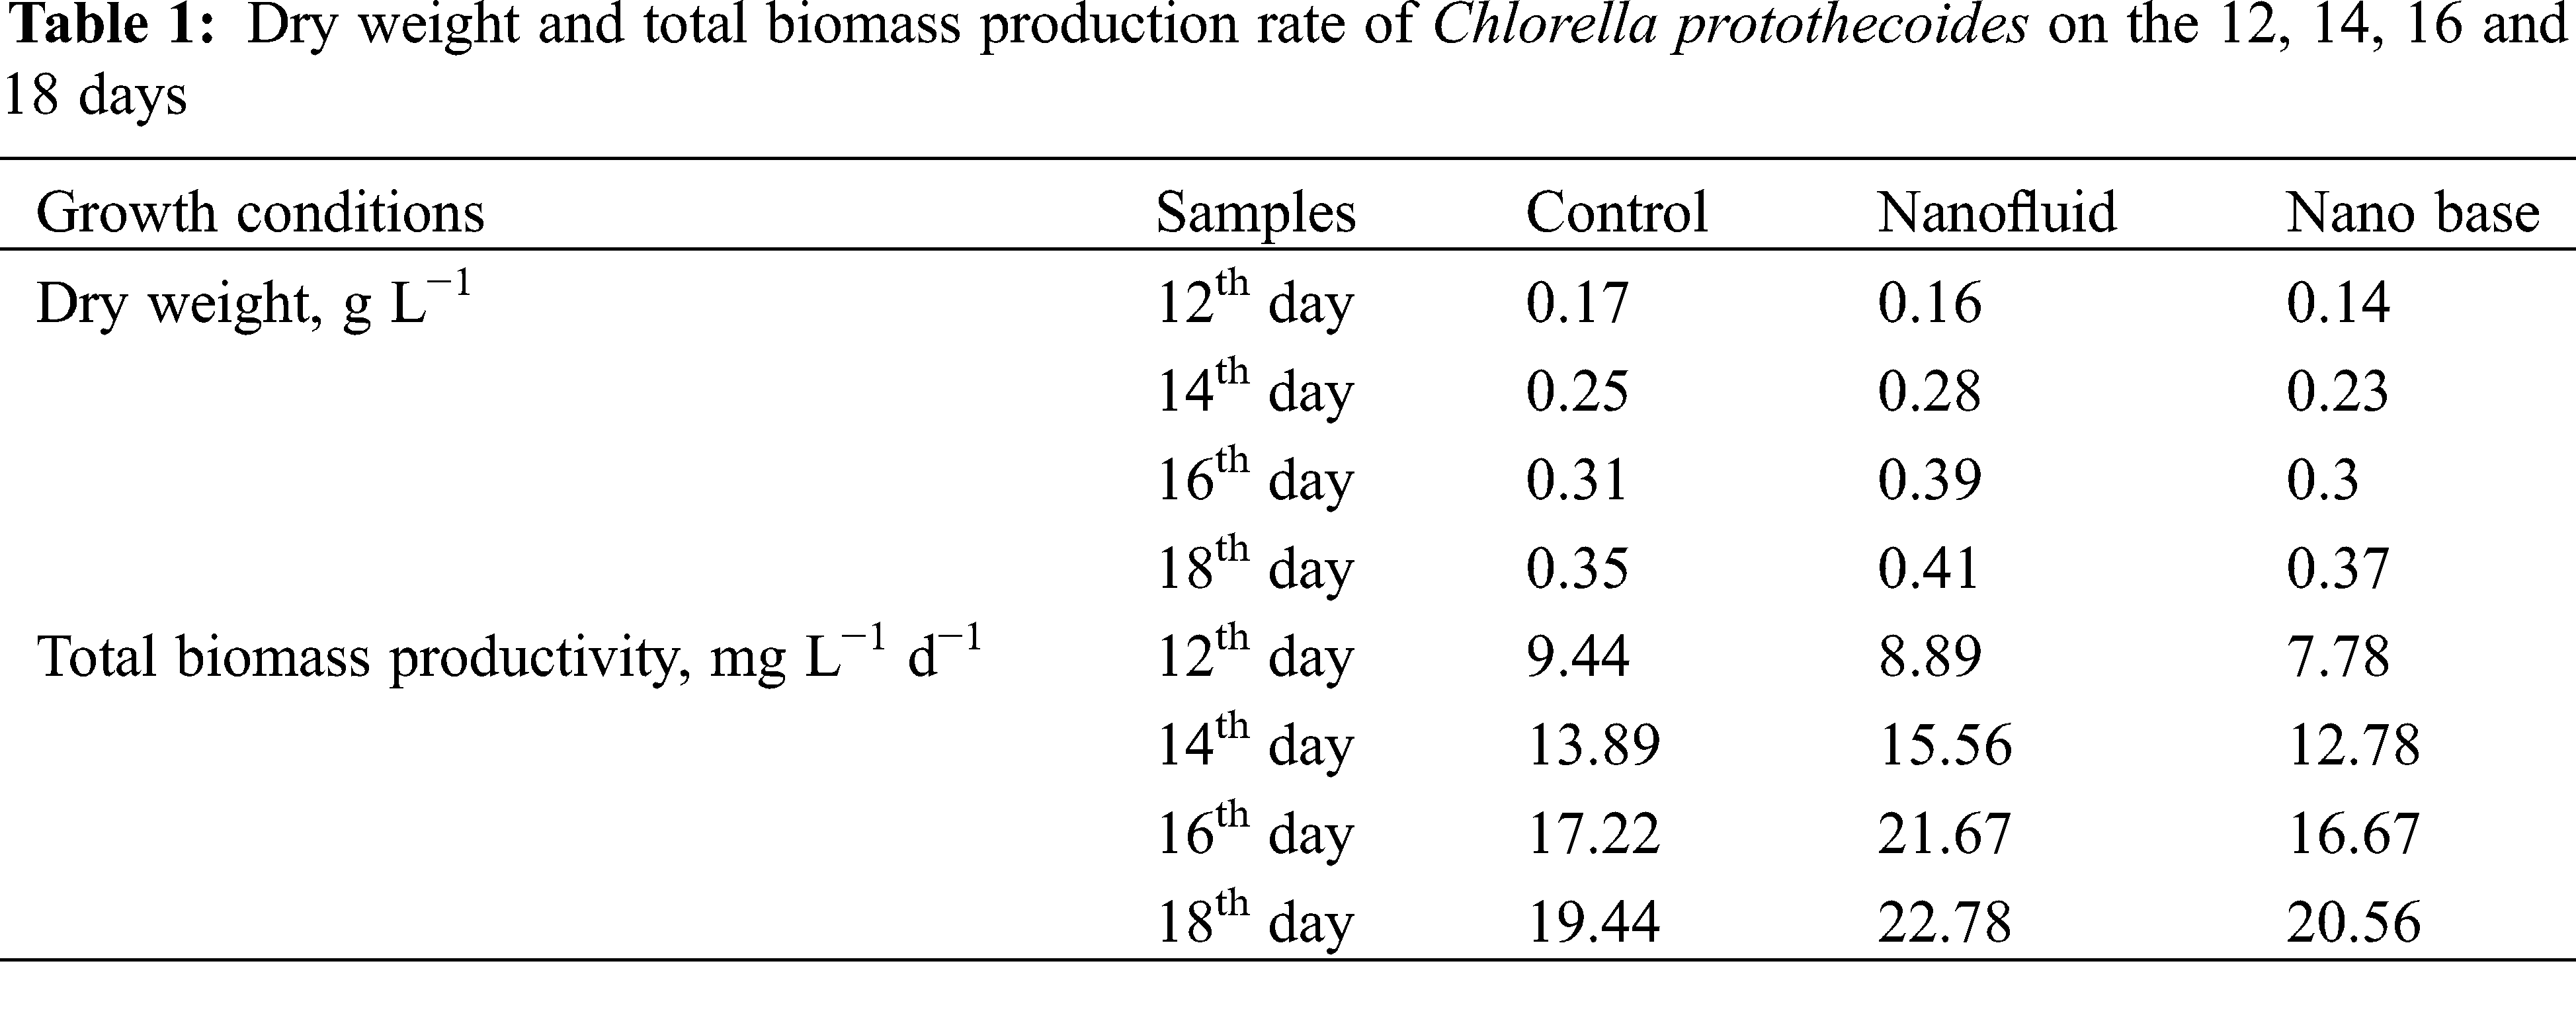
The results of the optical density (OD) measurements are an important source of feedback on the growth of microalgae, and the trend and magnitude of the OD values reflect the rate of accumulation of microalgal cell biomass and the number of microalgal cells in the photobioreactor. The OD measurements of the algal solution for 20 consecutive days were collated to produce a graph of the changes in OD for the Ag nanofluid group, the base solution group, and the group without nanofluid, as shown in Fig. 2, other groups showed an overall increasing trend in the growth of microalgae, and both went through a slow growth phase and an exponential growth phase. However, it can be found from Fig. 2 that the growth rate of the nanofluid and basal fluid groups was much smaller than that of the group without nanofluids between Day 1 and Day 10, and the change in the number of microalgae cells fluctuated less. This is because in the early stages of growth, the algal cells are extremely sensitive to light intensity conditions, and the rose-red CoSO4 filters out some of the red light, reducing the light intensity and making the relative amount of light available to the microalgae less available, reducing the photosynthetic rate [41]. In contrast, the growth rate of microalgae in the nanofluid and basal fluid groups increased more between Day 10 and Day 16, with a large increase in the number of microalgae cells and a rapid accumulation of biomass, and was on par with the group without nanofluids on Day 16. This is because, at a certain concentration of algal fluid, the sensitivity of algal cells to light intensity is relatively reduced and the spectral dependence on incident light is increased. The analysis is due to the fact that the photothermal properties and spectral selectivity possessed by the nanofluid will greatly contribute to the photosynthetic rate of microalgae. After Day 16, the growth rates of the nanofluid and basal fluid groups continued unabated, and their microalgal cell numbers kept pulling away from the group without nanofluids. Throughout the growth process measured, the nanofluid and base solution groups had a positive effect on the growth of the microalgae compared to the group without nanofluids. The microalgae in the nanofluid group entered the growth stabilization phase earlier than the base fluid group as well as the group without nanofluids. Table 1 shows the dry weight and total biomass yield of Chlorella at 12, 14, 16, and 18 days, with the nanofluid and basal groups having higher dry weight and total biomass yield than the group without nanofluids. 5.76% increase in total biomass production in the base fluid group compared to the group without nanofluids. The increase in yield in the basal fluid group was probably due to the red color of the CoSO4 solution itself, and it has been shown that red light is effective in promoting the growth of microalgae [17,42]. However, the nanofluid group exhibited superior biomass accumulation compared to the basal liquid group. The nanofluid group produced 17.14% more biomass than the group without nanofluids, possibly because the nanoparticles within CoSO4 were selected for light transmission, resulting in a shift in light wavelengths, somewhat screening light waves and thus promoting microalgal growth [43].
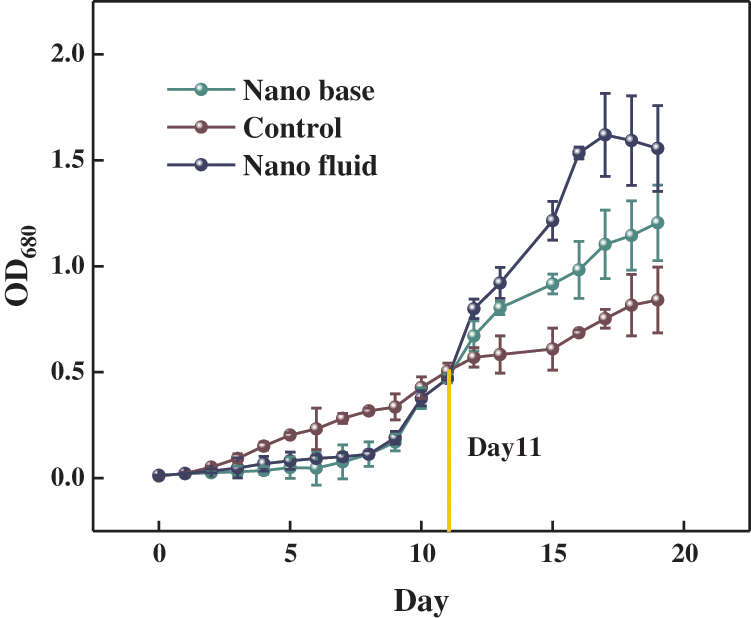
Figure 2: The growth curves of Chlorella protothecoides in a two-layer plate photobioreactor
In order to analyze and predict the growth curve of S-type bacteria, the most common method is to use mathematical models to fit and describe the growth curve. Logistic equation is the most commonly used model to describe bacterial growth kinetics. Especially in systems biology and computational biology. This equation is usually used to fit the growth curve based on optical density (OD) to understand the dynamics of the life system. The Logistic model in the form of differential equation was first proposed by Veshulst in 1838 [44], which can generally well describe the growth curve of organisms. Logistic fitting analysis was carried out for the three groups of experiments. The Logistic model was suitable for the three groups of experiments, and R2 > 0.99. As shown in Fig. 3, the high fitting degree verified the correctness of the experiment, and predicted the growth trend of microalgae to a certain extent.
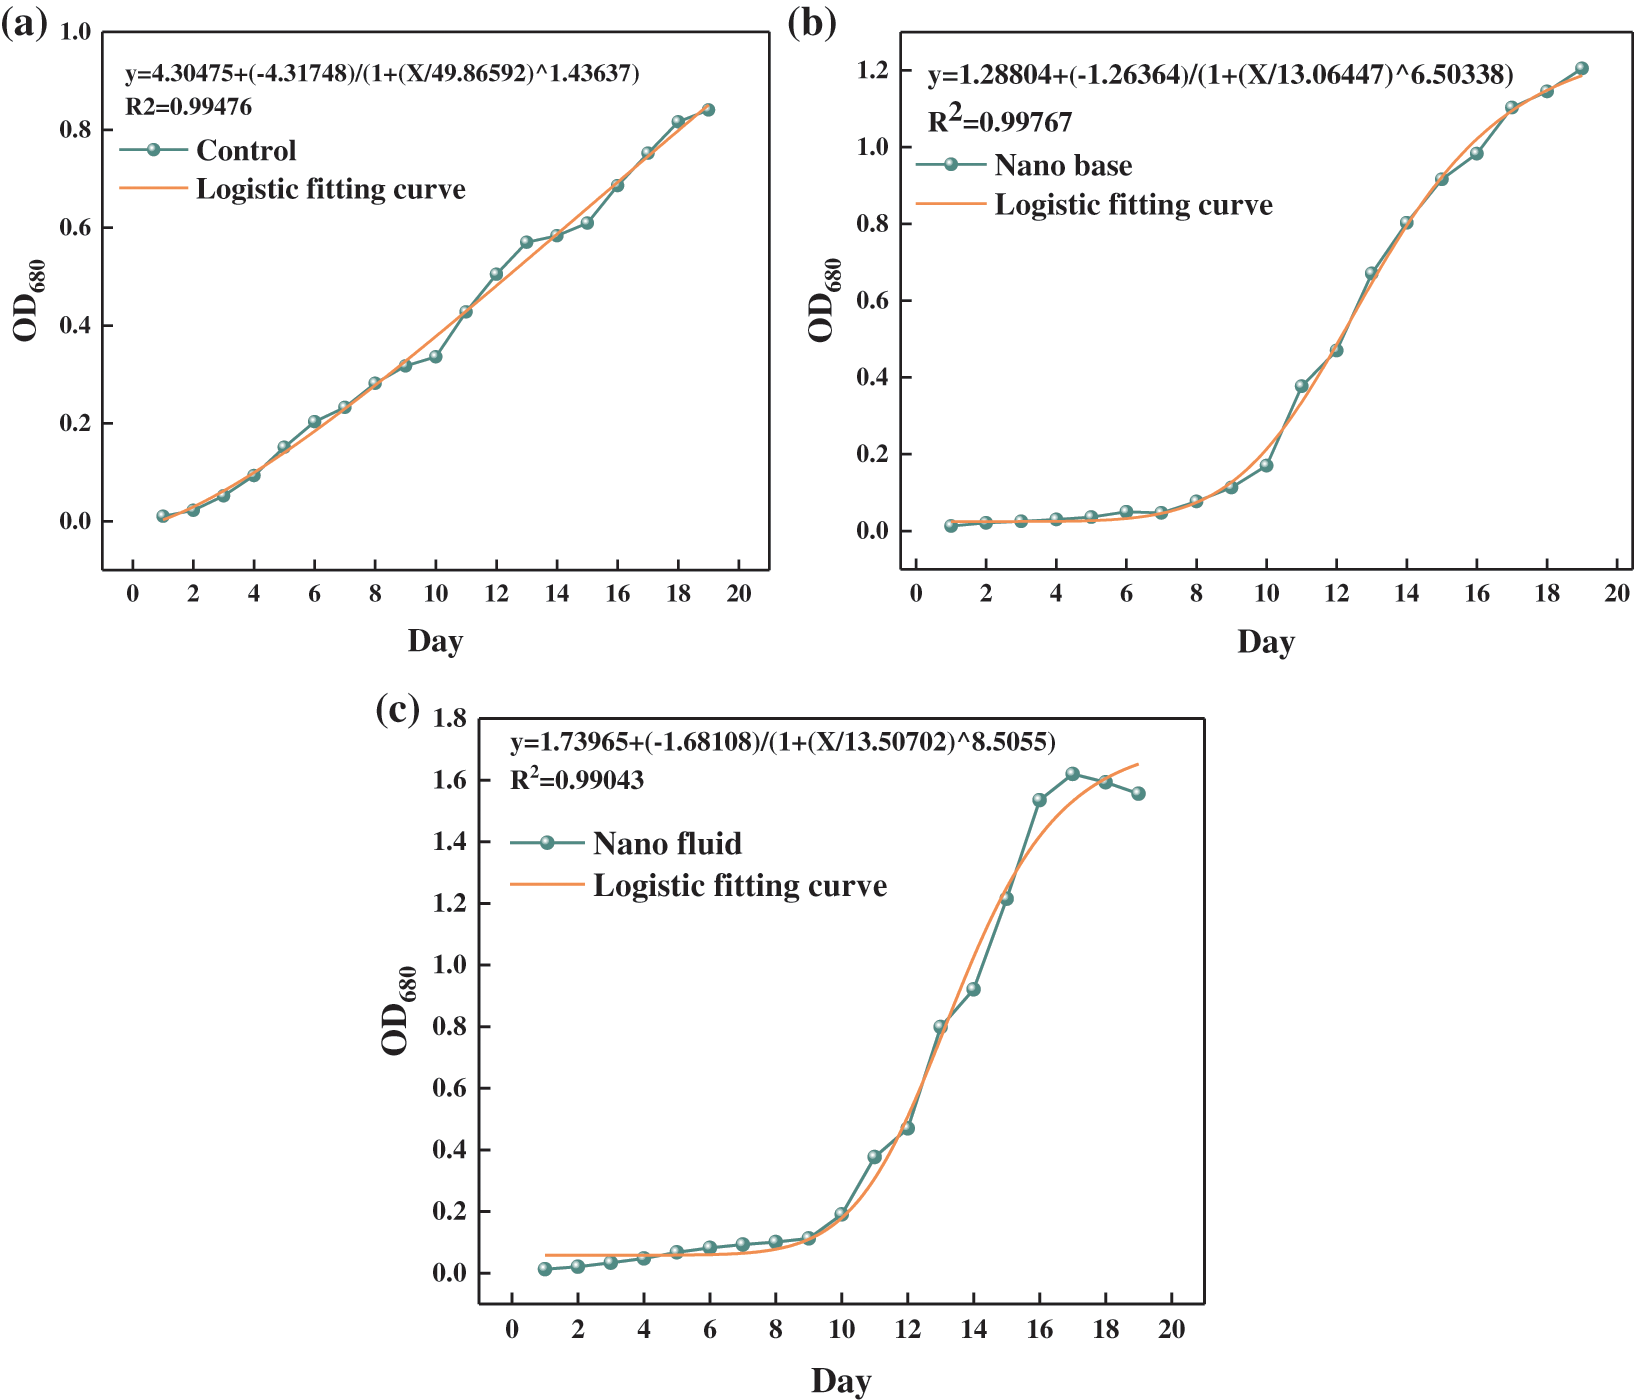
Figure 3: (a) Control group logistic fitting, (b) Basal solution group logistic fitting, (c) Nanofluid group logistic fitting
3.2 Nutrient Accumulation by Microalgae
Protein, carbohydrate, and lipid are the three main compounds in Chlorella cells and their content varies closely with culture conditions, environmental factors, and nutritional status, such as light, temperature, pH, N and P content, etc. It has been shown that the nutrient content of Chlorella can reach 70%–95% of the dry weight of the biomass, which is in agreement with the data measured in the experimental group samples. Three groups of experiments were conducted: Ag nanofluid, nano base, and the control group without nanofluids (Fig. 4). The most significant variability in nutrient accumulation is reported in Ag nanofluid. The nutrient accumulation of microalgae varies with changes in light intensity and light wavelength. The changes in nutrient accumulation and growth trends also demonstrate the effectiveness of nanofluids in changing the light requirements of microalgae growth [15]. As demonstrated in Fig. 4, Chlorella has an increase in both lipids and carbohydrates with a decrease in protein content, with the highest lipid content in Ag nanofluid. This study showed an 11.87% increase in lipids and a 15.62% increase in carbohydrates in the base fluid group compared to the group without nanofluids. The accumulation of nutrients in the basal solution group may be due to the rosy red color of the aqueous CoSO4 solution, which projects red light, resulting in a decrease in microalgal protein and an accumulation of lipids and carbohydrates. Some studies have shown that red light can indeed promote the lipid accumulation of microalgae, and the increase of lipid content leads to the decrease of protein content, which is due to the conversion relationship between protein, lipid and carbohydrate. According to the biochemical synthesis pathway in microalgae cells reported by Lv et al. [45], glyceraldehydes-3-phosphate (G3P) produced by the Calvin cycle in chloroplasts is a common precursor for protein, starch, and lipid synthesis, so a decrease in protein may lead to an increase in carbohydrate and lipid content. In this experiment, the nutrient accumulation of the nanofluid group is still higher than that of the base solution group, which may be due to the refraction and transmission of light by silver nanoparticles. The light intensity required for microalgae growth is far lower than the light intensity provided by the experiment due to the further screening of light intensity by silver nanoparticles. The Ag nanofluid group increased lipids by 23.98% and 10.84% and carbohydrates by 58.84% and 83.75% compared to the basal fluid and the group without nanofluids, respectively. The difference in the nutrient accumulation with the group without nanofluids may be due to the transmission of red light by the aqueous CoSO4 solution, while the difference with the base fluid group may be mainly due to the scattering properties of Ag nanoparticles. According to previous studies, Ag/CoSO4 solutions have high transmission rates between light wavelengths of 600–700 nm [36], which is the wavelength of red light. Based on the filtering of light by the aqueous CoSO4 solution, the Ag nanoparticles were further screened for light intensity as well as light wavelengths [46].

Figure 4: Nutrient accumulation in different experimental groups
3.3 Electrochemical Properties of Self-Cultivating Chlorella
3.3.1 Characterisation of Electrodes Prepared from Self-Cultivated Microalgae
The surface morphology of activated carbon was studied using scanning electron microscopy (SEM). As shown in Fig. 5a, there are no pores in the chlorella raw material; After pyrolysis and activation, there are a large number of small and dense pore structures on the surface of activated carbon, as shown in Figs. 5b and 5c.

Figure 5: (a) Chlorella vulgaris raw material, (b) (c) activated carbon, and (d) TEM analysis
In order to monitor the pore structure of carbon materials from chlorella vulgaris, nitrogen adsorption/desorption experiments were conducted, and the BET diagram of nitrogen adsorption/desorption isotherms of self-cultured chlorella vulgaris was obtained. As shown in Fig. 6a, the sample exhibited typical type I adsorption isotherm behaviour with rapid adsorption at low pressure and gradual saturation with increasing relative pressure, indicating rapid filling of mesopores and micropores in the sample [47,48]. The average pore size of carbon materials has reached 0.21894 nm. As shown in Fig. 6b, the pore size of carbon samples from Chlorella vulgaris is mostly less than 1 nm. However, the small pore structure can increase the ionic contact area of the electrolyte, which is believed to be beneficial to improving the specific capacitance of supercapacitors. As shown in Fig. 6c, the functional groups on the surface of carbon materials were observed by FTIR spectroscopy. There are vibrations on the surface of carbon materials at the following wavelengths: C-O at 1105 cm−1, carboxyl at 1380 cm−1, C=C at 1600 cm−1, and O-H at 3439 cm−1. The O-H at 3439 cm−1 indicates that the hydroxyl compound undergoes an association phenomenon, and the stretching vibration absorption peak of O-H shifts towards a low wave number direction. The C-O absorption peak at 1105 cm−1 is caused by the vibration of the C-O bond in lipids, alcohols, phenols, or ethers [49]. XRD can be used to determine the phase composition and crystal structure of carbon. As shown in Fig. 6d, two characteristic diffraction peaks can be observed, which are amorphous carbon structures [50].

Figure 6: (a) N2 adsorption desorption isotherm , (b) DFT pore size distribution, (c) FTIR analysis, (d) XRD analysis
XPS was used to analyze the functional groups on the surface of the sample. There is nearly 3% N element in the sample, as shown in Fig. 7b for the four deconvolution peaks of N1s, with pyrrole N as the highest content. Some studies have shown that pyrrole N contributes to the generation of pseudocapacitance [51]. The higher the N content, the better the conductivity of the electrode material. As shown in Fig. 7c, the sample contains 7.31% O, and the presence of oxygen containing functional groups can promote the exchange of anions and cations between the electrode and the electrolyte solution, thereby improving the efficiency of electron transfer [52]. The presence of N and O can improve the wettability of the electrode, thereby effectively improving its performance [53].

Figure 7: (a) XPS survey scans, (b) N1s spectra , (c) O1s spectra, (d) C1s spectra
3.3.2 Electrochemical Testing of Self-Cultivating Microalgae
Due to the dispersion capacitance effect, the diffusion rate of ions in the electrolyte in the pores of carbon materials varies with the current density. When the current density is high, the diffusion rate of ions in the pores will be lower than the conduction rate of electrons in the carbon skeleton, resulting in a decrease in specific surface utilization [54]. Therefore, it is important to observe whether the CV diagram can maintain an approximate rectangle when the scanning rate increases, which can be used as a basis for judging whether the material has good reversibility [55,56]. The good symmetry of the sample CV curve indicates that the electrode reaction is mainly a double layer charge transfer reaction, and the electrode material has typical characteristics of a double layer capacitor. As shown in the Fig. 8, at a maximum scanning rate of 0.1 V/s, the carbon sample has good capacitance retention and fast ion response ability. At a current density of 1 A/g, microalgae carbon reached 230 F/g. As the current density continues to rise, the specific capacitance of the sample decreases slightly, reaching 242 F/g at 0.5 A/g, while at 8 A/g, the specific capacitance decreases to 192 F/g, and at 10 A/g, the specific capacitance becomes 180 F/g. At lower current densities, the specific capacitance remains at a higher level, while at higher currents, the specific capacitance of the sample exhibits a small decrease. The rapid transport and diffusion of ions are important factors that affect the performance of capacitors [57]. When the current density is low, the sample fully forms a double layer capacitance [58]. When the current density is increased, only the surface forms a double layer capacitance, resulting in a decrease in specific capacitance [59].

Figure 8: (a) CV Curves, (b) GCD Curves
This study shows that Ag/COSO4 nanofluids have a screening effect on light, and the screening light wavelength range is within the suitable range of light wavelength for microalgae growth. Microalgae cultures based on Ag/COSO4 nanofluids increased biomass by 17.14%, lipid content by 10.84%, and carbohydrate content by 83.75%. In addition, protein accumulation was slightly inhibited and protein content decreased by 10%. It can be considered that nanofluid interference with light is an effective method to promote the growth of microalgae, enhance the metabolism and biological accumulation of microalgae biomolecules. Further, using a one-step method to prepare activated carbon materials for self-cultured microalgae, it was found that they contain a large number of micropores (micropore specific surface area: 1627.5314 m2/g, average pore size: 0.21294 nm) and a 2.94% N content. The electrochemical performance test shows that the specific capacitance reaches 230 F/g at the current density of 1 A/g, appearing good electrochemical performance.
Funding Statement: This work was supported by the Key Research and Development Project of Jiangsu Province (BE2019009-4), the National Natural Science Foundation of China (52106091), the Qing Lan Project of Jiangsu Province.
Conflicts of Interest: The authors declare that they have no conflicts of interest to report regarding the present study.
References
1. Blanken, W., Postma, P. R., de Winter, L., Wijffels, R. H., Janssen, M. (2016). Predicting microalgae growth. Algal Research, 14, 28–38. https://doi.org/10.1016/j.algal.2015.12.020 [Google Scholar] [CrossRef]
2. Wei, M., Marrakchi, F., Yuan, C., Cheng, X., Jiang, D. et al. (2022). Adsorption modeling, thermodynamics, and DFT simulation of tetracycline onto mesoporous and high-surface-area NaOH-activated macroalgae carbon. Journal of Hazardous Materials, 425, 127887. https://doi.org/10.1016/j.jhazmat.2021.127887 [Google Scholar] [CrossRef]
3. Viswanathan, K., Wang, S. (2021). Experimental investigation on the application of preheated fish oil ethyl ester as a fuel in diesel engine. Fuel, 285, 119244. https://doi.org/10.1016/j.fuel.2020.119244 [Google Scholar] [CrossRef]
4. Lakshmikandan, M., Murugesan, A. G., Wang, S., Abomohra, A. E. F., Jovita, P. A. et al. (2020). Sustainable biomass production under CO2 conditions and effective wet microalgae lipid extraction for biodiesel production. Journal of Cleaner Production, 247, 119398. https://doi.org/10.1016/j.jclepro.2019.119398 [Google Scholar] [CrossRef]
5. Wang, S., Mukhambet, Y., Esakkimuthu, S., Abomohra, A. E. L. F.(2022). Integrated microalgal biorefinery – routes, energy, economic and environmental perspectives. Journal of Cleaner Production, 348, 131245. https://doi.org/10.1016/j.jclepro.2022.131245 [Google Scholar] [CrossRef]
6. Han, S., Jin, W., Chen, Y., Tu, R., Abomohra, A. E. (2016). Enhancement of lipid production of chlorella pyrenoidosa cultivated in municipal wastewater by magnetic treatment. Applied Biochemistry and Biotechnology, 180(6), 1043–1055. https://doi.org/10.1007/s12010-016-2151-3 [Google Scholar] [CrossRef]
7. Song, C., Xie, M., Qiu, Y., Liu, Q., Sun, L. et al. (2019). Integration of CO2 absorption with biological transformation via using rich ammonia solution as a nutrient source for microalgae cultivation. Energy, 179, 618–627. https://doi.org/10.1016/j.energy.2019.05.039 [Google Scholar] [CrossRef]
8. Kurniawan, S. B., Ahmad, A., Imron, M. F., Abdullah, S. R. S., Othman, A. R. et al. (2022). Potential of microalgae cultivation using nutrient-rich wastewater and harvesting performance by biocoagulants/bioflocculants: Mechanism, multi-conversion of biomass into valuable products, and future challenges. Journal of Cleaner Production, 365, 132806. https://doi.org/10.1016/j.jclepro.2022.132806 [Google Scholar] [CrossRef]
9. Sánchez-Sandoval, D. S., González-Ortega, O., Navarro-Martínez, M. F., Castro-Tapia, J. M., de la Cruz, R. F. G. et al. (2021). Photodegradation and removal of diclofenac by the green alga Nannochloropsis oculata. Phyton-International Journal of Experimental Botany, 90(5), 1519–1533. https://doi.org/10.32604/phyton.2021.015087 [Google Scholar] [CrossRef]
10. Jiang, D., Li, H., Wang, S., Cheng, X., Bartocci, P. et al. (2023). Insight the CO2 adsorption onto biomass-pyrolysis derived char via experimental analysis coupled with DFT calculation. Fuel, 332, 125948. https://doi.org/10.1016/j.fuel.2022.125948 [Google Scholar] [CrossRef]
11. Duarte, J. H., de Souza, C. O., Druzian, J. I., Costa, J. A. V. (2019). Light emitting diodes applied in synechococcus nidulans cultures: Effect on growth, pigments production and lipid profiles. Bioresource Technology, 280, 511–514. https://doi.org/10.1016/j.biortech.2019.02.009 [Google Scholar] [CrossRef]
12. Salama el, S., Kim, H. C., Abou-Shanab, R. A., Ji, M. K., Oh, Y. K. et al. (2013). Biomass, lipid content, and fatty acid composition of freshwater Chlamydomonas mexicana and Scenedesmus obliquus grown under salt stress. Bioprocess and Biosystems Engineering, 36(6), 827–33. https://doi.org/10.1007/s00449-013-0919-1 [Google Scholar] [CrossRef]
13. He, Q., Yang, H., Wu, L., Hu, C. (2015). Effect of light intensity on physiological changes, carbon allocation and neutral lipid accumulation in oleaginous microalgae. Bioresource Technology, 191, 219–228. https://doi.org/10.1016/j.biortech.2015.05.021 [Google Scholar] [CrossRef]
14. Lima, S., Schulze, P. S. C., Schuler, L. M., Rautenberger, R., Morales-Sanchez, D. et al. (2021). Flashing light emitting diodes (LEDs) induce proteins, polyunsaturated fatty acids and pigments in three microalgae. Journal of Biotechnology, 325, 15–24. https://doi.org/10.1016/j.jbiotec.2020.11.019 [Google Scholar] [CrossRef]
15. Sudibyo, H., Pradana, Y. S., Samudra, T. T., Budiman, A., Indarto et al. (2017). Study of cultivation under different colors of light and growth kinetic study of chlorella zofingiensis dönz for biofuel production. Energy Procedia, 105, 270–276. https://doi.org/10.1016/j.egypro.2017.03.313 [Google Scholar] [CrossRef]
16. Kim, D. G., Lee, C., Park, S. M., Choi, Y. E. (2014). Manipulation of light wavelength at appropriate growth stage to enhance biomass productivity and fatty acid methyl ester yield using chlorella vulgaris. Bioresource Technology, 159, 240–248. https://doi.org/10.1016/j.biortech.2014.02.078 [Google Scholar] [CrossRef]
17. Ra, C. H., Kang, C. H., Jung, J. H., Jeong, G. T., Kim, S. K. (2016). Effects of light-emitting diodes (LEDs) on the accumulation of lipid content using a two-phase culture process with three microalgae. Bioresource Technology, 212, 254–261. https://doi.org/10.1016/j.biortech.2016.04.059 [Google Scholar] [CrossRef]
18. Yang, Y., Weathers, P. (2015). Red light and carbon dioxide differentially affect growth, lipid production, and quality in the microalga, Ettlia oleoabundans. Applied Microbiology and Biotechnology, 99(1), 489–499. https://doi.org/10.1007/s00253-014-6137-1 [Google Scholar] [CrossRef]
19. Pérez-López, P., de Vree, J. H., Feijoo, G., Bosma, R., Barbosa, M. J. et al. (2017). Comparative life cycle assessment of real pilot reactors for microalgae cultivation in different seasons. Applied Energy, 205, 1151–1164. https://doi.org/10.1016/j.apenergy.2017.08.102 [Google Scholar] [CrossRef]
20. Beigbeder, J. B., Boboescu, I. Z., Lavoie, J. M. (2021). Treatment and valorization of municipal solid waste gasification effluent through a combined advanced oxidation–microalgal phytoremediation approach. Journal of Cleaner Production, 299, 126926. https://doi.org/10.1016/j.jclepro.2021.126926 [Google Scholar] [CrossRef]
21. Sajid, M. U., Bicer, Y. (2020). Nanofluids as solar spectrum splitters: A critical review. Solar Energy, 207, 974–1001. https://doi.org/10.1016/j.solener.2020.07.009 [Google Scholar] [CrossRef]
22. Zhang, L., Liu, J., He, G., Ye, Z., Fang, X. et al. (2014). Radiative properties of ionic liquid-based nanofluids for medium-to-high-temperature direct absorption solar collectors. Solar Energy Materials and Solar Cells, 130, 521–528. https://doi.org/10.1016/j.solmat.2014.07.040 [Google Scholar] [CrossRef]
23. Chen, M. J., He, Y. R., Ye, Q., Wang, X. Z., Hu, Y. W. (2019). Shape-dependent solar thermal conversion properties of plasmonic Au nanoparticles under different light filter conditions. Solar Energy, 182, 340–347. https://doi.org/10.1016/j.solener.2019.02.070 [Google Scholar] [CrossRef]
24. Chai, J. Y. H., Wong, B. T. (2019). Study of light scattering by TiO2, Ag, and SiO2 nanofluids with particle diameters of 20–60 nm. Journal of Nano Research, 60, 1–20. https://doi.org/10.4028/www.scientific.net/JNanoR.60.1 [Google Scholar] [CrossRef]
25. Zeng, J., Xuan, Y. M. (2018). Enhanced solar thermal conversion and thermal conduction of MWCNT-SiO2/Ag binary nanofluids. Applied Energy, 212, 809–819. https://doi.org/10.1016/j.apenergy.2017.12.083 [Google Scholar] [CrossRef]
26. Zhang, Q., Uchaker, E., Candelaria, S., Cao, G. (2013). Nanomaterials for energy conversion and storage. Chemical Society Reviews, 42, 3127. https://doi.org/10.1039/c3cs00009e [Google Scholar] [CrossRef]
27. Wang, C., Wang, H., Dang, B., Wang, Z., Shen, X. et al. (2020). Ultrahigh yield of nitrogen doped porous carbon from biomass waste for supercapacitor. Renewable Energy, 156, 370–376. https://doi.org/10.1016/j.renene.2020.04.092 [Google Scholar] [CrossRef]
28. Wu, T., Jing, M., Tian, Y., Yang, L., Hu, J. et al. (2019). Surface-driven energy storage behavior of dual-heteroatoms functionalized carbon material. Advanced Functional Materials, 29(17), 1900941. https://doi.org/10.1002/adfm.201900941 [Google Scholar] [CrossRef]
29. Zhao, X. S. (2009). Carbon-based materials as supercapacitor electrodes. Chemical Society Reviews, 38, 2520–31. https://doi.org/10.1039/b813846j [Google Scholar] [CrossRef]
30. Song, M., Zhou, Y., Ren, X., Wan, J., Du, Y. et al. (2019). Biowaste-based porous carbon for supercapacitor: The influence of preparation processes on structure and performance. Journal of Colloid and Interface Science, 535, 276–286. https://doi.org/10.1016/j.jcis.2018.09.055 [Google Scholar] [CrossRef]
31. Zhang, W., Yang, Y., Xia, R., Li, Y., Zhao, J. et al. (2020). Graphene-quantum-dots-induced MnO2 with needle-like nanostructure grown on carbonized wood as advanced electrode for supercapacitors. Carbon, 162, 114–123. https://doi.org/10.1016/j.carbon.2020.02.039 [Google Scholar] [CrossRef]
32. Yu, Z., Wang, X., Song, X., Liu, Y., Qiu, J. (2015). Molten salt synthesis of nitrogen-doped porous carbons for hydrogen sulfide adsorptive removal. Carbon, 95, 852–860. https://doi.org/10.1016/j.carbon.2015.08.105 [Google Scholar] [CrossRef]
33. Ru, H., Bai, N., Xiang, K., Zhou, W., Chen, H. et al. (2016). Porous carbons derived from microalgae with enhanced electrochemical performance for lithium-ion batteries. Electrochimica Acta, 194, 10–16. https://doi.org/10.1016/j.electacta.2016.02.083 [Google Scholar] [CrossRef]
34. Lv, Z., Zhang, H., Liang, J., Zhao, T., Xu, Y. et al. (2022). Microalgae removal technology for the cold source of nuclear power plant: A review. Marine Pollution Bulletin, 183, 114087. https://doi.org/10.1016/j.marpolbul.2022.114087 [Google Scholar] [CrossRef]
35. Wang, K., Yang, J., Liu, W., Yang, H., Yi, W. et al. (2022). Self-nitrogen-doped carbon materials derived from microalgae by lipid extraction pretreatment: Highly efficient catalyst for the oxygen reduction reaction. Science of the Total Environment, 821, 153155. https://doi.org/10.1016/j.scitotenv.2022.153155 [Google Scholar] [CrossRef]
36. Han, X., Chen, X., Wang, Q., Alelyani, S. M., Qu, J. (2019). Investigation of CoSO4-based Ag nanofluids as spectral beam splitters for hybrid PV/T applications. Solar Energy, 177, 387–394. https://doi.org/10.1016/j.solener.2018.11.037 [Google Scholar] [CrossRef]
37. Bligh, E. G., Dyer, W. J. (1959). A rapid method of total lipid extraction and purification. Canadian Journal of Biochemistry and Physiology, 37(8), 911–917. https://doi.org/10.1139/o59-099 [Google Scholar] [CrossRef]
38. Payne, J. K., Stewart, J. R. (1988). The chemical composition of the thallus wall of characiosiphon rivularis (Characiosiphonaceae, Chlorophyta). Phycologia, 27(1), 43–49. https://doi.org/10.2216/i0031-8884-27-1-43.1 [Google Scholar] [CrossRef]
39. Kochert, G. D. (1978). Carbohydrate determination by the phenol-sulfuric acid method. In: Handbook of phycological methods, Physiological and biochemical methods, vol. 95. [Google Scholar]
40. Bradford, M. M. (1976). A rapid and sensitive method for the quantitation of microgram quantities of protein utilizing the principle of protein-dye binding. Analytical Biochemistry, 72(1–2), 248–54. https://doi.org/10.1016/0003-2697(76)90527-3 [Google Scholar] [CrossRef]
41. Salama, E. S., Kabra, A. N., Ji, M. K., Kim, J. R., Min, B. et al. (2014). Enhancement of microalgae growth and fatty acid content under the influence of phytohormones. Bioresource Technology, 172, 97–103. https://doi.org/10.1016/j.biortech.2014.09.002 [Google Scholar] [CrossRef]
42. Seo, Y. H., Cho, C., Lee, J. Y., Han, J. I. (2014). Enhancement of growth and lipid production from microalgae using fluorescent paint under the solar radiation. Bioresource Technology, 173, 193–197. https://doi.org/10.1016/j.biortech.2014.09.012 [Google Scholar] [CrossRef]
43. Yang, L., Su, Q., Si, B., Zhang, Y., Zhang, Y. et al. (2022). Enhancing bioenergy production with carbon capture of microalgae by ultraviolet spectrum conversion via graphene oxide quantum dots. Chemical Engineering Journal, 429, 132230. https://doi.org/10.1016/j.cej.2021.132230 [Google Scholar] [CrossRef]
44. Verhulst, P. F. (1838). Notice sur la loi que la population suit dans son accroissement. Correspondance Mathematique et Physique, 10, 113–121. [Google Scholar]
45. Lv, J. M., Cheng, L. H., Xu, X. H., Zhang, L., Chen, H. L. (2010). Enhanced lipid production of Chlorella vulgaris by adjustment of cultivation conditions. Bioresource Technology, 101(17), 6797–804. https://doi.org/10.1016/j.biortech.2010.03.120 [Google Scholar] [CrossRef]
46. Vargas-Estrada, L., Torres-Arellano, S., Longoria, A., Arias, D. M., Okoye, P. U. et al. (2020). Role of nanoparticles on microalgal cultivation: A review. Fuel, 280. https://doi.org/10.1016/j.fuel.2020.118598 [Google Scholar] [CrossRef]
47. Nielsen, L., Bandosz, T. J. (2016). Analysis of sulfamethoxazole and trimethoprim adsorption on sewage sludge and fish waste derived adsorbents. Microporous and Mesoporous Materials, 220, 58–72. https://doi.org/10.1016/j.micromeso.2015.08.025 [Google Scholar] [CrossRef]
48. Seki, Y., Yurdakoç, K. (2006). Adsorption of promethazine hydrochloride with KSF montmorillonite. Adsorption, 12(1), 89–100. https://doi.org/10.1007/s10450-006-0141-4 [Google Scholar] [CrossRef]
49. Feng, L., Zhao, G., Zhao, Y., Zhao, M., Tang, J. (2017). Construction of the molecular structure model of the shengli lignite using TG-GC/MS and FTIR spectrometry data. Fuel, 203, 924–931. https://doi.org/10.1016/j.fuel.2017.04.112 [Google Scholar] [CrossRef]
50. Niu, Q., Gao, K., Tang, Q., Wang, L., Han, L. et al. (2017). Large-size graphene-like porous carbon nanosheets with controllable N-doped surface derived from sugarcane bagasse pith/chitosan for high performance supercapacitors. Carbon, 123, 290–298. https://doi.org/10.1016/j.carbon.2017.07.078 [Google Scholar] [CrossRef]
51. Li, S., Yu, C., Yang, J., Zhao, C., Zhang, M. et al. (2017). Superhydrophilic “Nanoglue” stabilizing the metal hydroxides onto carbon materials for high-energy and ultralong-life asymmetric supercapacitors. Energy & Environmental Science, 10, 1958–1965. https://doi.org/10.1039/C7EE01040K [Google Scholar] [CrossRef]
52. Wei, X., Li, Y., Gao, S. (2017). Correction: Biomass-derived interconnected carbon nanoring electrochemical capacitors with high performance in both strongly acidic and alkaline electrolytes. Journal of Materials Chemistry A. 5, 20505. https://doi.org/10.1039/C7TA90196H [Google Scholar] [CrossRef]
53. Ma, C., Lu, T., Shao, J., Huang, J., Hu, X. et al. (2022). Biomass derived nitrogen and sulfur co-doped porous carbons for efficient CO2 adsorption. Separation and Purification Technology, 281, 119899. https://doi.org/10.1016/j.seppur.2021.119899 [Google Scholar] [CrossRef]
54. Wang, J., Zhang, X., Li, Z., Ma, Y., Ma, L. (2020). Recent progress of biomass-derived carbon materials for supercapacitors. Journal of Power Sources, 451, 227794. https://doi.org/10.1016/j.jpowsour.2020.227794 [Google Scholar] [CrossRef]
55. Yang, X., Wang, Q., Lai, J., Cai, Z., Lv, J. et al. (2020). Nitrogen-doped activated carbons via melamine-assisted NaOH/KOH/urea aqueous system for high performance supercapacitors. Materials Chemistry and Physics, 250, 123201. https://doi.org/10.1016/j.matchemphys.2020.123201 [Google Scholar] [CrossRef]
56. Cao, L., Li, H., Xu, Z., Zhang, H., Ding, L. et al. (2021). Comparison of the heteroatoms-doped biomass-derived carbon prepared by one-step nitrogen-containing activator for high performance supercapacitor. Diamond and Related Materials, 114, 108316. https://doi.org/10.1016/j.diamond.2021.108316 [Google Scholar] [CrossRef]
57. Hou, J., Cao, C., Idrees, F., Ma, X. (2015). Hierarchical porous nitrogen-doped carbon nanosheets derived from silk for ultrahigh-capacity battery anodes and supercapacitors. ACS Nano, 9(3), 2556–2564. https://doi.org/10.1021/nn506394r [Google Scholar] [CrossRef]
58. Wu, J., Xia, M., Zhang, X., Chen, Y., Sun, F. et al. (2020). Hierarchical porous carbon derived from wood tar using crab as the template: Performance on supercapacitor. Journal of Power Sources, 455, 227982. https://doi.org/10.1016/j.jpowsour.2020.227982 [Google Scholar] [CrossRef]
59. Xue, D., Zhu, D., Xiong, W., Cao, T., Wang, Z. et al. (2019). Template-free, self-doped approach to porous carbon spheres with high N/O contents for high-performance supercapacitors. ACS Sustainable Chemistry & Engineering, 7(7), 7024–7034. https://doi.org/10.1021/acssuschemeng.8b06774 [Google Scholar] [CrossRef]
Support Information
The materials required for the synthesis of the silver (Ag) nanoparticles were: silver nitrate (AgNO3, >99%, Sinopharm Chemical Reagent Co., Shanghai, China), ammonia aqueous (NH4OH, 25%–28%, Sinopharm Chemical Reagent Co., Shanghai, China), trisodium citrate (C6H5Na3O7⋅2H2O, ≥99%, Sinopharm Chemical Reagent Co., Shanghai, China), D(+)-glucose (C6H12O6), polyvinylpyrrolidone ((C6H9NO)n, K30, Sinopharm Chemical Reagent Co., Shanghai, China), and deionized (DI) water. All chemicals were purchased from Sinopharm, China, and utilized without further purification.
The experimental steps for the preparation of Ag/CoSO4 were as follows: the silver nanoparticles were synthesized by chemical reduction. Firstly, the silver ammonia solution was produced by adding a very small volume (<0.05 mL) of ammonia aqueous to 2 mL of aqueous AgNO3 (5 g/L). Next, 3 mg trisodium citrate, 50 mg D(+)-glucose and 500 mg polyvinylpyrrolidone (PVP) were dissolved in 50 mL DI water, then the mixture was heated under rapid stirring. After heating the mixture to 85°C under rapid stirring for 30 min, 2 mL of previously prepared silver ammonia solution was slowly added to the mixture. During the addition of the silver ammonia solution process at 85°C ± 5°C, the mixture color changed from clear to slightly yellow, then to a distinct honey color, and finally to a dark yellow. Note that the mixture was filled with an addition of fresh DI water to 50 mL after the reaction was completed due to evaporation loss. The PVP used acts both as a reducing agent and a dispersant, effectively preventing Ag nanoparticles from agglomerating. Finally, the solution was diluted with 40 g/L CoSO4 solution to develop three concentrations of Ag/CoSO4 nanofluids.
The mass fraction of Ag in the nanofluid used in this study was 5.3 ppm. In the microalgae culture experiments, the base solution CoSO4 and the nanofluid Ag/CoSO4 were added separately to the outer layer of the photobioreactor.
A modified Bligh and Dyer method [37] was used to extract total lipids. Briefly, the microalgae were mixed with a chloroform-methanol solution (2:1, v/v) by dissolving about 1 g of microalgae in 20 ml of solvent. At the same time, the mixture was acidified with 100 μl of 1 M HCl (≥36%, Sinopharm Chemical Reagent Co., Shanghai, China) to disperse the microalgae homogeneously. After mixing with a shaker for 3 h at room temperature, 0.2 volumes of NaCl (Sinopharm Chemical Reagent Co., Shanghai, China) solution (0.9%) were added. The mixture was centrifuged at low speed (2000 rpm) for 2 min to separate the organic phase. The organic phase was placed in a stream of argon gas to evaporate the organic solvent to weigh the lipids. The total lipid content was calculated as shown in Eq. (3).
In the formula, Wl is the weight of lipids extracted from microalgae.
Microalgal cells were extracted in a boiling water bath with a 1 N NaOH (96%, Sinopharm Chemical Reagent Co., Shanghai, China) solution for 2 h according to the method described by Payne and Stewart [38]. The phenol-sulfuric acid method [39] was used to quantify the total carbohydrate content. Briefly, 1 ml of 5% redistilled phenol was added to 1 ml of sample (1 N NaOH extract solution) and then 5 ml of concentrated sulfuric acid was mixed. After leaving the solution at room temperature for 30 min, the absorbance was measured at 490 nm. The total of 9 carbohydrate contents of the microalgae were quantified according to the glucose standard curve. Similarly, microalgal cells were extracted with a 1 N NaOH solution and then the total protein content was determined according to the Bradford method [40]. Briefly, 0.1 ml of sample (1 N NaOH extraction solution) was added to 3 mL of Komas Brilliant Blue reagent and then left at room temperature for 5 min. The absorbance of the solution was measured at 595 nm. The concentration of each sample was determined using a bovine serum albumin standard curve.
Cite This Article
 Copyright © 2023 The Author(s). Published by Tech Science Press.
This work is licensed under a Creative Commons Attribution 4.0 International License , which permits unrestricted use, distribution, and reproduction in any medium, provided the original work is properly cited.
 Downloads
 Citation Tools