
 Submit a Paper
 Propose a Special lssue
 Open Access
ARTICLE

Study on Influencing Factors of Methane Production Efficiency of Microbial Electrolytic Cell with CO2 as Carbon Source
College of Energy and Mechanical Engineering, Shanghai University of Electric Power, Shanghai, 200090, China
* Corresponding Author: Yuanbo Hou. Email:
(This article belongs to the Special Issue: New Trends in Renewable and Sustainable Materials for Carbon Neutrality)
Journal of Renewable Materials 2023, 11(8), 3333-3350. https://doi.org/10.32604/jrm.2023.027464
Received 31 October 2022; Accepted 05 January 2023; Issue published 26 June 2023
 View Full Text
 Download PDF
Abstract
Reducing CO2 to produce methane through microbial electrolytic cell (MEC) is one of the important methods of CO2 resource utilization. In view of the problem of low methanogenesis rate and weak CO2 conversion rate in the reduction process, the flow field environment of the cathode chamber is changed by changing the upper gas circulation rate and the lower liquid circulation rate of the cathode chamber to explore the impact on the reactor startup and operation and products. The results showed that under certain conditions, the CO2 consumption and methane production rate could be increased by changing the upper gas recirculation rate alone, but the increase effect was not obvious, but the by-product hydrogen production decreased significantly. Changing the lower liquid circulation rate alone can effectively promote the growth of biofilm, and change the properties of biofilm at the later stage of the experiment, with the peak current density increased by 16%; The methanogenic rate decreased from the peak value of 0.561 to 0.3 mmol/d, and the CO2 consumption did not change significantly, which indicated that CO2 was converted into other organic substances instead of methane. The data after coupling the upper gas circulation rate with the lower liquid circulation rate is similar to that of only changing the lower liquid circulation rate, but changing the upper gas circulation rate can alleviate the decline of methane production rate caused by the change of biofilm properties, which not only improves the current density, but also increases the methane production rate by 0.05 mmol/d in the stable period. This study can provide theoretical and technical support for the industrial application scenario of flow field regulation intervention of microbial electrolytic cell methanogenesis.Keywords
At present, mankind is facing serious environmental and energy problems. In order to alleviate the increasingly serious resource shortage and environmental pollution [1], on the one hand, it is necessary to develop and utilize new energy sources such as solar energy and wind energy [2,3]; On the other hand, it is necessary to research and develop environment-friendly and low-cost waste resource utilization technology to solve problems such as excessive carbon emissions [4,5]. In recent years, China has vigorously promoted the “dual carbon” strategy [6–8]. CO2 recycling is one of the effective solutions to reduce terminal carbon emissions and achieve the “dual carbon” strategy, and it is also the focus of current research in the field of clean energy.
Biomethanation of CO2 is an important way of CO2 resource utilization [9]. It mainly uses the characteristics of the microbial electrolytic cell (MEC) to degrade organic matter or reduce CO2 to generate hydrogen and methane through external input electric energy [10–12]. Microbial fuel cell (MFC) generates current through the microbial decomposition of organic compounds, which can be regarded as a power source. MEC can generate methane and hydrogen gas by applying current to microorganisms. The applied voltage, temperature, and electrode properties [13–16] are the main factors affecting the efficiency of the device. Among them, the external voltage has a significant impact on the performance of the microbial electrolytic cell, and the optimal voltage range is generally −0.5 to −0.9 v [17]; Temperature is also one of the important factors affecting the device, and the general optimal temperature range is 32°C~38°C [18]; In addition, the nature of the electrode is closely related to the products of the microbial electrolytic cell. The cathode area is the focus of the research on methane production in the activated sludge electrolytic cell. The size of the cathode area directly affects the reaction of carbon dioxide, hydrogen and other reactants on the activated sludge. Gao et al. [19] studied three reaction configurations with different cathode space ratios (ratio of cathode surface area to reaction area volume). The results show that when the cathode space ratio is increased to 1.33 and 2 cm2/cm3, respectively, a better flow pattern can be obtained and the mass transfer effect is enhanced. The influence of electrode spacing [20] on electrode performance. Reducing the spacing will cause changes in internal resistance and hydrodynamic parameters. The electrode spacing will affect the internal resistance of the system, and the change of the electrode spacing will lead to the change of the hydrodynamic parameters, which is one of the reasons why single chamber reactors are often used at present. The internal resistance of the single chamber reactor is small, which is conducive to electron transfer. In the continuous operation mode [21], the removal rate of COD for the electrode spacing of 2 mm is 30.7% and 15.2% higher than that for the electrode spacing of 8 mm, respectively. The internal resistance in the reactor is closely related to the transfer of hydrogen ions between electrodes. Fang et al. [22,23] studied the mechanism of Electrical-to-biochemical conversion (E2BC), developed several artificial E2BC processes, and proposed ways to improve the efficiency of E2BC, including self-powered electro-biochemical reactor, light-assisted and electrode-free MES. The most advanced electrochemical and photochemical CO2 biomethane methods in the abiotic biological mixed system are summarized.
The above factors are the mainstream of the research on the efficiency of the microbial electrolytic cell. In the process of more and more extensive industrial applications in the future, the construction of microbial electrolytic cell reactors will be standardized, and the voltage, temperature and electrodes will be arranged and designed according to the best configuration, especially large reactors. However, there is still much room for research on the influence of changes in the flow field inside the reactor on the performance. It is very necessary to improve the methane production rate and carbon dioxide conversion rate by changing the flow field inside the microbial electrolytic cell reactor in combination with the idea of biogas purification.
During methanogenesis in the microbial electrolytic cell, the gas contact in the reaction setup and the gas contact with the biocathode will influence the results [24]. In the reaction with CO2 as the only carbon source, the maximum utilization of resources can be achieved by converting all the gases generated in the system into methane [25]. The purpose is to improve the technical parameters in the production process of the unit, and finally improve the CO2 conversion rate and increase the methane output [26].
The research on full gas exposure is mainly concentrated in the field of biogas upgrading [27]. Biogas contains a lot of CO2, methane, hydrogen and other gases. The main means of biogas upgrading is purification by removing impurities (mainly CO2), which are used to replace natural gas power generation and natural gas vehicles [28]. In this process, CO2 removal is accompanied by a small amount of CH4 loss. Therefore, the method of further increasing methane production by directly converting CO2 into additional CH4 has been emphasized. Gas circulation [29] also promotes the interaction between gas and liquid, consider extending the retention time of the gas in the liquid to increase the contact with the reactor liquid phase, and control the gas recirculation rate to improve the quality of output gas [30]. Kougias et al. [31] improved the biogas upgrading efficiency by increasing the biogas reflux method. Zhao et al. [32] compared the methane output of gas recycling under neutral and slightly alkaline conditions, which is 6%–7% and 14%–15% higher than that of the device without gas recycling. Karim et al. [33] studied the effect of mixing on biogas production and the mixed digester produces more biogas than the unmixed digester, but it does not perform better in the start-up period. Zhao et al. [34] used gas recycling to increase the methane yield by 31%–44% and the methane content at the same time. It was pointed out that the reason was related to the strong electron transfer under recycling conditions. Siegert et al. [35] studied the role of the reaction environment in increasing methane yield in the process of methanogenesis by using Marburg methanogen. It was found that gas flow rate and reactor pressure would increase methane yield. The maximum biogas production rate is 950 mmol/L/h at 60% CH4 concentration and 85% CH4 concentration at 255 mmol/L/h biogas production rate. These two parameters are mutually restrictive.
The research on the flow field in the reactor is not only focused on the upper gas, but also on the lower fermentation liquid flow field. In the current literature, circulating the fermentation liquid of the device will change the sludge activity, which may change the methane production, but it will also increase other products. Chou et al. [36] studied the mass transfer characteristics between the substrate and sludge in the expanded granular sludge reactor, improved the flow field in the reactor and increased the removal rate of phenol. Hydraulic circulation can speed up the start-up stage of the reactor, which proves that hydraulic circulation does have an impact on the internal reaction [37]. Gao et al. [38] used hydrodynamics to simulate the internal flow in MEC, optimize reactor parameters, and improve the efficiency of methanogenesis.
The control group was used in this experiment. The micro pump was used to change the gas recirculation rate in the upper layer and the liquid recirculation rate in the lower layer of the cathode chamber of the reactor. Study and compare the changes in pH value, current density, CO2 consumption, methane production rate and other indicators in the cathode chamber of the microbial cell under different upper gas circulation rates and lower liquid circulation rates, and obtain the quantitative impact of flow field changes on the microbial cell. In this way, efficient recovery and utilization of CO2 and improvement of methane yield can be realized. It provides a theoretical reference for the wide application of CO2 methane production based on microbial electrolytic cells.
2 Experimental Materials and Methods
2.1 Construction Process of Reactor
In this experiment, a double chamber H-type reactor was used, and the reactor material was plexiglass. The experimental group consists of two single chambers (model: 100 ml) to form a cathode chamber and an anode chamber. The effective volumes of both the cathode chamber and the anode chamber are 155 ml. Each group of experiments is provided with 0.8 v external voltage by potentiostat, and the data recorder is connected to record data at the same time. Use the proton exchange membrane (DuPont N117) to separate the anode chamber from the cathode chamber, allowing only electrons and protons to pass through. The distance between the cathode and anode is 11 cm. Titanium wire with a diameter of 1 mm and high-purity graphite felt (40 mm × 40 mm × 3 mm) together form the reactor cathode. The platinum plate electrode (specification: 10 mm × 10 mm × 0.1 mm) is used as the reactor anode, and the AgCl electrode (CHI111) is used as the reference electrode. Insert the reference electrode into the inclined upper part of the cathode chamber and seal it with a gasket to ensure the sealing environment. Each double chamber reactor cathode chamber is inoculated with 20 g of centrifuged activated sludge. The equipment parameters are shown in the following Tables 1 and 2. Fig. 1 is the physical picture of the equipment.
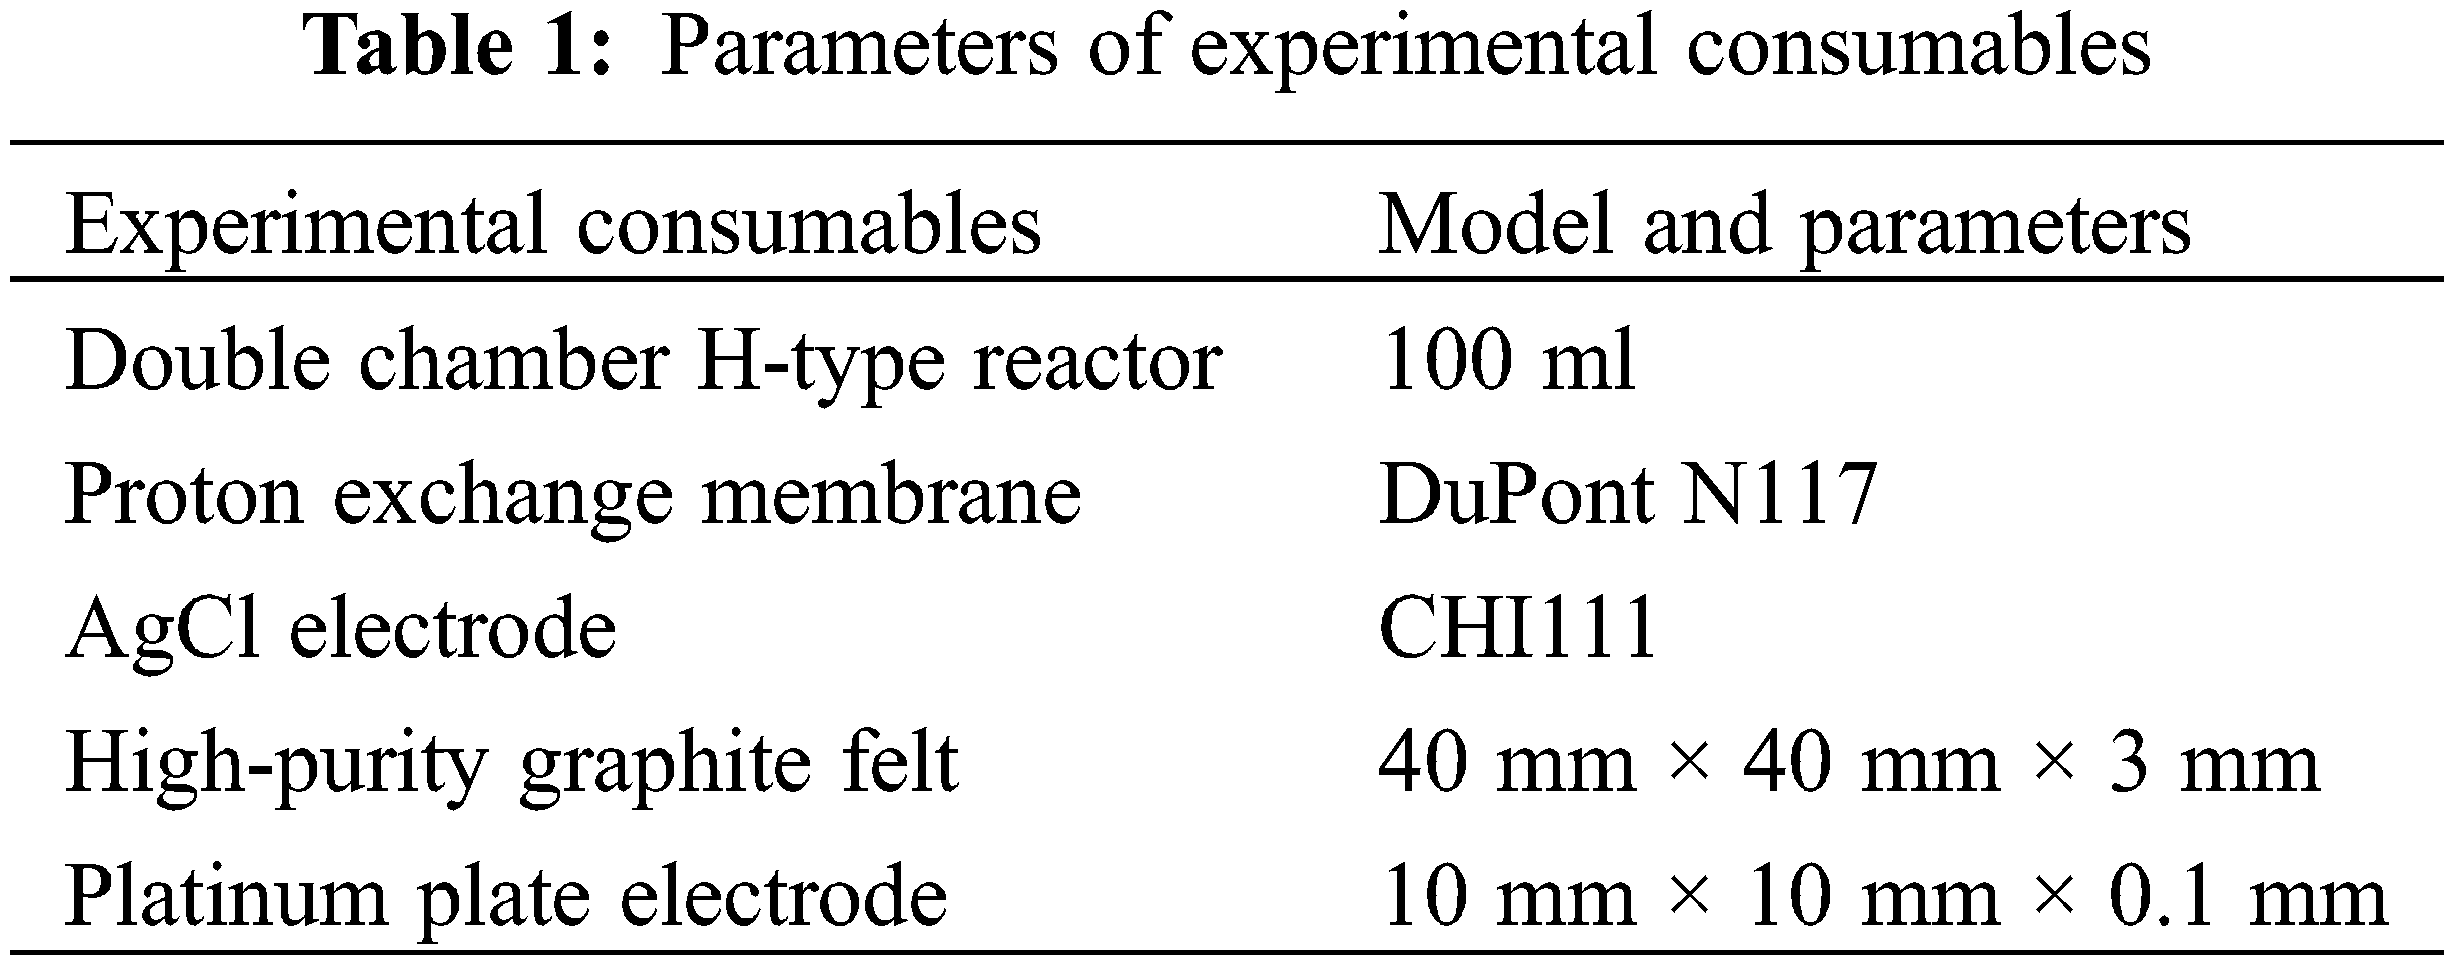
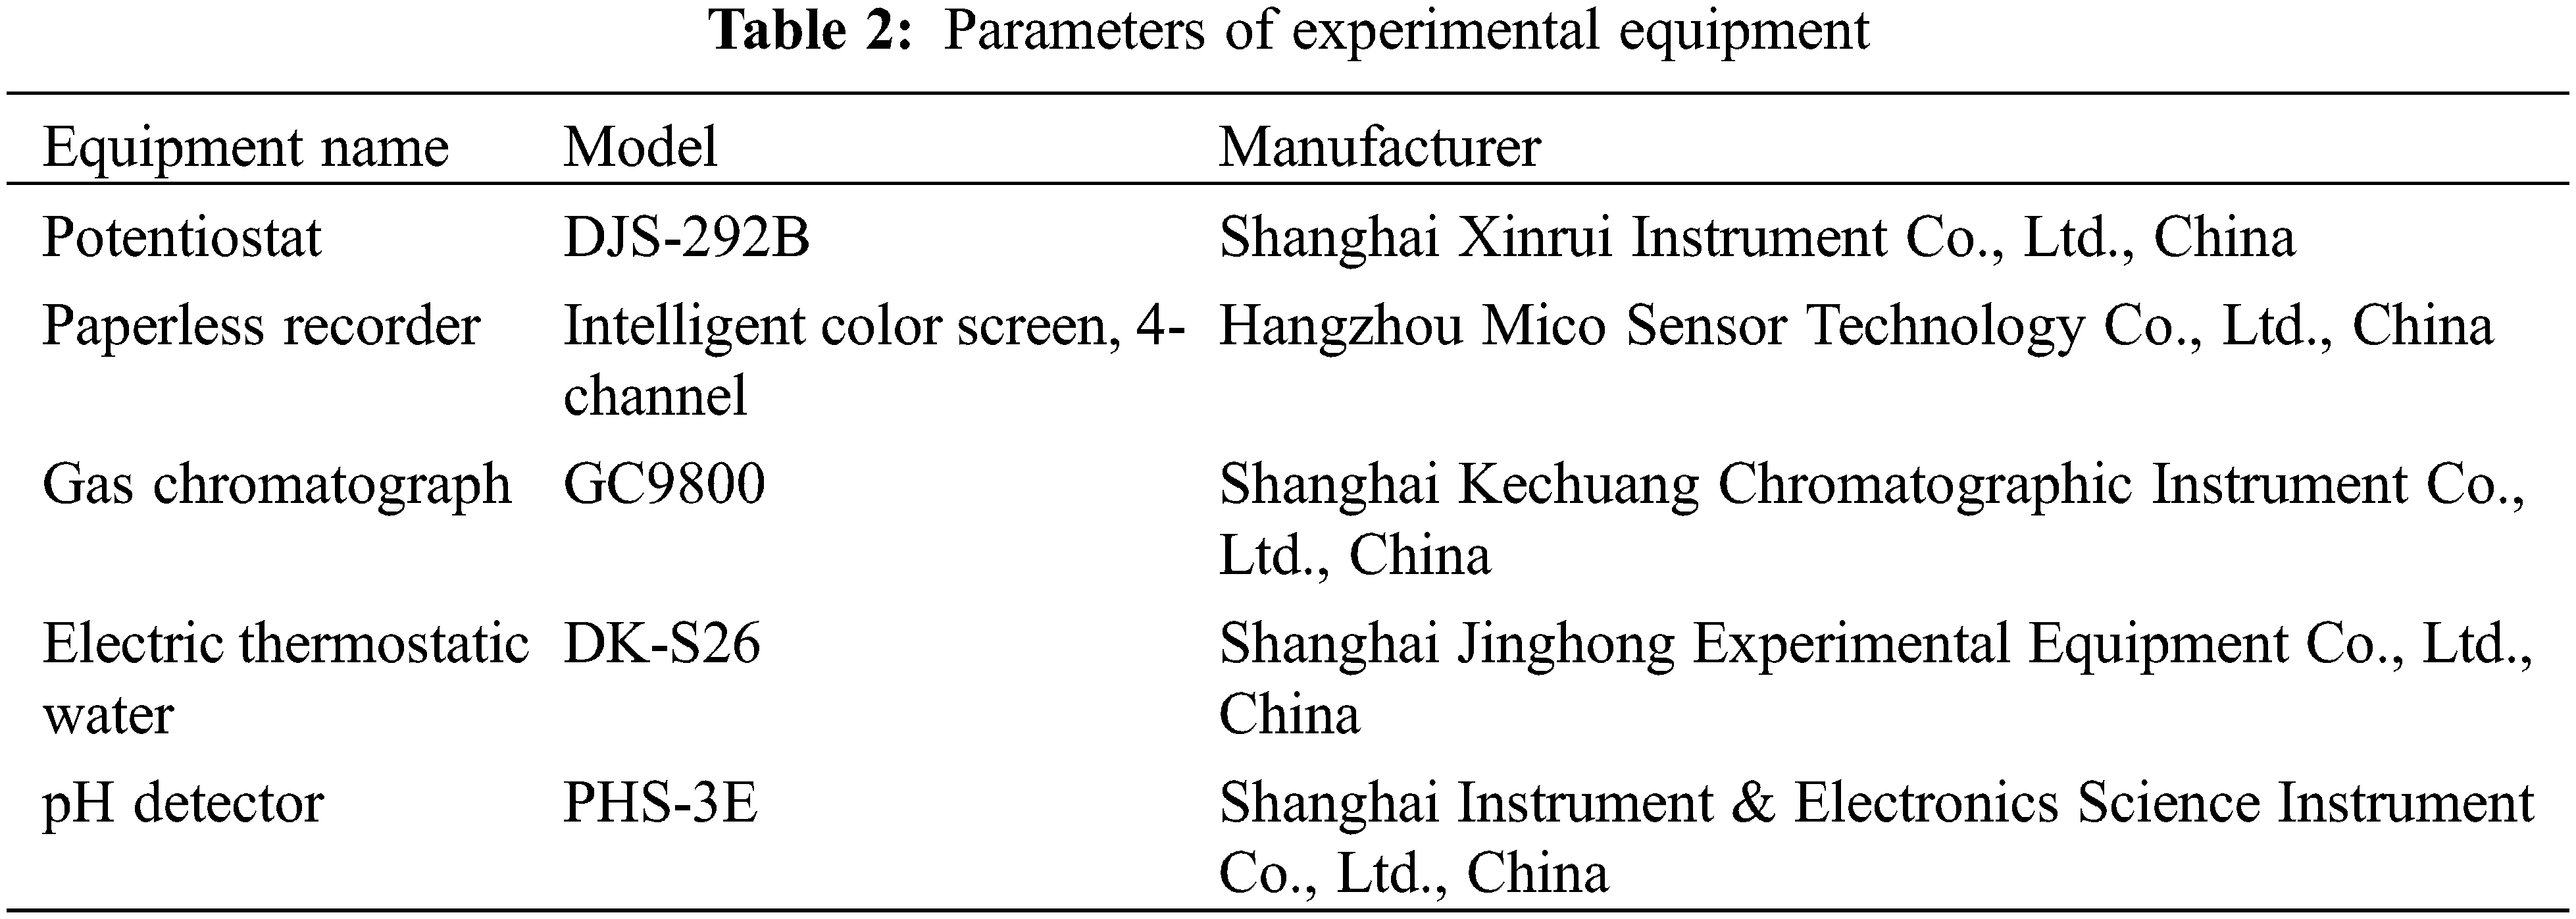
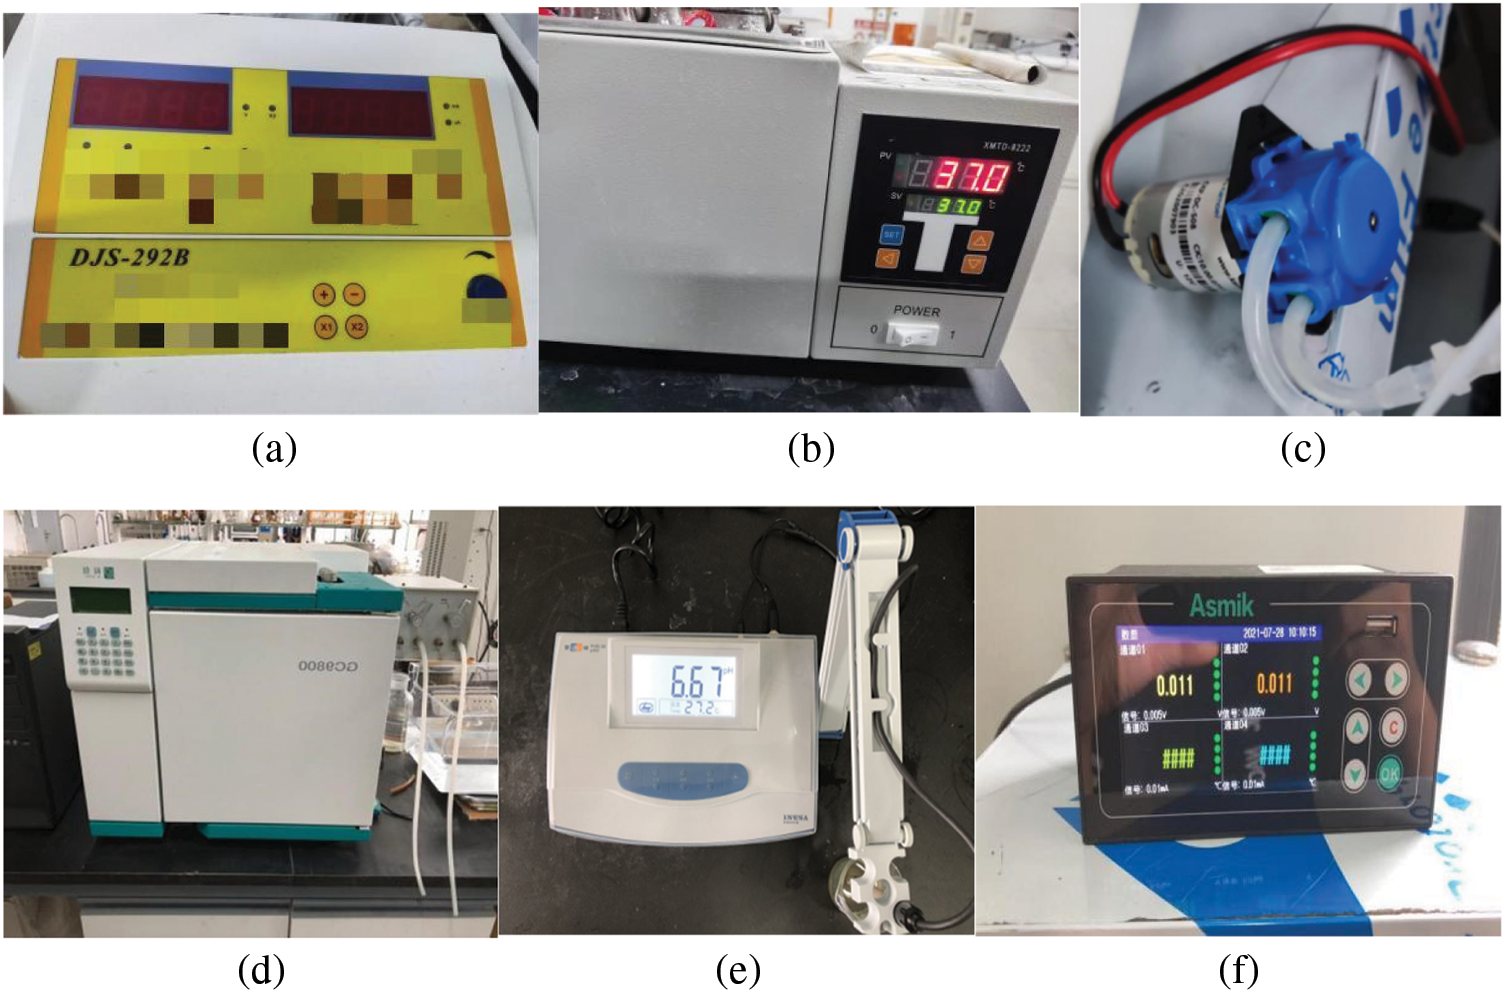
Figure 1: Experimental equipment diagram. (a) Potentiostat. (b) Electric thermostatic water. (c) Peristaltic pump. (d) Gas chromatograph. (e) pH detector. (f) Paperless recorder
The cathode chamber of the reactor is composed of upper layer gas and lower layer electrolyte solution. A micro peristaltic pump is used to connect the solution outlet at the slant bottom of the cathode chamber with the reactor plastic seal, as shown in Fig. 2. The lower liquid is controlled by changing the liquid circulation rate to change the flow field. The micro peristaltic pump is used to connect the gas outlet and gas inlet on the plastic seal, and the upper gas flow is controlled by changing the gas recirculation rate.
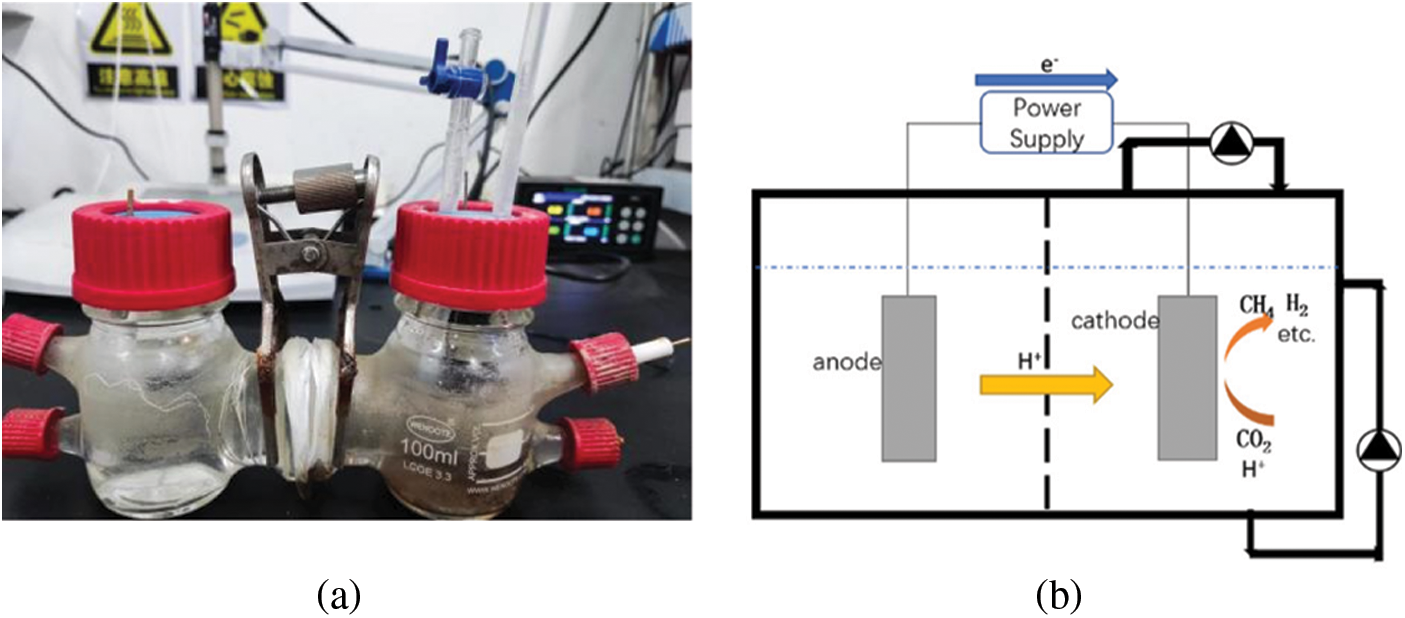
Figure 2: MEC reactor and circulation diagram. (a) MEC reactor. (b) MEC cycle diagram
At present, the reaction principle of methanogenesis in the microbial electrolytic cell is generally considered as two cases. One is that methanogens directly obtain electrons transferred from the external circuit from the cathode surface to reduce the incoming CO2 to methane. It is called direct extracellular electron transfer. The reaction equation corresponding to the reduction of CO2 to produce methane is [39]:
The other is that H+ first obtains electrons on the cathode surface and is reduced to hydrogen, and then hydrogen and CO2 synthesize methane through methanogens under the action of applied voltage, which is called indirect extracellular electron transfer [9]:
It should be pointed out that these two methods generally exist at the same time, and their respective proportions depend on the change of reaction environment.
In this experiment, the sludge inoculated in the cathode chamber is taken from Shanghai Bailonggang Sewage Treatment Plant. The pH of electrolyte solution of both cathode and anode is 7. The cathode chamber and anode chamber are filled with 100 and 110 mL electrolyte solutions, respectively.
The peristaltic pump is respectively connected with the water inlet and the water inlet of the cathode chamber, and different flow velocities are set; At the same time, the peristaltic pump is used to connect the air inlet and outlet at the upper part of the reactor, and different flow rates are set. The reactors are all placed in a 37°C thermostatic water bath, and the CO2 with a flow rate of 0.3 L/min is introduced into the cathode chamber for aeration. The aeration time is 30 min and the cycle is 48 h.
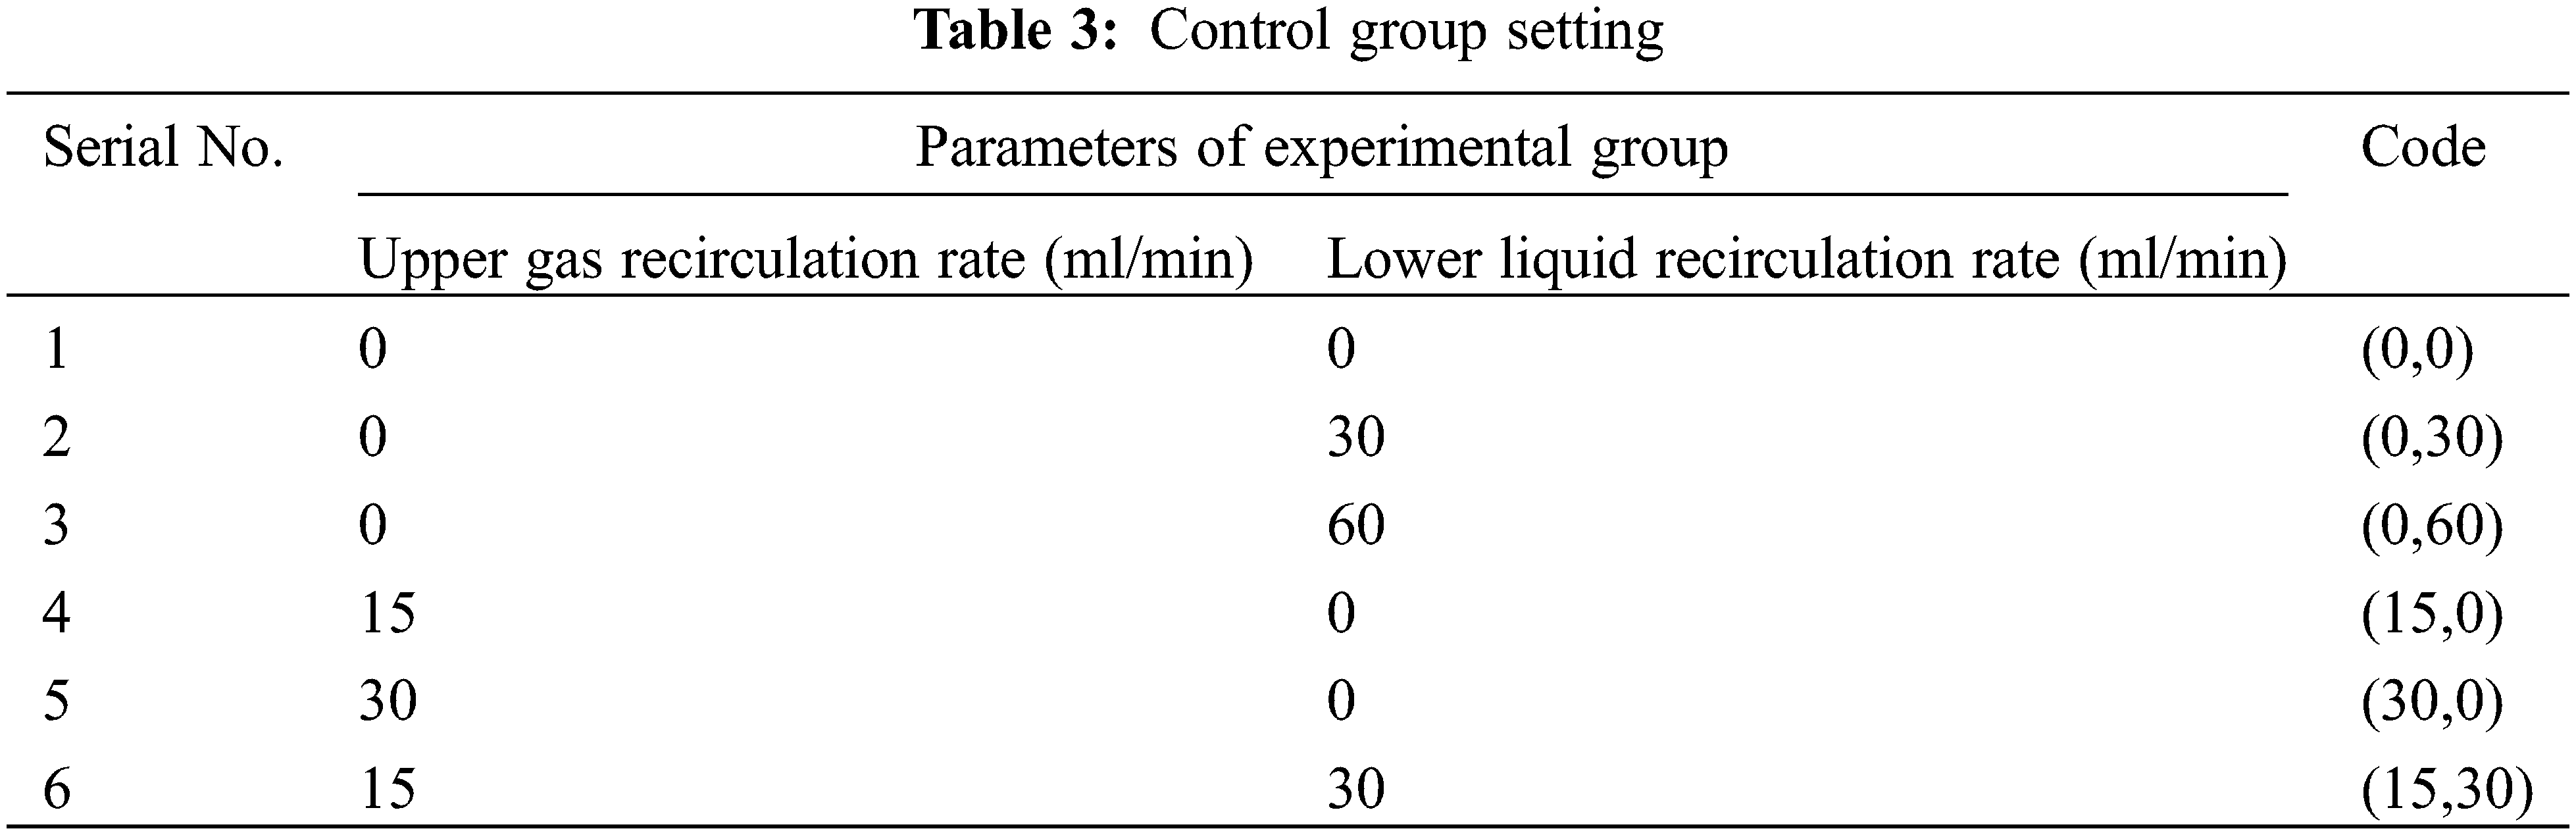
Six groups of experiments are set up in this experiment. (15,30) indicates that the upper gas recirculation rate is 15 ml/min, and the lower liquid recirculation rate is 30 ml/min, and so on for other experimental groups. Set six groups of experiments (0,0) (0,30) (0,60) (15,0) (30,0) (15,30), as shown in Table 3 below.
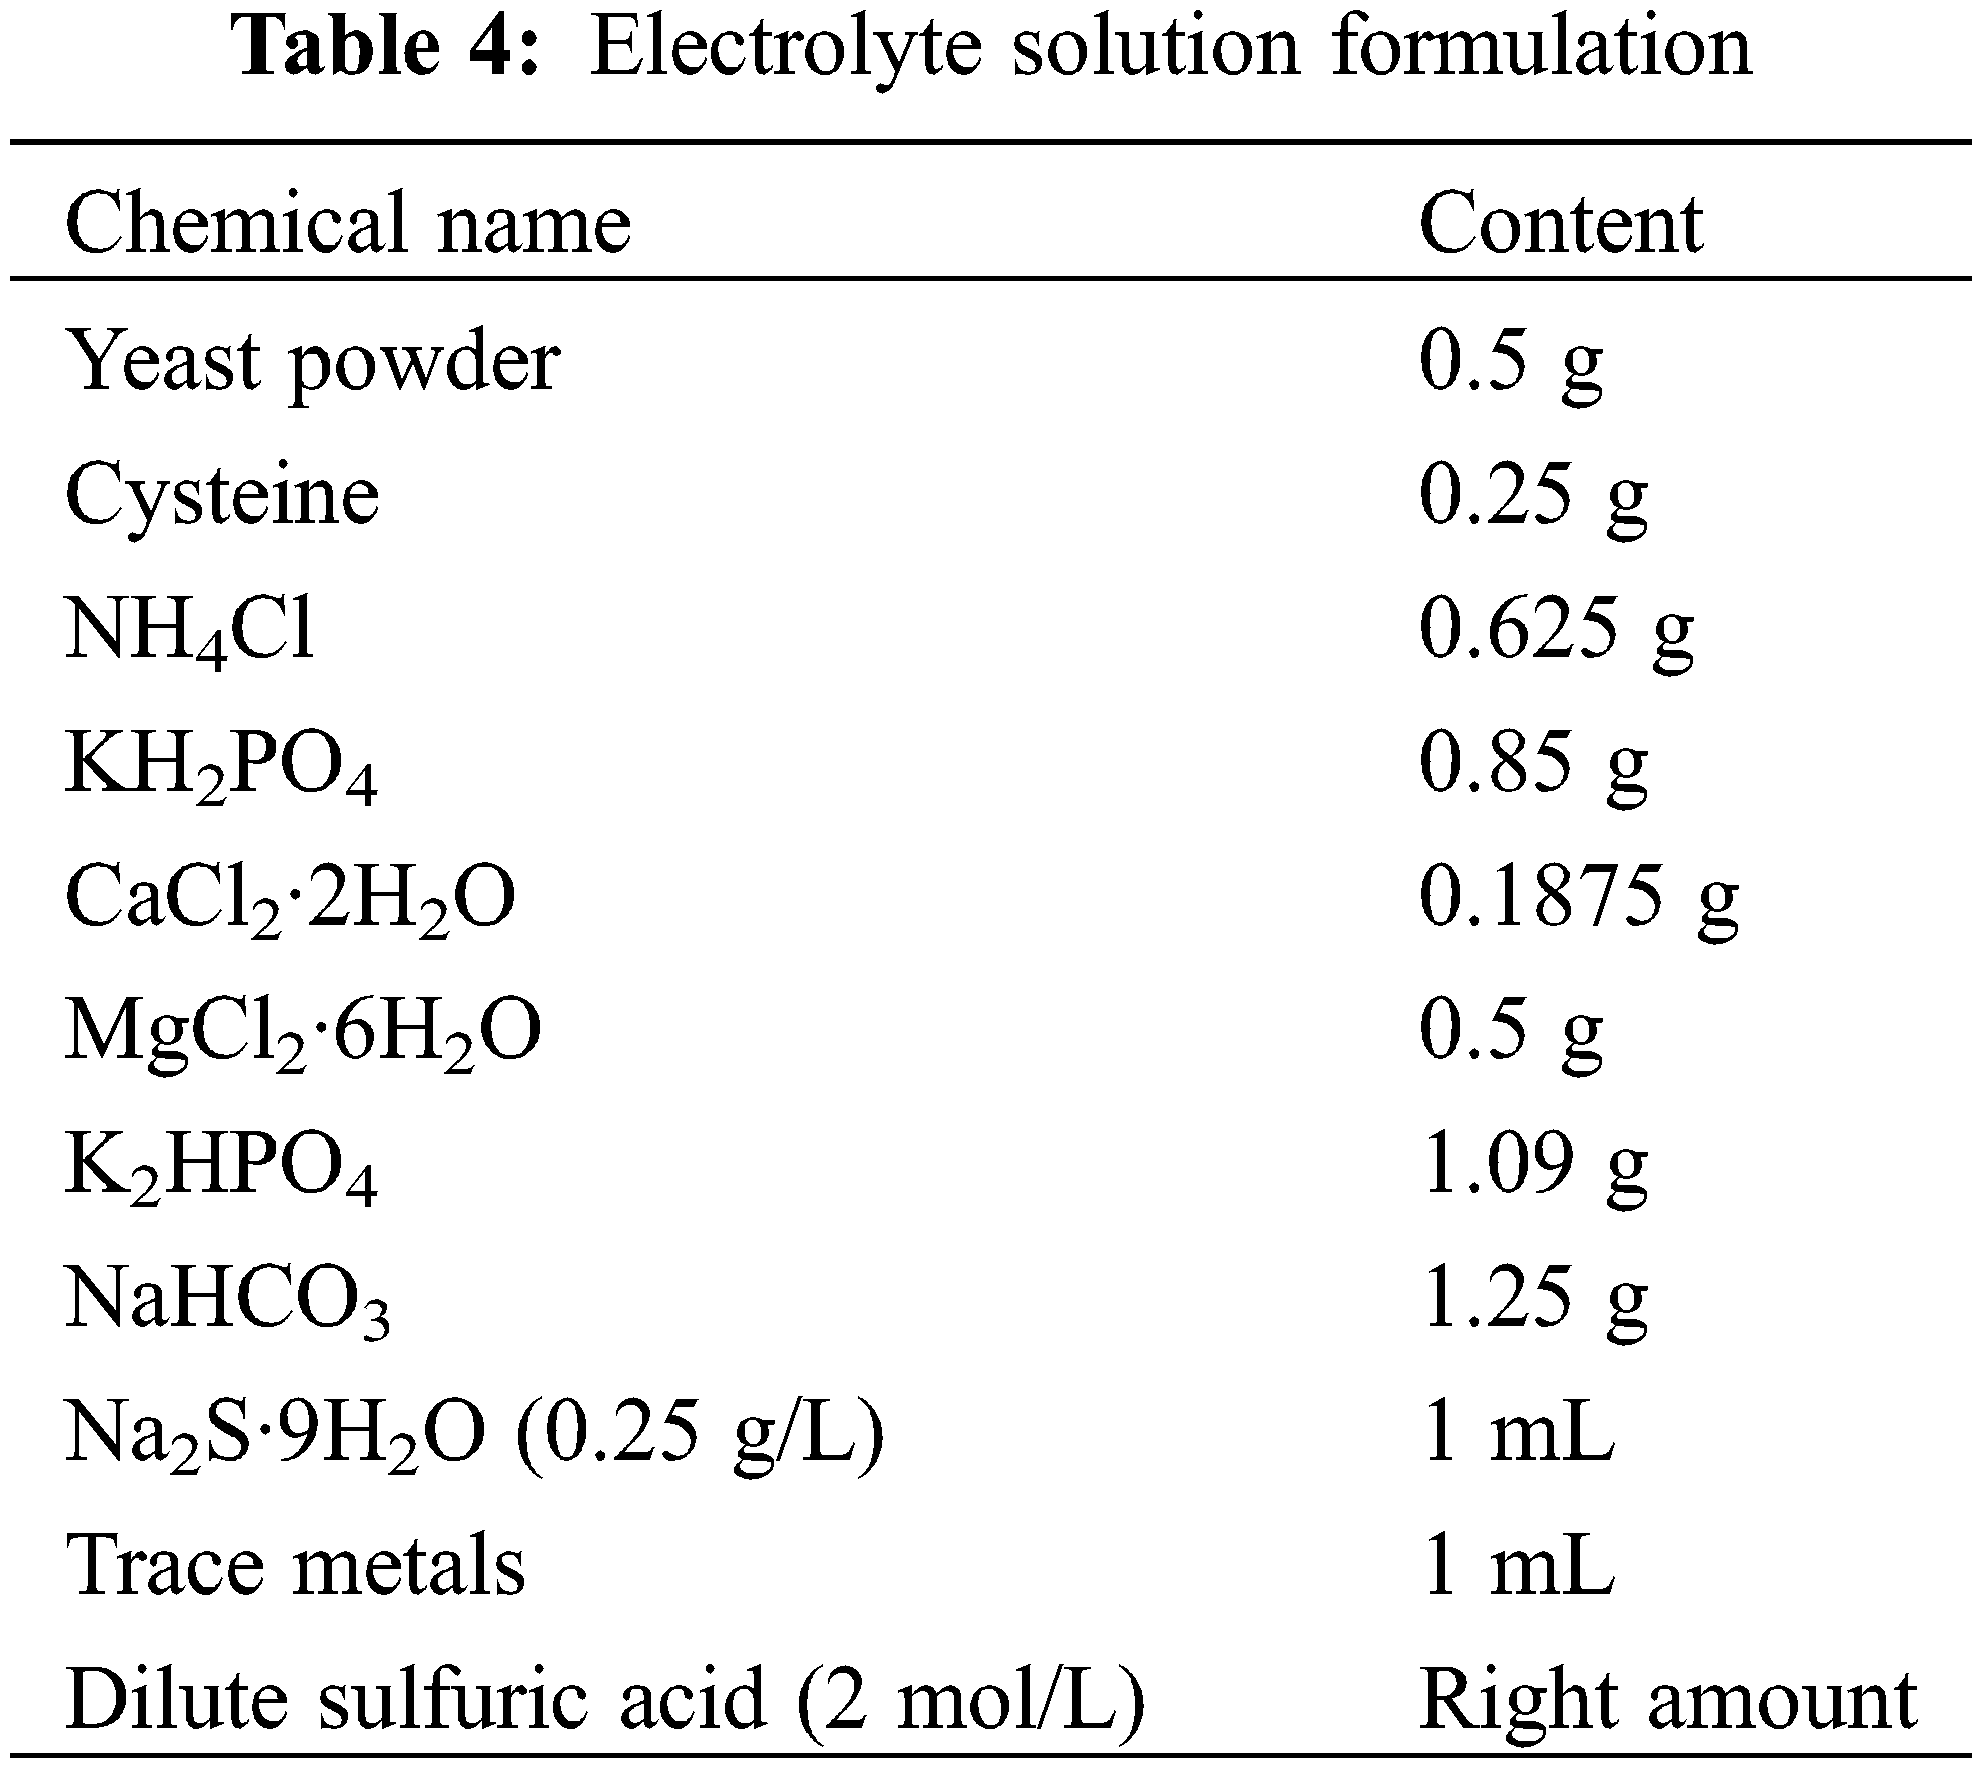
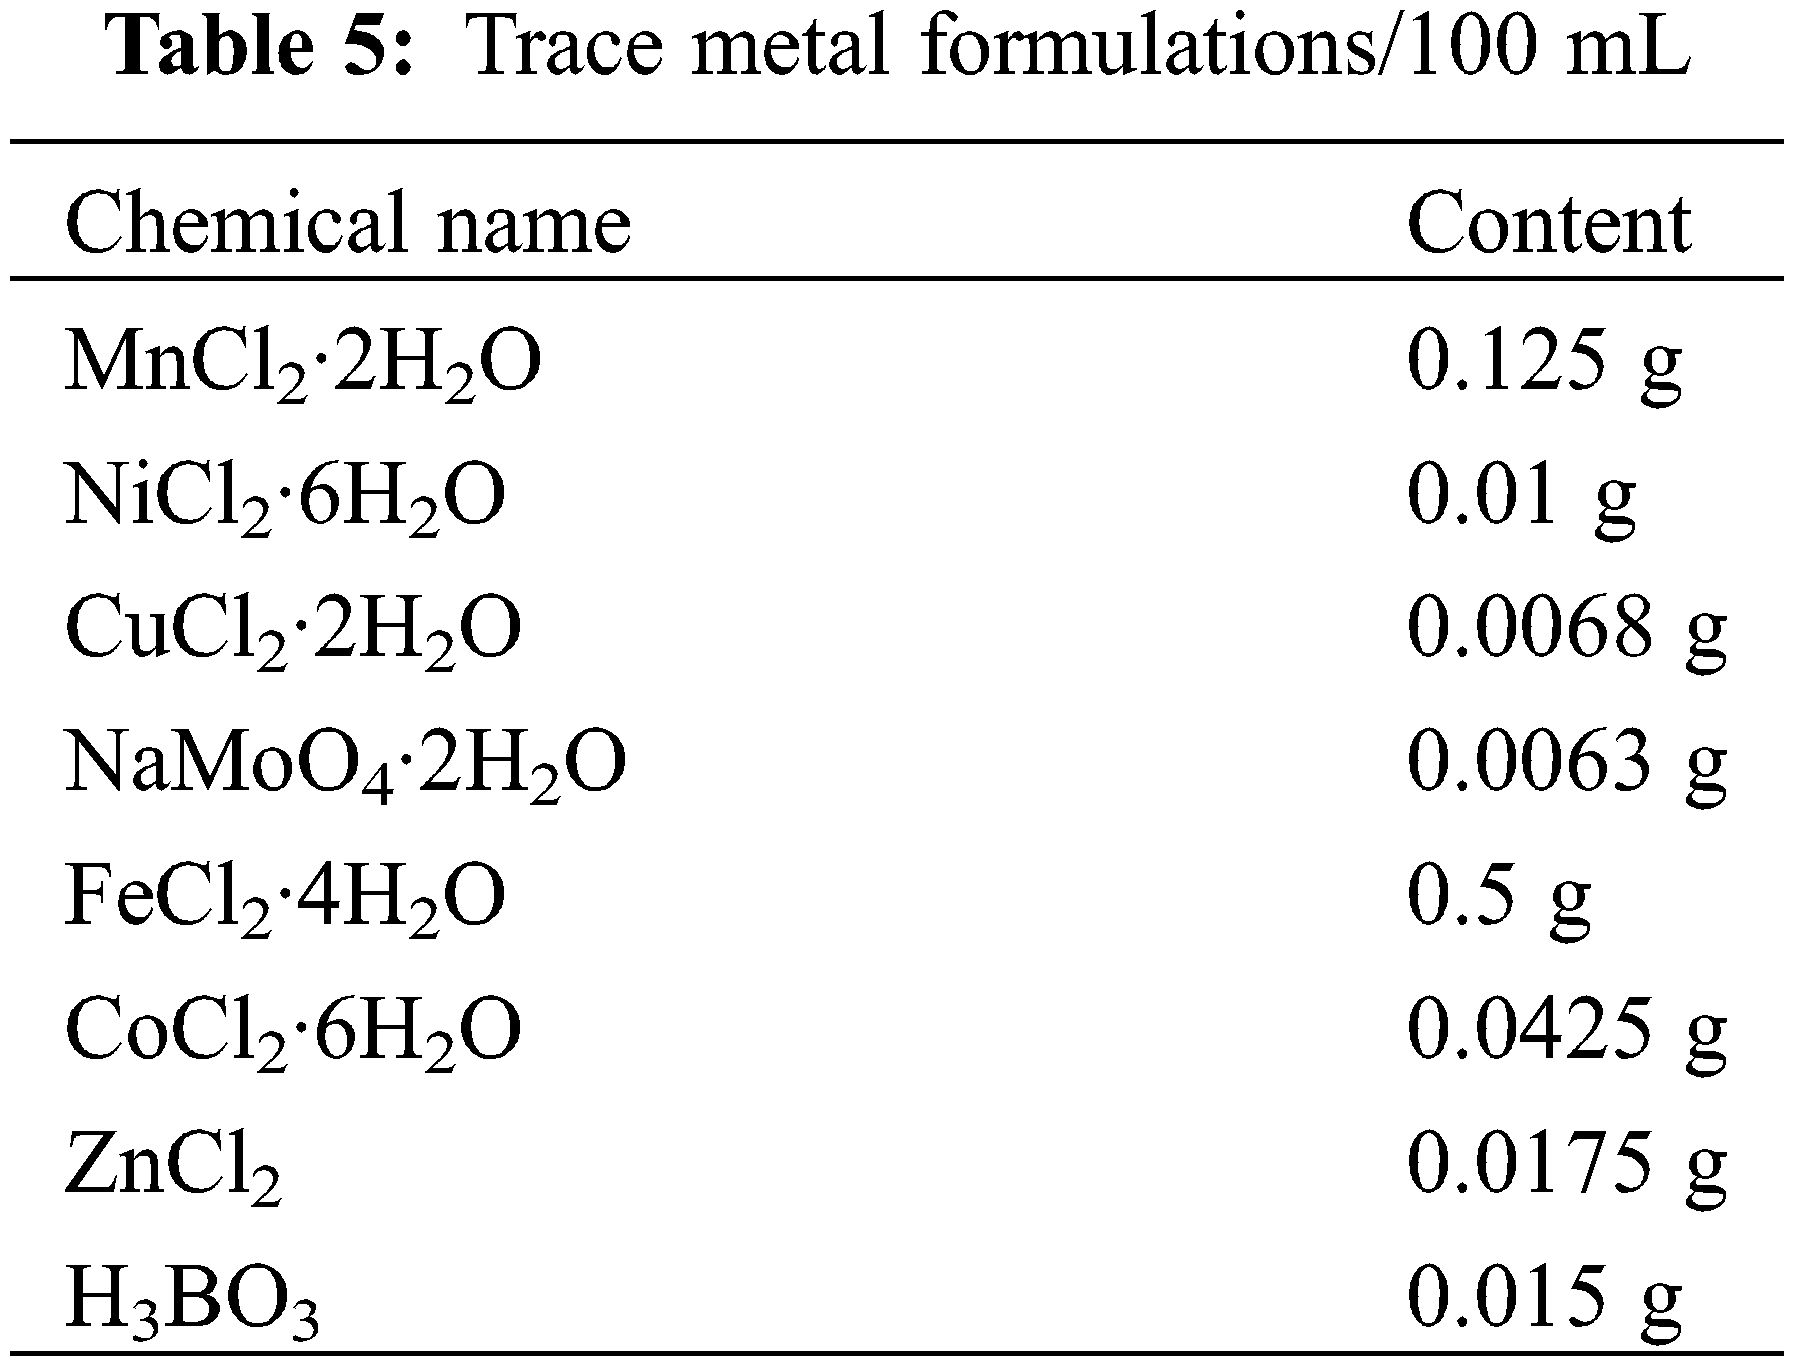
The composition of anode and cathode common nutrient solution is shown in Tables 4 and 5 below.
2.3 Data Detection and Calculation Method
The data to be detected include the change of pH value of electrolyte during the experiment, the gas output, the proportion of each component in the gas, and the current density of the experimental device. The pH value is an important indicator to reflect the reactor environment, and the overly acidic and alkaline environment is not conducive to the survival of microorganisms; The output of various gases and the proportion of various gas components are the direct indicators of reactor performance; The current density can reflect the degree of electron transfer in the process of gas production, and can also indicate the active degree of the reaction. All methods and calculation formulas refer to relevant paper [40].
(1) The pH value detection of cathode solution:
During the experiment, the pH of the solution in the cathode chamber is measured every 48 h by (PHS-3E, Shanghai Yidian Scientific Instrument Co., Ltd., China). The specific operation is to use a needle tube to extract a small amount of cathode solution for detection during aeration, and then drive it into the cathode chamber again after completion.
(2) Gas detection:
Gas detection shall be carried out once every 48 h. 1 ml of gas generated in the cathode chamber shall be extracted with a sampler, and the gas composition shall be detected through a gas chromatograph (GC9800 of Shanghai University of Science and Technology Chromatograph Co., Ltd., China).
(3) Current density detection:
Use a paperless recorder (Hangzhou Mico Sensor Technology Co., Ltd., China) to record the reactor current and convert it to the current density based on the surface area of the cathode electrode. The calculation formula is:
where, I is the loop current (A), and A is the surface area of cathode graphite felt (m2).
3 Experimental Results and Discussion
3.1 Analysis of pH Change of Cathode Solution
The pH of the solution in the cathodic reaction chamber is detected every 48 h, and the pH change of the reactor cathodic solution is shown in Fig. 3.
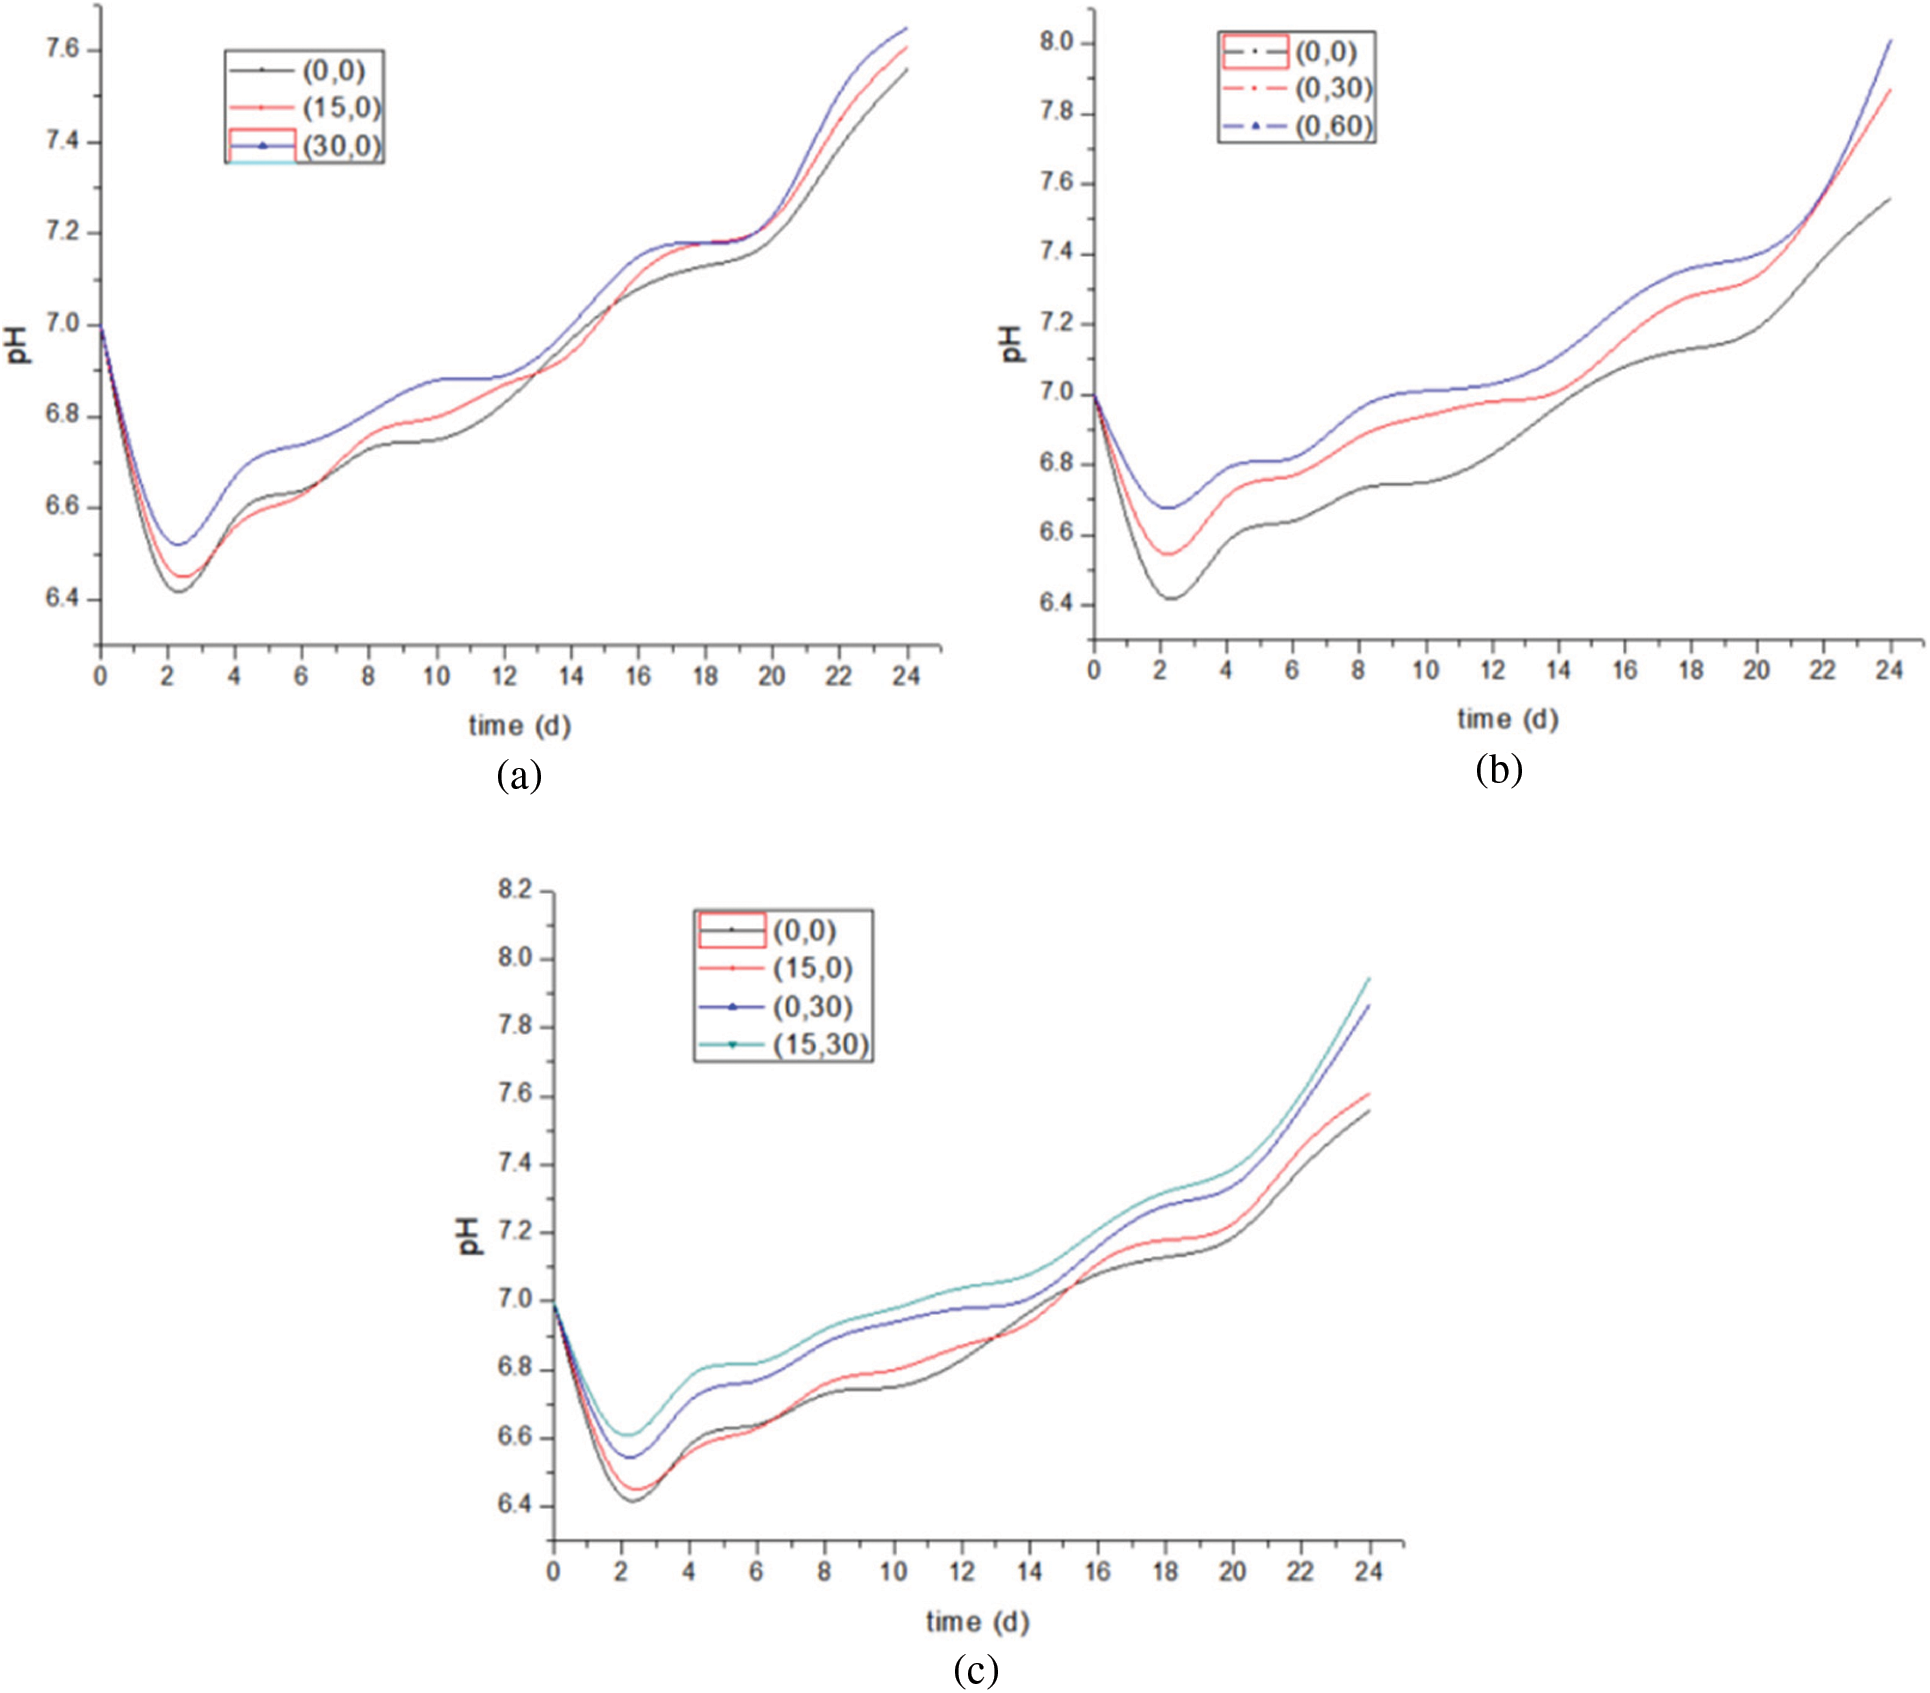
Figure 3: pH changing of experimental group under different conditions
In general, the pH value of the cathode solution of the reactor in the experimental group fluctuated between 6.4–8.0. The pH value of all reactor cathode solutions decreases first and then rises slowly, but the fluctuation amplitude varies slightly according to the applied conditions. First of all, the pH value of all reactors decreased in varying degrees during startup. The pH decreased in the startup phase, which may be caused by the following reasons: the cathode may not have formed a complete biofilm in the startup phase, resulting in the proton generated accumulating in the biological cathode, unable to participate in the reaction to generate methane, resulting in a decrease in the pH value.
When both the upper and lower rates of the reactor are 0, the overall pH curve of the control group (0,0) is lower, and the pH of the cathode solution of the control group is more acidic than that of other experimental groups. Before the experiment, phosphate buffered saline (PBS) was added to all cathode solutions to buffer the pH value of the solution and ensure the normal survival of the bacteria. The reason for the change of pH value is that the biological cathode continuously consumes protons to produce methane and hydrogen.
Fig. 3a shows the comparison of three groups of pH changes when only the upper gas recirculation rate is changed. After the initial pH decline, the pH of the three groups of cathode solutions began to rise. The overall trend of the three groups of curves did not change significantly, but with the rate change, the pH values at the end of the experiment were 7.54, 7.61 and 7.65, respectively. The increase rate of pH in the (30,0) experimental group was significantly faster than that in the other two experimental groups. At about 12 to 14 days, the pH was close to the beginning 7, which was 2 to 3 days earlier than that in the (15,0) and (0,0) groups. It is speculated that the reason is to change the gas recirculation rate, improve the contact between CO2 and solution, so that the CO2 in the dead corner of the flow also participates in the reaction, which can be inferred from the CO2 consumption of the three groups of experiments. At the same time, the enhancement of gas flow also promoted the by-product H2 to participate in CO2 generation, which not only reduced the by-product, but also increased the output of the main product.
Fig. 3b shows the comparison of pH changes in three groups when only the lower liquid circulation rate is changed. (0,60) group compared with the other two groups, the pH value of the experimental group increased significantly compared with the control group, the maximum value was 7.95. Combined with the corresponding methane yield, it can be seen that changing the lower liquid circulation rate significantly promotes the methane generation and hydrogen ion consumption, thus increasing the solution pH value. However, the change of pH according to the methane production rate and the total amount of methane cannot explain the decrease of methane production rate in the late reaction period. This is described in detail in the product analysis section.
Fig. 3c shows the comparison of pH changes by simultaneously changing the upper gas recirculation rate and the lower liquid recirculation rate. In the initial stage of startup, the decrease was the most in the (0,0) group and the least in the (15,30) group. The results showed that changing the gas recirculation rate and the lower liquid recirculation rate together accelerated the formation of the cathode biofilm at the initial start-up stage, and methane production consumed part of hydrogen ions. According to the methane gas production data, compared with (0,0), the methane production of the other three groups of experiments is higher. In the four groups of experiments, the pH value of the experimental group (0,30) and the experimental group (15,30) rose rapidly, approaching 7.0 on the 12th day. In combination with the methane yield, it was obvious that the lower liquid circulation rate accelerated the formation of the cathodic biofilm.
To sum up, the effect of changing the lower liquid circulation rate alone on the pH value of solution is far greater than that of changing the upper gas circulation rate alone; In the coupling between them, the influence of the lower liquid circulation rate is dominant. The liquid circulation rate in the lower part accelerates the formation of the cathode microbial film and promotes the generation of methane, which consumes H+ and causes the pH of the cathode solution to rise continuously.
3.2 Analysis of Changes in Current Density of Experimental Device
The loop current density is obtained by converting the current of the current recorder and the cathode surface area.
In this experiment, the trend of current density of all experimental groups is that the current density is very large when the power is just turned on, ranging from 2.5 to 3.5 mA/m2, and then drops rapidly to the lowest value of 1.5 mA/m2. After a peak, the current density gradually stabilizes. The high current generated when the power is just turned on may be the result of the interaction between the fluctuation of the potentiostat when adjusting the voltage and the proton aggregation. The peak value and time of current density under different conditions are different, which indicates that the electronic consumption inside the reactor will also change when the gas recycling rate and liquid recycling rate are changed, resulting in the change of the output and type of output. Figs. 4 and 5 show the current density and current data in the reactor, respectively.
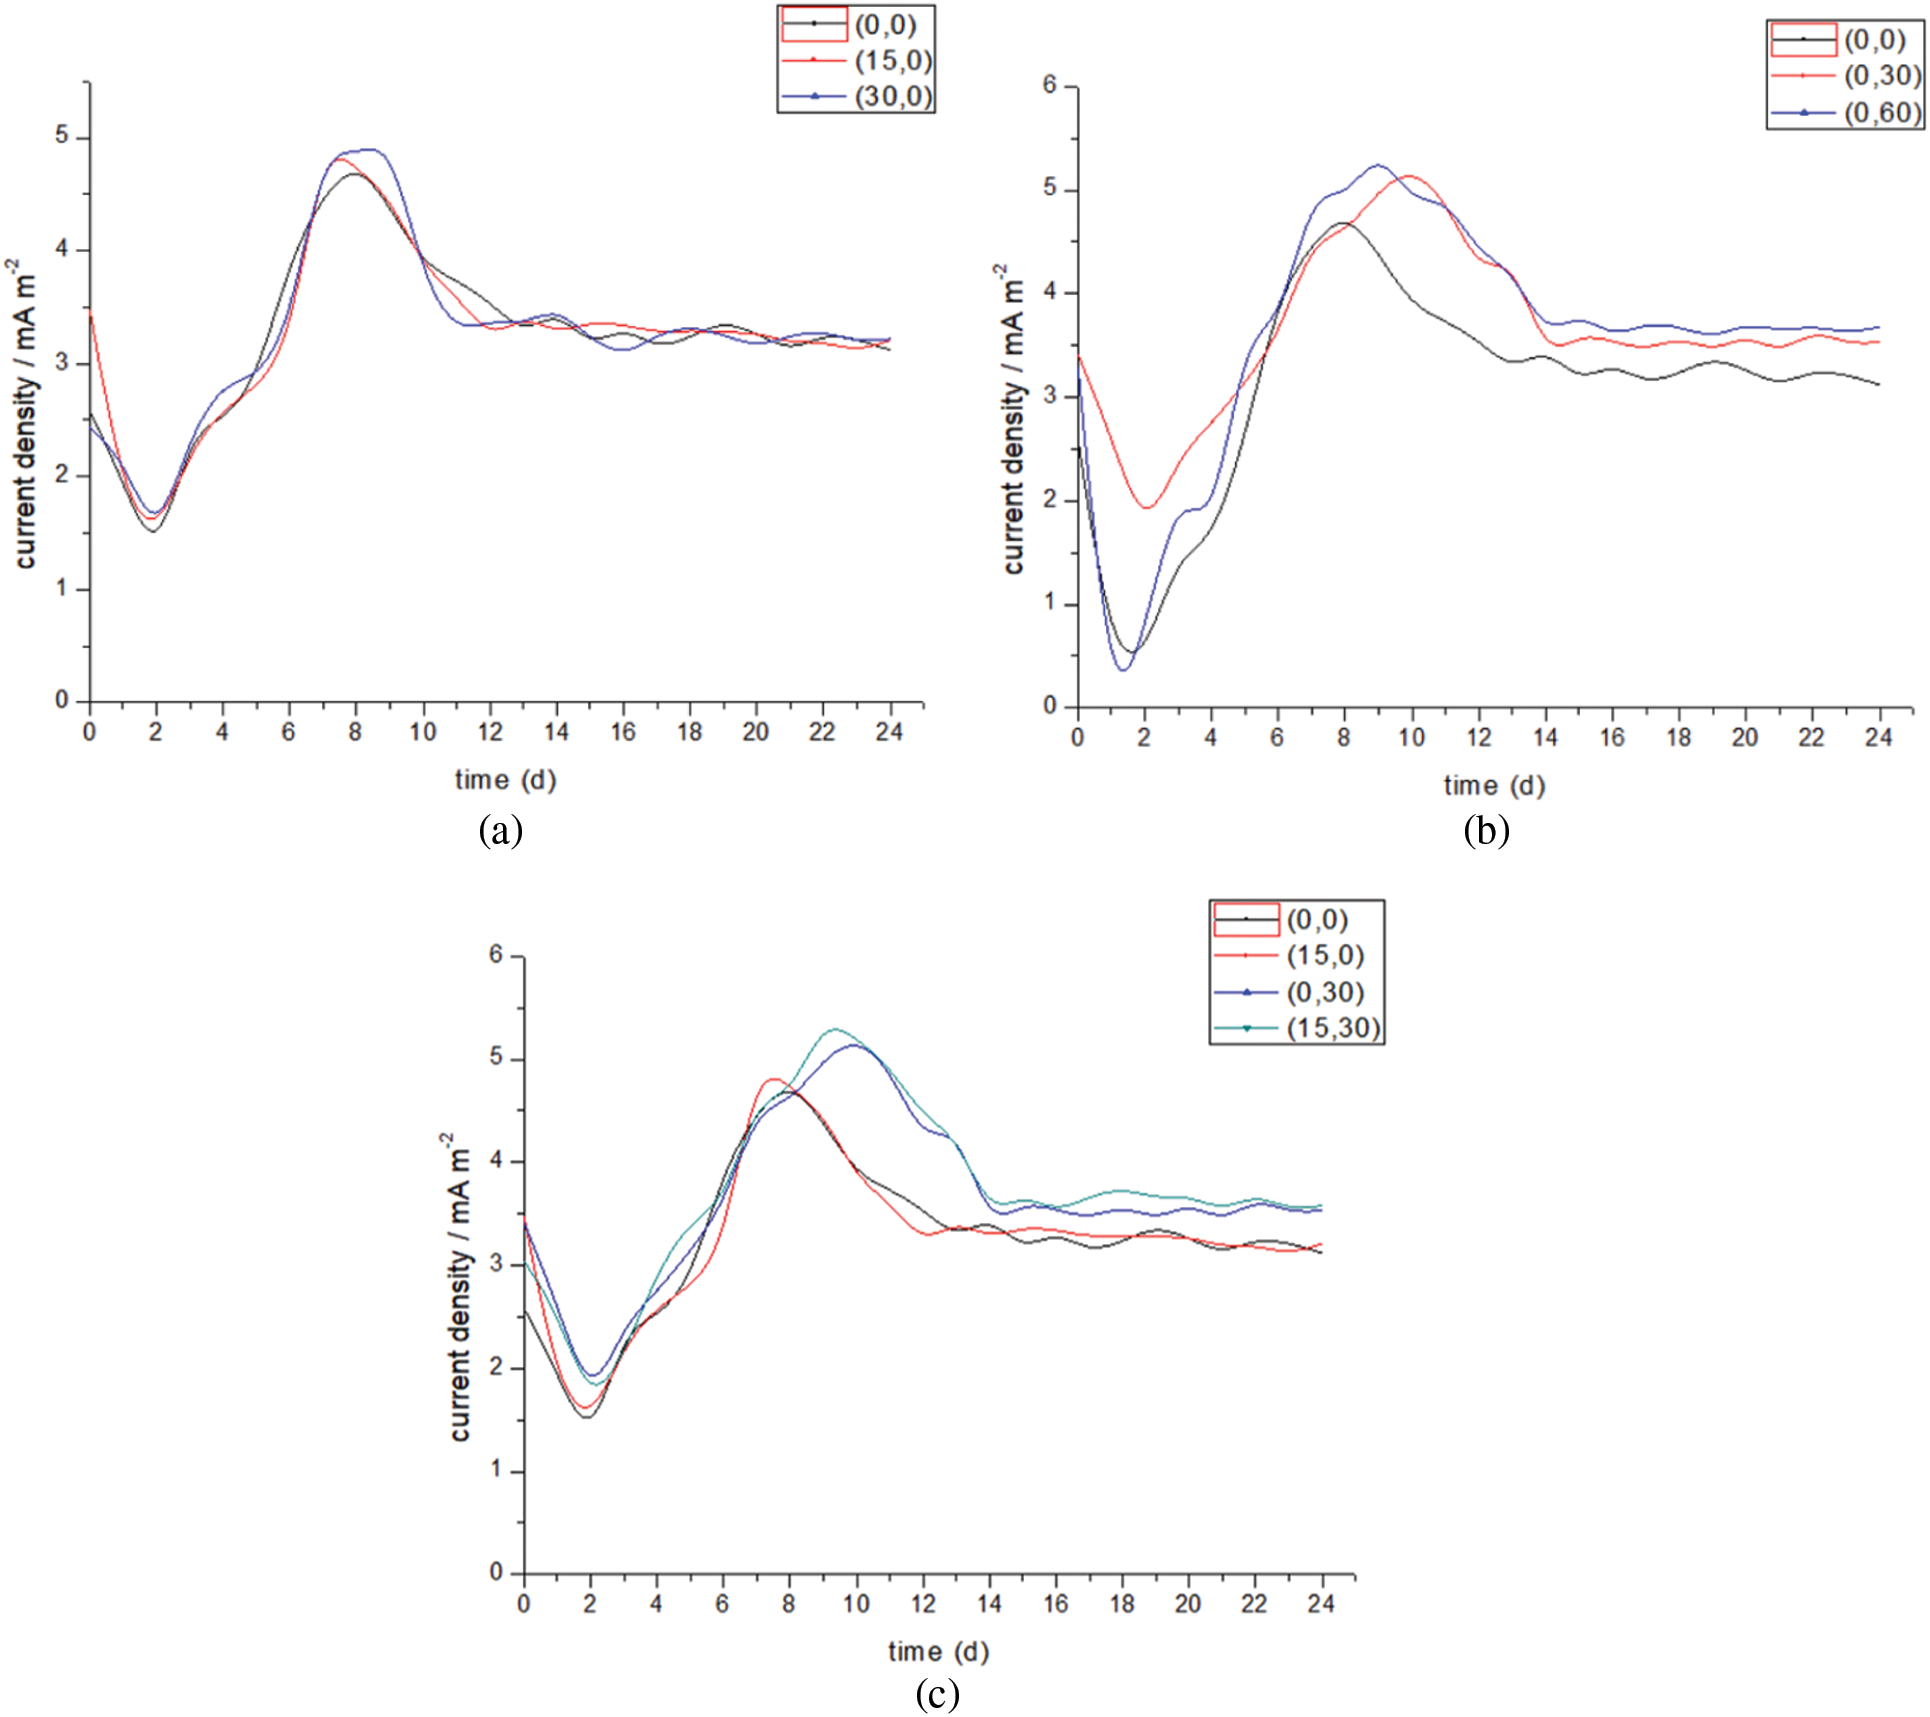
Figure 4: Current density variation under different conditions
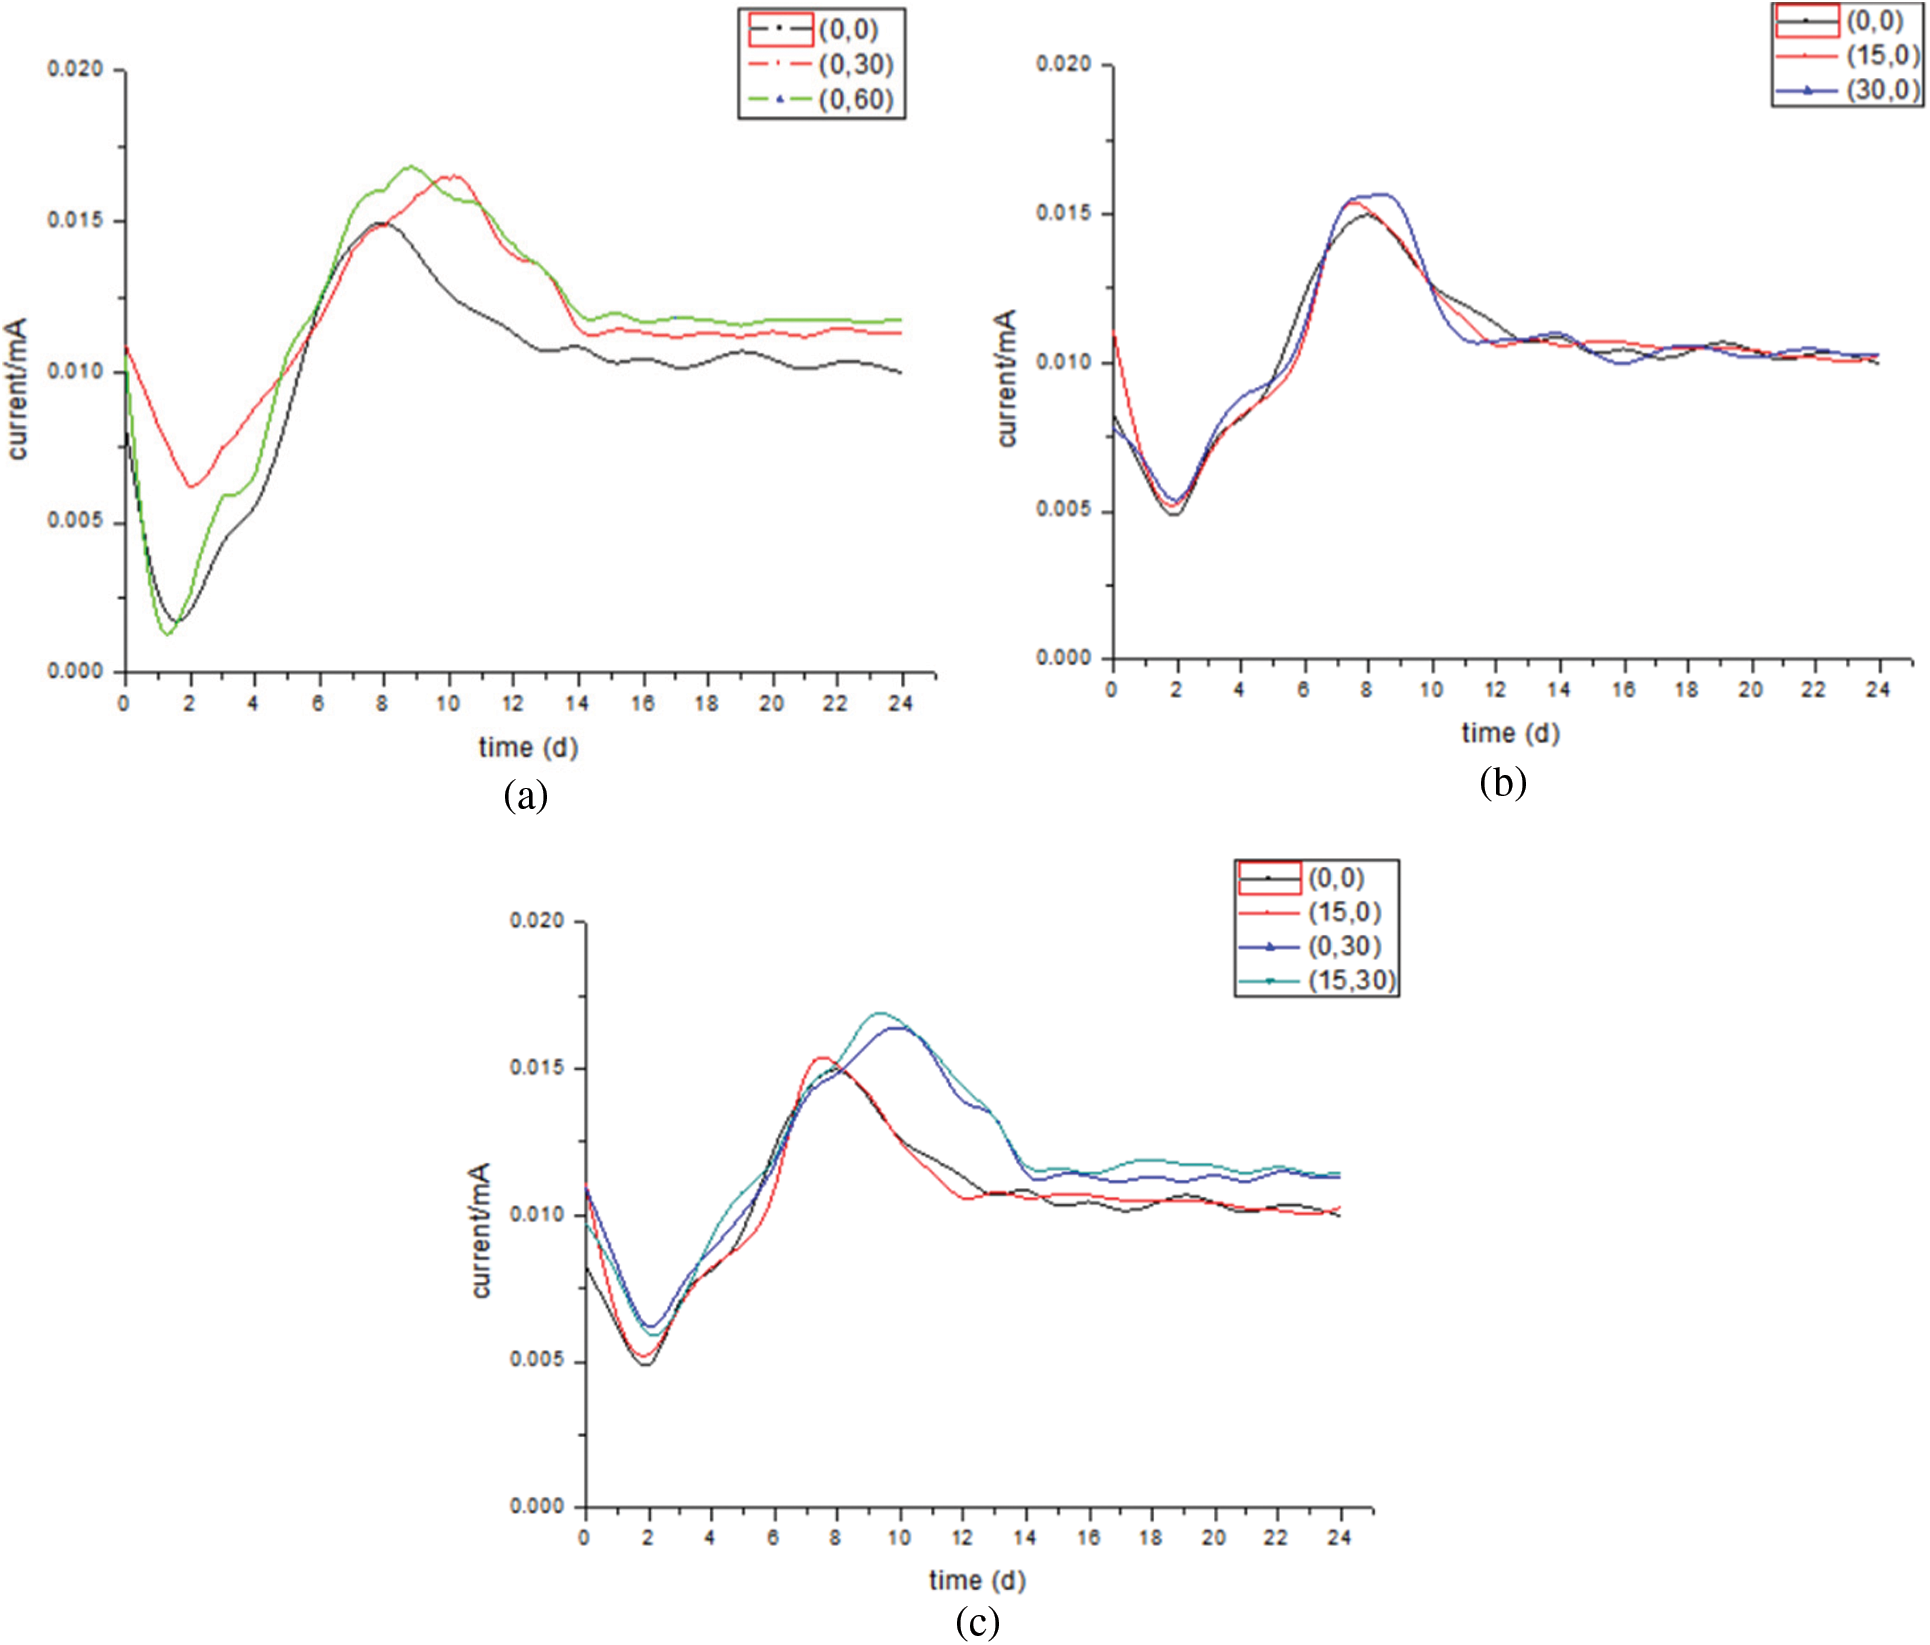
Figure 5: Current variation under different conditions
Fig. 4a shows the current density diagram of the experimental group after changing the gas recirculation rate. It can be seen from the figure that the overall trend of current density is the same, and the time points of reaching the peak value and the stable state are different, but the difference is not significant. The peak current density of group (0,0) is 4.65 mA/m2, which is the lowest, and the regression stability state after the peak value is relatively gentle, reaching stability after about the 13th day, and then the current keeps fluctuating at about 3.2 mA/m2; The peak current density of group (30,0) is 4.88 mA/m2, which is the highest, and it is about 3.3 mA/m2 after the 11th day, but the fluctuation is relatively large, which is about 3% higher than the former. The (15,0) group is in the middle position. This shows that changing the gas recirculation rate is helpful to improve the electron transfer, but the range of change is not obvious.
Fig. 4b shows the current density diagram of the experimental group after changing the liquid circulation rate. Different from changing the gas circulation rate, there is a big difference between the peak current density and the stable time point. The peak current density of group (0,30) is 5.1 mA/m2, and the regression stability state after the peak value is relatively gentle, reaching stability after about the 13th day, and then the current density keeps fluctuating at about 3.2 mA/m2; The peak current density of group (0,60) is 5.24 mA/m2, which is the highest, and it is about 3.6 mA/m2 after the first day, which is about 16% higher than that of group (0,0). This shows that changing the liquid circulation rate is helpful to improve the electron transfer. Compared with the gas circulation rate, the range of change is significant. The overall high level of current density indicates that there is a large amount of electron transfer in the reaction process. The amount of electron transfer can roughly indicate the active degree of the generated gas.
Fig. 4c shows the current density diagram of the experimental group after changing the two rates simultaneously. It shows again that the liquid circulation rate plays a dominant role in the two factors. The peak current density of (15,30) group was 5.4% higher than that of (0,30) group, and it was 0.2 mA/m2 higher on average after 14 days. Combined with the gas production, the coupling of the two factors has a more significant effect on the electron transfer efficiency than changing one alone. It can be considered that changing the gas recirculation rate makes some gases not involved in the reaction participate in the reaction, and increases the electron transfer.
The current density is an important indicator of the performance of the reaction experiment group. In the experimental data, changing the liquid circulation rate obviously has a greater impact on the current density. On the one hand, electron transfer is carried out in the liquid, and changing the liquid circulation rate is conducive to electron transfer; On the other hand, liquid circulation rate is also important for the change of biofilm, and both electron transfer modes are affected.
3.3 Change Analysis of Biological Cathode Products
Fig. 6 shows the total methane and hydrogen production of different experimental groups. Fig. 7 shows the influence of gas recirculation rate on gas production performance. When the gas recirculation rate increases from 0 to 30 ml/min, the methane production trend of the two is basically the same. The total methane production increases from 10.04 to 10.70 mmol, an increase of about 7%, and the total by-product hydrogen production decreases from 1.29 to 0.89 mmol, a decrease of 38.8%. The methanogenic rate in the (0,0) group was lower than that in the other two groups after the fourth day of the experimental start-up period, and reached a stable level on the 14th day, dropping steadily around 0.5 mmol/d, while the methanogenic rate in the (15,0) (30,0) two groups was stable about the 18th day. The data curves of (15,0) (30,0) two groups of experiments are particularly similar, which may be because changing the gas recirculation rate alone can only change the gas distribution in the upper part of the reactor. But at the same time, the hydrogen content of the two groups of experiments is lower than that of the (0,0) group, so it is speculated that the gas circulation will make some by-products of methane synthesis hydrogen react again. The synthesis of methane from H2 and CO2 in indirect extracellular electron transfer is enhanced.
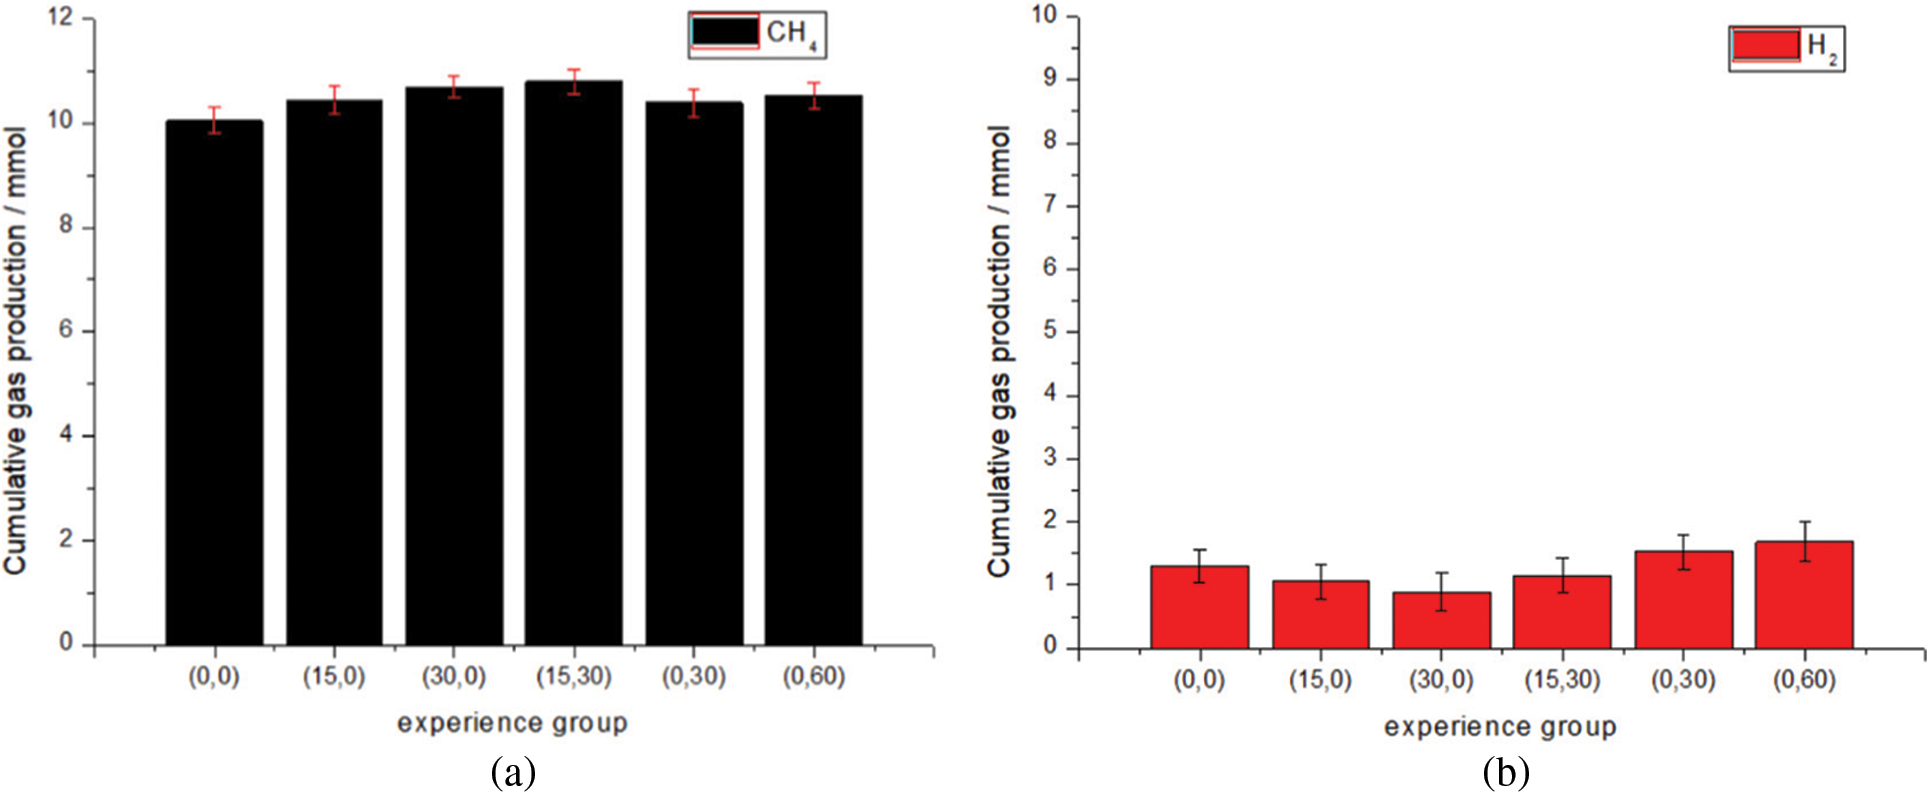
Figure 6: Total methane and hydrogen production in different experimental groups. (a) Methane production. (b) Hydrogen production
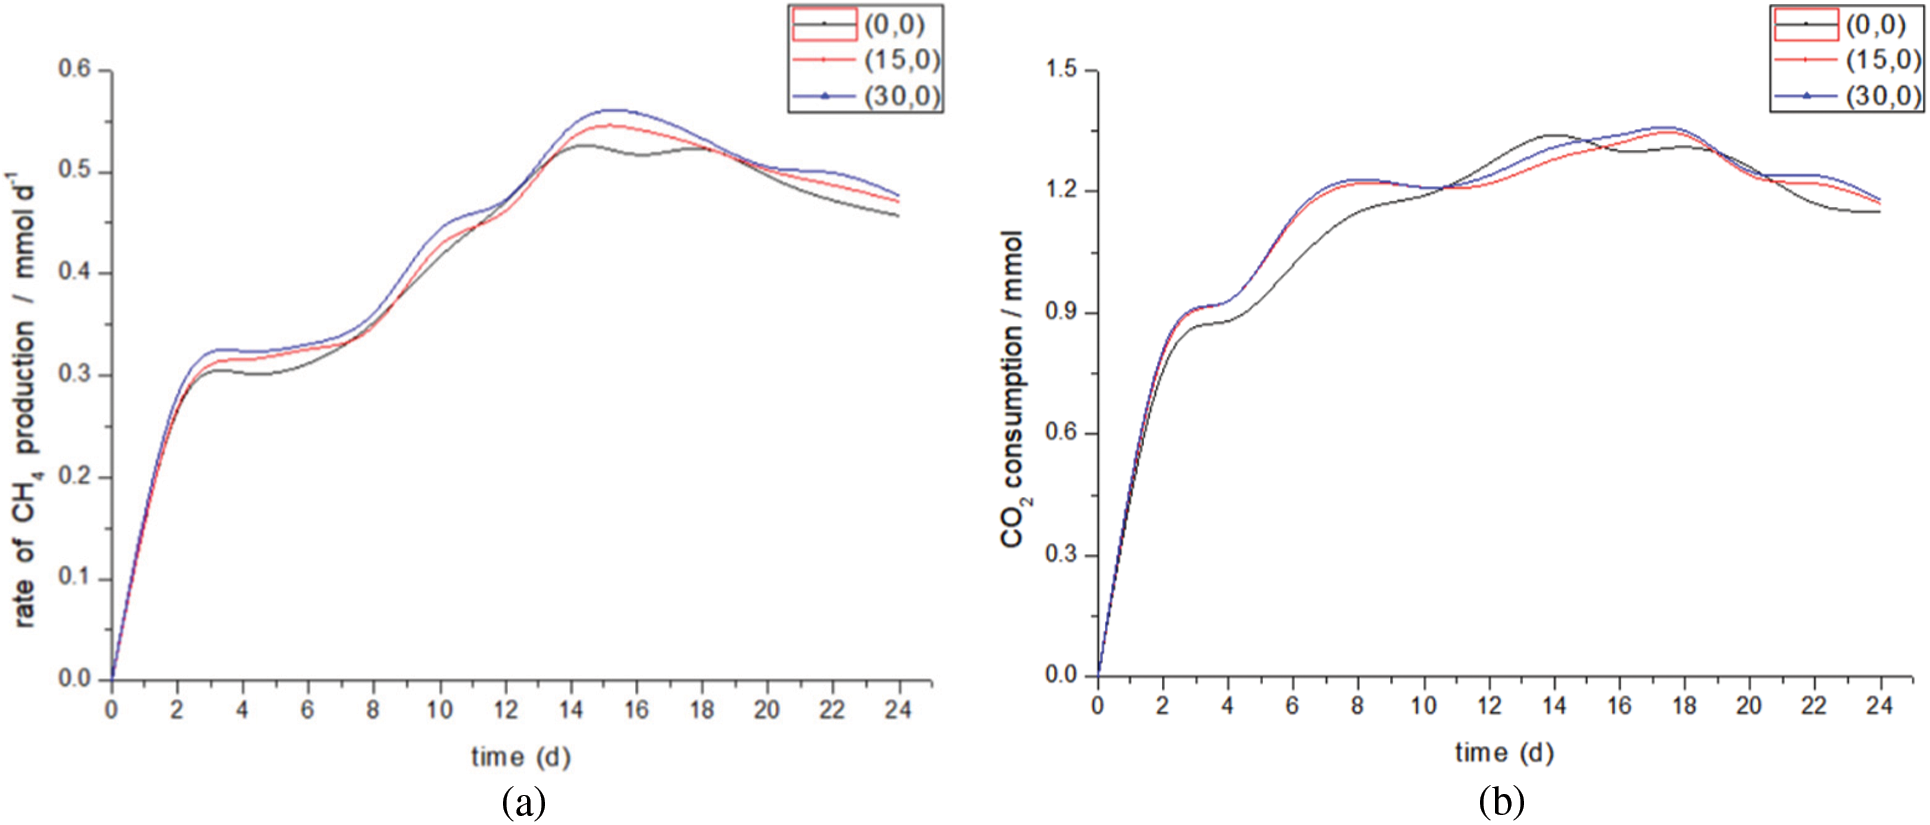
Figure 7: Methanation rate and CO2 consumption at different gas recirculation rates. (a) Methanation rate. (b) CO2 consumption
The consumption of CO2 in these three groups of experiments is not the same as that of methane production, which may be because CO2 is not only used to produce methane, but also consumed by microorganisms themselves [41] and other organic by-products [42].
To sum up, changing the gas recirculation rate will increase the dissolution of CO2, promote CO2 to participate in the reaction, and at the same time, make the by-product hydrogen react again to generate methane. Since the start-up and stabilization periods of the three groups of experiments are roughly the same, it can be considered that changing the gas recirculation rate has little impact on the biofilm itself, which is helpful to improve the upper limit of gas production and the reuse of by-product hydrogen.
Fig. 8 shows the effect of liquid circulation rate on gas production performance. When the liquid circulation rate increases from 0 to 60 ml/min, the total methane production increases from 10.04 to 10.526 mmol, an increase of about 5%, and the total by-product hydrogen production increases from 1.29 to 1.68 mmol, an increase of 30%. The peak value of methanogenic rate in group (0,0) was 0.5 mmol/d on the 14th day, and the peak value of CO2 consumption was basically consistent with the methanogenic curve. The peak methanogenesis of group (0,30) (0,60) was 2 to 3 days earlier than that of group (0,0), which was 0.553 and 0.561 mmol/d respectively, indicating that changing the liquid circulation rate shortened the start-up period and made the peak of methanogenesis come earlier than that of the control group. This may be because the change of flow field led to the shortening of diffusion examples used by microorganisms for metabolite transport [43]. After the peak, although the methane production remained at a high speed, it showed a downward trend and was exceeded by the control group on the 14th day. The methane production of (0,0) remained stable at 0.4~0.5mmol/d in several cycles from the 10th to the 24th day. It is worth paying attention to the changing trend of CO2 consumption. After the CO2 consumption of experimental group (0,30) (0,60) reaches the peak, the changing trend is similar to that of group (0,0). It can be seen that other reactions consuming CO2 still occur in the reactor. However, compared with (0,0), the methane production rate decreased significantly, with the lowest being 0.3 mmol/d, indicating that some factors had changed the biofilm. It is speculated that the reason for this situation is that the liquid circulation rate changes the flow field distribution, the flow field changes the properties of biofilm in the later stage, and the pH value becomes unsuitable for the survival of bacteria, which ultimately leads to the decline of methane production in the later stage of the experiment. At the same time, the direct and indirect extracellular electron transfer modes for methane production are weakened. In addition, the total hydrogen production of by-product also increases with the increase of the rate, which may lead to the increase of hydrogen amount due to the change of biofilm, and may also lead to the weakening of the reaction of hydrogen to methane due to the change of biofilm. Studies have shown that the shear force of the flow field may destroy the spatial structure of methanogens, transform the cathode products into other substances, and reduce the methanogenic performance [44].
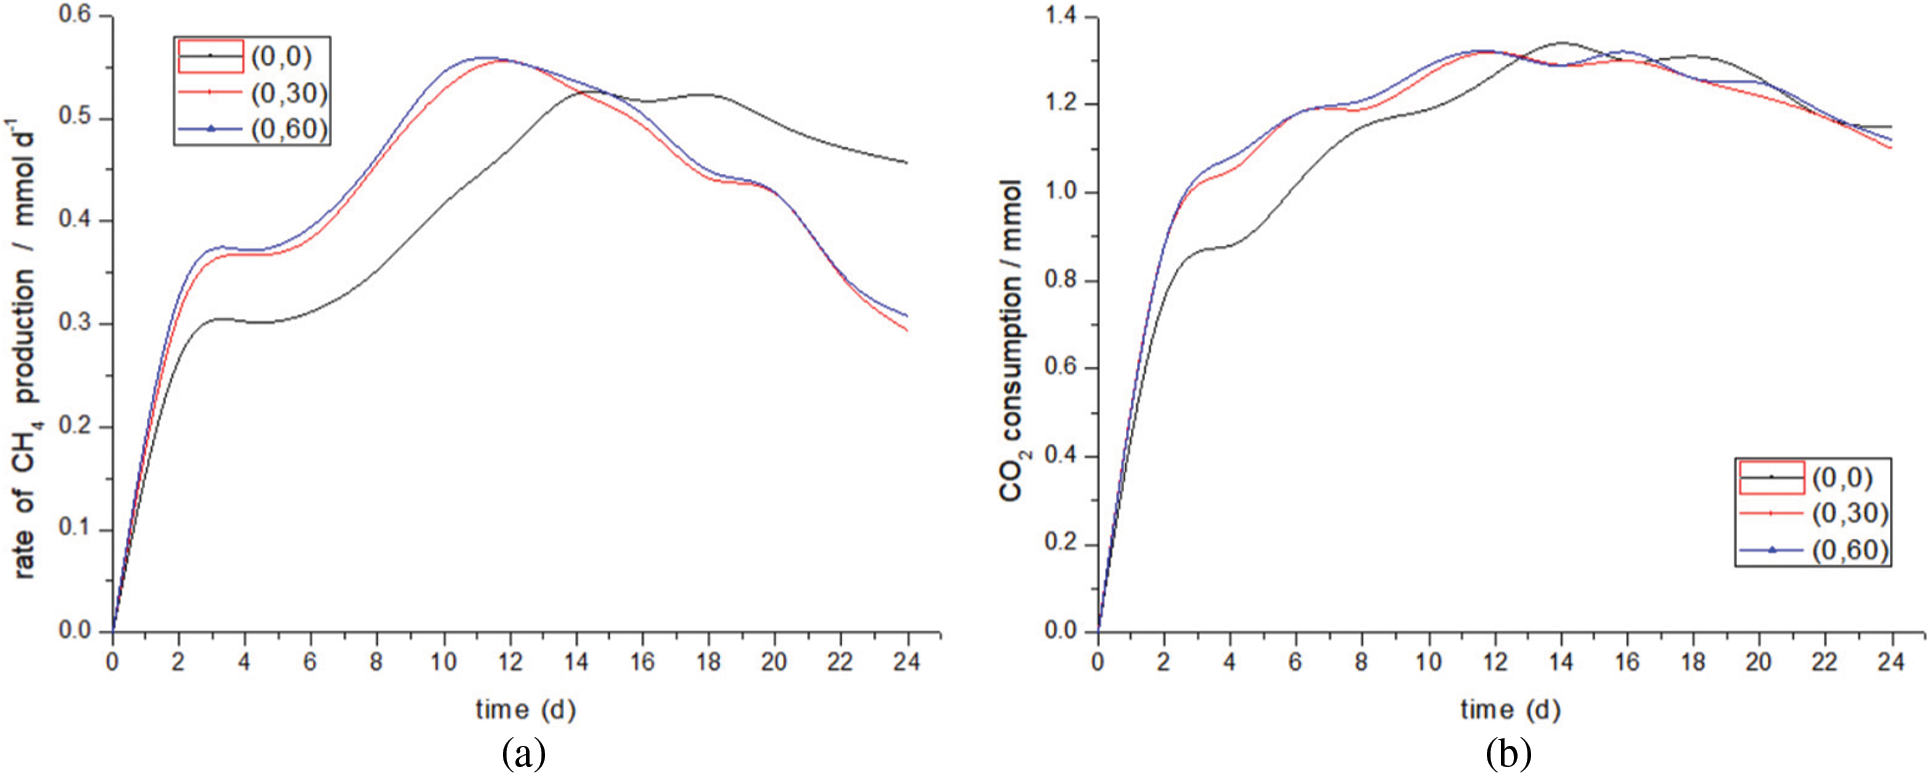
Figure 8: Methanation rate and CO2 consumption at different liquid circulation rates. (a) Methanation rate. (b) CO2 consumption
In conclusion, by changing the liquid circulation rate, the methanogenic efficiency and CO2 consumption during the start-up and early stabilization periods of the unit are improved. At the later stage of the experiment, the methane production decreased, and the CO2 consumption was larger than that of the control group, which indicated that CO2 consumption produced other organics. This may be because the change of the flow field will lead to the destruction of the methanogenic bacteria structure of the biofilm, thus producing other organics.
Fig. 9 compares the performance of methanogenic rate when changing two rates at the same time with changing only one. Compared with (0,0), the total output of methane in the (15,30) increased from 10.04 to 10.54 mmol, an increase of about 5%, and the total output of by-product hydrogen decreased from 1.29 to 1.15 mmol, a decrease of 10.8%. In the (15,30) experimental group, the upper gas recirculation rate and the lower liquid recirculation rate were changed simultaneously. The methanogenic rate data of (15,30) is similar to that of (0,30). Combined with the changes of pH value and current density, it fully shows that the lower liquid circulation rate is dominant when the two influencing factors are coupled. The data gap between the two may be caused by changing the gas recirculation rate. Compared with (0,30), the methanogenic rate of (15,30) is higher on the whole. The peak values of their methanogenic rates are 0.556 and 0.551 mmol/d, respectively, with little difference. However, the hydrogen output (15,30) is lower than that of the (0,30) group. It can be seen from the hydrogen output that the weakening of hydrogen methane synthesis reaction caused by the change of liquid flow field is alleviated. Changing the gas recirculation rate enhances the process of hydrogen to methane; Another possibility is that the coupling of the two makes the dissolution of CO2 and H2 more sufficient than changing a single rate. From the point of view of the increase of methanogenesis rate and the increase of CO2 consumption after the reactor reaches the peak value, the coupling of the two can improve the decrease of methanogenesis rate caused by the change of flow field, which is still caused by the improvement of gas distribution by increasing the dissolution of CO2 and H2.
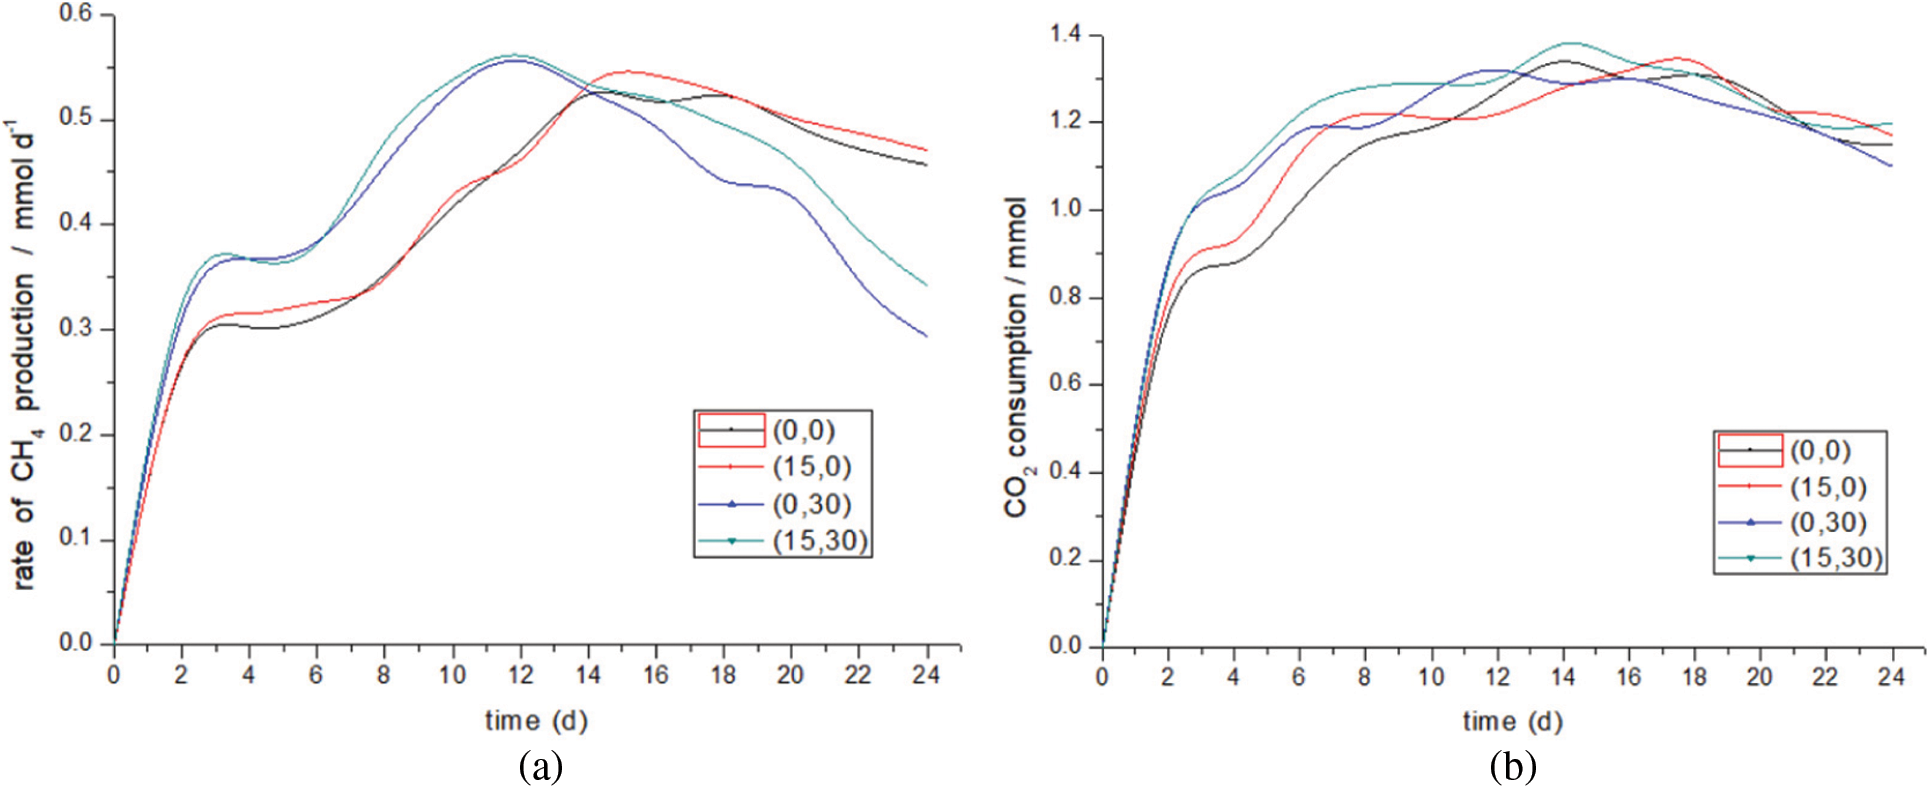
Figure 9: Methanation rate and CO2 consumption after changing the two rates simultaneously. (a) Methanation rate. (b) CO2 consumption
Wahid et al. [29] recycled the generated gas at a rate of 12.2 ml/min by means of gas recycling, and the methanogenic rate increased by 11%. The author also pointed out that more efficient utilization of H2 is needed to improve H2 gas-liquid mass transfer so that H2 can be more fully involved in CH4 synthesis. This is also consistent with the previous analysis. The key to changing the gas recirculation rate is to strengthen gas-liquid mass transfer. Liquid circulation [45] is applied to the cathode solution to enhance the ability of biological cathode to reduce CO2, so that acetic acid is produced in the operation stage, and the methane production is reduced. This is in line with the conclusion of this experiment. Changing the liquid circulation rate will increase CO2 consumption and reduce methane production in the later period.
To sum up, the trend of gas production of the coupling of the two is similar to that of only changing the lower liquid circulation rate, but changing the upper gas circulation rate can alleviate the decline of methane production rate caused by the change of biofilm properties.
In this study, a double chamber MEC reactor was constructed. By changing the gas recirculation rate in the upper part and the liquid recirculation rate in the lower part of the reactor, the different gas production efficiency under these two factors was explored. Compared with other literature, which only focuses on a single factor such as liquid circulation rate, this paper also studies the influence of the coupling of these two factors. For the methanogenic performance of microbial electrolytic cell system with CO2 as the carbon source, the research conclusions are as follows:
(1) In the start-up stage of the reactor, the flow state of the material inside the reactor will affect the speed of biofilm formation. The change in the liquid flow state has a more obvious effect on biofilm than the change in the gas flow state. Among the two variable factors, the change of lower liquid circulation rate plays a dominant role in the reactor.
(2) Changing the gas recirculation rate in the upper part of the reactor can improve the gas distribution, promote the CO2 dissolution and the gas in the dead corner of the reaction to participate in the reaction, strengthen the contact between CO2 and other gases and the biofilm, and indirectly promote the methane generation. In this experiment, the by-product hydrogen production gradually decreases with the increase of the gas recycling rate, which can prove that the by-product hydrogen again participates in the formation of methane in the experiment, thus increasing methane production.
(3) The lower liquid circulation rate has a great influence on the methanogenic performance of the reactor. Changing the liquid circulation rate at the lower part of the reactor can promote the formation of biofilm at the start-up stage of the reactor, and at the same time, strengthen the contact between gas and biofilm and the electron transfer efficiency in the liquid, which is conducive to the generation of methane and the increase of CO2 consumption. However, in the later stage of the reaction, the properties of the biofilm will be changed, the methane production rate will be reduced, and the total by-product hydrogen production will also be increased. However, the change in biofilm properties has little impact on CO2 consumption, but there is a risk that CO2 will generate other organics.
(4) When the two rates are changed at the same time, the reduction of methane production caused by the change in biofilm properties can be improved. The reason for this improvement is the revival of the hydrogen synthesis methane path and the strengthening of the contact between gas and biofilm. This can provide a theoretical reference for the coupling of the two in the actual gas production process.
Funding Statement: This paper is supported by Shanghai Science and Technology Development Fund, China, No. 19DZ1205604.
Conflicts of Interest: The authors declare that they have no conflicts of interest to report regarding the present study.
References
1. Shi, X., Zheng, Y., Lei, Y., Xue, W., Yan, G. et al. (2021). Air quality benefits of achieving carbon neutrality in China. Science of the Total Environment, 795(1), 148–784. https://doi.org/10.1016/j.scitotenv.2021.148784 [Google Scholar] [PubMed] [CrossRef]
2. Cai, Y., Sam, C., Chang, T. (2018). Nexus between clean energy consumption, economic growth and CO2 emissions. Journal of Cleaner Production, 182(5), 1001–1011. https://doi.org/10.1016/j.jclepro.2018.02.035 [Google Scholar] [CrossRef]
3. Sinsel, S., Riemke, R., Hoffmann, V. (2020). Challenges and solution technologies for the integration of variable renewable energy sources—A review. Renewable Energy, 145, 2271–2285. https://doi.org/10.1016/j.renene.2019.06.147 [Google Scholar] [CrossRef]
4. Chen, X., Lin, B. (2021). Towards carbon neutrality by implementing carbon emissions trading scheme: Policy evaluation in China. Energy Policy, 157, 112–510. https://doi.org/10.1016/j.enpol.2021.112510 [Google Scholar] [CrossRef]
5. Xue, Q., Feng, S., Chen, K., Li, M. (2022). Impact of digital finance on regional carbon emissions: An empirical study of sustainable development in China. Sustainability, 14(14), 40–83. https://doi.org/10.3390/su14148340 [Google Scholar] [CrossRef]
6. Qi, Y., Stern, N., He, J., Lu, J., Liu, T. et al. (2020). The policy-driven peak and reduction of China’s carbon emissions. Advances in Climate Change Research, 11, 65–71. [Google Scholar]
7. Lin, B., Zhu, J. (2019). Determinants of renewable energy technological innovation in China under CO2 emissions constraint. Journal of Environmental Management, 247, 662–671. [Google Scholar] [PubMed]
8. An, T., Xu, C., Liao, X. (2021). The impact of FDI on environmental pollution in China: Evidence from spatial panel data. Environmental Science and Pollution Research, 28, 44085–44097. [Google Scholar] [PubMed]
9. Villano, M., Aulenta, F., Ciucci, C., Ferri, T., Giuliano, A. et al. (2010). Bioelectrochemical reduction of CO2 to CH4 via direct and indirect extracellular electron transfer by a hydrogenophilic methanogenic culture. Bioresource Technology, 101(9), 3085–3090. [Google Scholar] [PubMed]
10. Jiang, Y., Su, M., Zhang, Y., Zhan, G., Tao, Y. et al. (2013). Bioelectrochemical systems for simultaneously production of methane and acetate from carbon dioxide at relatively high rate. International Journal of Hydrogen Energy, 38, 3497–3502. [Google Scholar]
11. Zhen, G., Lu, X., Kumar, G., Bakonyi, P., Xu, K. et al. (2017). Microbial electrolysis cell platform for simultaneous waste biorefinery and clean electrofuels generation: Current situation, challenges and future perspectives. Progress in Energy and Combustion Science, 63(2), 119–145. https://doi.org/10.1016/j.pecs.2017.07.003 [Google Scholar] [CrossRef]
12. Batlle-Vilanova, P., Puig, S., Gonzalez-Olmos, R., Vilajeliu-Pons, A., Balaguer, M. et al. (2015). Deciphering the electron transfer mechanisms for biogas upgrading to biomethane within a mixed culture biocathode. RSC Advances, 5(64), 52243–52251. https://doi.org/10.1039/C5RA09039C [Google Scholar] [CrossRef]
13. Zhen, G., Kobayashi, T., Lu, X., Xu, K. (2015). Understanding methane bioelectrosynthesis from carbon dioxide in a two-chamber microbial electrolysis cells (MECs) containing a carbon biocathode. Bioresource Technology, 186(1), 141–148. https://doi.org/10.1016/j.biortech.2015.03.064 [Google Scholar] [PubMed] [CrossRef]
14. Yang, E., Mohamed, H. O., Park, S. G., Obaid, M., Al-Qaradawi, S. Y. et al. (2021). A review on self-sustainable microbial electrolysis cells for electro-biohydrogen production via coupling with carbon-neutral renewable energy technologies. Bioresource Technology, 320(5), 124–363. https://doi.org/10.1016/j.biortech.2020.124363 [Google Scholar] [PubMed] [CrossRef]
15. Clauwaert, P., Verstraete, W. (2009). Methanogenesis in membraneless microbial electrolysis cells. Applied Microbiology and Biotechnology, 82(5), 829–836. https://doi.org/10.1007/s00253-008-1796-4 [Google Scholar] [PubMed] [CrossRef]
16. Sternberg, A., Bardow, A. (2015). Power-to-What?–Environmental assessment of energy storage systems. Energy & Environmental Science, 8(2), 389–400. https://doi.org/10.1039/C4EE03051F [Google Scholar] [CrossRef]
17. Villano, M., Aulenta, F., Ciucci, C. (2010). Bioelectrochemical reduction of CO, to CH, via direct and indirect extracellular electron transfer by a hydrogenophilic methanogenic culture. Bioresource Technology, 101, 3085–3090. [Google Scholar] [PubMed]
18. Lecker, B., Illi, L., Lemmer, A., Oechsner, H. (2017). Biological hydrogen methanation—A review. Bioresource Technology, 245(A), 1220–1228. https://doi.org/10.1016/j.biortech.2017.08.176 [Google Scholar] [PubMed] [CrossRef]
19. Gao, L., Liu, W., Cui, M., Zhu, Y., Wang, L. et al. (2021). Enhanced methane production in an up-flow microbial electrolysis assisted reactors: Hydrodynamics characteristics and electron balance under different spatial distributions of bioelectrodes. Water Research, 191(4), 116–813. https://doi.org/10.1016/j.watres.2021.116813 [Google Scholar] [PubMed] [CrossRef]
20. Siegert, M., Yates, M., Call, D., Zhu, X., Spormann, A. et al. (2014). Comparison of nonprecious metal cathode materials for methane production by electromethanogenesis. ACS Sustainable Chemistry & Engineering, 2(4), 910–917. https://doi.org/10.1021/sc400520x [Google Scholar] [PubMed] [CrossRef]
21. Wang, H., Cui, D., Yang, L., Ding, Y., Cheng, H. et al. (2017). Increasing the bio-electrochemical system performance in azo dye wastewater treatment: Reduced electrode spacing for improved hydrodynamics. Bioresource Technology, 245, 962–969. https://doi.org/10.1016/j.biortech.2017.09.036 [Google Scholar] [PubMed] [CrossRef]
22. Fang, Z., Tang, Y. J., Koffas, M. (2022). Harnessing electrical-to-biochemical conversion for microbial synthesis. Current Opinion in Biotechnology, 75, 102687. https://doi.org/10.1016/j.copbio.2022.102687 [Google Scholar] [PubMed] [CrossRef]
23. Fang, Z., Zhou, J., Zhou, X., Koffas, M. (2021). Abiotic-biotic hybrid for CO2 biomethanation: From electrochemical to photochemical process. Science of the Total Environment, 791, 148288. https://doi.org/10.1016/j.scitotenv.2021.148288 [Google Scholar] [PubMed] [CrossRef]
24. Bassani, I., Kougias, P., Treu, L., Porté, H., Campanaro, S. et al. (2017). Optimization of hydrogen dispersion in thermophilic up-flow reactors for ex situ biogas upgrading. Bioresource Technology, 234, 310–319. https://doi.org/10.1016/j.biortech.2017.03.055 [Google Scholar] [PubMed] [CrossRef]
25. Silva, T., Isha, A., Chandra, R., Vijay, V., Subbarao, P. et al. (2021). Enhancing methane production in anaerobic digestion through hydrogen assisted pathways—A state-of-the-art review. Renewable and Sustainable Energy Reviews, 151, 111–536. https://doi.org/10.1016/j.rser.2021.111536 [Google Scholar] [CrossRef]
26. Shen, R., Jing, Y., Feng, J., Zhao, L., Yao, Z. et al. (2021). Simultaneous carbon dioxide reduction and enhancement of methane production in biogas via anaerobic digestion of cornstalk in continuous stirred-tank reactors: The influences of biochar, environmental parameters, and microorganisms. Bioresource Technology, 319, 124–146. https://doi.org/10.1016/j.biortech.2020.124146 [Google Scholar] [PubMed] [CrossRef]
27. Khan, M., Lee, J., Bashir, M., Dissanayake, P., Ok, Y. et al. (2021). Current status of biogas upgrading for direct biomethane use: A review. Renewable and Sustainable Energy Reviews, 149(3), 111–343. https://doi.org/10.1016/j.rser.2021.111343 [Google Scholar] [CrossRef]
28. Zhao, J., Li, Y., Dong, R. (2021). Recent progress towards in-situ biogas upgrading technologies. Science of the Total Environment, 800(4), 149–667. https://doi.org/10.1016/j.scitotenv.2021.149667 [Google Scholar] [PubMed] [CrossRef]
29. Wahid, R., Horn, S. (2021). The effect of mixing rate and gas recirculation on biological CO2 methanation in two-stage CSTR systems. Biomass and Bioenergy, 144(8), 105–918. https://doi.org/10.1016/j.biombioe.2020.105918 [Google Scholar] [CrossRef]
30. Yuan, T., Zhang, Z., Lei, Z., Shimizu, K., Lee, D. (2022). A review on biogas upgrading in anaerobic digestion systems treating organic solids and wastewaters via biogas recirculation. Bioresource Technology, 344, 126–412. https://doi.org/10.1016/j.biortech.2021.126412 [Google Scholar] [PubMed] [CrossRef]
31. Kougias, P., Treu, L., Benavente, D., Boe, K., Campanaro, S. et al. (2017). Ex-situ biogas upgrading and enhancement in different reactor systems. Bioresource Technology, 225, 429–437. https://doi.org/10.1016/j.biortech.2016.11.124 [Google Scholar] [PubMed] [CrossRef]
32. Zhao, J., Hou, T., Lei, Z., Shimizu, K., Zhang, Z. (2020). Effect of biogas recirculation strategy on biogas upgrading and process stability of anaerobic digestion of sewage sludge under slightly alkaline condition. Bioresource Technology, 308(10), 123–293. https://doi.org/10.1016/j.biortech.2020.123293 [Google Scholar] [PubMed] [CrossRef]
33. Karim, K., Hoffmann, R., Klasson, K., Al-Dahhan, M. (2005). Anaerobic digestion of animal waste: Effect of mode of mixing. Water Research, 39(15), 3597–3606. https://doi.org/10.1016/j.watres.2005.06.019 [Google Scholar] [PubMed] [CrossRef]
34. Zhao, J., Hou, T., Wang, Q., Zhang, Z., Lei, Z. et al. (2021). Application of biogas recirculation in anaerobic granular sludge system for multifunctional sewage sludge management with high efficacy energy recovery. Applied Energy, 298, 117–212. https://doi.org/10.1016/j.apenergy.2021.117212 [Google Scholar] [CrossRef]
35. Siegert, M., Yates, M. D., Call, D. F., Zhu, X., Spormann, A. et al. (2014). Comparison of nonprecious metal cathode materials for methane production by electromethanogenesis. ACS Sustainable Chemistry & Engineering, 2(4), 910–917. https://doi.org/10.1021/sc400520x [Google Scholar] [PubMed] [CrossRef]
36. Chou, H., Huang, J., Jheng, J., Ohara, R. (2008). Influencing effect of intra-granule mass transfer in expanded granular sludge-bed reactors treating an inhibitory substrate. Bioresource Technology, 99, 3403–3410. [Google Scholar] [PubMed]
37. Huang, R. Y., Jiang, H. X., Wu, J., Hu, Y., He, Q. Y. et al. (2020). Study on hydraulic agitation to accelerate the start-up of biogas project I: Experimental part. China Biogas, 38(4), 45–50. [Google Scholar]
38. Gao, L., Thangavel, S., Guo, Z., Cui, M., Wang, L. et al. (2020). Hydrodynamics analysis for an upflow integrated anaerobic digestion reactor with microbial electrolysis under different hydraulic retention times: Effect of bioelectrode spatial distribution on functional communities involved in methane production and organic removal. ACS Sustainable Chemistry & Engineering, 8(1), 190–199. [Google Scholar]
39. Cheng, S., Xing, D., Call, D. F. (2009). Direct biological conversion of electrical current into methane by electromethanogenesis. Environmental Science & Technology, 43(10), 3953–3958. [Google Scholar]
40. Ding, G., Li, Q., Zhang, L., Hou, Y., Yan, X. (2023). Study on biological pathway of carbon dioxide methanation based on microbial electrolysis cell. Journal of Renewable Materials, 11(1), 197–207. [Google Scholar]
41. Burkhardt, M., Busch, G. (2013). Methanation of hydrogen and carbon dioxide. Applied Energy, 111, 74–79. [Google Scholar]
42. Zheng, S. J., Lu, X. Q., Zhang, Z. Y., Zhen, G. Y., Zhao, Y. C. (2019). Microbial electrolysis cell (MECA new platform for CO2 bioelectromethanogenesis assisted by bioelectrocatalysis. Environmental Chemistry, 38(7), 1666–1674. [Google Scholar]
43. Kundu, K., Bergmann, I., Klocke, M., Sharma, S., Sreekrishnan, T. (2014). Influence of hydrodynamic shear on performance and microbial community structure of a hybrid anaerobic reactor. Journal of Chemical Technology & Biotechnology, 89(3), 462–470. https://doi.org/10.1002/jctb.4194 [Google Scholar] [CrossRef]
44. Eerten-Jansen, M., Jansen, N., Plugge, C., Wilde, V., Buisman, C. (2015). Analysis of the mechanisms of bioelectrochemical methane production by mixed cultures. Journal of Chemical Technology & Biotechnology, 90(5), 963–970. https://doi.org/10.1002/jctb.4413 [Google Scholar] [CrossRef]
45. Xu, P., Jia, X., Wang, Y., Qi, X. J., Zhao, Y. J. et al. (2022). Effect of flow field on CO2 reduction performance and products of MEC biological cathode. Chemical Industry and Engineering Progress, 41(7), 3816–3823. [Google Scholar]
Cite This Article
 Copyright © 2023 The Author(s). Published by Tech Science Press.
This work is licensed under a Creative Commons Attribution 4.0 International License , which permits unrestricted use, distribution, and reproduction in any medium, provided the original work is properly cited.
 Downloads
 Citation Tools