
 Submit a Paper
 Propose a Special lssue
 Open Access
ARTICLE

The Characteristics of Glued Tensile Shear Strength Constituted of Wood Cut by CO2 Laser
1
Department of Wood Processing, Faculty of Forestry and Wood Sciences, Czech University of Life Sciences Prague, Prague, 16521,
Czech Republic
2
Department of Wood Science and Engineering, Oregon State University, Corvallis, OR, USA
3
Department of Furniture, Design and Habitat Brno, Mendel University in Brno, Brno, 61300, Czech Republic
4
Experimental Centre, Faculty of Civil Engineering, Czech Technical University in Prague, Prague, 16629, Czech Republic
5
Institute of Wood Technology and Technical Sciences, University of Sopron, Sopron, 9400, Hungary
6
Department of Furniture Design, Faculty of Forestry and Wood Technology, Poznan University of Life Sciences, Poznan, 60637,
Poland
7
ETH Zurich, Institute for Building Materials, Lulea University of Technology, Zurich, CH, 8093, Switzerland
8
School of Civil Engineering, Nanjing Forestry University, Nanjing, China
9
Joint International Research Laboratory of Bio-Composite Building Materials and Structures, Nanjing Forestry University, Nanjing,
China
10 Wood Properties and Processing, Institute of Wood Science and Technology, Bangalore, 560003, India
11 School of Agricultural Forestry, Food, and Environmental Science, University of Basilicata, Potenza, 85100, Italy
* Corresponding Authors: Fatemeh Rezaei. Email: ; Milan Gaff. Email:
Journal of Renewable Materials 2023, 11(8), 3277-3296. https://doi.org/10.32604/jrm.2023.028352
Received 14 December 2022; Accepted 01 March 2023; Issue published 26 June 2023
 View Full Text
 Download PDF
Abstract
The performance of engineered wood products is highly associated with proper bonding and an efficient cutting method. This paper investigates the influence of CO2 laser cutting on the wetting properties, the modified chemical component of the laser-cut surface, and the strength and adhesive penetration near the bondline. Beechwood is cut by the laser with varying processing parameters, cutting speeds, gas pressures, and focal point positions. The laser-cut samples were divided into two groups, sanded and non-sanded samples. Polyvinyl acetate adhesive (PVAc) was used to bond the groups of laser-cut samples. After assembly with cold pressing, the tensile shear test was carried out. Numerical modelling was carried out to determine the partial elongation and shear strain of the glue line. Based on this, the shear modulus and linear elasticity of the glue line were estimated. Scanning electron microscopy was used to assess the adhesive penetration into the porosity structure of the laser-cut samples, and the depth of the heat-affected zone. The laser-cut surface was analysed by Fourier transform infrared spectroscopy. The wetting properties of the laser-cut surface were investigated by using a contact angle goniometer. The numerical model of the strain-stress curve confirmed the experimental model. The highest modulus of the linear elasticity of the glue in the numerical calculation belongs to the joint containing laser-cut samples at a gas pressure of 21 (bar). The penetration depth of PVAc adhesive into the porosity structure of the laser-cut samples was similar to that of sawn samples. The deepest heat-affected zone in the laser-cut samples was 150 µm. A PVAc drop disappeared immediately on the laser-cut surface without sanding, but gradually on the sanded surface. In contrast, the drop on the sawn surface remained with an angle of 32°–48°. The degradation of hemicellulose and lignin was proven by the lower intensity of the C=O and C-O Bonds, compared to the sawn surface.Keywords
Laser technology dates to the early nineteenth century for cutting die in packing industries. Today, laser-cut wood is used in car interiors and inlays for the furniture industries [1–3]. One of the main advantages of using a laser is that a lower kerf width (0.1–0.3 mm) is obtained, compared to a kerf width (3–6 mm) obtained from conventional cutting (such as saw cutting, milling and planning) [4]. Developing more complex models of cutting for decorative applications in the furniture and flooring industries is another advantage of laser cutting [5]. A CO2 laser, a gas laser, is more powerful with a very long wavelength of around 10.6 micrometres, compared to others (solid-state, liquid, and semiconductor). The powerful laser beam originates from a mixture of gases (carbon dioxide, nitrogen, hydrogen, and helium) that are excited by an electric current. The excited state of atoms releases energy in the form of photons [6]. Wood is chemically disintegrated by the thermal energy of the laser. Physical changes follow the chemical changes in thermally affected regions [7,8]. The surface quality of laser-cut wood in terms of physical properties is important for further applications of coating and glueing. The quality of laser-cut samples depends on the processing parameters of the laser such as cutting speed, focal point position, assist gas pressure, etc. Wood properties such as density, moisture content, anatomical structure, etc., are other factors that affect the cut quality [9,10].
In terms of the processing parameters of CO2 lasers, Barnekov et al. [11] reported that when the focal point is maintained slightly above the surface of a wooden workpiece, the energy density decreases, leading to a wider kerf width and the formation of a charred layer. In contrast, focusing the focal point on the surface caused the surface energy density to reach its highest level. The authors also mentioned that when the focal point was placed at or slightly above the centre of the workpiece, more homogenous and narrower kerf widths were achieved. A smoother surface with less charring was also observed. Other studies [1,12] reported a reduction in the charred layer with the increase in the gas pressure; however, the kerf width and cutting speed were not influenced by the higher gas pressure. Barnekov et al. [11] and Lum et al. [13] reported that increased cutting speed reduced the laser exposure time on wood and decreased wood char formation. From the perspective of wood characteristics, the higher the moisture content of wood, the higher the thermal conductivity, resulting in a reduction in energy being concentrated in the affected region [14]. In addition, the water content in wood requires some energy to be boiled and vaporized, therefore the overall energy of the CO2 laser touching the wood decreases [15]. An increase in the density of ligno-cellulose materials requires a longer exposure time for the melting process (cutting) [9].
There is a continuous challenge in making bonded wood products due to the variability of wood sources, the desire for more remarkable performance, and the tendency for lower costs [16]. The wood bond formation is a molecular interaction between wood and an adhesive (adhesion), and between the adhesive molecules (cohesive). Interaction between the adhesive and wood increases by the penetrating resin into the porous structure of wood (cell lumen) and even at a lower scale, into cell walls [17]. To obtain a strong and durable bond, the resin must wet the wood surface properly and cure efficiently to provide strength and sufficient deformability [18]. The efficiency of the wood adhesive bond is strongly related to the anatomical, physical, and mechanical properties of wood, as well as the properties of the adhesive (viscosity, pH, etc.) and bonding processes (pressure, temperature, etc.). The density, porosity, anisotropy and grain angle of wood can modify the adhesive flow. Adhesive wetting is influenced by wood moisture content, pH, buffering capacity and extractives [19]. Haller et al. [20] reported that the pine wood surface irradiated with a CO2 laser (without carbonization) showed higher contact angles (86°–102°) and longer spreading time (40 s) with distilled water drop to full spread, compared to the surface obtained by a saw tool (contact angle: 11°–47°, spreading time: 18 s). Inversely, Dolan [21] claimed that the wetting properties improved by the irradiated surfaces. Changes in the chemical wood structure can affect the wetting and glueing performance. Kačík et al. [8] proved that CO2 laser caused thermal action by giving rise to particular vibrational changes in the molecules. Saccharides, especially hemicelluloses and amorphous parts of cellulose, showed fast degradation and less stability. The ratio of damage and distortion of wood under the bonding process is associated with the mechanical properties of wood [19]. With higher wood density, higher adhesion strength resulted [22].
Research to date has not yet determined the bondline characteristics made of laser-cut wood, particularly the wetting properties, the chemically modified surface, and the strength and adhesive penetration of the bondline. Our recent study [4] focused on the tensile shear strength of wood cut by CO2 laser. The tensile shear strength of laser-cut wood bonded with polyvinyl acetate adhesive decreased significantly compared to that of sawn samples. To determine the reasons for the strength’s reduction, further scientific investigations and monitoring of the glued tensile shear strength are necessary.
In the present study, it is hypothesized that the modulus of linear elasticity of glue line made of laser-cut samples is lower than that of saw-cut samples. A questionable assumption was made based on the depth of heat affected zone in the laser-cut samples with varying laser parameters. A deeper heat-affected zone occurred with a lower cutting speed rather than a higher one. The low cutting speed enables wood material to absorb more energy at a longer exposure time. A lower gas pressure rather than the higher one is created more burning. The lower pressure removes slowly the smoke and unnecessary gas, delaying the heat conductivity. The focal point position at the middle of the workpiece creates a deeper heat-affected zone vs. the zone creates with the focal point located at top surface. The highest laser energy at the center of the workpiece melts down more wood material. It is likely to imagine that the hydrophilic property of the laser-cut surface decrease, due to the heat-affected zone. Then, the PVAc drop remains on the laser-cut surface. It is assumed that the adhesive penetration of the laser-cut samples decreases, due to the charred particles and heat affected zone, as compared to sawn samples. It is possible that the removal of the charred particles increases the chance of drop absorption and PVAc penetration into the cellular structure of the laser-cut samples. Heat affected zone is the degradation of the main chemical components of wood that occurs during laser cutting, particularly the degradation of lignin, hemicellulose, and amorphous regions of cellulose.
Kiln-dried European beech (Fagus sylvatica L.) wood was purchased from the Wood Store®, Czech Republic, with an average density of 770 kg/m3. The average moisture content of the lumber was 16%. The dimension of the beech lumbers was 25 cm × 3 cm × 50 cm (in radial, tangential, and longitudinal directions). Single-component, water-proof polyvinyl acetate (PVAc) Ag-Coll 8761/L D3 adhesive was used, with a viscosity ranging from 7000 to 13,000 MPa.s at 23°C and a density ranging between 0.9 and 1.1 g/cm3.
The wood samples were conditioned in a climatic chamber at 20 ± 2°C and 65 ± 5% relative humidity (RH) until the weight became constant. The average moisture content of conditioned samples was 12%. The moisture content was calculated using representative samples according to ISO 13061-1 [23].
Wood samples were cut in a parallel direction to the grain. The characteristics of the circular saw used for cutting the reference samples are shown below:
• Blade diameter (mm): 300
• Blade thickness (mm): 2.2
• Tooth thickness (mm): 3.2
• RPM during cutting: 4000
• Feed rate: 4 m/min
• Blade height during cutting: 60 mm
After cutting, the samples were sanded using abrasive paper with a P280 grit size. The number of samples prepared (15 cm × 2 cm × 0.5 cm) according to EN 302-1 [24] was twelve.
A CO2 laser machine (TRUMPF®, Czech Republic) was used to cut the beech wood samples. The samples were placed perpendicular to the laser beam to cut parallel to the grain. The cut sample strips had a dimension of 3 cm × 1 cm × 50 cm (in tangential × radial × longitudinal direction). The number of samples was 54. The applied processing parameters were:
• Cutting speed: 3 m/min and 3.5 m/min
• Focal point position: on the surface and half from the top of surface
• Gas pressure: 17 bar and 21 bar
• Nozzle diameter was 2.7 mm
2.2.3 Tensile Shear Strength Test
The strips obtained by laser cutting had an uneven shape (V shape cross section) from the top surface to the bottom. To minimize the effect of unevenness, 5 mm was cut from each edge along the longitudinal direction (Fig. 1a). The final width of the samples for the glued shear test was 2 cm. The length and thickness of the samples were 15 cm and 5 mm, respectively. The total samples (108 pieces) were subsequently divided into two groups of sanded (36 pieces) and non-sanded (72 pieces) samples. Sandpaper of grit size P280 was used to remove the charred layer in the case of samples meant for sanding. Average roughness values of sanded samples along the grain direction were obtained using a stylus-type surface profilometer (Form Talysurf Intra 2, Leicester, UK). Then glue shear samples were prepared using polyvinyl acetate adhesive (150 ± 10 g/m2) using both sanded and non-sanded samples separately (Fig. 1). The assembled samples were subsequently cold pressed using a pressure of 0.7 ± 0.1 N/mm2 (Fig. 1c). In total 54 shear test samples, 18 with sanded samples and 36 with non-sanded samples were prepared. For each variable of processing (cutting speed, gas pressure, focal point position, sanding) six replicate samples were tested. The tensile shear test was performed using a universal testing machine equipped with a video extensometer (INSTRON® 5882, NORWOOD, USA). Load was applied through the movable head of the machine moved at a constant speed of 5 ± 0.5 mm/min. The data for the maximum force were acquired based on EN 302-1 [24]. As per the following equation:
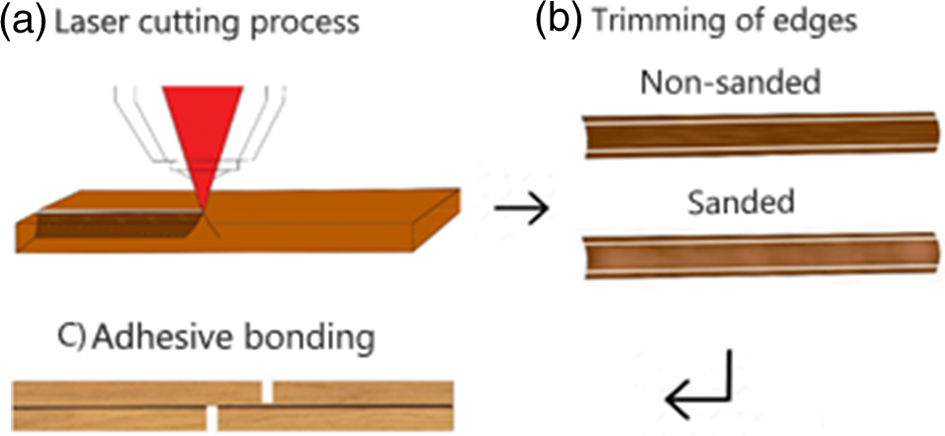
Figure 1: Configuration of the bond process of laser-cut samples (tangential surface of beech species glued with PVAc resin)
where: τ is the tensile-shear strength parallel to the fibres (MPa), Fmax is the maximum loading force recorded at the breaking point (N),
After the tensile shear test, analysis was carried out based on the load and displacement data obtained from the extensometer’s software (Fig. 2). The main purpose of the analysis was to determine the linear elasticity modulus of the glue line for each type of group. During the experimental tests, only the elongation of the entire sample
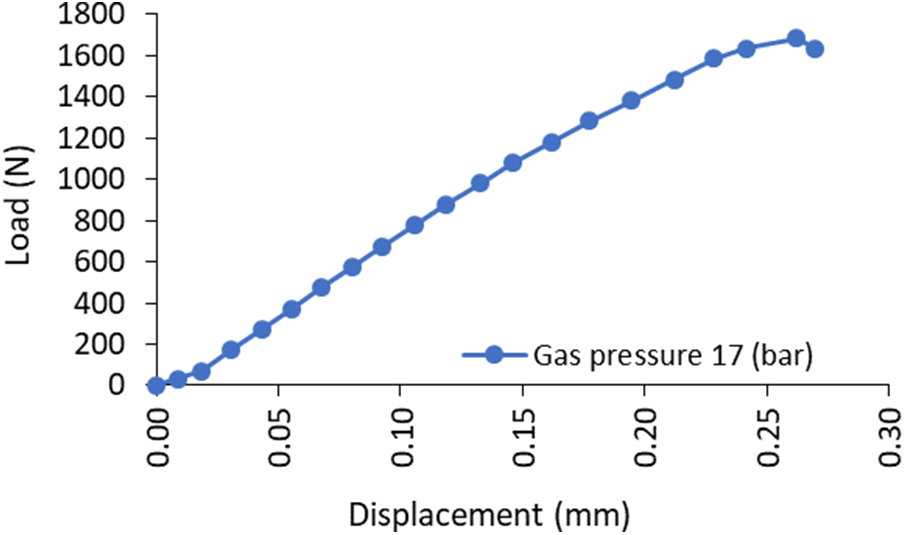
Figure 2: An example relation load (N) over displacement (dL)
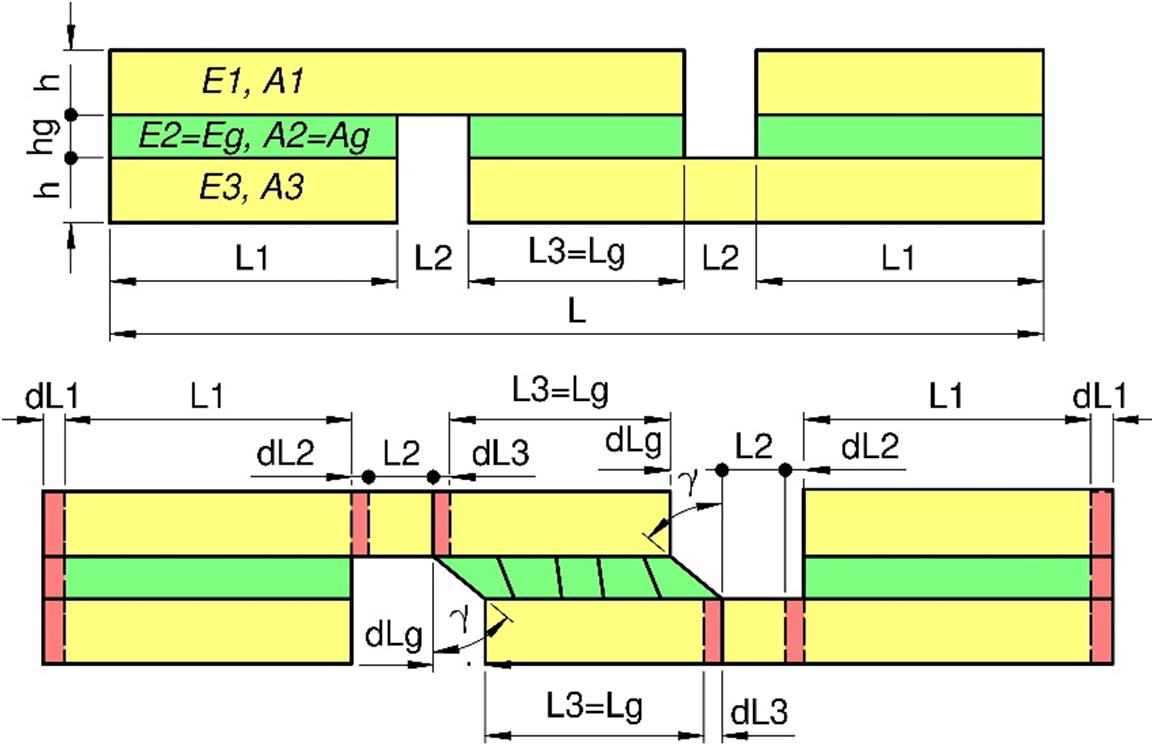
Figure 3: Elongation model of overlap joint (
Fig. 3 presents a deformation model of joints. The external tensile load (N) is divided between wooden claddings and glue line.
Suppose the module of linear elasticity of claddings
For this reason, the loads in the glue line were omitted for further calculations, and only loads in cladding were considered. To calculate the shear module of the glue line, it was first to be computed elongation
where:
where: F (N) external load,
where:
The shear modulus
where:
The module of linear elasticity of glue line
The module of linear elasticity of joints
The results of analytical calculations were verified by the method of finite elements. For this purpose, a numerical model was prepared, as shown in Fig. 4.
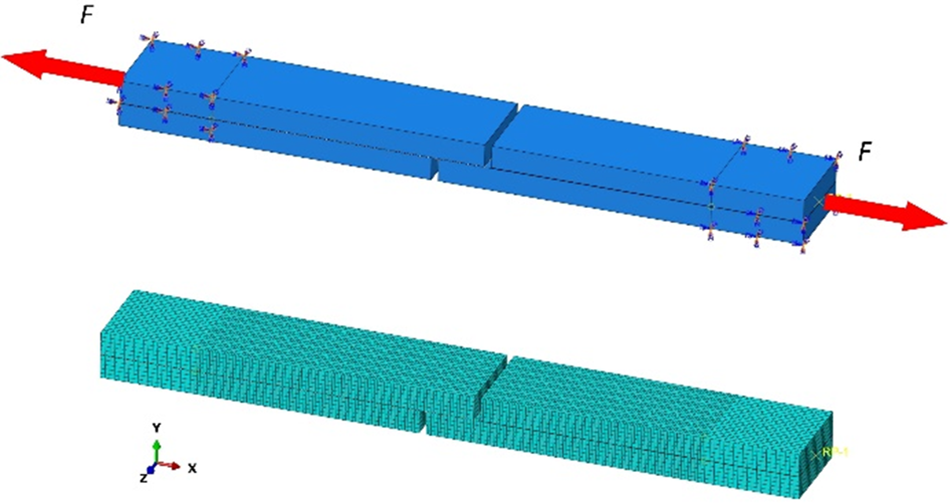
Figure 4: FEM model of lap joint
The constitutive model of wood is shown in Fig. 5. In order to include plastic strains of beech wood in numerical calculations, true stress and true strains were calculated from the Eqs. (15), (16), respectively (Fig. 5a):
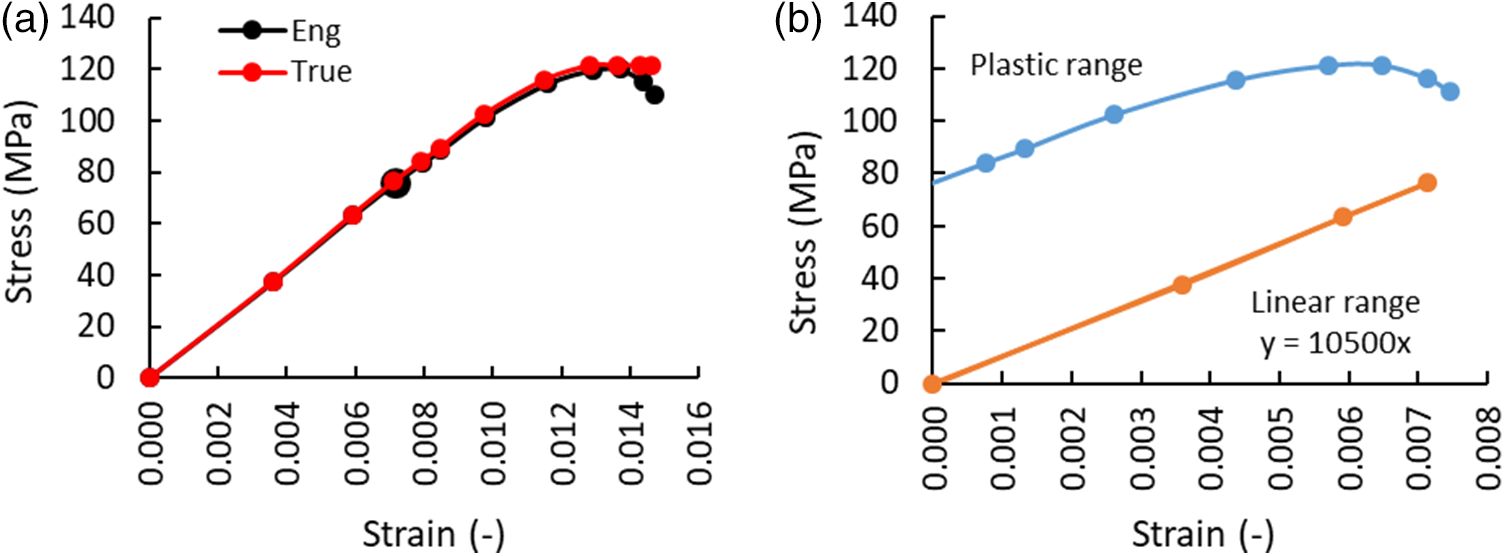
Figure 5: Constitutive model of wood: (a) engineering and true stress-strain relation, (b) linear and plastic range for true stress-strain relation
where:
In the next step, the thru stress-strain relation was divided into two parts (Fig. 5b). The plastic and elastic range were determined, establishing the linear equation for the elastic range. It results from Fig. 5b that the slope of the straight line corresponds to the value of the modulus of linear elasticity for wood equal to
As mentioned earlier, during the experimental tests, only the elongation of the entire sample
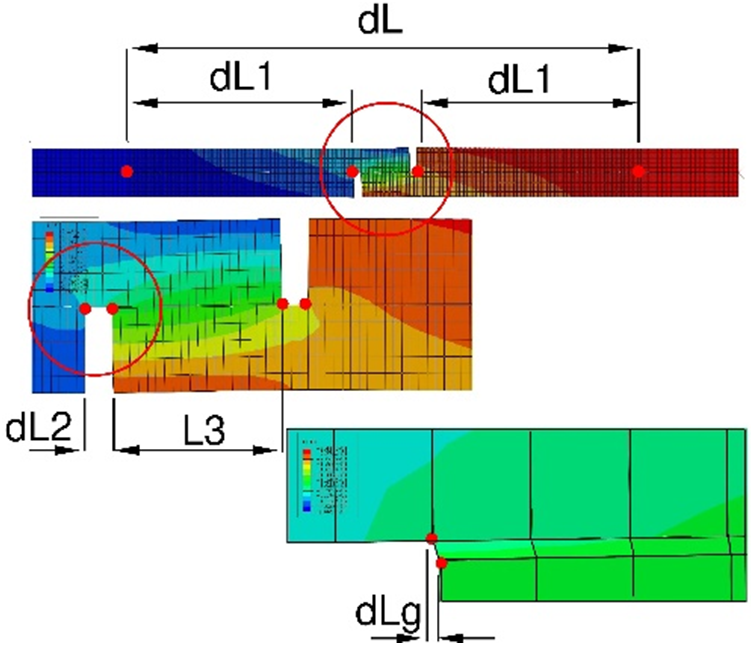
Figure 6: Elongation measurement in a numerical model of overlap joint
Using the given test method, the elongation
Samples of 5 mm3 × 5 mm3 × 5 mm3 were used and a smooth surface was prepared using a sledge microtome (Leica SM 2000R, Leica Biosystems Nussloch GmbH, Germany) after softening with water. This contributed to increased wood plasticity and ultimately reduced back cracks in the specimen. Additionally, softening reduces cutting resistance and wear in the cutting tool [29]. The glue line in the cross section was observed with a scanning electrom microscope (SEM Tescan Vega 4, TESCAN ORSAY HOLDING, a.s., Czech Republic). The scans were prepared in a RESOLUTION scanning mode in a high vacuum with a detector of secondary electrons (SE detector). A low energy imaging method was applied in order to prevent charging of non-conductive samples without sputter coating. The optimised parameters were as follows: beam current 6 pA, landing energy 800 eV, scan speed 3 (1 µs/pixel), image averaging with an accumulation of 50 images with image dimensions 1536 × 1152 pixels. The magnification of the microscope was set to 250x and 1000x.
In this study, energy dispersive X-ray (EDX) spectrometry was used to identify the chemical changes in the samples through the changes in elemental composition (O/C ratio). An EDX analysis of the laser-cut surface (1L) and 6 other layers below (2L-7L) was performed to investigate how deep the laser cutting affects the chemical composition (O/C ratio) of wood. Every layer was 50 µm thick and prepared by sliding microtome (Thermo Scientific Microm HM 430). Slices were made after softening with only droplets of distilled water at room temperature (21°C) to avoid changes in the chemical composition of the wood samples. As a first step, the surface layer was positioned and cut a 50 µm thick slice. Subsequently, 6 more slices with 50 µm thick were cut. After cutting, the slices were placed in desiccators with silica gel to dry. The EDX analysis was performed at 3 points on each layer. The device used for the test was a Hitachi S-3400N scanning electron microscope, equipped with a Bruker XFlash 5010 EDX detector.
2.2.6 Fourier Transform Infrared Spectroscopy (FTIR-ATR)
Fourier transform infrared spectroscopy studies were performed using a FTIR spectrometer, (Nicolet, Křelovická, Czech Republic). The obtained samples were analyzed in a transmittance range of 4000–500 cm–1.
2.2.7 Contact Angle Measurement
The degree of wettability on the laser-cut samples, with and without sanding, was determined by measuring the contact angle between the PVAc adhesive and the sample surface. The contact angle of the laser-cut samples was measured with the sessile drop method using a goniometer Krüss DSA 30E device (Krüss, Hamburg, Germany) and compared with the reference samples. A volume of 10 µl was applied to the sample surface. Five measurements per sample were taken (Fig. 7). The time taken by the PVAc drop to wet the laser-cut surface is also crucial. The contact angle measurement continued until the PVAc drop completely disappeared on the surface or attained a constant contact angle. This is quite important for closed or open assembly time prior to gluing (cold press).
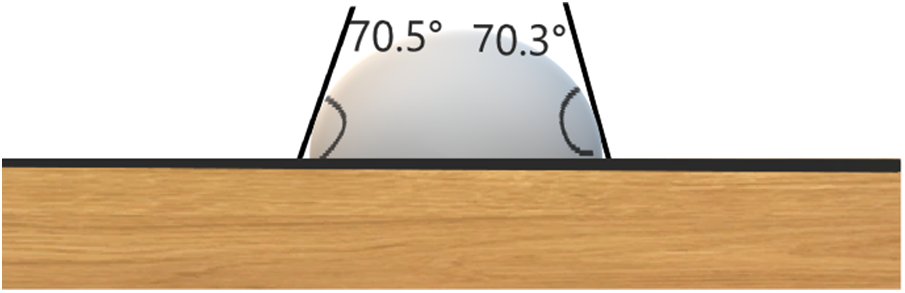
Figure 7: Contact angle measurement of laser-cut samples
A statistical analysis of the experimental data was performed through analysis of variance (ANOVA) and Fischer’s F-test using STATISTICATM 14 (StatSoft Inc., Oklahoma, US).
3.1 Linear and Shear Modulus of Glue Line
Fig. 8 shows the relationship between normal stresses and strains for all joints. The results include experimental research (Fig. 8a) and numerical calculations (Fig. 8b). The modules of the linear elasticity of the glue line used for numerical computations are presented in Fig. 10 and discussed in the next part of the work. Fig. 8 shows that the results of numerical calculations correspond to the results of experimental research. The differences in stress value sets for the same strains are insignificant and range from 5% to 15%, with a predominance on the numerical calculations side. For example, the average difference between experimental and numerical for cutting speed 3.5 m/min samples was approximately 10%.
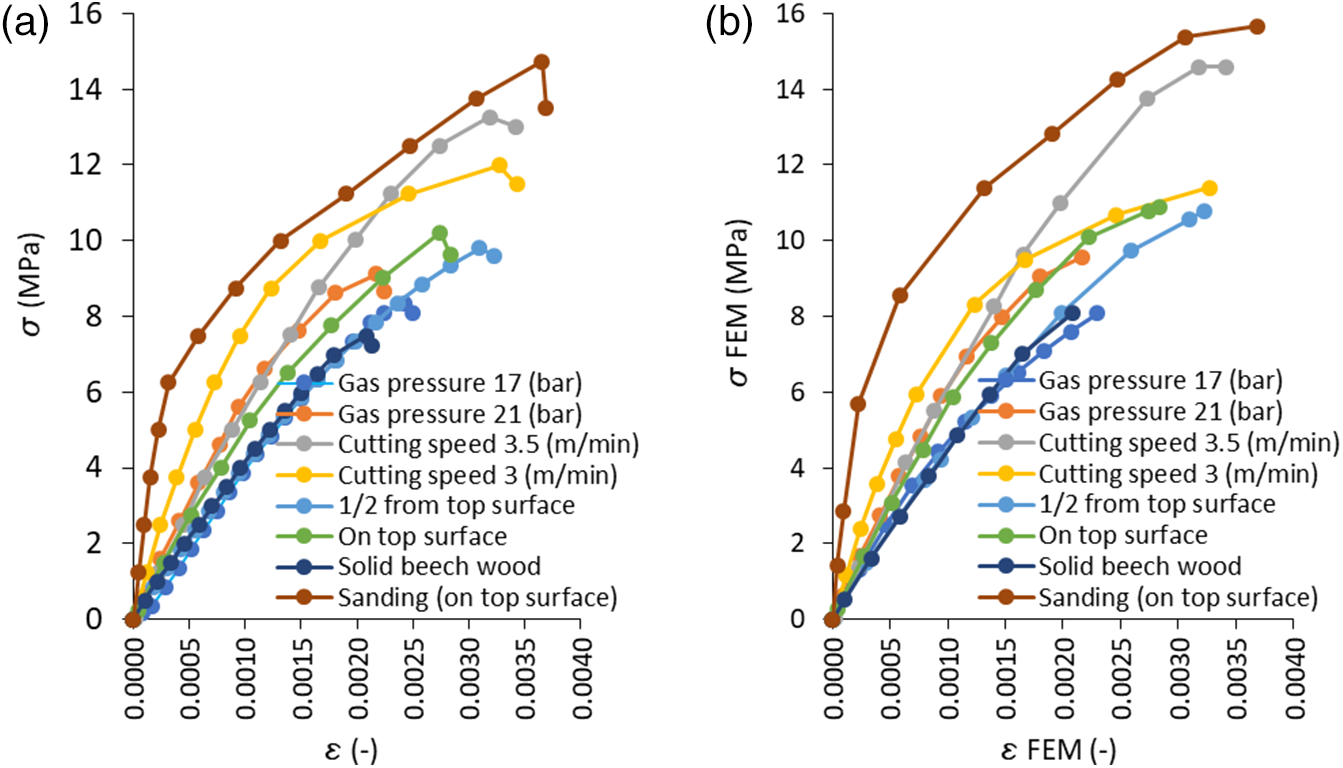
Figure 8: Normal stress-strain relationship for tensiled joints: (a) experimental, (b) numerical
The slope of the curves determines the rigidity of the joints. In Fig. 10, values of joint modules of linear elasticity based on the experimental tests were presented. From both figures (Figs. 8, and 10), it can be concluded that the most significant rigidity that characterizes joint sanding (with focal point on top surface) was the module of linear elasticity
Considering the high compliance of the results of numerical calculations with the results of experimental research, the quality of the mathematical model was also verified. Therefore, on the basis of Eq. (13) the module of linear elasticity of glue line was calculated. In the case of the selected joint, gas pressure 17 (bar), appropriate elongations were illustrated in Table 1. This table shows that the maximum differences between the results obtained in both methods do not exceed 8.2%. Therefore, it can be considered that the elaborated mathematical model is adequate and can be used for further calculations of the module of linear elasticity in other joints. Using the developed mathematical model in Fig. 9, the relationship between the shear stress and the shear strain of the glue line was presented. On this basis, the values of the Kirchhoff module of the glue line
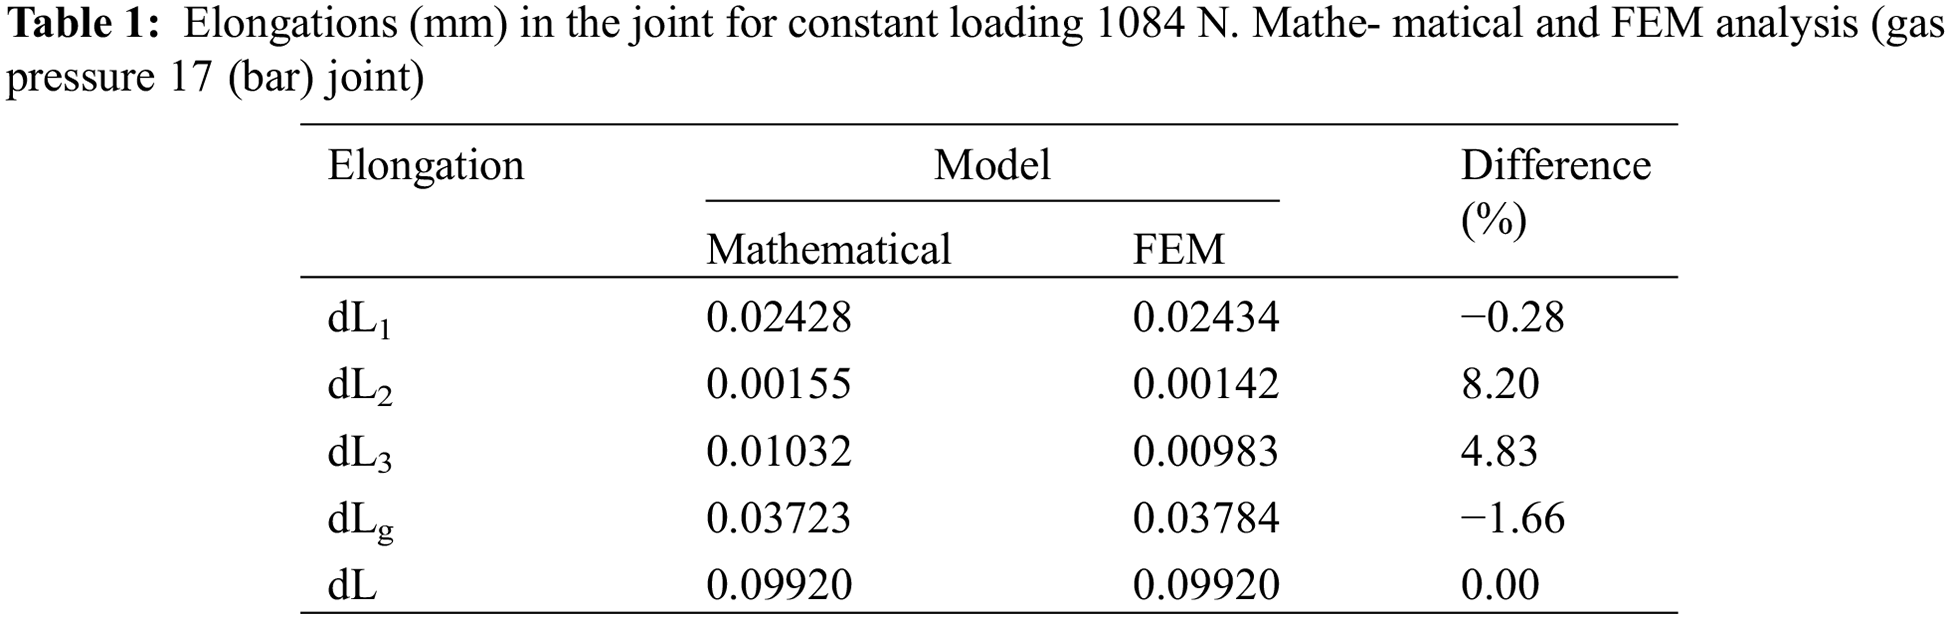
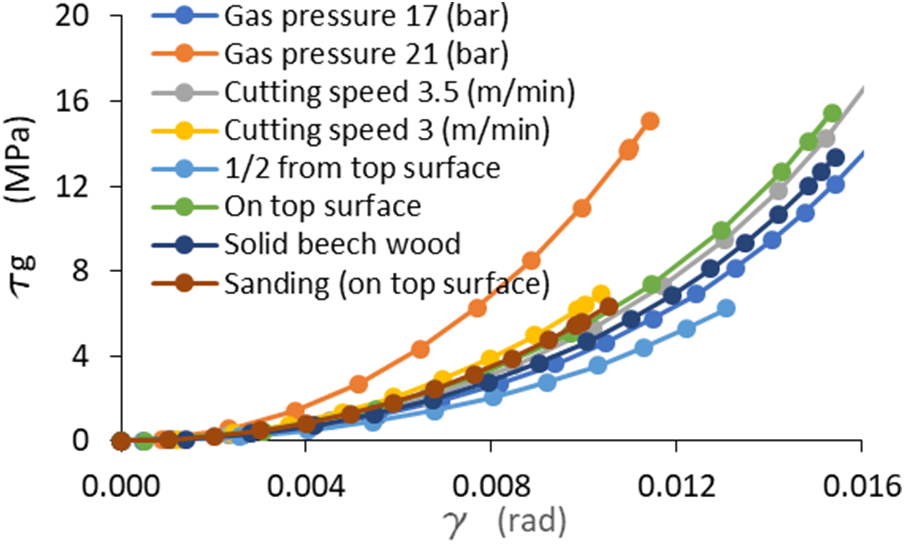
Figure 9: Shear stress-strain relationship for tensiled joints
Ultimately, Fig. 10 presents the calculated modules of linear elasticity of the glue line
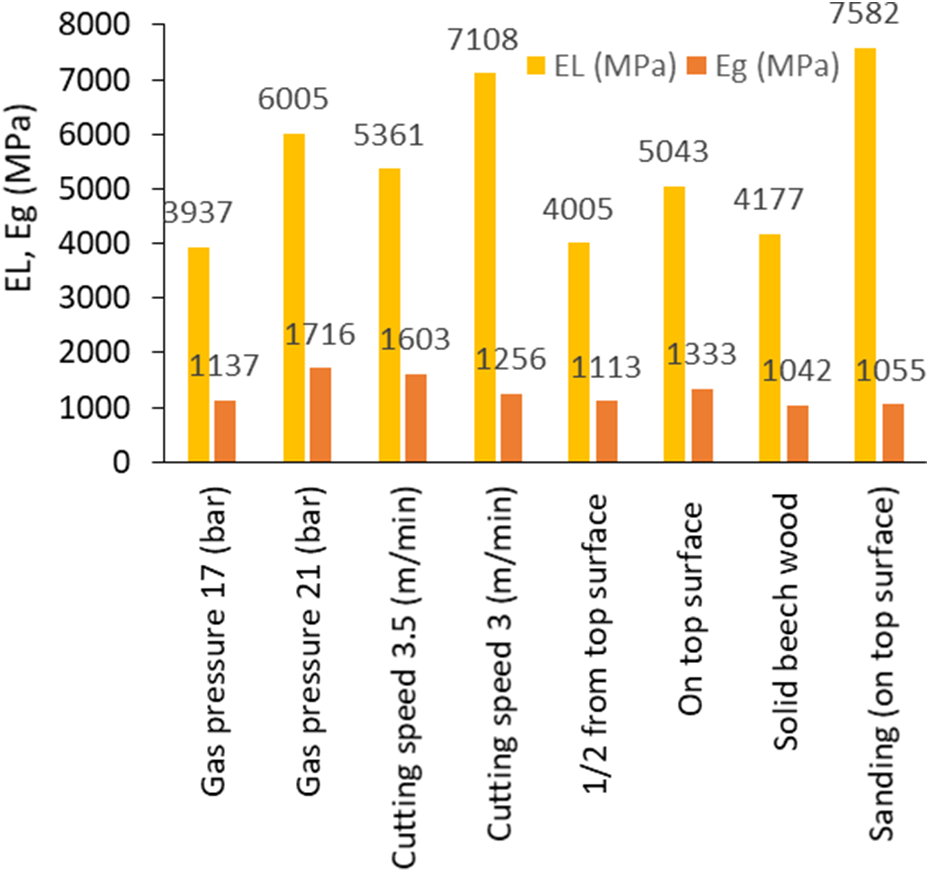
Figure 10: Modulus of linear elasticity of joints and glue line
The penetration depth of PVAc adhesive into the porous structure of the glued laser-cut samples with and without sanding is shown in Fig. 11. The penetration depth of adhesive into the porous structure of the laser-cut samples without sanding is the same as that of the laser-cut samples with sanding. The effect of adhesive penetration on bonding performance depends on other factors, including adhesive characteristics and the production process. The penetration behavior of PVAc adhesive into the porous structure of reference samples is the same as that of laser-cut samples.
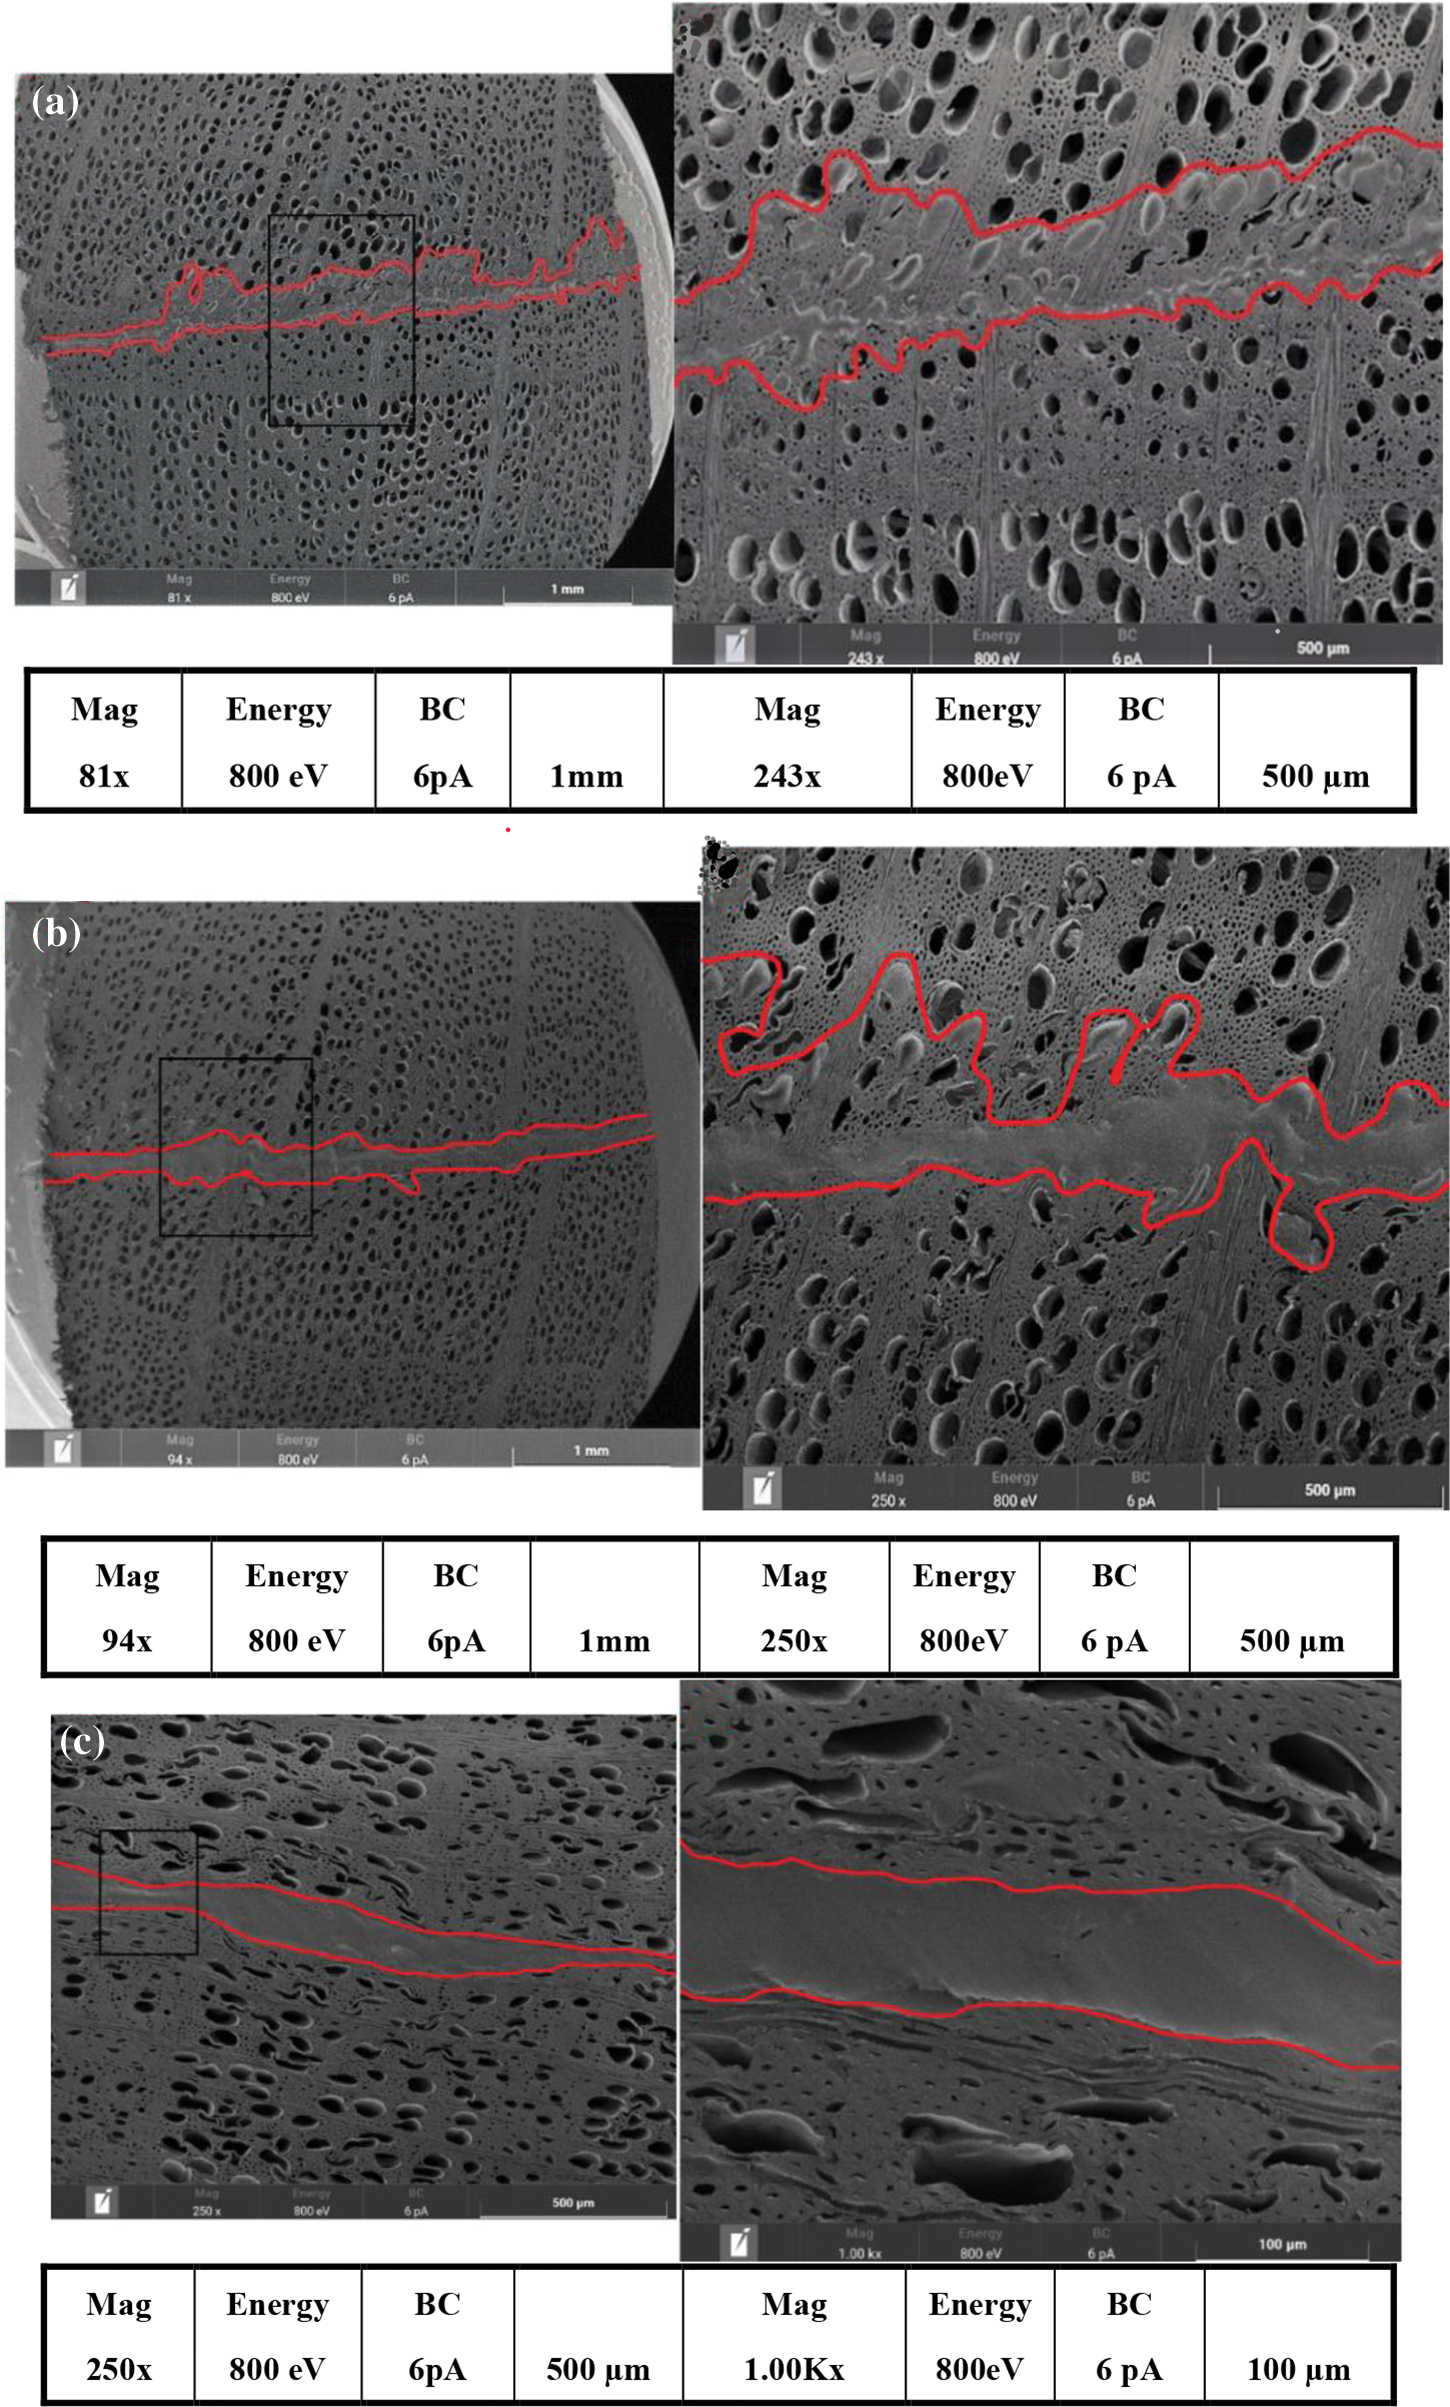
Figure 11: The penetration depth of polyvinyl acetate adhesive into (a) laser-cut samples without sanding (b) laser-cut samples with sanding (c) reference
The elemental analysis of the glue layer was also performed to show the penetration of the adhesive (Fig. 12). The PVAc adhesive used has the same elemental composition as the wood (C, O, H), thus the contrast between the wood and adhesive is not highly visible. However, there is a slight difference in the ratio of individual elements in the wood and in the adhesive. As a result, higher carbon content in the PVAc adhesive is visible in Fig. 12. The figure shows that the adhesive did not penetrate the charred wood efficiently. More red color on the upper part of the specimen indicates a higher carbon content of the PVAc adhesive.
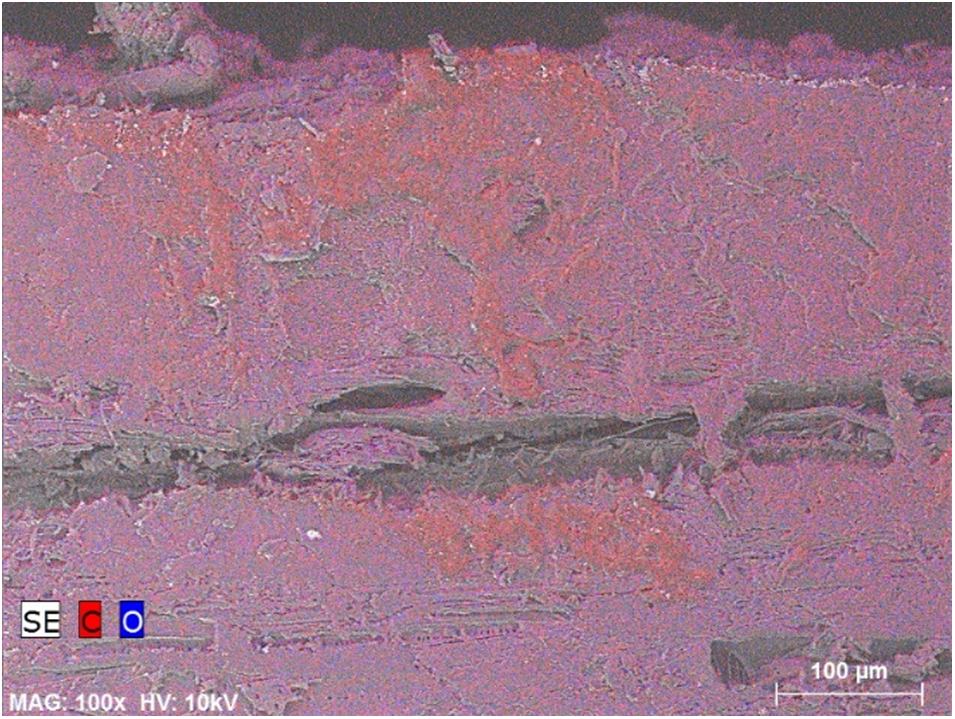
Figure 12: Elemental analysis of the glued joint after failure
The elemental composition of the laser-cut surfaces showed a different pattern in the depth of the beech material depending on cutting parameters. Cutting speed had a significant effect on changes in the main chemical components of the cut surface, but the hypothesis that slower cutting speed will result in higher degradation of the surface (indicated by a lower O/C ratio) was not supported by the results (Fig. 13), as higher cutting speed resulted in a lower O/C ratio. The effect of laser cutting on the chemical composition of the beech wood was not significant with a 3 m/min cutting speed in any of the investigated layers, including the surface layer. On the other hand, increasing the cutting speed to 3.5 m/min resulted in a severe decrease in the O/C ratio. Specifically, the ratio of carbon increased on the cut surface as a result of the high temperature of the laser beam. With a higher cutting speed, this effect was significant to a depth of 150 μ (4L) compared to the reference sample, and no effect was observed deeper into the beech material. This may be explained by the fact that the wood was in contact with the laser beam for a longer time, allowing more temperature driven oxidative reactions of the cell wall components. This result indicates that laser cutting with smaller heat degradation of the surface is possible with a slower cutting speed.
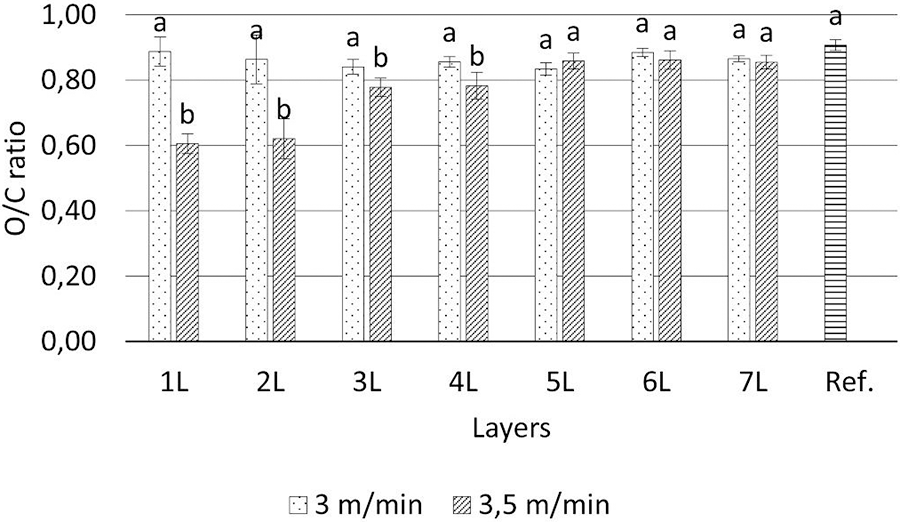
Figure 13: The effect of different cutting speeds in different depths on the O/C ratio of laser-cut surfaces. 1L: cut surface; 2L: 50 μm; 3L: 100 μm; 4L: 150 μm; 5L: 200 μm; 6L: 250 μm; 7L: 300 μm. Different superscript letters (“a” and “b”) indicate significant difference between samples at p < 0.05
Gas pressure had a significant effect on the chemical components of the cut surface. Higher gas pressure resulted in higher degradation of the surface, indicated by a lower O/C ratio in every investigated layer (Fig. 14). The effect of laser cutting on the chemical composition of the beech wood was significant with both 17 bar and 21 bar gas pressure, mostly on the surface layer. However, with 17 bar gas pressure, the effect diminished to an insignificant level at a depth of 50 μm (2L). On the other hand, increasing the gas pressure to 21 bar resulted in a severe decrease in the O/C ratio in deeper layers as well. With higher gas pressure, this effect was significant to a depth of 150 μ (4L) compared to the reference sample, while no effect was observed deeper into the beech material. All of this may indicate that the lower gas flow rate associated with lower gas pressure resulted in a higher smoke concentration, which could reduce the effect of the laser beam on heating the wood. This result indicates that laser cutting with smaller heat degradation of the surface is possible with lower gas pressure.
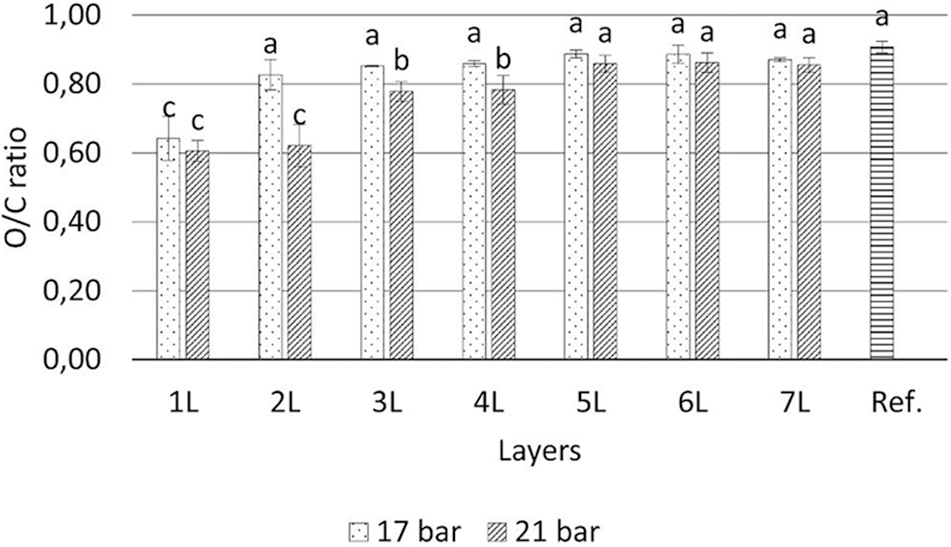
Figure 14: The effect of different gas pressure at different depths on the O/C ratio of laser-cut surfaces. 1L: cut surface; 2L: 50 μm; 3L: 100 μm; 4L: 150 μm; 5L: 200 μm; 6L: 250 μm; 7L: 300 μm. Different superscript letters (“a”, “b” and “c”) indicate significant difference between samples at p < 0.05
The focal point had a significant effect on the chemical components of the cut surface. The focal point on top surface resulted in significantly higher degradation of the cut surface, indicated by a lower O/C ratio, compared to cutting with a focal point on the centre of the sample (Fig. 15). However, the effect diminished to an insignificant level at a depth of 50 μm (2L) in both investigated focal point positions compared to the reference sample, while no effect was observed deeper into the beech material. This result indicates that laser cutting with smaller heat degradation of the surface is possible with a focal point in the centre of the material instead of on its surface.
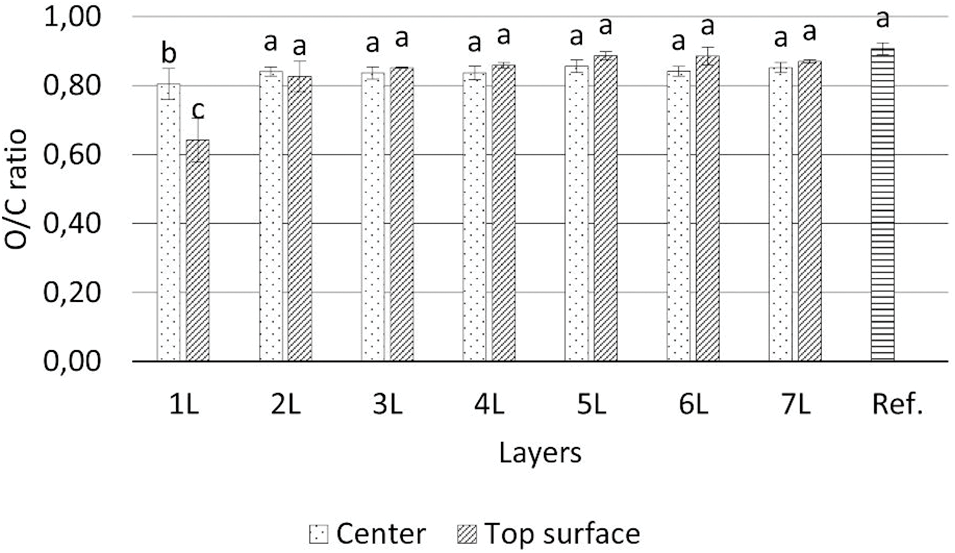
Figure 15: The effect of different focal points at different depths on the O/C ratio of laser-cut surfaces. 1L: cut surface; 2L: 50 μm; 3L: 100 μm; 4L: 150 μm; 5L: 200 μm; 6L: 250 μm; 7L: 300 μm. Different superscript letters (“a”, “b” and “c”) indicate significant difference between samples at p < 0.05
The level of wettability of laser-cut samples with PVAc adhesive before glueing is shown in Fig. 16. It is apparent from Fig. 16b that the contact angle between the PVAc adhesive and the laser-cut samples started in the range of 85° to 60° at 13 s and continued to decline very fast to reach between 38° to 20° at 30 s. Surprisingly, after 30 s, the PVAc drop was completely absorbed by the laser-cut surface. As shown in Fig. 16c, the contact angle of the laser-cut samples with sanding was initially in the range of 80°–69° between 8 to 20 s. After this, the angle was sharply reduced to the range of 30°–40° after 60 s, followed by a slow reduction to 20° at 180 s. The PVAc drop was completely absorbed by the sanded surface between 180–360 s.
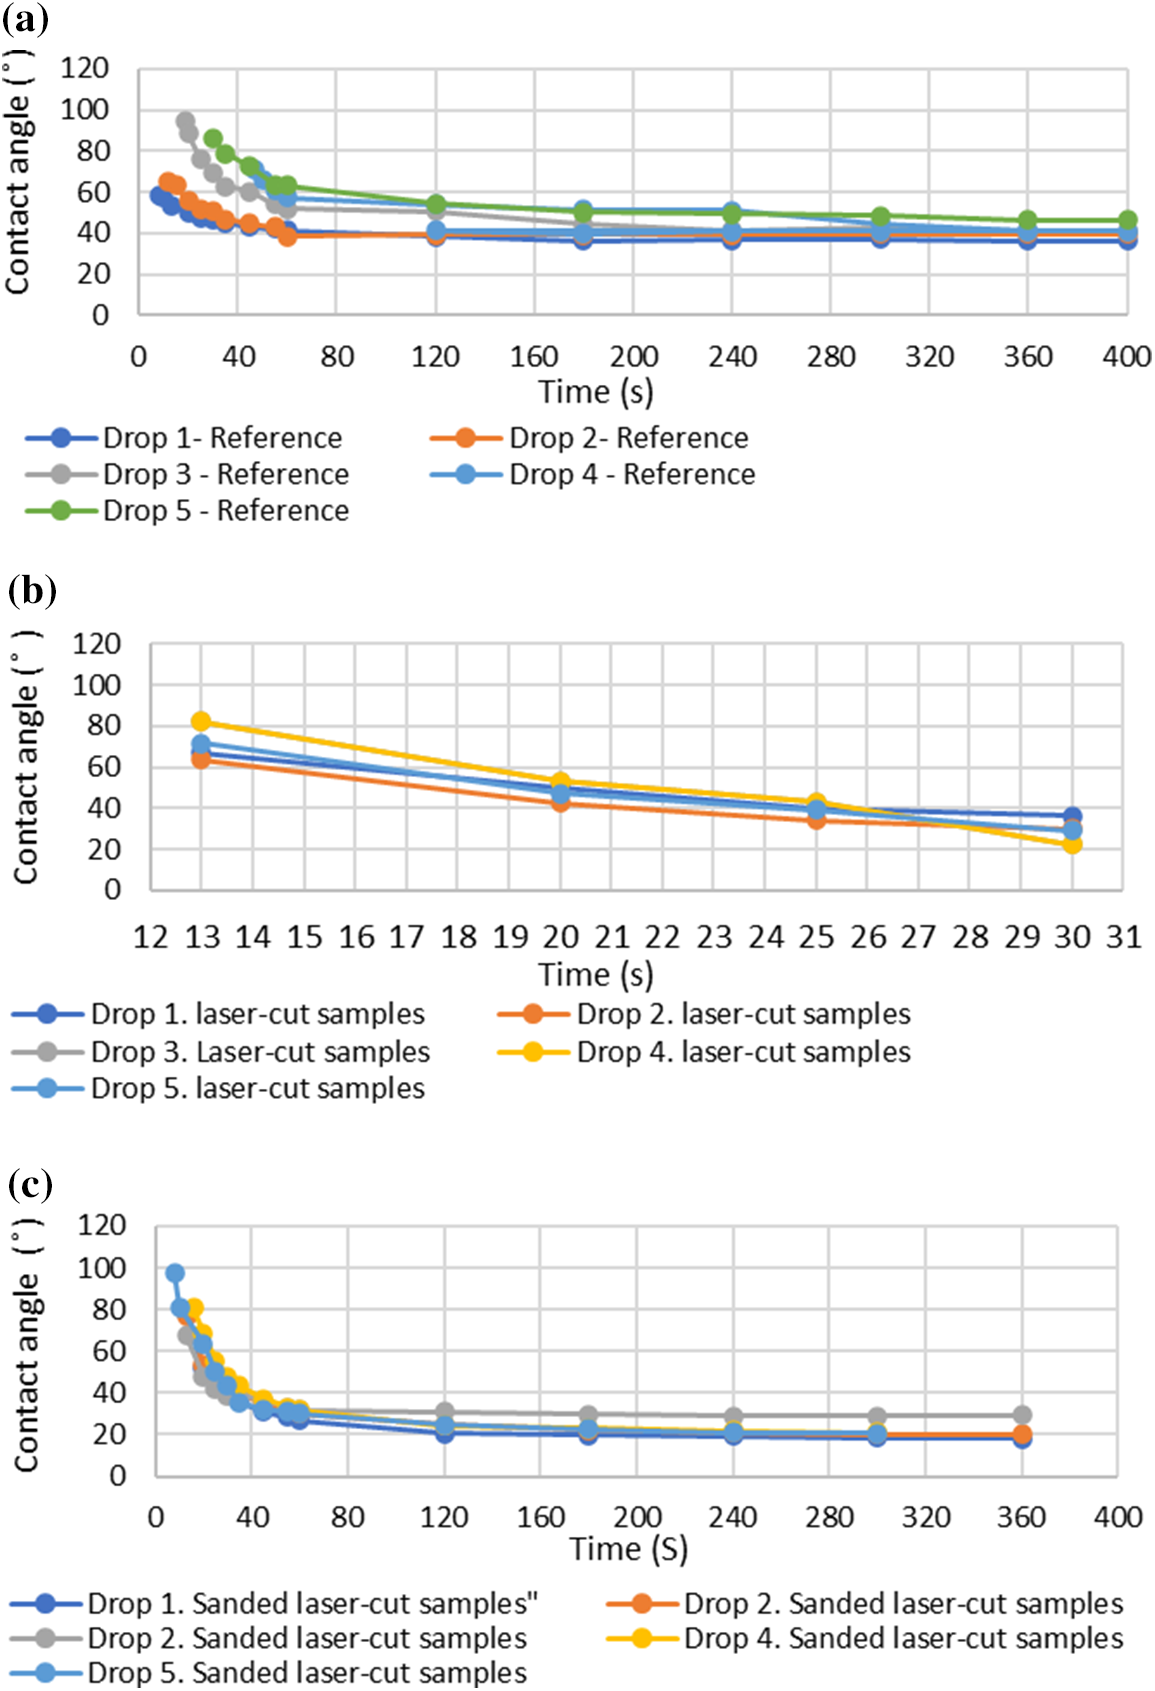
Figure 16: Contact angle measurement on (a) sawn solid beech surface (reference), (b) laser cut surfaces (c) laser cut surface with sanding application
The data in Fig. 16a show the changes in the contact angle of PVAc adhesive on solid beech wood (reference sample) over time. From the very first moments, 8–30 s, the contact angle was in the range of 97°–58°. The angle declined fast (65°–40°) up to 60 s. As time passed, there was a small fluctuation in the angles that continued to remain in the range of 47°–35° even after 300 s. Surprisingly, the adhesive drop was not completely absorbed by the reference surface. It was apparent that laser-cut samples absorbed the PVAc drop faster than the reference samples. This may be explained by the fact that char particles on the surface had free spaces between them and the PVAc drop penetrated into the free spaces faster. Another possible reason might be the improvement in the chemical affinity of the chared material to PVAc, which needs further investigation. When the charred layer was removed (sanding), the sample surface absorbed the PVAc slowly compared to a surface with a charred layer (without sanding), but still faster than the reference sample. The layers under the charred layers were thermally affected and this might have improved the absorption of PVAc adhesive to some degree. The penetration of PVAc into the cellular structure of the laser-cut surface was confined to the bondline area (Figs. 11, and 15). Even though the adhesive drop was absorbed very fast by the laser-cut surface, it mixed with charred particles and did not penetrate deep into the wood.
The FTIR spectroscopy provides broad and rapid information on the structural compositions of wood [30]. However, the method cannot directly allocate bands to every single component of wood [31]. Hemicellulose, cellulose, and lignin are the main chemical components of wood. Nader et al. [32] reported that wood surfaces cut with a CO2 laser are subjected to heating, oxidation and formation of a charcoal layer on the wood surface. The pyrolysis process of wood that occurred during laser-cutting was proven by Barcikowski et al. [3] and Wang et al. [33]. The spectrum of the investigated laser-cut samples and reference samples is shown in Fig. 17. The spectra showed O-H stretching at around 3336 cm−1. The intensity of the O-H bands was slightly higher in the laser-cut samples compared to that of the reference sample. This is due to the decomposition of various oxygen-containing groups [34] and the cleavage of aliphatic hydroxyl groups in the lateral chains [35]. C-H stretching bands of methyl and methylene groups were observed in the range of 2918–2928 cm−1 in the laser-cut samples and nearly in the same range as the reference sample (2922 cm-1). The spectrum of the reference sample showed the presence of C=O carboxyl groups and acetyl groups in hemicellulose at around 1735 cm−1; however, the spectrum was removed or showed a slight curve in the laser-cut samples, indicating the absence of the C=O band. This result indicates that the laser power induces the deacetylation of hemicellulose by the cleavage of acetyl groups [36,37]. The pick at around 1237 cm−1 demonstrated an abundance of C-O, C-C, C-O, and C-O stretching in lignin and xylem in the reference sample, while the intensity of the bands is lower in the laser-cut samples at the same wavenumber. A significant change occurred during pyrolysis in the range of 1900–1600 cm−1, indicating the presence of organic compounds with the carbonyl group (C=O) belonging to numerous organic species, such as aldehydes, esters and ketones [34].
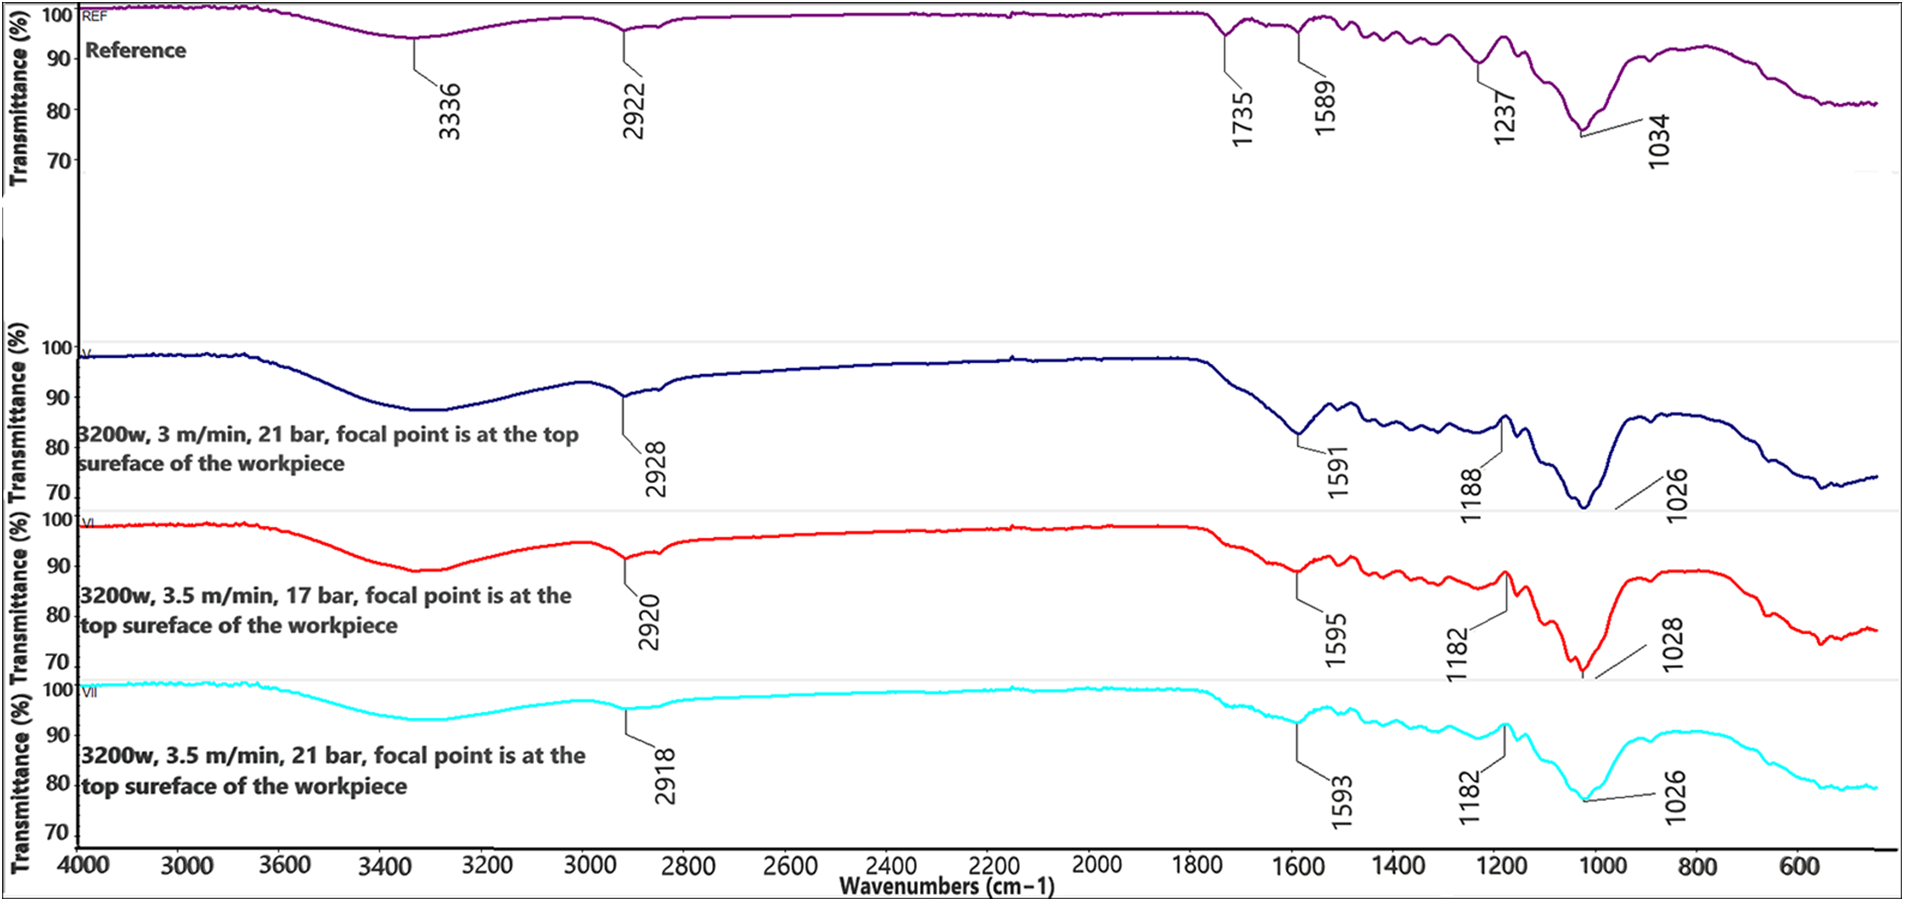
Figure 17: FTIR spectrum for CO2 laser-cut samples (FTIR line with purple color is for solid beech wood or reference. The blue, red, and green lines are for laser-cut samples)
This study was undertaken to determine the characteristics of the glued tensile shear strength made of laser-cut beech wood, compared with glued tensile strength of bondline made of saw-cut wood. The following conclusions can be drawn from the present study:
I) The module of linear elasticity of glue line made of laser-cut samples was comparable with higher than that of saw-cut samples.
II) The absorption of PVAc was faster on the laser-cut surface without sanding than that on the laser-cut surface with sanding. Conversely, the sawn surface was not able to absorb the drop completely even after 400 s. This indicates that laser cutting improved the wettability of wood surfaces.
III) The penetration depth of PVAc adhesive into the cellular structure of the laser-cut samples with and without sanding was at a similar level to that of the sawn samples.
IV) Cutting speed, gas pressure and focal point position had a significant effect on the chemical components of the cut surface. Higher cutting speed, higher gas pressure and focal point on the top surface resulted in significantly higher degradation of the cut surface as indicated by a lower O/C ratio.
V) Laser cutting results in the degradation of hemicellulose and lignin and this might be a reason for the reduction of glued tensile shear strength of laser-cut samples compared to saw-cut samples.
Further research may be conducted to investigate the optimization of CO2 laser parameters on softwood species as well as the possibility to use of a different adhesive system.
Funding Statement: The authors thanks for the financial support by Department of Wood Processing and Biomaterials, Czech University of Life Science.
Conflicts of Interest: The authors declare that they have no conflicts of interest to report regarding the present study.
References
1. Powell, J. (1993). CO2 laser cutting, vol. 214. London: Springer-Verlag. [Google Scholar]
2. Belforte, D. A. (1998). Non-metal cutting. Industrial Laser Solutions, 13(9), 11–13. [Google Scholar]
3. Barcikowski, S., Koch, G., Odermatt, J. (2006). Characterisation and modification of the heat affected zone during laser material processing of wood and wood composites. Holz als Roh- und Werkstoff, 64(2), 94–103. [Google Scholar]
4. Gaff, M., Razaei, F., Sikora, A., Hýsek, Š., Sedlecký, M. et al. (2020). Interactions of monitored factors upon tensile glue shear strength on laser cut wood. Composite Structures, 234, 111679. [Google Scholar]
5. Martínez-Conde, A., Krenke, T., Frybort, S., Müller, U. (2017). Comparative analysis of CO2 laser and conventional sawing for cutting of lumber and wood-based materials. Wood Science and Technology, 51(4), 943–966. [Google Scholar]
6. Badoniya, P. (2018). CO2 laser cutting of different materials—A review. International Research Journal of Engineering and Technology, 5, 1–12. [Google Scholar]
7. Esteves, B., Pereira, H. (2009). Wood modification by heat treatment: A review. BioResources, 4(1), 370–404. [Google Scholar]
8. Kačík, F., Kubovský, I. (2011). Chemical changes of beech wood due to CO2 laser irradiation. Journal of Photochemistry and Photobiology A: Chemistry, 222(1), 105–110. [Google Scholar]
9. Piili, H., Hirvimäki, M., Salminen, A., Lindell, H. (2009). Repeatability of laser cutting of uncoated and coated boards. Proceedings of the NOLAMP, pp. 24–26. Copenhagen, Denmark. [Google Scholar]
10. Riveiro, A., Quintero, F., Boutinguiza, M., Del Val, J., Comesaña, R. et al. (2019). Laser cutting: A review on the influence of assist gas. Materials, 12(1), 157. [Google Scholar] [PubMed]
11. Barnekov, V., Huber, H. A., McMillin, C. W. (1989). Laser machining wood composites. Forest Products Journal, 39(10), 76–78. [Google Scholar]
12. Quintero, F., Riveiro, A., Lusquiños, F., Comesaña, R., Pou, J. (2011). Feasibility study on laser cutting of phenolic resin boards. Physics Procedia, 12, 578–583. [Google Scholar]
13. Lum, K. C. P., Ng, S. L., Black, I. (2000). CO2 laser cutting of MDF: 1. Determination of process parameter settings. Optics & Laser Technology, 32(1), 67–76. [Google Scholar]
14. McMillin, C. W., Harry, J. E. (1971). Laser machining of southern pine. Forest Products Journal, 21(10), 35–37. [Google Scholar]
15. Hernandez-Castaneda, J. C., Sezer, H. K., Li, L. (2011). The effect of moisture content in fibre laser cutting of pine wood. Optics and Lasers in Engineering, 49(9–10), 1139–1152. [Google Scholar]
16. Koning, J. W. (2010). Forest products laboratory, 1910–2010. Madison, WI: University of Wisconsin Press. [Google Scholar]
17. Pocius, A. V. (2021). Adhesion and adhesives technology: An introduction. Munich: Carl Hanser Verlag GmbH Co. KG. [Google Scholar]
18. Baier, R. E., Shafrin, E. G., Zisman, W. A. (1968). Adhesion: Mechanisms that assist or impede it: An interdisciplinary approach relates present knowledge of adhesion to bioadhesional problems. Science, 162(3860), 1360–1368. [Google Scholar] [PubMed]
19. Hunt, C. G., Frihart, C. R., Dunky, M., Rohumaa, A. (2018). Understanding wood bonds-going beyond what meets the eye: A critical review. Reviews of Adhesion and Adhesives, 6(4), 369–440. [Google Scholar]
20. Haller, P., Beyer, E., Wiedemann, G., Panzner, M., Wust, H. (2001). Experimental study of the effect of a laser beam on the morphology of wood surfaces. Proceedings of the First International Conference of the European Society for Wood Mechanics, Lausanne, Switzerland. [Google Scholar]
21. Dolan, J. A. (2014). Characterization of laser modified surfaces for wood adhesion (Ph.D. Dissertation). Virginia Tech. [Google Scholar]
22. Aicher, S., Ahmad, Z., Hirsch, M. (2018). Bondline shear strength and wood failure of European and tropical hardwood glulams. European Journal of Wood and Wood Products, 76(4), 1205–1222. [Google Scholar]
23. ISO 13061-1 (2014). Physical and mechanical properties of wood–test methods for small clear wood specimens–Part 1: Determination of moisture content for physical and mechanical tests. [Google Scholar]
24. EN 302-1.2013 (2013). Adhesives for load-bearing timber structures–test methods–Part 1: Determination of longitudinal tensile shear strength. [Google Scholar]
25. Kamboj, G., Gaff, M., Smardzewski, J., Haviarová, E., Borůvka, V. et al. (2020). Numerical and experimental investigation on the elastic stiffness of glued dovetail joints. Construction and Building Materials, 263(3), 551–558. [Google Scholar]
26. Smardzewski, J., Wojciechowski, K. W., Poźniak, A. (2018). Auxetic lattice truss cores fabricated of laywood. BioResources, 13(4), 8823–8838. [Google Scholar]
27. Smardzewski, J. (2019a). Experimental and numerical analysis of wooden sandwich panels with an auxetic core and oval cells. Materials and Design, 183(12), 108159. [Google Scholar]
28. Smardzewski, J. (2019b). Wooden sandwich panels with prismatic core–energy absorbing capabilities. Composite Structures, 230, 111535. [Google Scholar]
29. Xu, Y., Wang, B., Shen, Y., Wu, J., Feng, L. et al. (2017). Effect of softening treatment on cutting force during slicing the veneers of common fast-growing wood. BioResources, 12(4), 7205–7217. [Google Scholar]
30. Esteves, B., Velez Marques, A., Domingos, I., Pereira, H. (2013). Chemical changes of heat treated pine and eucalypt wood monitored by FTIR. Maderas. Ciencia y Tecnología, 15(2), 245–258. [Google Scholar]
31. Owen, N. L., Thomas, D. W. (1989). Infrared studies of “hard” and “soft” woods. Applied Spectroscopy, 43(3), 451–455. https://doi.org/10.1366/0003702894202760 [Google Scholar] [CrossRef]
32. Nader, N., Legacey, S., Chin, S. L. (1999). Preliminary investigations of ultrafast intense laser wood processing. Forest Products Journal, 49(6), 72. [Google Scholar]
33. Wang, Y., Ando, K., Hattori, N. (2013). Changes in the anatomy of surface and liquid uptake of wood after laser incising. Wood Science and Technology, 47(3), 447–455. [Google Scholar]
34. Yang, J., Chen, H., Zhao, W., Zhou, J. (2016). TG-FTIR-MS study of pyrolysis products evolving from peat. Journal of Analytical and Applied Pyrolysis, 117, 296–309. [Google Scholar]
35. Liu, Q., Wang, S., Zheng, Y., Luo, Z., Cen, K. (2008). Mechanism study of wood lignin pyrolysis by using TG-FTIR analysis. Journal of Analytical and Applied Pyrolysis, 82(1), 170–177. [Google Scholar]
36. Altgen, M., Willems, W., Hosseinpourpia, R., Rautkari, L. (2018a). Hydroxyl accessibility and dimensional changes of Scots pine sapwood affected by alterations in the cell wall ultrastructure during heat-treatment. Polymer Degradation and Stability, 152, 244–252. [Google Scholar]
37. Altgen, M., Uimonen, T., Rautkari, L. (2018b). The effect of de- and re-polymerization during heat-treatment on the mechanical behavior of Scots pine sapwood under quasi-static load. Polymer Degradation and Stability, 147(7), 197–205. [Google Scholar]
Cite This Article
 Copyright © 2023 The Author(s). Published by Tech Science Press.
This work is licensed under a Creative Commons Attribution 4.0 International License , which permits unrestricted use, distribution, and reproduction in any medium, provided the original work is properly cited.
 Downloads
 Citation Tools