
 Submit a Paper
 Propose a Special lssue
 Open Access
ARTICLE
Behavior of Sandwich Glued Laminated Bamboo Structures with a Core Formed by Bioplastic Fiber Using 3D Printing Technology
Department of Civil Engineering, Faculty of Engineering, King Mongkut’s University of Technology Thonburi (KMUTT), Thung Khru, Bang Mod, Bangkok, 10140, Thailand
* Corresponding Author: Tawich Pulngern. Email:
(This article belongs to the Special Issue: Advances in Eco-friendly Wood-Based Composites: Design, Manufacturing, Properties and Applications)
Journal of Renewable Materials 2025, 13(12), 2453-2478. https://doi.org/10.32604/jrm.2025.02025-0137
Received 04 July 2025; Accepted 20 October 2025; Issue published 23 December 2025
 View Full Text
 Download PDF
Abstract
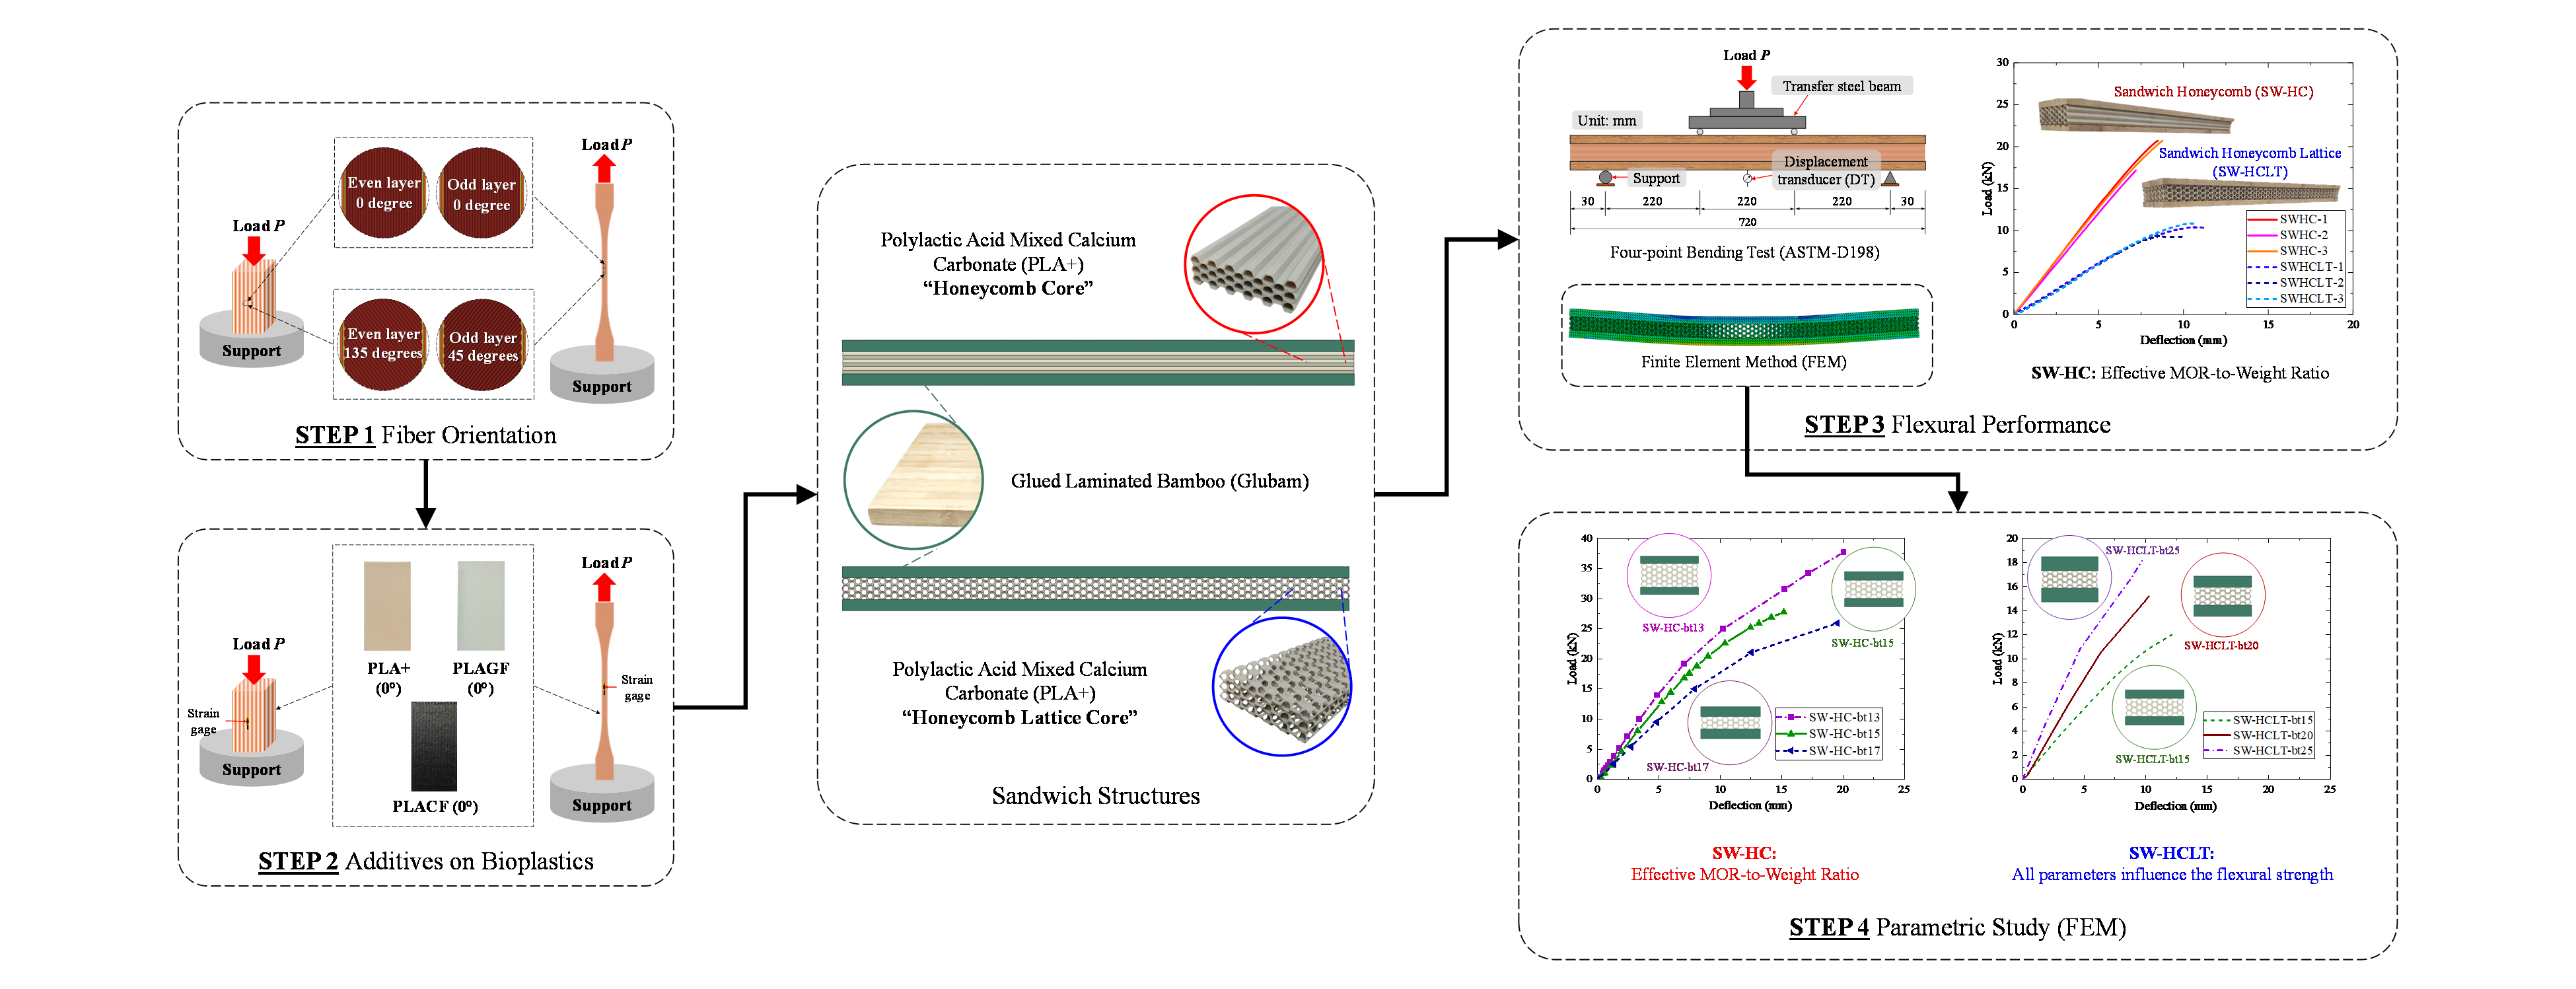
This research investigates the behavior of sandwich glued laminated bamboo (Glubam) structures with a core formed by biodegradable plastic fibers, specifically polylactic acid (PLA), fabricated using 3D printing technology. The influence of various fiber printing orientations (0° and 45/135°) on tensile and compressive properties was investigated. The experimental results indicated that polylactic acid with calcium carbonate (PLA+) printed unidirectionally and aligned with the loading direction (0°) exhibits superior tensile and compressive strengths compared to specimens printed bidirectionally at 45/135°. Furthermore, the effect of additives on bioplastics of carbon fiber (PLA-CF) and glass fiber (PLA-GF) additives in PLA-based composites was evaluated in comparison with PLA+ specimens. The finding indicated that PLA+ has a higher strength-to-cost ratio compared to PLA-CF and PLA-GF. Therefore, unidirectionally printed PLA+ was selected as the core material in two geometries: honeycomb and honeycomb lattice. These cores were sandwiched between Glubam panels on the top and bottom surfaces of the structures. Flexural performance was evaluated through four-point bending tests, which revealed that sandwich structures with a honeycomb core achieved a flexural strength-to-weight ratio 56.51% higher than those with a honeycomb lattice core. A parametric study using the finite element model was conducted to evaluate the effect of core scale, cross-sectional depth, Glubam thickness, core depth, and the number of honeycomb elements. The results showed that reducing the Glubam thickness while increasing the 3D-printed core depth significantly improved the flexural performance of honeycomb sandwich structures. Notably, reduced Glubam panel thickness coupled with increased core depth enhanced their flexural performance.Graphic Abstract
Keywords
Three-dimensional printing (3D printing) technology is a process of fabricating objects layer by layer from the bottom up, controlled by computer systems [1]. Fused Deposition Modeling (FDM) is a type of 3D printing technology that produces components by extruding melted mortar and filaments layer by layer. The advantages of FDM include ease of use, low production costs, short production times, geometric flexibility with high accuracy, and material versatility. As a result, it minimizes construction waste and reduces excessive carbon dioxide emissions during the building process [2]. The application of 3D printing technology in Industry 4.0 emphasizes machine-to-machine communication through the Internet of Things (IoT), reducing human intervention and fostering an integrated industrial ecosystem that connects employees, machinery, suppliers, and end-users [3]. A notable example is the 3D-printed office building in Dubai, where fabrication of main components and on-site installation were completed in 19 days, reducing labor costs by about 65% and construction waste by 45% [4]. In structural applications, polylactic acid (PLA), acrylonitrile butadiene styrene (ABS), and Nylon are among the most used plastics due to their high mechanical strength and load resistance [5,6]. Consequently, it has become widely adopted in industrial applications and remains one of the most prevalent 3D printing technologies today.
Several researchers have continued to study the mechanical properties of composite materials fabricated by various types of plastic fibers using 3D printing technology. Cojocaru et al. [7] reviewed the influence of the process parameters of 3D printing using PLA in additive manufacturing, particularly by fused filament fabrication (FFF). The effects of layer thickness, printing speed, print head and build plate temperatures, printing orientation, model placement angle, and filament alignment relative to the loading direction on the mechanical properties of biodegradable PLA fibers were evaluated. In 2023, Kopar and Yildiz [8] studied the mechanical properties of 3D-printed filament made from PLA, ABS, and polyethylene terephthalate glycol (PETG) materials with different fiber printing orientations. The findings indicated that PLA specimens printed bidirectionally at 45° enhanced the maximum tensile and compressive strength, whereas 3D-printed filament with 0/90° direction using ABS materials demonstrated better performance in resisting the flexural loading. Marsavina et al. [9] investigated the effects of 3D printing parameters using the FDM technique on the tensile and fracture properties of PLA specimens. The results showed that build orientation had a significant impact on mechanical behavior, with fibers aligned parallel to the loading direction (0°) exhibiting the highest tensile strength and fracture resistance compared to 45° and 90° orientations. Additionally, Cao et al. [10] investigated the effects of printing parameters and fabricating design on the mechanical properties of composite filaments and structures made from three different materials. The composite materials consist of PLA, thermoplastic polyurethane (TPU), and a mixture of PLA and TPU for extrusion additive manufacturing filaments and structures. In addition, the mechanical properties of plastic fibers, the 3D printed reinforced composite with carbon fiber and glass fiber, were also evaluated. In 2024, Essawi et al. [11] assessed the influence of carbon fiber layer position, fiber thickness, infill density, fiber printing angle, and elongation ratio on the mechanical properties of 3D printed carbon-fiber reinforced nylon composites. The finding revealed that the fiber printing angle parameter had a significant effect on the mechanical properties of 3D-printed carbon-fiber-reinforced specimens. However, the environmental concerns over petrochemical-based polymers have driven the increased use of biodegradable plastics, particularly polylactic acid (PLA), in FDM 3D printing. In industrial applications, particularly in the United States, PLA usage has grown rapidly alongside the expansion of 3D printing. PLA is favored for its eco-friendly nature, low melting point, renewable origins, smooth finish, wide color range, and ease of processing, while also generating a relatively small carbon footprint [7,12].
The application of 3D printing technology in hollow section structures has been studied and presented in previous research. In 2017, the flexural performance of a sandwich composite structure made from carbon fiber reinforced polymer with 3D-printed core materials was investigated by Li and Wang [13]. The 3D-printed core of the sandwich structure was fabricated with various geometries, including truss, honeycomb, and eccentric honeycomb, which were examined under a three-point bending test. The results demonstrated that core geometry significantly influenced flexural performance, with the truss core providing the greatest enhancement in flexural properties. Furthermore, the experimental results from the three-point bending tests revealed good agreement with the numerical simulations in terms of both flexural strength and stiffness. This study is also consistent with the work of Zarna et al. [14], who investigated the flexural properties of wood fiber/PLA biocomposite panels using both experimental and numerical methods. Five different cell configurations of wood fiber/PLA biocomposites were fabricated using a 3D printing technique, including hexagonal honeycomb, square, triangular, circular-cored hexagonal, and circular-cored square. Numerical simulations were conducted to provide a tool for optimizing these panel structures for future design and performance requirements. At the same time, Sarvestani et al. [15] investigated the energy absorption and structural performance of auxetic sandwich panels assembled from 3D-printed polymeric specimens under low-velocity impact conditions. While their work was similar to that of Li and Wang [13], it focused on performance under static flexural load. The sandwich panels were assessed for their structural performance in both parallel and perpendicular directions across the cross-section of the panels. The results indicate that the auxetic sandwich panel is well-suited for energy absorption applications, offering high absorption capacity and minimal force transfer from the 3D-printed panel. At the same time, Shah et al. [16] studied the bending performance of hybrid and regular sandwich composite structures with various geometric cores and material types using the FFF technique and vacuum-assisted infusion processes. Carbon fiber-reinforced polymer (CFRP) and glass fiber-reinforced polymer (GFRP) materials were used to manufacture sandwich panels using 3D printing and a vacuum-assisted resin infusion process. The study by Brejcha et al. [17] on the bending strength of sandwich structures found that those with 3D-printed cores exhibited comparable performance to structures with foam and balsa cores. Fabricating the core using. The use of 3D printing for core fabrication offers enhanced design flexibility in terms of geometry, density, and internal architecture, allowing more precise customization to meet specific application requirements than with foam core materials.
There remains a considerable gap in current research regarding the mechanical behavior and flexural performance of sandwich structures produced through 3D printing techniques. In particular, the integration of natural wood and biodegradable PLA in 3D-printed hollow composite sandwich panels has rarely been investigated in terms of their flexural behavior. Wood is a renewable material that offers several advantages, including light weight, a high strength-to-weight ratio, ease of fabrication, and excellent sound and thermal insulation properties [18–20]. Bamboo has gained attention as a sustainable natural resource due to its rapid growth, renewability, biodegradability, relatively high strength-to-weight ratio, and environmental benefits [21–23]. Bamboo is an exceptionally diverse plant that easily adapts to a wide range of climatic and soil conditions. Its stems are typically hard and robust, allowing the plant to withstand and recover from severe environmental disturbances and physical damage, which benefits local farmers to process it into a variety of value-added products. However, the natural variability and irregularity in the physical dimensions of bamboo limit its direct structural application, thereby necessitating the use of the glued-laminated technique with adhesives to produce glued-laminated bamboo (Glubam). This technique involves splitting bamboo into strips and laminating them using adhesives and synthetic resins. The process enhances dimensional stability, improves resistance to insect infestation, and increases durability under varying environmental conditions. At the industrial scale, bamboo is processed into engineered bamboo composites to standardize dimensions and reduce variability in material properties, addressing the growing demand for sustainable building materials [24,25].
Nevertheless, research on the combination of Glubam and 3D-printed composites with biodegradable plastic fibers for the development of sandwich structures under static flexural loading remains limited. To address this gap, the flexural behavior and variations in core geometry of such sandwich structures have been examined to evaluate their structural performance. This study aims to investigate the mechanical properties of PLA filaments in 3D printing with different fiber orientations (0° and 45/135°), focusing particularly on tensile and compressive strength. The influence of various additives in PLA-based composites, including polylactic acid with calcium carbonate (PLA+), PLA reinforced with carbon fiber (PLA-CF), and PLA reinforced with glass fiber (PLA-GF), was investigated to determine the most suitable bioplastic material offering an optimal strength-to-cost ratio for use as the 3D-printed core in sandwich structures. Furthermore, the flexural performance of sandwich panels incorporating 3D-printed honeycomb and honeycomb lattice cores, combined with Glubam outer face sheets, was evaluated using the four-point bending method. Numerical simulations using the finite element model (FEM) were conducted to validate the experimental results and were further extended to a parametric study on the cross-section of sandwich composite structures.
2 Materials and Specimen Preparation
2.1 Biodegradable Plastic Fibers
This study investigated the mechanical properties of PLA-based composites, specifically polylactic acid with calcium carbonate, polylactic acid reinforced with glass fiber, and polylactic acid reinforced with carbon fiber. A 3D-printed specimen was prepared using the fused deposition modeling technique with the Bambu Lab X1e 3D printer. Commercially available filaments were selected based on fiber content reported in previous studies [26] to further explore their mechanical behavior and support the design and analysis of composite structures. Additionally, the initial printing parameters provided by eSun in Shenzhen City, China, such as print speed, nozzle temperature, and build plate temperature, were considered important for the suitable design of the 3D-printed core. The plastic fiber contents in PLA+, PLA-CF, and PLA-GF filaments were 5% calcium carbonate, 5% glass fiber, and 15% carbon fiber by weight, respectively, and the average filament diameter was 1.75 mm. The densities of PLA+, PLA-CF, and PLA-GF filaments were 1230, 1210, and 1300 kg/m3, respectively.
The 3D printing process begins with melting the filament in the extruder, thereby elevating the temperature of the plastic material to a semi-molten state. The nozzle subsequently extrudes the thermoplastic material in filament form onto the bed plate for the initial layer. Successive layers are then deposited on top of each other, with each layer thermally bonding to the previous one, resulting in a cohesive and structurally integrated printed specimen. The layer height for each deposited fiber strand was 0.2 mm, and a 100% infill density was applied to achieve fully solid structures.
The Glubam panels with a density of 606 kg/m3 used in this study were manufactured by Greezu in Jiangxi Province, China, and subsequently supplied by Timber Technology Development Co., Ltd., in Pathum Thani Province, Thailand. Bamboo culms aged 4–5 years were selected and cut into bamboo strips for further processing. The defibering process began by aligning the bamboo strips along the direction of the natural grain. The aligned strips were then passed through a gear-roller press to flatten them, resulting in larger bamboo sheets, depending on the intended application. Then, the bamboo sheet was dried at a high temperature to reduce the moisture content of the bamboo to below 10%. For the glue lamination process, the bamboo sheets were immersed in phenolic resin for 20–25 min to ensure adequate adhesive penetration and bonding between the bamboo fibers. Following the dipping process, the sheets were dried at a temperature of 130°C to reduce moisture and partially cure the adhesive. Subsequently, the adhesive-coated bamboo sheets were subjected to hot pressing under a uniform pressure of 4–8 MPa at a pressing rate of 1.0–2.0 mm/min and a temperature range of 120°C to 160°C. Finally, any residual adhesive was removed, and surface finishing of the laminated bamboo panels was performed to achieve the desired quality and appearance.
2.3 Sandwich Structure Fabrication and Configuration
The sandwich structure panels were fabricated with overall dimensions of 60 mm in thickness, 100 mm in width, and 720 mm in length. Each panel consists of three layers: two outer Glubam faces, each with a 15 mm thickness, and a 3D-printed composite core with a thickness of 30 mm. The material of the 3D-printed core component was selected from a PLA-based composite with various additives under tension and compression tests. Two different core configurations, honeycomb (HC) and honeycomb lattice (HCLT), were employed to fabricate the sandwich structures, both manufactured using a 3D printing process and tested under flexural loading. However, the 3D printing machine was limited to a maximum printing length of 256 mm, requiring each core to be divided into three separate segments. These segments were joined end-to-end using finger joints and bonded with cyanoacrylate adhesive to form a continuous 720 mm core, as illustrated in Fig. 1. The assembled core was then sandwiched between two Glubam panels using an epoxy resin, commercially referred to as Nitowrap encapsulation resin (Fosroc in Samut Prakan Province, Thailand), to produce the final structures: sandwich honeycomb (SW-HC) and sandwich honeycomb lattice (SW-HCLT).
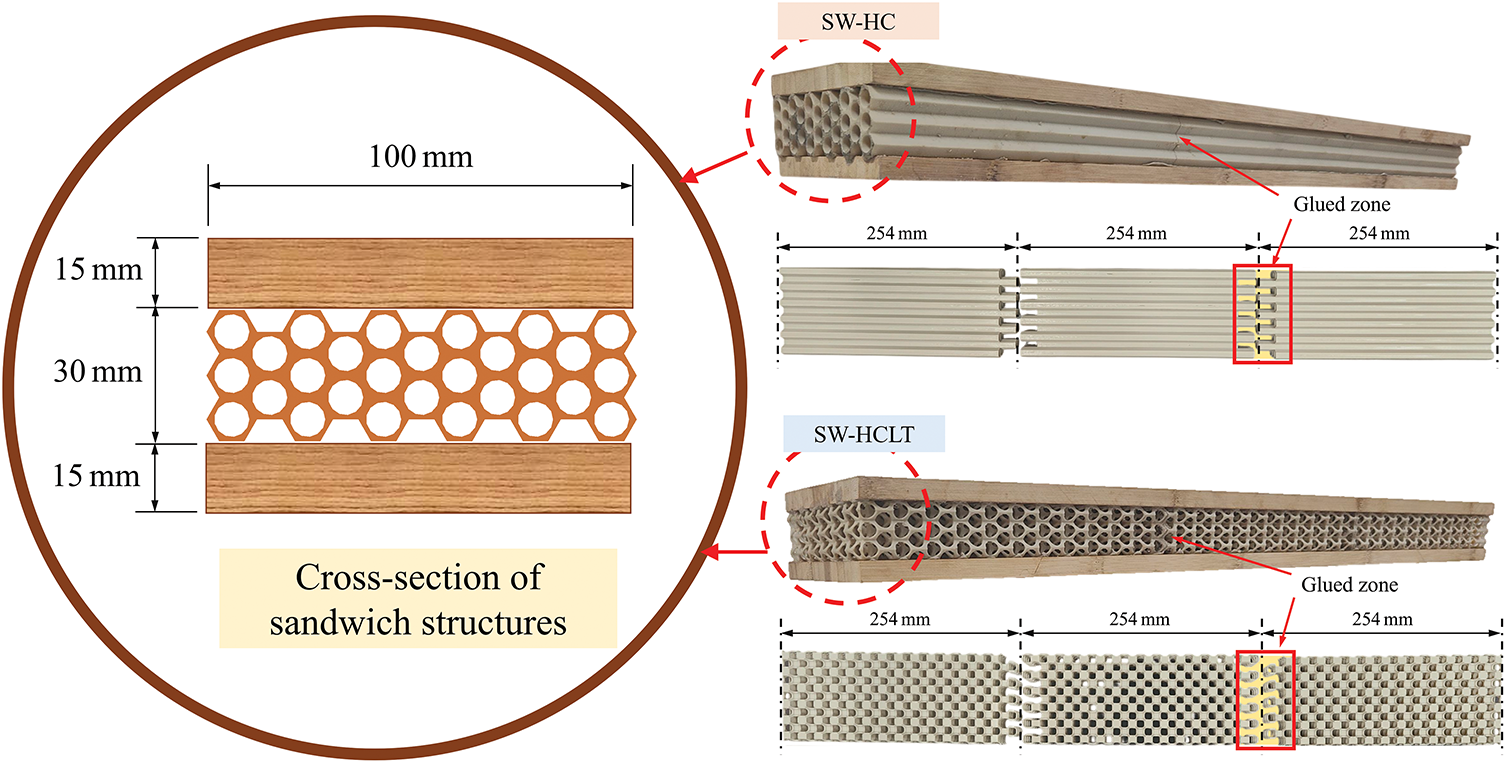
Figure 1: The details of the sandwich structure with two different 3D-printed core components
3 Experimental and Numerical Methodology
This section presents the investigation of the mechanical properties of 3D-printed PLA-based composite filaments, focusing on tensile and compressive behaviors. The flexural performance of the sandwich structure with different 3D-printed core components was also evaluated. Additionally, the finite element modeling using ABAQUS software was employed to validate the experimental results and to conduct a parametric study on the influence of core configurations.
3.1 Tension and Compression Tests
Tension tests were conducted on 3D-printed PLA-based composite filaments with two different fiber orientations of unidirectional 0° (P0-T) and bidirectional 45/135° (P45/135-T) and various additives, according to ASTM D638 standard [27]. The detailed dimensions and configuration of the dogbone-shaped tensile specimens are shown in Fig. 2a. All specimens were fabricated using a layer-by-layer 3D printing process with a layer thickness of 0.2 mm to achieve the full dogbone geometry. A strain gauge was affixed at the center of the specimen surface to monitor strain during testing. For the tensile tests, each dogbone specimen was clamped at both ends using an adjustable supporting base to ensure that axial force was applied exclusively along the fiber direction, as presented in Fig. 2b. An actuator with a maximum capacity of 50 kN was employed to apply for the load. The tensile load was applied parallel to the fiber orientation at a constant displacement rate of 5 mm/min until failure occurred.
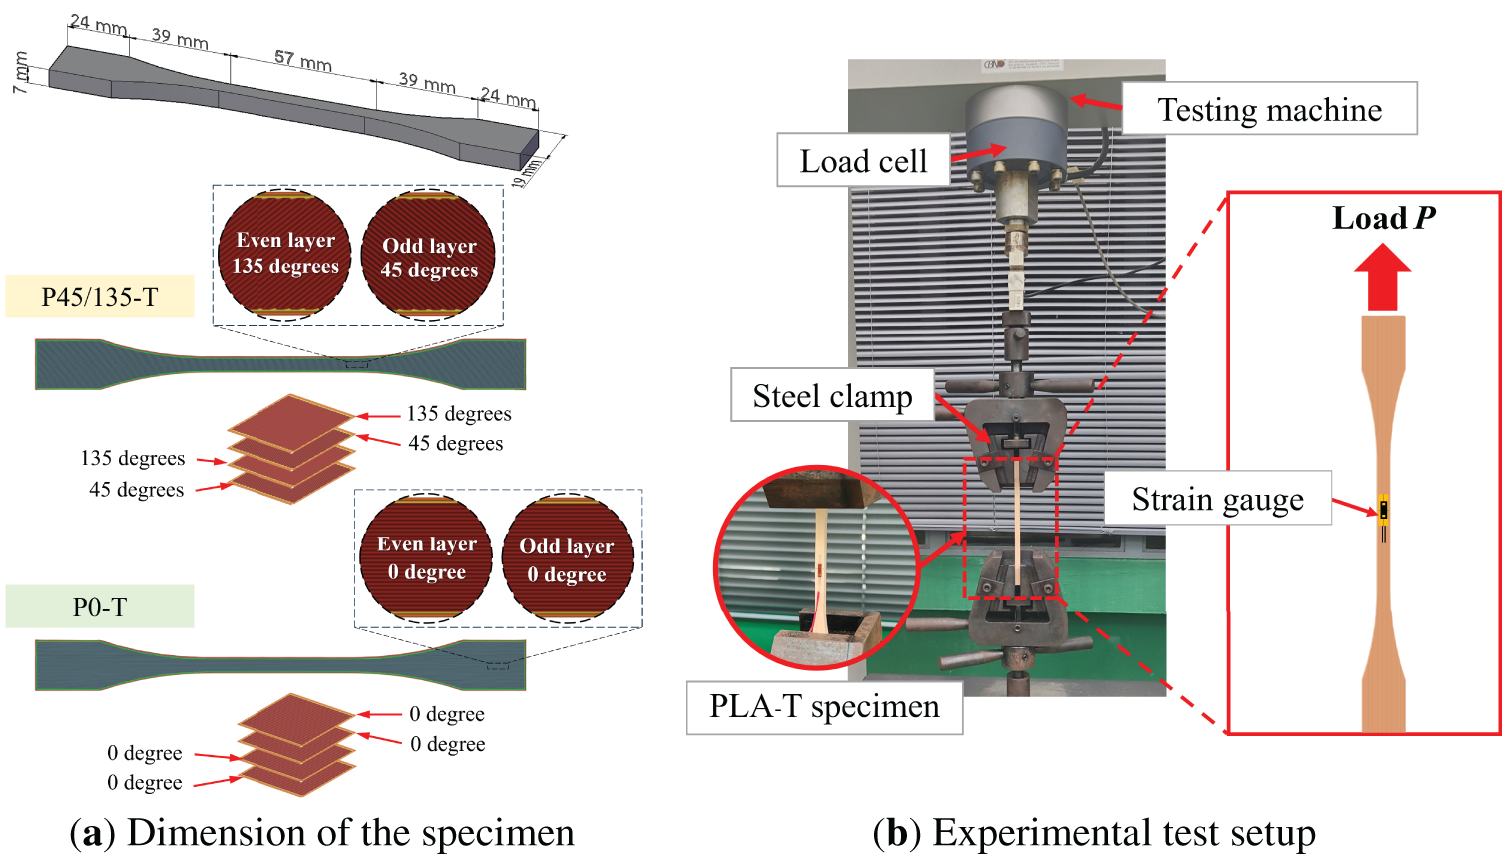
Figure 2: Tension test
Furthermore, the effects of fiber orientations for 0° (P0-C) and 45/135° (P45/135-C) and various additives in PLA-based composite filaments were examined through compression testing. The dimensions of cube-shaped specimens were 3D-printed and prepared according to the ASTM D695 standard [28], as presented in Fig. 3a. To monitor strain during testing, a strain gauge was attached at the midpoint of the specimen surface. The specimen was then placed centrally on a ball support, and a compressive load was applied to its top surface at a rate of 5 mm/min until failure occurred, as shown in Fig. 3b. During testing, force and displacement data were recorded, and the relationship between these parameters was analyzed. Five individual specimens were tested under both tension and compression for each printing orientation and type of additive used in the PLA-based composite.
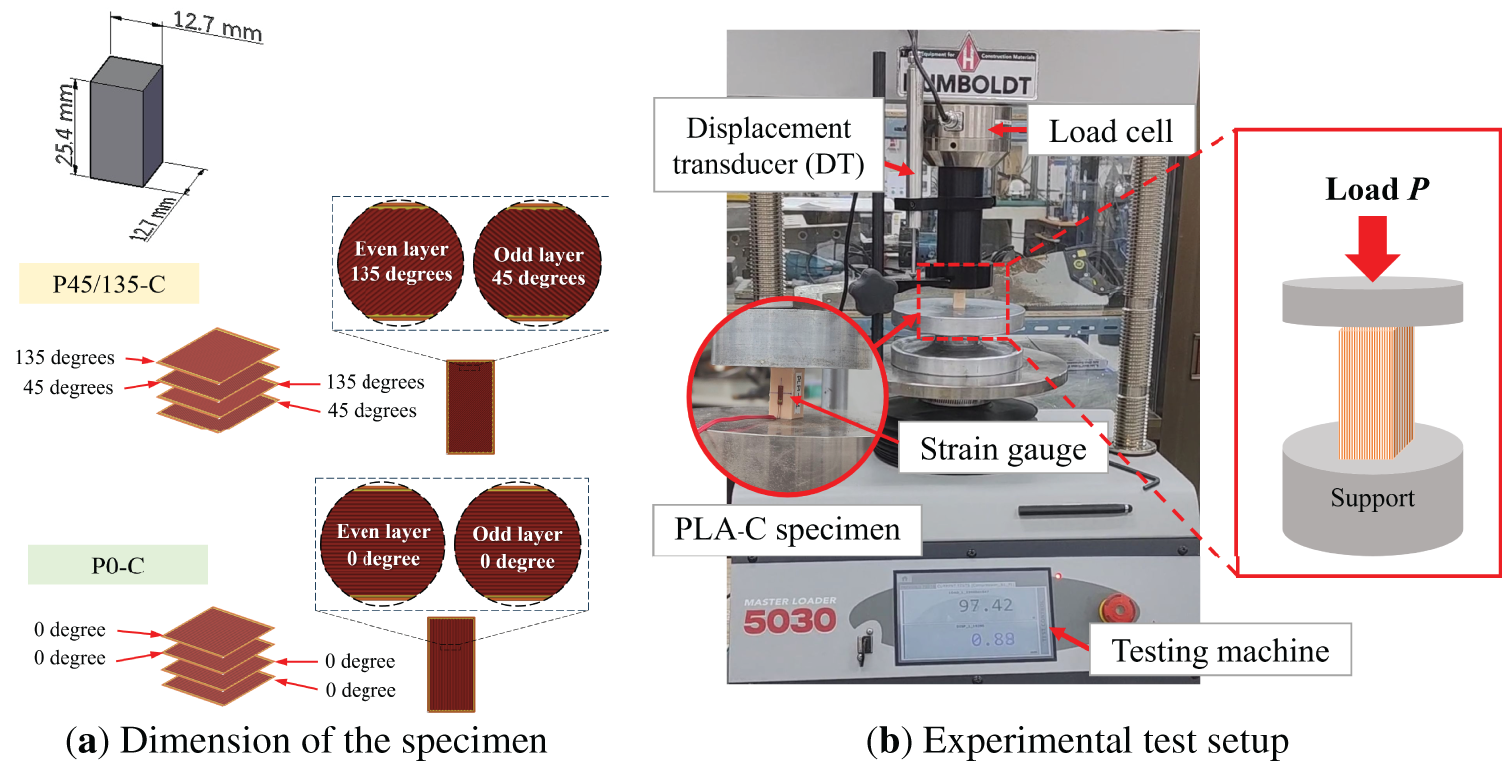
Figure 3: Compression test
The four-point bending method was employed to investigate the flexural properties under static loading following the ASTM D198 standard [29]. The sandwich structure had a cross-section of 60 mm in thickness and 100 mm in width, consisting of two Glubam panels, each 15 mm in thickness, and a 3D-printed core component, 30 mm in thickness. The total length of the specimen was 720 mm, resulting in a span-to-depth ratio of 11. Fig. 4 illustrates the flexural test setup of the sandwich specimen, which was installed between two supports with a span distance of 660 mm. The load was applied to the specimen through transfer steel beams at positions of L/3 and 2L/3, where L represents the span length. A displacement transducer (DT) was positioned at the mid-span to measure deflection, and it was connected to a data logger for continuous data recording. The load was applied using a universal testing machine (UH-F 100kNx) with a maximum capacity of 1000 kN, which transferred the force to the specimen through the steel beams. Three individual specimens were tested under flexural loading, with different 3D-printed core components.
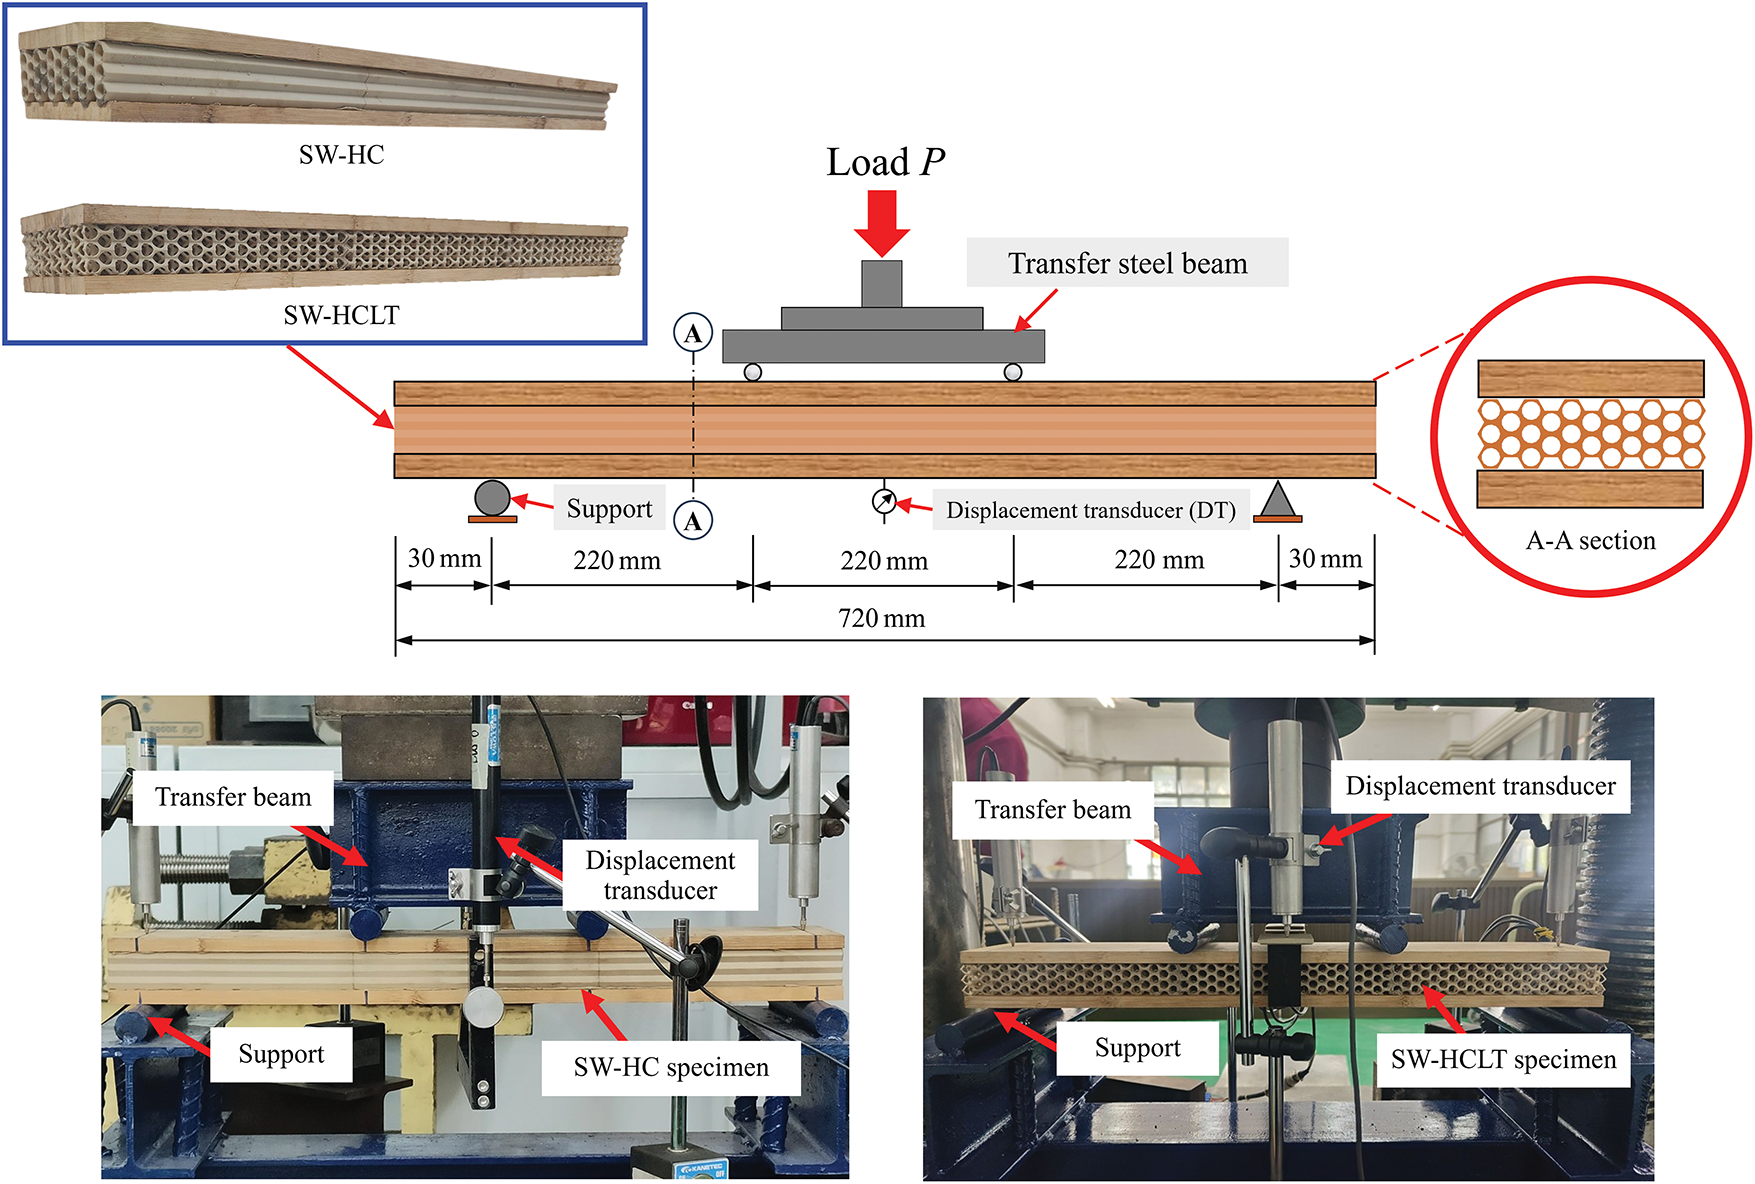
Figure 4: The flexural test setup with the four-point bending method for the sandwich structure
3.3 Finite Element Model Simulation
The finite element modeling of sandwich structures with various cross-sectional configurations was conducted using ABAQUS software to investigate the influence of geometric parameters on flexural performance. The simulation results, including load–displacement behavior, deformation, strain, and stress distributions, were compared with experimental data to validate the accuracy of the FEM results. Additionally, a mesh sensitivity analysis was performed to evaluate the impact of element size and type on the simulation outcomes. For the SW-HC specimens, linear tetrahedral elements with an approximate global mesh size of 4.5 mm were utilized, along with linear hexahedral elements with mesh sizes of 2.0, 2.5, 3.0, and 3.5 mm for mesh sensitivity analysis. In the case of the SW-HCLT model, linear tetrahedral elements were employed with mesh sizes of 3.0, 3.5, 4.0, and 4.5 mm. To replicate the experimental support conditions, steel rods were incorporated into the FEM, ensuring consistency in boundary representation. Contact interactions between the steel supports and Glubam panel surfaces were defined using a hard contact formulation in the normal direction and a frictionless sliding assumption in the tangential direction, representing the interaction between dissimilar materials. Boundary conditions were applied at the base of the specimens to restrict out-of-plane displacements at two support points. Interface conditions between PLA-to-PLA and PLA-to-Glubam layers were assumed to be perfectly bonded and were modeled as continuous material domains along the specimen length. Consistent with previous studies [30,31], the sandwich panel models were simulated under the assumption of perfect bonding. The FEM results, based on this assumption, showed good agreement with the experimental load–deflection response, confirming the reliability of the numerical model and demonstrating that the adhesive provided durable bonding between structural components without delamination. Furthermore, the uniaxial tensile and compressive strengths of PLA, selected based on cost-effective considerations, were characterized through laboratory testing and used as input parameters for material modeling. The mechanical properties of Glubam were obtained from uniaxial tension and compression tests, with specimen preparation and testing procedures following ASTM D143 [32]. The material behavior was simulated using a low-density foam strain energy function, assuming linear elastic behavior. A displacement-controlled loading condition was applied under a static general step in the FEM simulations to replicate the experimental loading scenario.
4.1 The Tension and Compression Properties of 3D-Printed PLA
The effects of fiber orientations on the tension and compression properties were investigated to determine the optimal orientation for fabricating specimens using PLA-based composite filaments with various additives. The various PLA-based composites including PLA with calcium carbonate, polylactic acid reinforced with glass fiber, and polylactic acid reinforced with carbon fiber were denoted as PLA+, PLA-GF, and PLA-CF, respectively. Tensile strength, compressive strength, and modulus of elasticity of the 3D-printed specimens were obtained through experimental testing to support both material selection and FEM simulations. Additionally, the characteristics of the failure of specimens subjected to tension and compression loading are discussed in this section.
4.1.1 Influences of Different Fiber Orientations
The tension and compression properties of 3D-printed specimens with different fiber orientations were evaluated in terms of ultimate load, ultimate strength, and failure characteristics. The ultimate tensile strengths of P0-T and P45/135-T specimens were 46.11 and 37.85 MPa, respectively, while the compressive strengths of P0-C and P45/135-C specimens were 69.47 and 60.57 MPa, respectively. The experiment results showed that the 3D-printed specimens with unidirectional fiber orientations of 0° exhibited higher tensile and compressive strengths of 21.83% and 14.69%, respectively, compared to the 3D-printed specimens with bidirectional fiber orientations of 45/135°. The effects of fiber orientations observed in these findings align with the trends reported in previous research [10], which investigated the influence of various fiber angles (0°, 45°, and 90°) and infill densities (30%, 40%, 50%, 60%, 70%, and 80%) on the tensile behavior of 3D-printed specimens. Additionally, the results in this study are consistent with the findings of Cojocaru et al. [7], who reported that unidirectional fiber orientation at 0 degrees exhibits significantly higher tensile strength compared to fiber orientations at 45/135 degrees. In the present study, variations in fiber angles significantly affected tensile strength, with specimens printed at a unidirectional 0° fiber angle demonstrating enhanced tensile strength compared to those at 45° and 90° orientations. The failure mechanisms of 3D-printed specimens with different fiber orientations influenced the behavior of specimens under tension tests. Qadyani et al. [33] further demonstrated, through scanning electron microscopy (SEM), that specimens with a 0° fiber orientation predominantly failed by bending, with strands fracturing parallel to the specimen width, indicating negligible shear effects. In contrast, specimens printed at 45°/135° orientations exhibited pronounced surface cracking and localized material damage. The absence of strand bridging in these orientations suggests weaker interlayer bonding and a greater susceptibility to failure, which is also evident in the 90° orientation.
The load-displacement relationships of specimens under tension and compression tests are presented in Fig. 5. In the initial loading stage, a linear response was observed for both fiber orientations of 0° and 45°. After the initial linear region, the P0-T specimens exhibited a sudden decrease in load, indicating brittle failure. In contrast, the P45/135-T specimens showed a more gradual reduction in load until failure, as illustrated in Fig. 5a. The failure characteristic of specimens with fiber orientations of 0° and 45/135° under tensile loading occurred in the narrowest width region of tensile-dogbone shape, as shown in Fig. 6a. For the compression test, the P45/135-T specimens demonstrated ductile behavior after reaching the ultimate load (indicated by red-toned lines in Fig. 5b), attributed to the deformation and expansion of the bidirectional fibers oriented at 45° and 135°. At the same time, the failure of the specimen under the compression load test showed that the compressive resistance behavior was similar to that under tensile loading. The failure was characterized by progressive buckling and crushing of the specimen, consistent with compressive failure modes in polymer composites, as illustrated in Fig. 6b. Both test specimens showed this characteristic, with visible damage developing along the fiber orientation angles specific to each configuration.
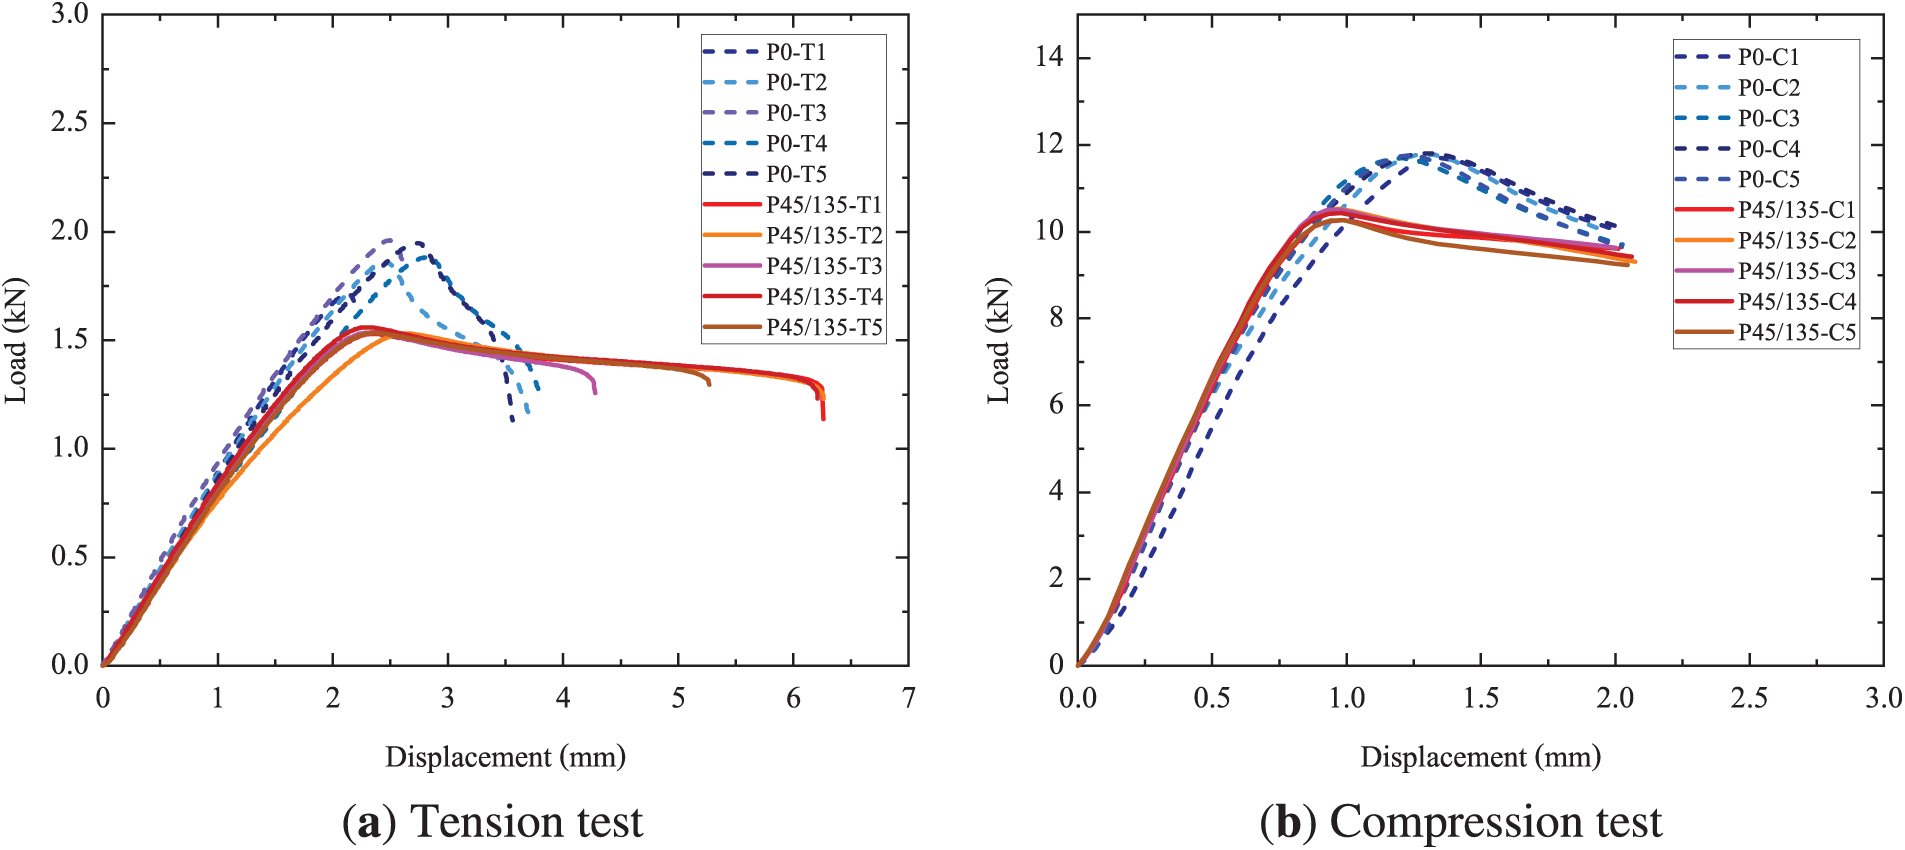
Figure 5: Load-displacement curves of 3D-printed specimens under tension and compression loads
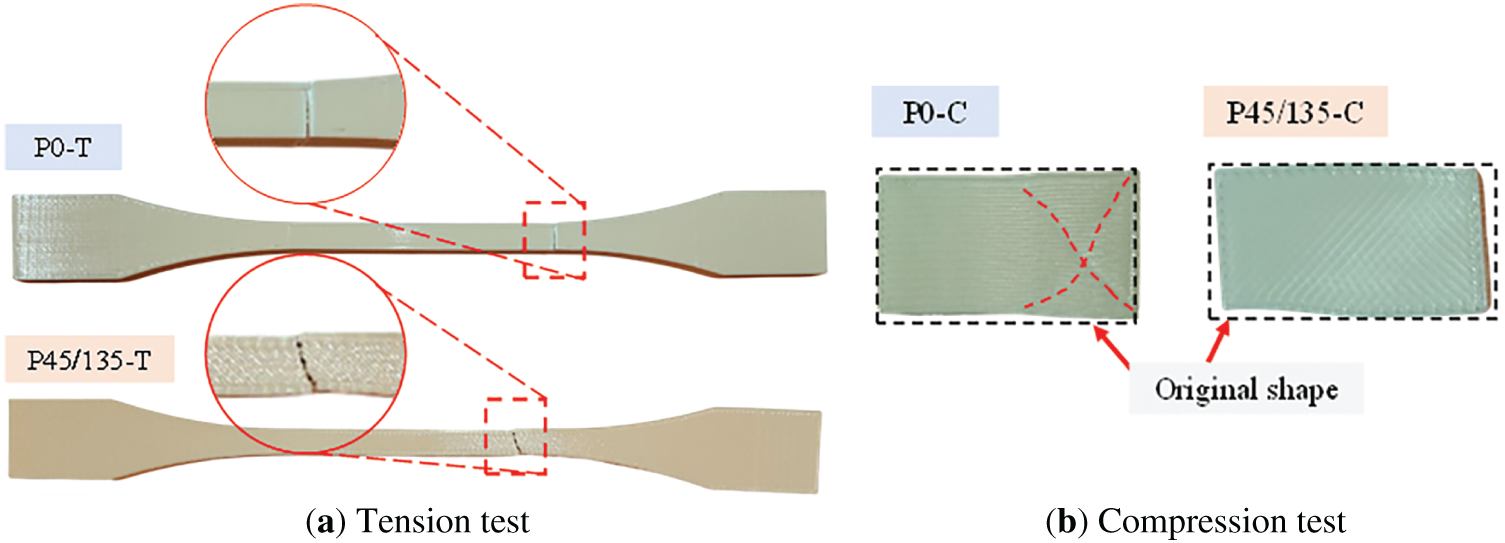
Figure 6: Failure of tensile-dogbone specimens under tension test and cube-shaped specimens under compression test
4.1.2 Effects of Various Additives on Bioplastics
Table 1 presents the ultimate strength and modulus of elasticity (MOE) of specimens subjected to tension and compression tests. The tested materials included PLA+ and two fiber-reinforced variants, namely carbon fiber (PLA-CF) and glass fiber (PLA-GF). The average tensile strengths for PLA+, PLA-CF, and PLA-GF were 45.44, 47.90, and 34.78 MPa, respectively, while their corresponding MOE values were 2650.43, 4474.11, and 2783.55 MPa. The comparison results indicate that the PLA-CF specimen exhibited slightly higher tensile strength than PLA+ by 5.41%, and significantly higher than PLA-GF by 37.72%. These findings are consistent with the results reported by Vălean et al. [26], who concluded that PLA-GF composites tend to exhibit lower tensile strength compared to other bioplastic composites. In terms of compressive performance, the PLA-CF specimens demonstrated the highest average compressive strength at 86.35 MPa, exceeding that of PLA+ by 14.39% and PLA-GF by 50.46%, respectively. The MOE of PLA+, PLA-CF, and PLA-GF specimens were 2909.64, 3163.92, and 3007.83 MPa, respectively, indicating that the different additive materials on PLA-based materials did not influence the MOE of materials under compression loads. However, microstructural analysis revealed that the PLA-GF specimen exhibits incomplete adhesion and voids within its microstructure, whereas the PLA-CF specimen displays a continuous internal structure with strong adhesion between the carbon fibers and the bioplastic [33]. As a result, the PLA-CF specimen exhibits the highest tensile and compressive strengths among the three materials. In comparison, the PLA+ specimen shows slightly lower strength but provides good cost-effectiveness in terms of the strength-to-cost ratio. On the other hand, the PLA-GF specimen may be more suitable for applications requiring ductility. The incorporation of calcium carbonate (CaCO3) into PLA enhanced its tensile strength by functioning both as a rigid filler and a heterogeneous nucleating agent, thereby promoting crystallization and increasing stiffness and tensile modulus. Furthermore, the dispersion of CaCO3 particles within the PLA matrix facilitates efficient stress transfer between the matrix and the filler, as evidenced by SEM observations. However, when the CaCO3 content exceeded 40 wt%, particle agglomeration occurred, impairing stress transfer between the polymer matrix and the filler, which consequently reduced tensile strength and elongation at break. Although an appropriate amount of CaCO3 can improve mechanical properties, SEM observations indicate that the interfacial adhesion between PLA and CaCO3 remains imperfect, contributing to the reduction in elongation at break [34]. In any case, material selection should be considered in microstructural analysis, along with life cycle assessment and environmental impact evaluation to support engineering and sustainability decision-making.
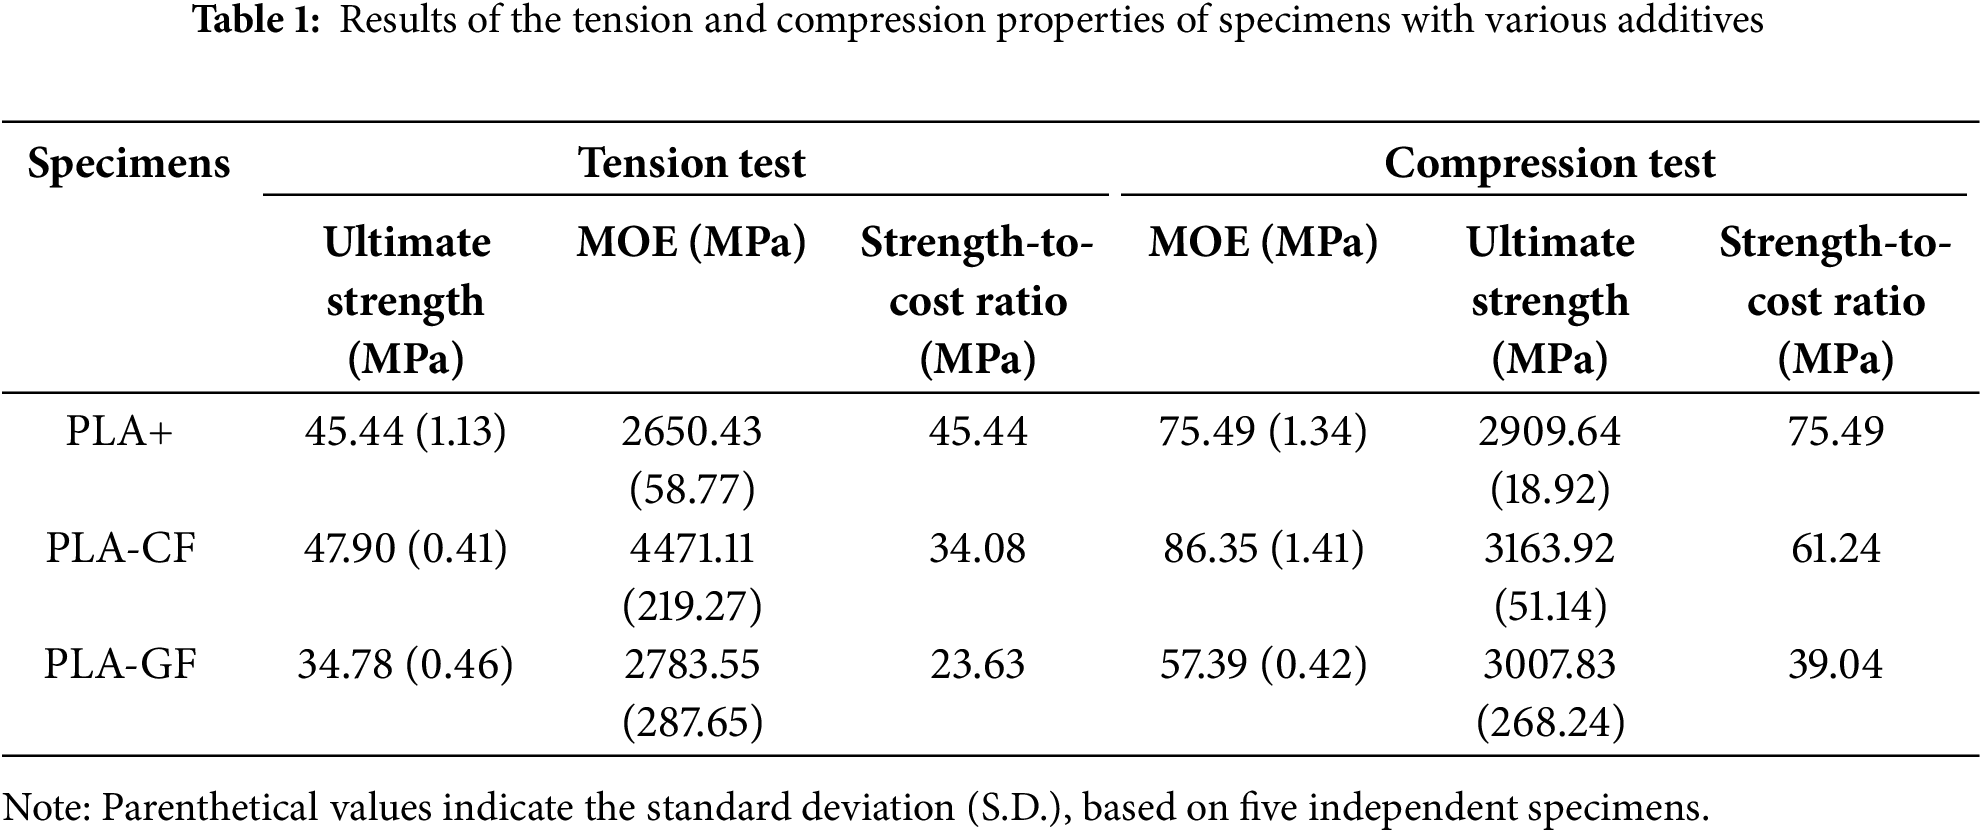
Fig. 7 illustrates the relationship between load and displacement of specimens under tension and compression tests, where the three material types represent the linear behavior in the initial loading stage. For the tension test, the load-displacement curves of specimens dropped rapidly after reaching the ultimate stress, indicating brittle failure at the narrowest cross-sectional area of the specimens, as demonstrated in Fig. 7a. However, the compressive behavior of PLA+ and PL-CF specimens exhibited limited initial deformation and showed a distinct morphological structural transition. After reaching a certain load, a rapid drop in load occurred, while the deformation gradually increased until the material could no longer resist the compressive force and ultimately failed. In contrast, the PLA-GF specimens demonstrated relatively greater deformability, with a lower slope in the initial stage and failure occurring under a lower compressive load, as shown in Fig. 7b. The failure characteristics of PLA+, PLA-CF, and PLA-GF specimens under tension and compression tests are illustrated in Fig. 8.
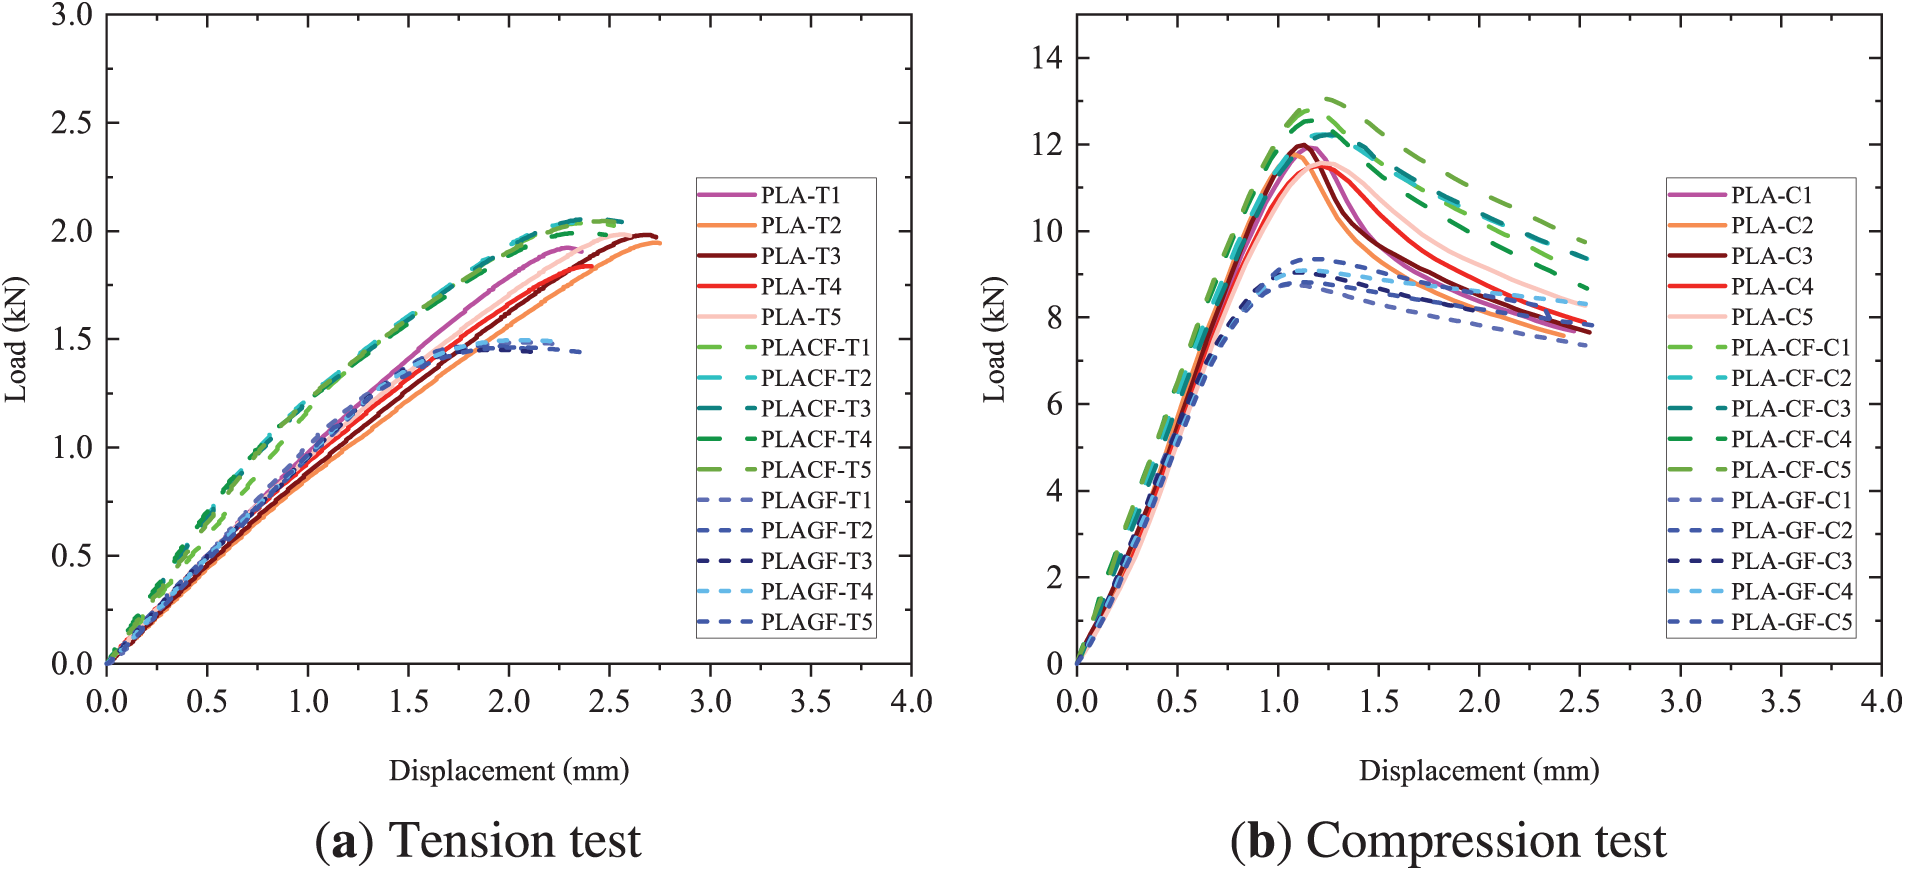
Figure 7: Load-displacement response of specimens under tension and compression tests
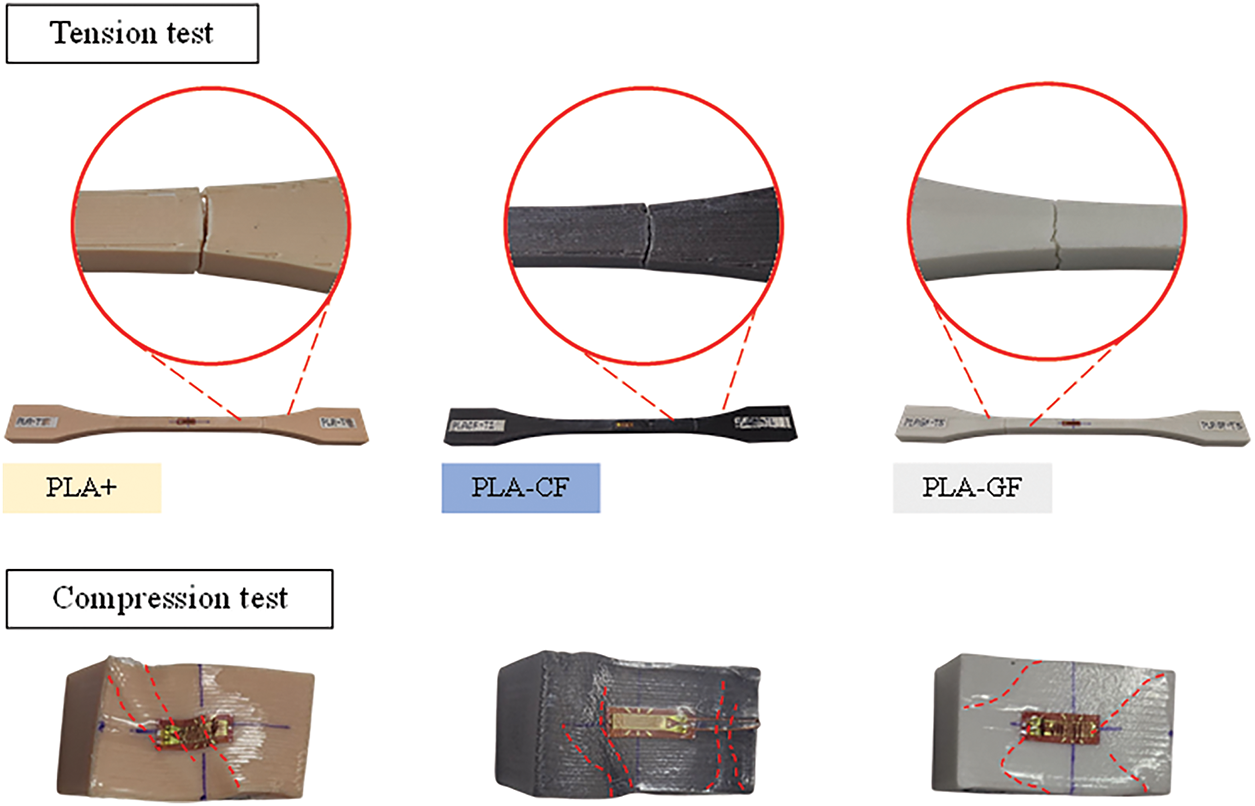
Figure 8: Failure of PLA+, PLA-CF, and PLA-GF specimens under tension and compression tests
For the consideration of the cost-effectiveness of materials, the average tensile and compressive strengths of PLA+, PLA-CF, and PLA-GF specimens were normalized by their respective raw filament costs. In the previous research, Nadir et al. [35] evaluated the flexural properties of both un-strengthened and strengthened glued laminated beams, incorporating the flexural strength-to-cost ratio into their analysis. Similarly, Mostafa et al. [36] investigated the most cost-effective printing conditions for Nylon by calculating the strength-to-cost ratio based on tensile strength, flexural strength, material cost, and printing time. In the present study, the quantity of material and printing time for all PLA specimens were kept constant across compositions; therefore, material cost was the only variable considered. The tensile and compressive strength-to-material cost values presented in Table 1 quantitatively demonstrate the economic advantage of using PLA+ for manufacturing honeycomb and honeycomb-lattice structures. The comparison results reveal that PLA+ material demonstrates the highest strength-to-cost ratio compared to PLA-CF and PLA-GF. This superior cost-efficiency can be attributed to the inclusion of calcium carbonate in the PLA+ filament, which is priced at 14.42 USD/kg, significantly less expensive than carbon fiber in PLA-CF (20.27 USD/kg) and glass fiber in PLA-GF (21.22 USD/kg) [37]. Accordingly, the cost ratios of PLA-CF to PLA+ and PLA-GF to PLA+ are 1.41 and 1.47, respectively. In addition, PLA+ exhibits sufficient load-bearing resistance, making it a suitable material for evaluating the structural performance of assembled cross-sectional components. Consequently, PLA+ was selected for the subsequent fabrication phase, with a unidirectional fiber orientation (0°) employed as the core material in both honeycomb and lattice configurations to assess the flexural performance of the sandwich structure.
4.2 Flexural Performance of the Sandwich Structures
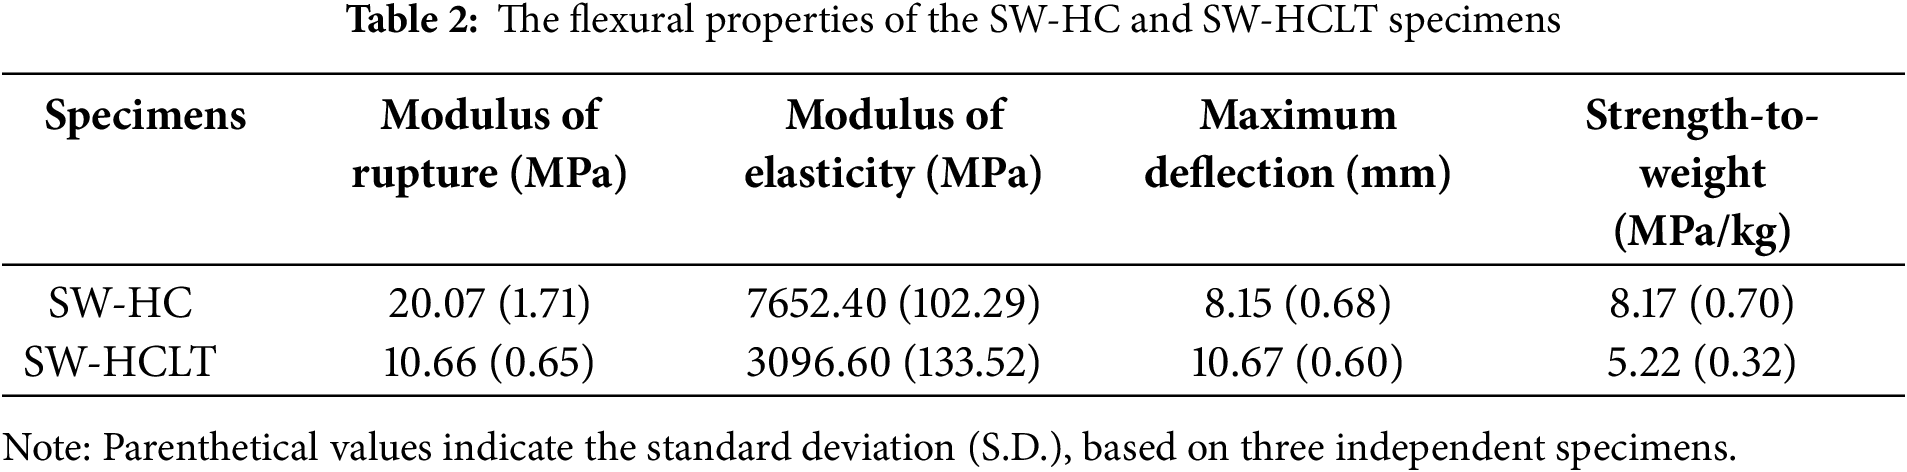
Fig. 9 presents the load–deflection behavior of both SW-HC and SW-HCLT specimens under four-point bending tests. It was observed that the SW-HC exhibited brittle behavior throughout the flexural loading and experienced sudden failure upon reaching its ultimate capacity. In contrast, the SW-HCLT specimen demonstrated an initial linear response and failed when the deflection reached approximately 10 mm. Nevertheless, the specimen exhibited ductile behavior, continuing to resist applied loads for a short duration before undergoing failure. This behavior is consistent with calculated flexural resistance based on transformed section analysis. Table 2 summarizes their flexural properties, including the modulus of rupture (MOR), modulus of elasticity (MOE), maximum deflection, and strength-to-weight ratio. The SW-HC specimen exhibited a MOR of 20.07 MPa and the MOE of 7652.40 MPa, while the SW-HCLT specimen showed a MOR of 10.66 MPa and the MOE of 3096.60 MPa. These results indicate that the SW-HC specimen achieved 88.27% higher flexural strength and 2.47 times higher MOE than the SW-HCLT specimen. As a result, the core component of the SW-HC specimen, which uses a traditional honeycomb (HC) structure, had a higher density than the honeycomb lattice (HCLT) core used in the SW-HCLT specimen. However, the weights of the SW-HC and SW-HCLT sandwich structures were 2.39 and 1.96 kg, respectively, indicating that the SW-HCLT specimen was 17.99% lighter than the SW-HC specimen. Specifically, the strength-to-weight ratio of the SW-HC was 60.00% higher than that of the SW-HCLT. This comparison highlights the superior flexural performance of the SW-HC structure, making it more efficient under flexural loading conditions. Sandwich structures with honeycomb and honeycomb lattice cores exhibit different flexural behaviors. The SW-HC specimen shows higher flexural properties, making it well-suited for load-bearing components such as floors and structural wall panels. In contrast, the SW-HCLT specimen provides higher deflection capacity and lower self-weight, which are advantageous for applications that require flexibility and energy absorption, such as partition panels or non-load-bearing elements. Nevertheless, both SW-HC and SW-HCLT specimens are generally limited to interior applications, with potential uses in exterior structural elements. Overall, the findings highlight the potential of these sandwich structures to be effectively applied in practical construction applications, based on experimental studies.
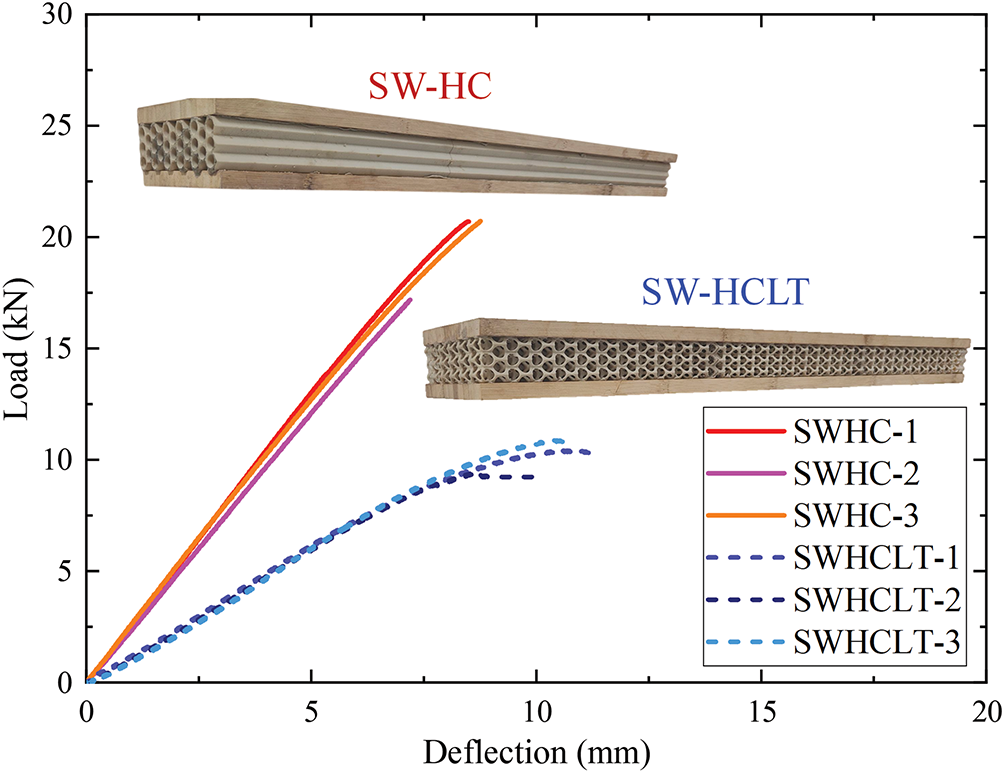
Figure 9: Load–deflection behavior of the SW-HC and SW-HCLT specimens under flexural test
The failure mechanisms for both sandwich structure types (SW-HC and SW-HCLT) were characterized by horizontal shear failure within the core components, which were fabricated from 3D-printed PLA+ composite filaments. The failure patterns in the HC and HCLT cores corresponded to the fiber orientations, exhibiting perpendicular failure and parallel to the fibers, respectively, as shown in Fig. 10. The delamination failure between the adhesive, 3D-printed core, and Glubam panels was not observed, particularly at the joints between core components. These results indicate that the adhesive provided excellent bonding performance for assembling the different materials.
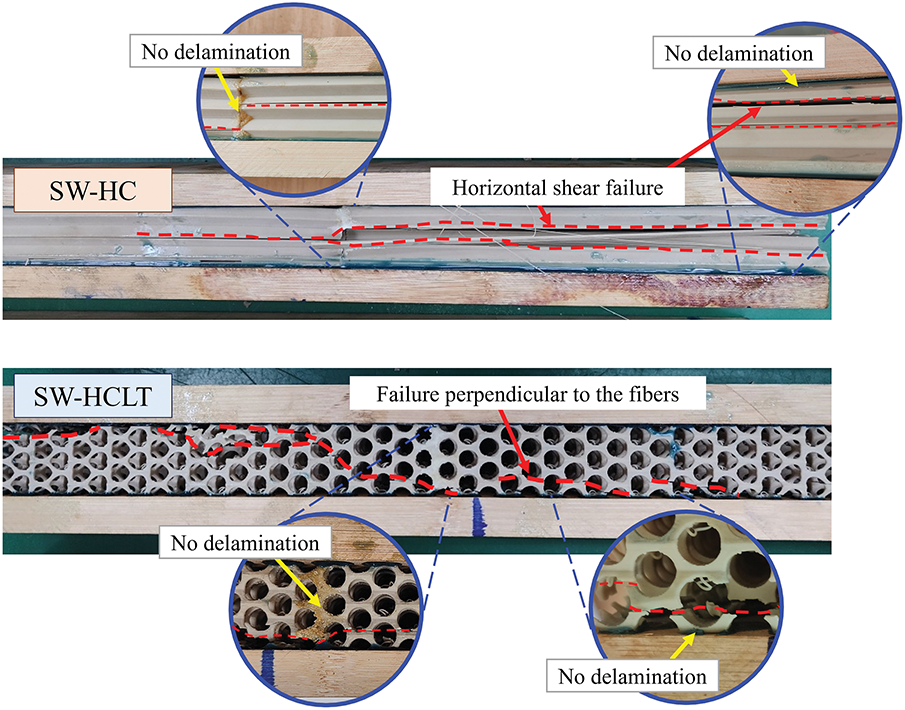
Figure 10: Failure of the sandwich structure specimens under flexural loading
The FEM simulation was developed using ABAQUS software to investigate the effects of sandwich structure geometry on 3D-printed core configurations and Glubam outer flange components. The FEM, incorporating a suitable mesh size, was validated against experimental results to ensure accuracy. Parametric studies were then conducted to evaluate the flexural behavior of SW-HC and SW-HCLT specimens across four geometric configuration cases under flexural loading.
4.3.1 Finite Element Model Validation
The comparative results between the experimental data and the FEM simulation were validated to confirm the reliability of the FEM for conducting parametric studies. A mesh sensitivity analysis was performed to evaluate the influence of mesh size on the FEM of SW-HC and SW-HCLT specimens under flexural loading. For the SW-HC model, both linear tetrahedral elements with an approximate global size of 4.5 mm and linear hexahedral elements with global sizes of 2.0, 2.5, 3.0, and 3.5 mm produced similar trends, as illustrated in Fig. 11a. For the SW-HCLT model, linear tetrahedral elements with global sizes of 3.0, 3.5, 4.0, and 4.5 mm showed comparable results, while the mesh with a global size of 2.0 mm exhibited a slight deviation, as shown in Fig. 11b. Based on these findings, suitable mesh parameters were selected for the FEM simulations of both SW-HC and SW-HCLT specimens to ensure accuracy and computational efficiency. Table 3 presents a summary of the ultimate load and flexural strength of the SW-HC and SW-HCLT specimens obtained from FEM simulations in comparison with the experimental results. The FEM simulation results showed a difference in flexural strength of 4.63% for the SW-HC specimen and 7.13% for the SW-HCLT specimen relative to the experimental values. Fig. 12 illustrates the validation results, showing good agreement between the load–deflection curves from the experimental tests and FEM simulations for both SW-HC and SW-HCLT specimens. Therefore, these results confirm that the FEM simulation approach is sufficiently accurate and can be reliably applied to parametric studies involving 3D-printed cores and Glubam panel components subjected to flexural loading. Considering the bending stress of the model, the SW-HC specimen exhibits a higher maximum bending stress than the SW-HCLT specimen, as illustrated in Fig. 13. This is due to the continuity of the honeycomb core, which has a honeycomb extruded in a single direction, allowing the stress to be distributed uniformly along its span length. In contrast, the SW-HCLT specimen features a honeycomb lattice extruded in two directions, leading to stress concentration near the hollow regions and ultimately resulting in failure.
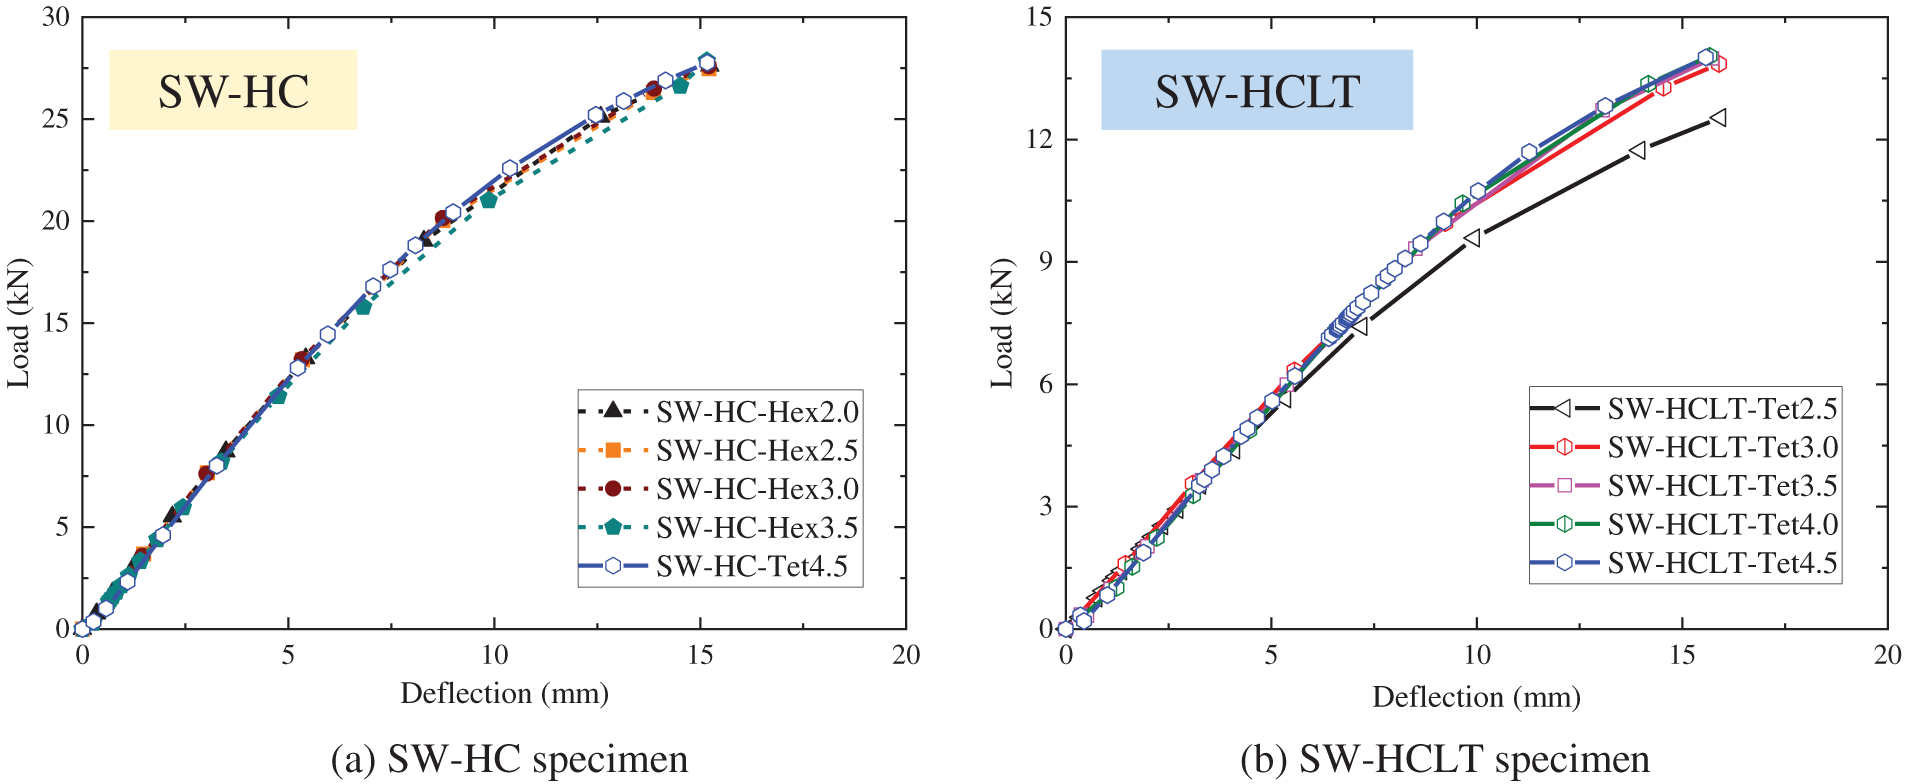
Figure 11: The mesh sensitivity analysis for the SW-HC and SW-HCLT specimens
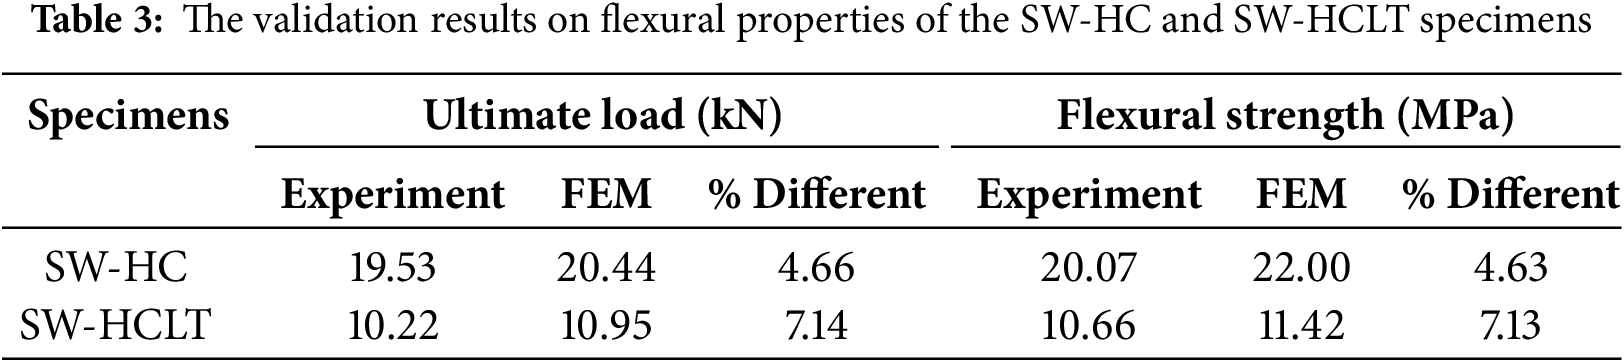
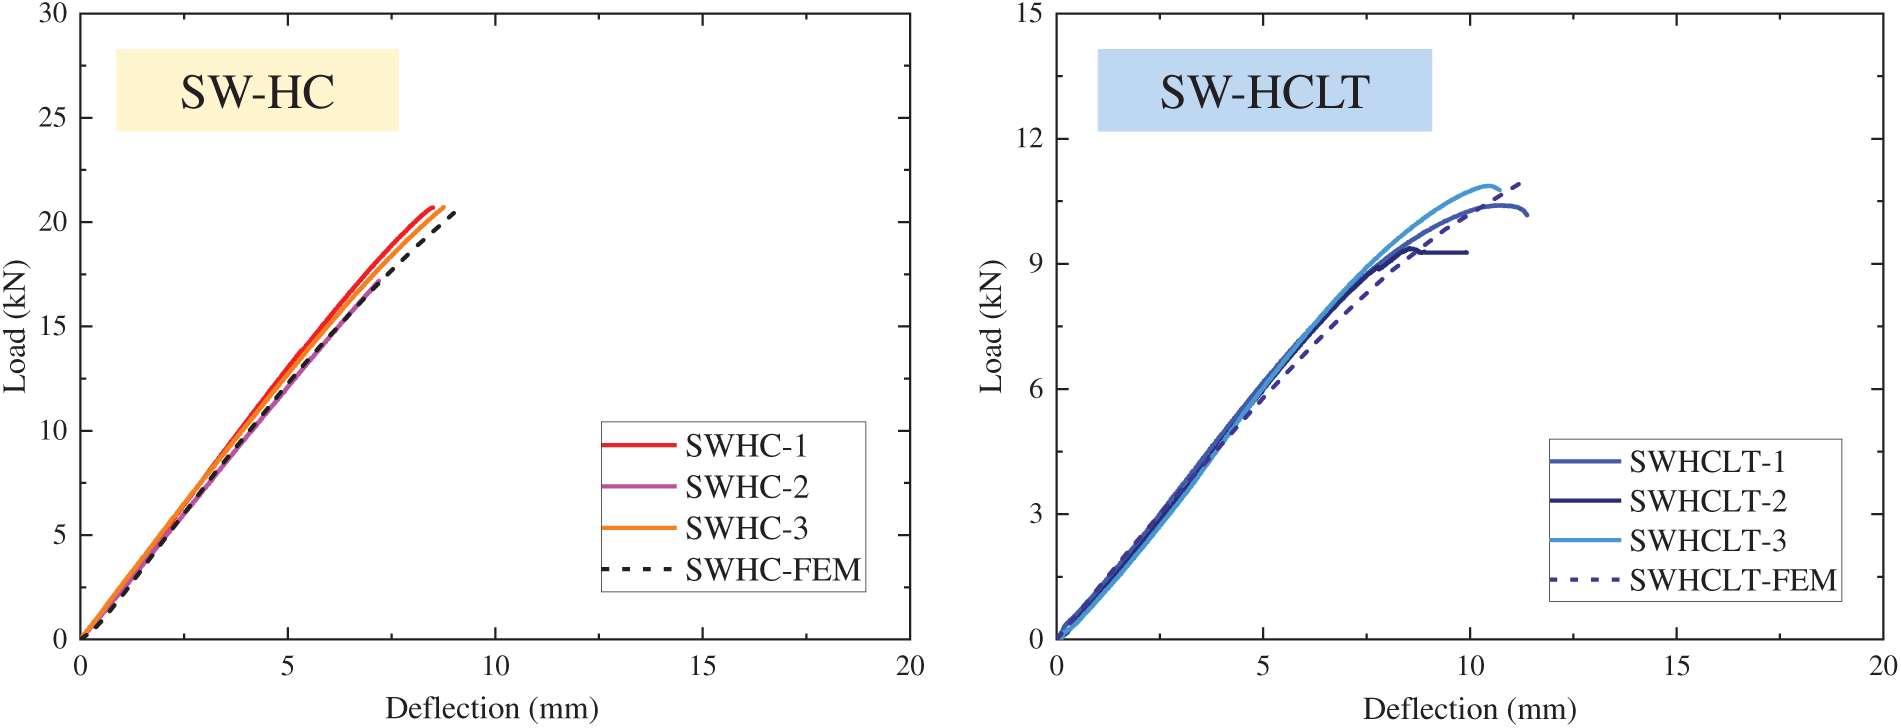
Figure 12: Load–deflection curves of the SW-HC and SW-HCLT specimens obtained from experimental testing and FEM simulation
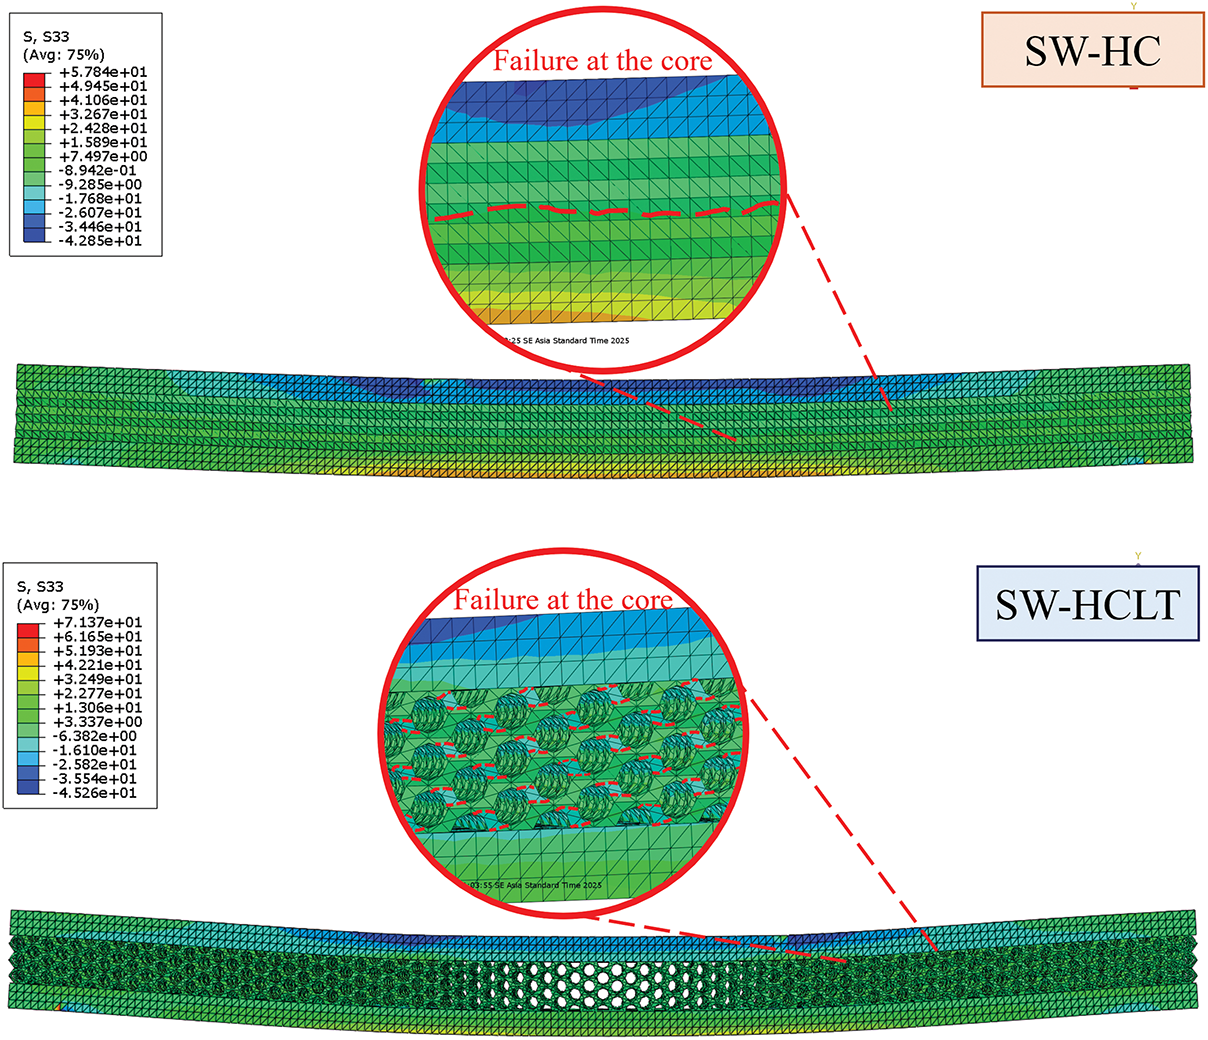
Figure 13: Bending stress of the SW-HC and SW-HCLT specimens
The cross-sectional geometries of sandwich structures were analyzed under flexural loading using FEM simulations. The investigation focused on several key parameters: (Case 1) the effect of core element scale, and (Case 2) the number of core elements in 3D-printed cores, for both SW-HC and SW-HCLT specimens. Additionally, (Case 3) the depth of the sandwich panel was examined for both SW-HC and SW-HCLT specimens. The FEM analysis results, detailing the flexural performance in terms of ultimate load and stiffness, are summarized in Table 4.
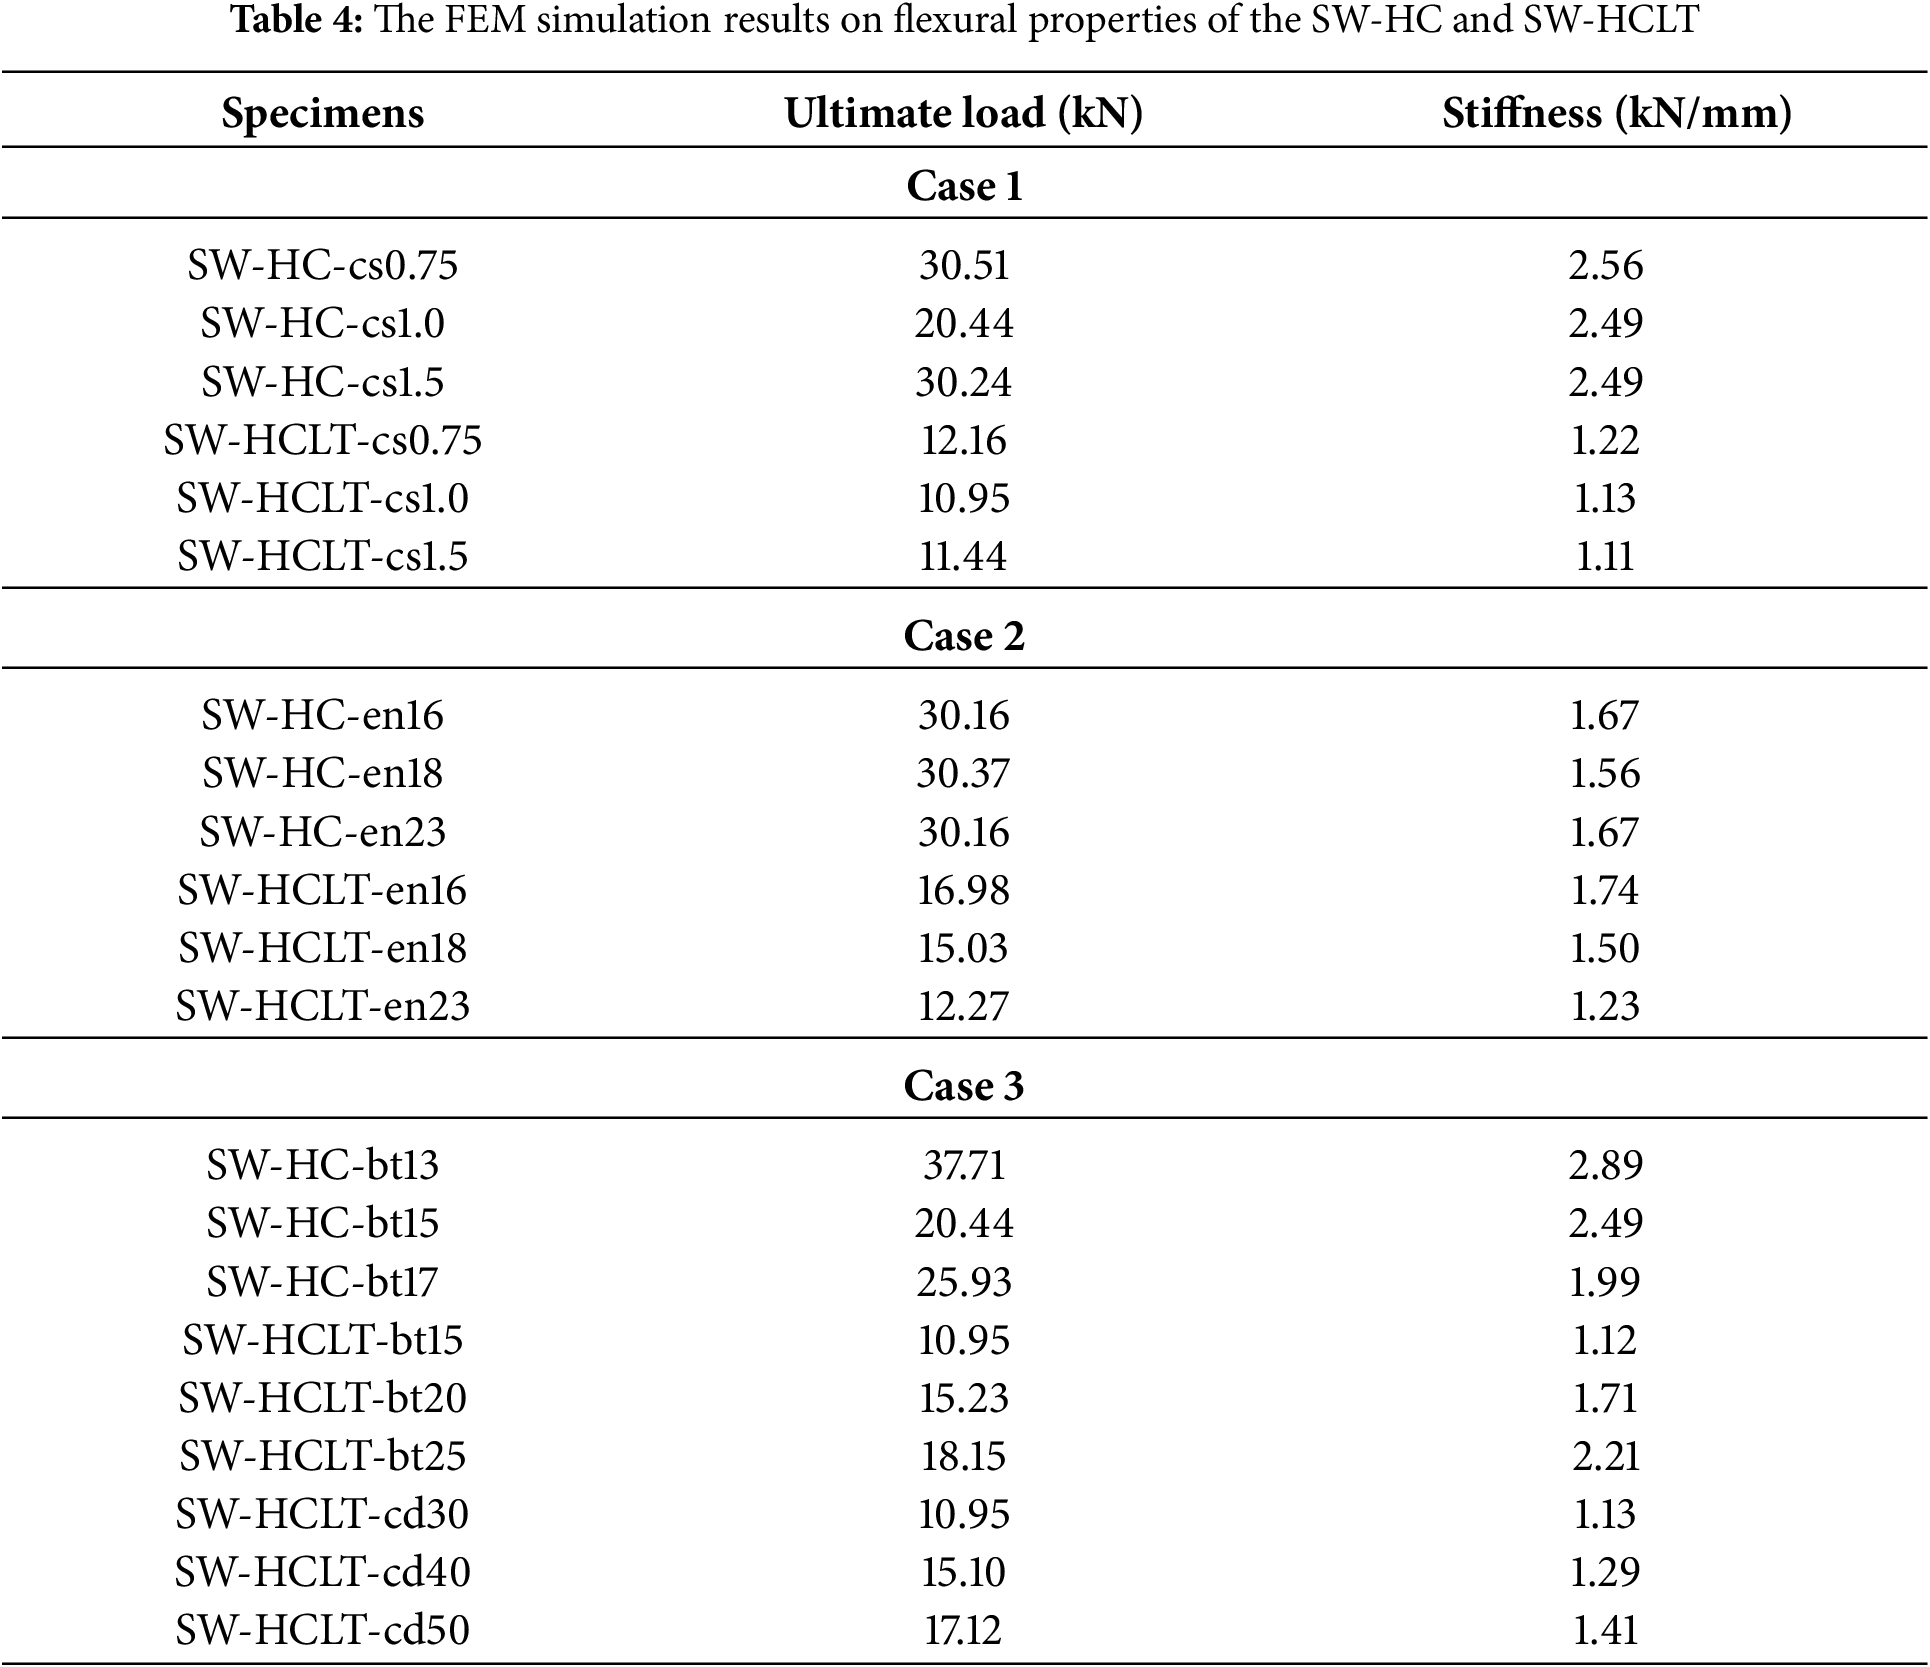
In Case 1, the core scale variations of the honeycomb core elements were achieved by resizing based on the reference model (SW-HC-FEM and SW-HCLT-FEM), which had a honeycomb element scale factor of 1.00. The size of the honeycomb core elements was reduced to 0.75 times and increased to 1.50 times, as illustrated in Fig. 14. These changes in the core element dimensions resulted in the overall core size becoming either smaller or larger than the reference core area. Therefore, it was necessary to make adjustments to the number of core elements to ensure that the honeycomb-shaped core structure remained within the boundaries of the core area while maintaining the cross-sectional symmetry. Additionally, the total cross-sectional area across all models and the thickness of the honeycomb elements were adjusted accordingly. All models of sandwich structure were designed with a constant cross-sectional depth of 60 mm. The SW-HC specimens with core element scales of 0.75 and 1.50 were denoted as SW-HC-cs0.75 and SW-HC-cs1.5, respectively, while the corresponding SW-HCLT specimens were designated as SW-HCLT-cs0.75 and SW-HCLT-cs1.5. The simulation results showed that the FEM of SW-HC-cs0.75 and SW-HC-cs1.5 exhibited similar trends in flexural performance, specifically in terms of stiffness compared to the SW-HC-cs1.0 specimen, as illustrated in Fig. 15a. As a result, the cross-sectional area and moment of inertia of the three sandwich structure configurations were comparable, resulting in no significant differences in their flexural properties.
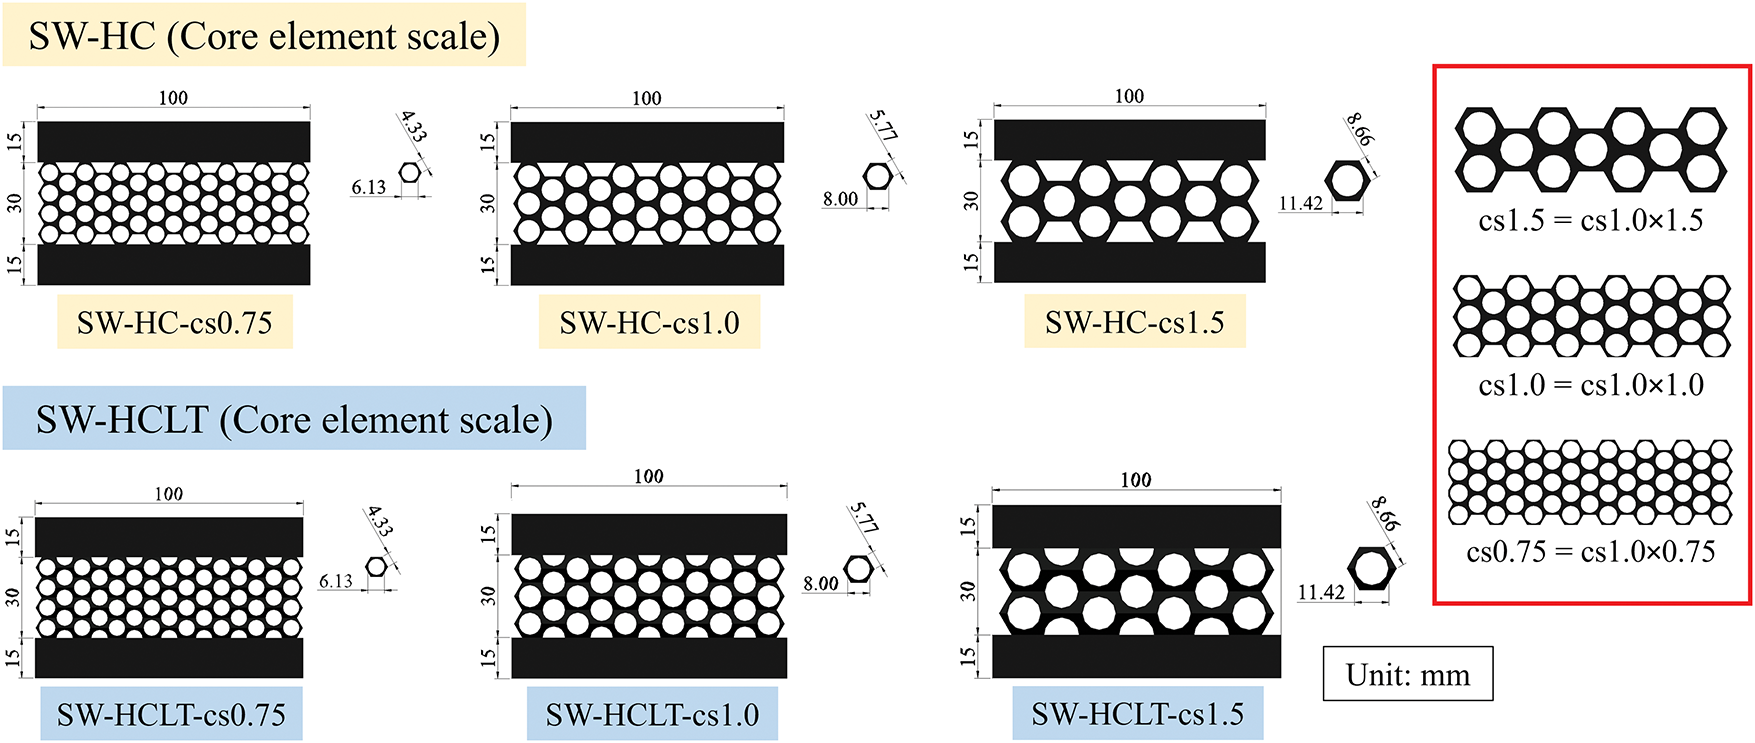
Figure 14: The configurations of the SW-HC and SW-HCLT with core element scales of 0.75, 1.0, and 1.50
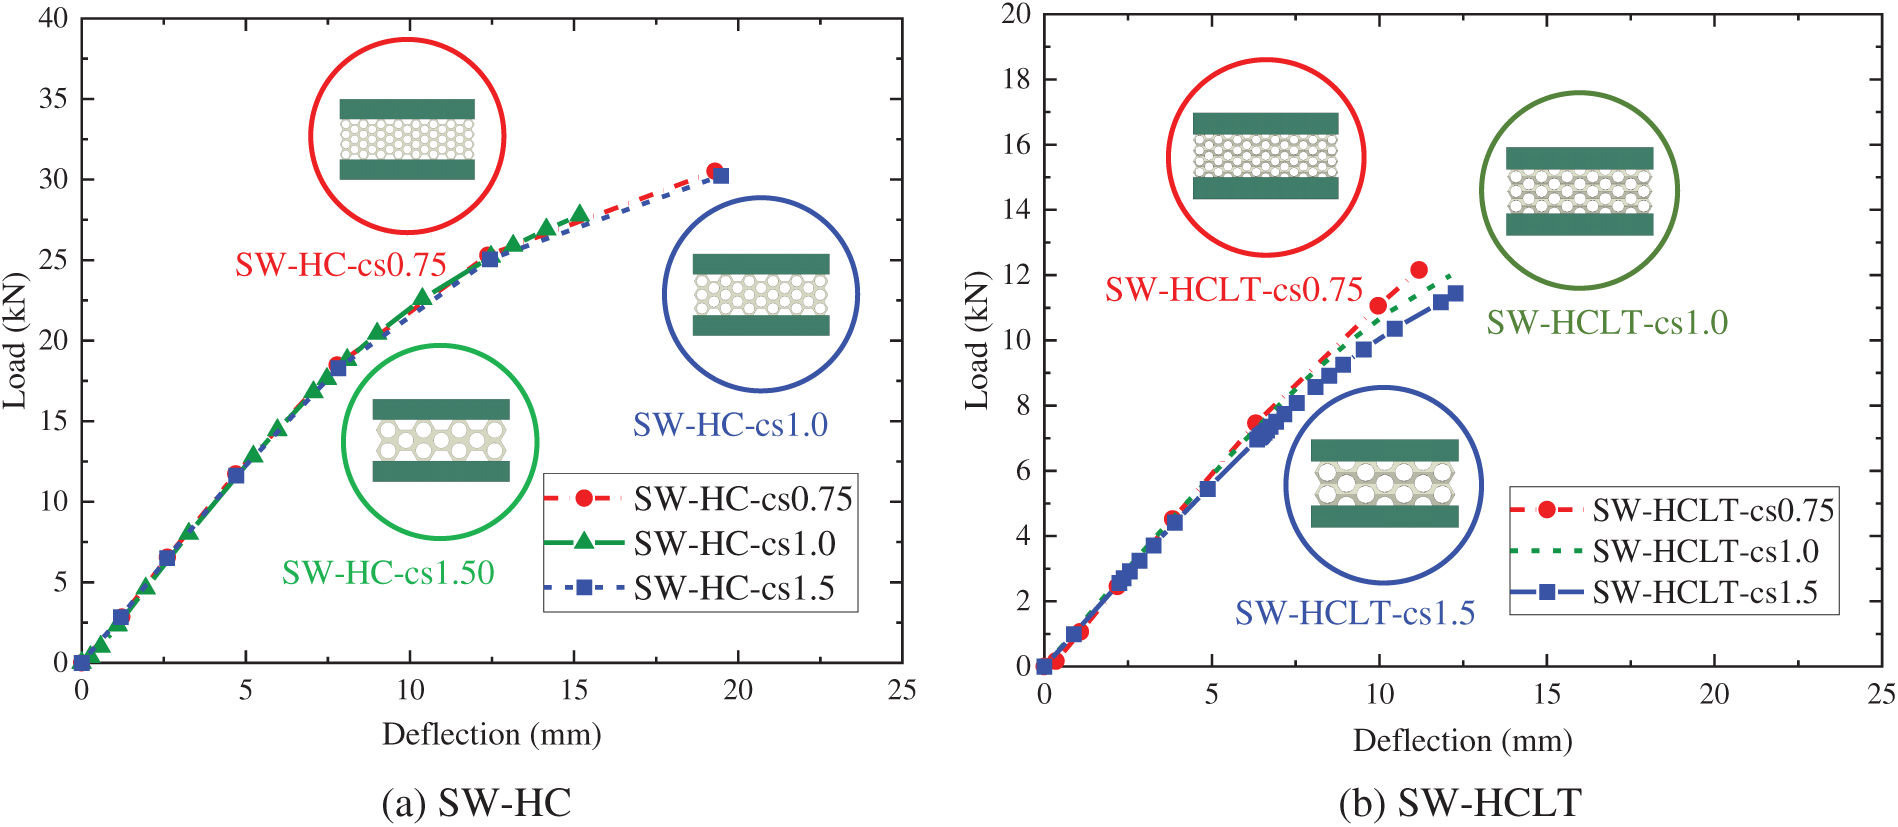
Figure 15: Load–deflection curves of the SW-HC and SW-HCLT with core element scales of 0.75, 1.0, and 1.50
In contrast, the SW-HCLT-cs0.75 model demonstrated a notably higher ultimate load than both SW-HCLT-cs1.0 and SW-HCLT-cs1.5, with increases of 11.05% and 6.29%, respectively, as shown in Fig. 15b. The stiffness of the SW-HCLT-cs0.75 model was also higher, showing increases of 7.96% and 9.91% compared to the SW-HCLT-cs1.0 and SW-HCLT-cs1.5 specimens, respectively. The observed enhancement can be attributed to the reduced scale of the core elements in the SW-HCLT model, which leads to an increase in the core density of the honeycomb lattice structure. This increase is caused by a greater overlap of the honeycomb elements, resulting in a reduction in the internal voids. As a result, the overall structure achieves more efficient load distribution and improved material continuity along the load-bearing direction, thereby enhancing its flexural resistance compared to models with larger core elements. Therefore, the variation in the scale of the core elements in the 3D printing of the SW-HCLT structure has a direct influence on its flexural resistance capacity.
In Case 2, the number of core elements in the 3D-printed components of the SW-HC and SW-HCLT specimens was varied to 16, 18, and 23 elements to evaluate flexural behavior. To accommodate these changes, the width of the 3D-printed core was reduced, and the thickness of the core elements was increased accordingly to maintain a constant cross-sectional area and overall depth, as illustrated in Fig. 16. The SW-HC specimens with 16, 18, and 23 core elements were designated as SW-HC-en16, SW-HC-en18, and SW-HC-en23, respectively. Similarly, the corresponding SW-HCLT specimens were denoted SW-HCLT-en16, SW-HCLT-en18, and SW-HCLT-en23. Fig. 17 demonstrates the load–deflection responses from the FEM simulations for SW-HC and SW-HCLT specimens with varying numbers of core elements in their 3D-printed components. The simulation findings indicated that varying the number of core elements in the SW-HC specimens had no significant effect on their ultimate load and stiffness under flexural loading conditions, as presented in Fig. 17a. Conversely, the reduction of the number of core elements in the SW-HCLT led to notable increases in both flexural ultimate load and stiffness, as shown in Fig. 17b. Specifically, the SW-HCLT-en16 specimen demonstrated the enhanced flexural performance with an ultimate load of 16.98 kN, representing increases of 12.97% and 38.39% compared to the SW-HCLT-en18 and SW-HCLT-en23 specimens, which exhibited ultimate loads of 15.02 and 12.27 kN, respectively. This improvement is attributed to the higher density of the 3D-printed core in the SW-HCLT-en16 specimen, which was fabricated using PLA+ material. The increased density of the honeycomb lattice core is achieved by increasing the thickness of each unit cell, which enhances stability and promotes a more uniform stress distribution. Consequently, stress concentrations in thinner elements of the honeycomb lattice core are reduced, thereby decreasing the feasibility of localized failure. The simulation results indicate that reducing the number of unit cells while increasing the thickness of the honeycomb elements is more effective at minimizing stress concentration than using a greater number of thinner unit cells. Furthermore, increasing the element thickness slows the lateral expansion of the core, thereby enhancing the overall stiffness of the sandwich structure. These findings align with those of Zhou et al. [38], who investigated the bending behavior of circular tubes with an auxetic core under impact loading. The finding revealed that increasing the number of auxetic elements significantly reduces the bending deformation of the outer shell. Moreover, increasing the thickness of the auxetic elements contributes to earlier contact between them under compression load, which enhances resistance to both bending and compressive loads. Similarly, Jie et al. [39] reported that increasing the number of cells and optimizing cell size in honeycomb structures effectively improves load distribution and reduces stress concentration.
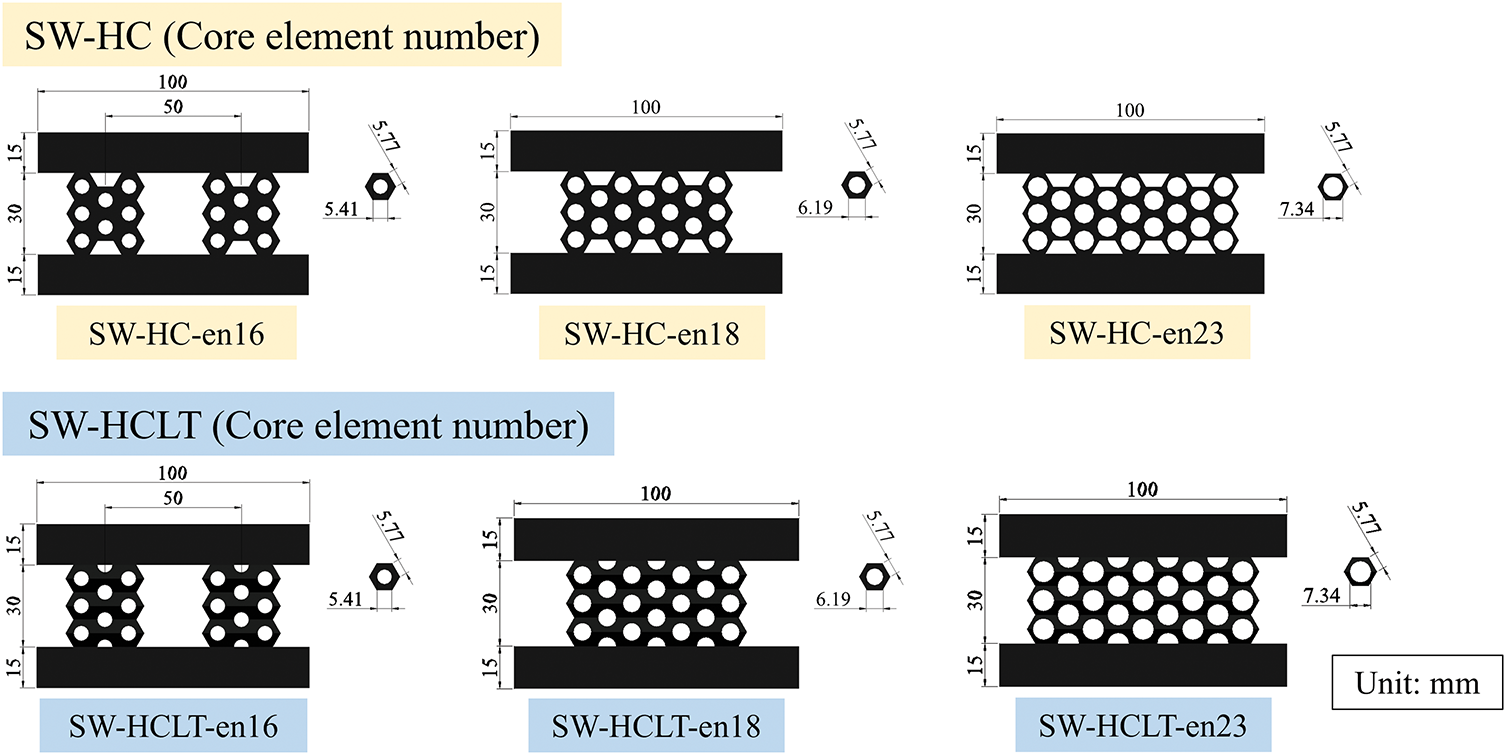
Figure 16: The configurations of the SW-HC and SW-HCLT with varying numbers of core elements in their 3D-printed components
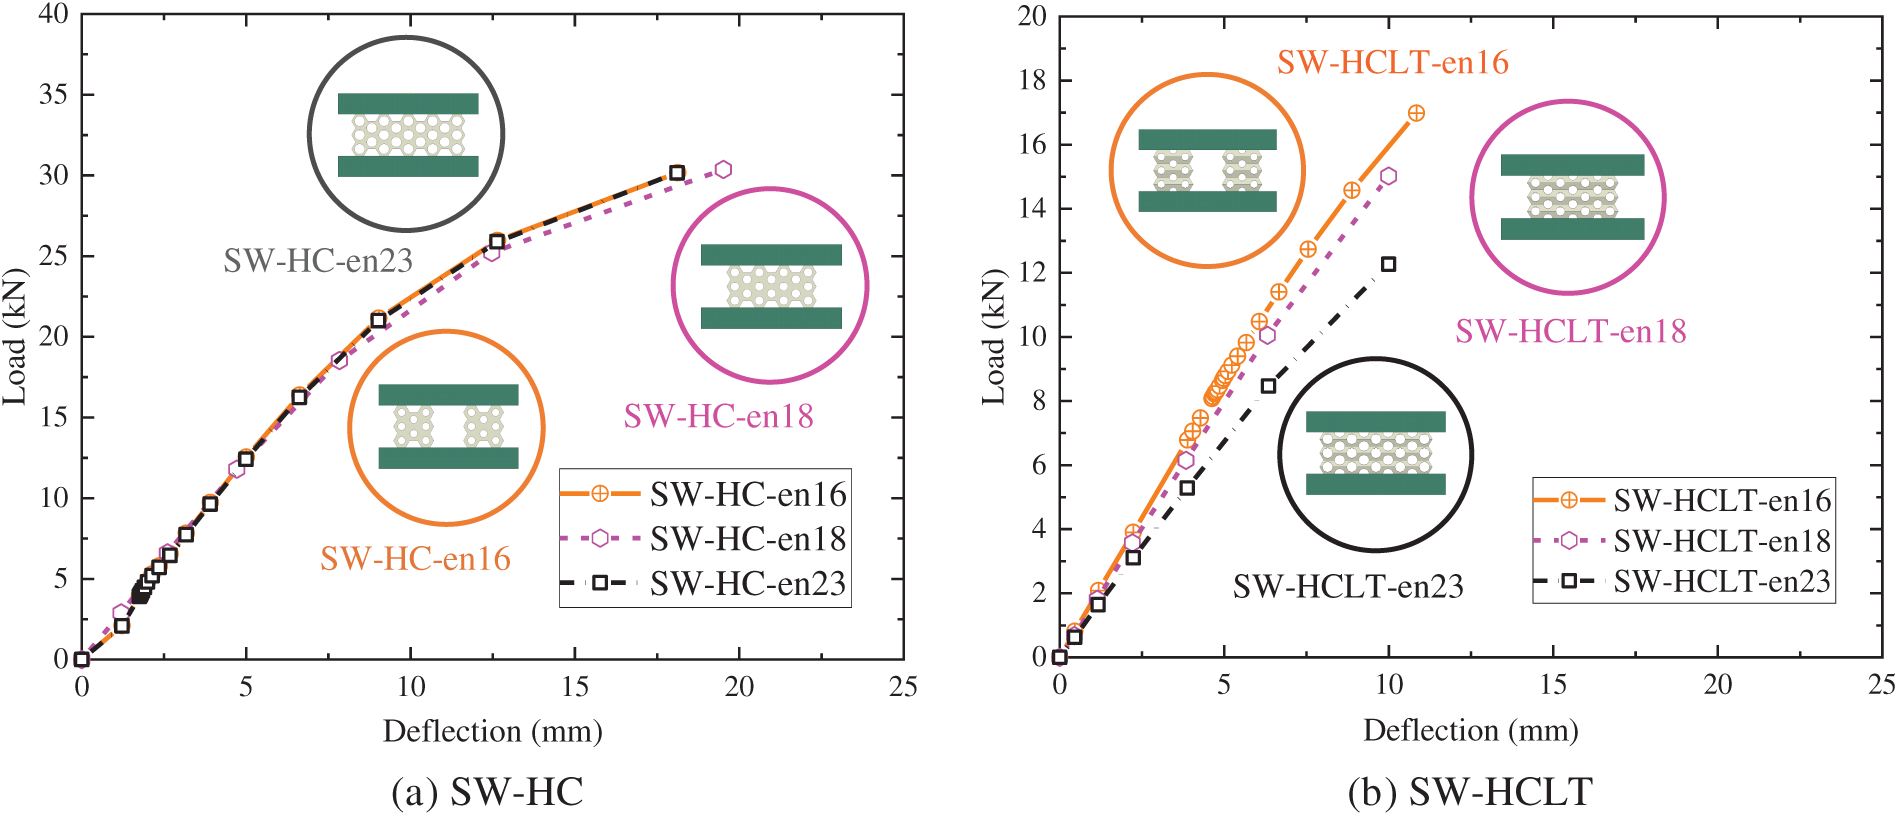
Figure 17: Load–deflection curves of the SW-HC and SW-HCLT with core element scales of 0.75, 1.0, and 1.50
In Case 3, the effect of sandwich structure depths on the variation in thickness of the Glubam panel and 3D-printed core was considered for both SW-HC and SW-HCLT specimens. For the SW-HC specimens, FEM was performed with Glubam panel thicknesses of 13, 15, and 17 mm (designated as SW-HC-bt13, SW-HC-bt15, and SW-HC-bt17, respectively), while the corresponding depths of the 3D-printed cores were reduced to 40, 30, and 20 mm to maintain a constant cross-sectional area, as presented in Fig. 18. The relationship between load and deflection from the simulations revealed that increasing the thickness of the Glubam panel did not influence the flexural performance of the SW-HC. However, the increase in the total depth of the sandwich structure led to an improvement in both ultimate load and stiffness, as illustrated in Fig. 19a. The SW-HC-bt13 model exhibited a lower ultimate load than the SW-HC-bt15 and SW-HC-bt17 models by 84.58% and 45.43%, respectively. The reduction of the thickness of the Glubam panel while increasing the depth of the 3D-printed core results in a more significant improvement in flexural performance compared to increasing the Glubam panel thickness, accompanied by a reduction in core depth. For the SW-HCLT specimens, the thickness of the Glubam panel was varied to 15, 20, and 25 mm, designated as SW-HCLT-bt15, SW-HCLT-bt20, and SW-HCLT-bt25, while maintaining a constant 3D-printed core depth of 30 mm. The ultimate loads recorded for SW-HCLT-bt15, SW-HCLT-bt20, and SW-HCLT-bt25 were 10.95, 15.23, and 18.15 kN, respectively, with corresponding stiffness values of 1.12, 1.48, and 1.87 kN/mm. The SW-HCLT-bt25 model exhibited the highest ultimate load, surpassing the SW-HCLT-bt20 and SW-HCLT-bt15 models by 19.17% and 65.75%, respectively. Increasing the thickness of the Glubam panel enhances the moment of inertia, flexural load resistance, and stiffness of the sandwich structure. For comparison on the flexural load, it was found that increasing the Glubam panel thickness from 15 to 20 mm resulted in a significant 39.09% increase in the ultimate load. However, further increasing the thickness from 20 to 25 mm led to only a 19.17% improvement. This suggests that increasing the thickness of the Glubam panel beyond a certain point does not result in proportional gains in flexural resistance, aligning with the principle of diminishing returns. As the amount of material input increases, the corresponding performance improvement occurs at a decreasing rate. Therefore, the selection of timber thickness should be carefully optimized to balance structural performance with the overall load-bearing efficiency of the cross-section.
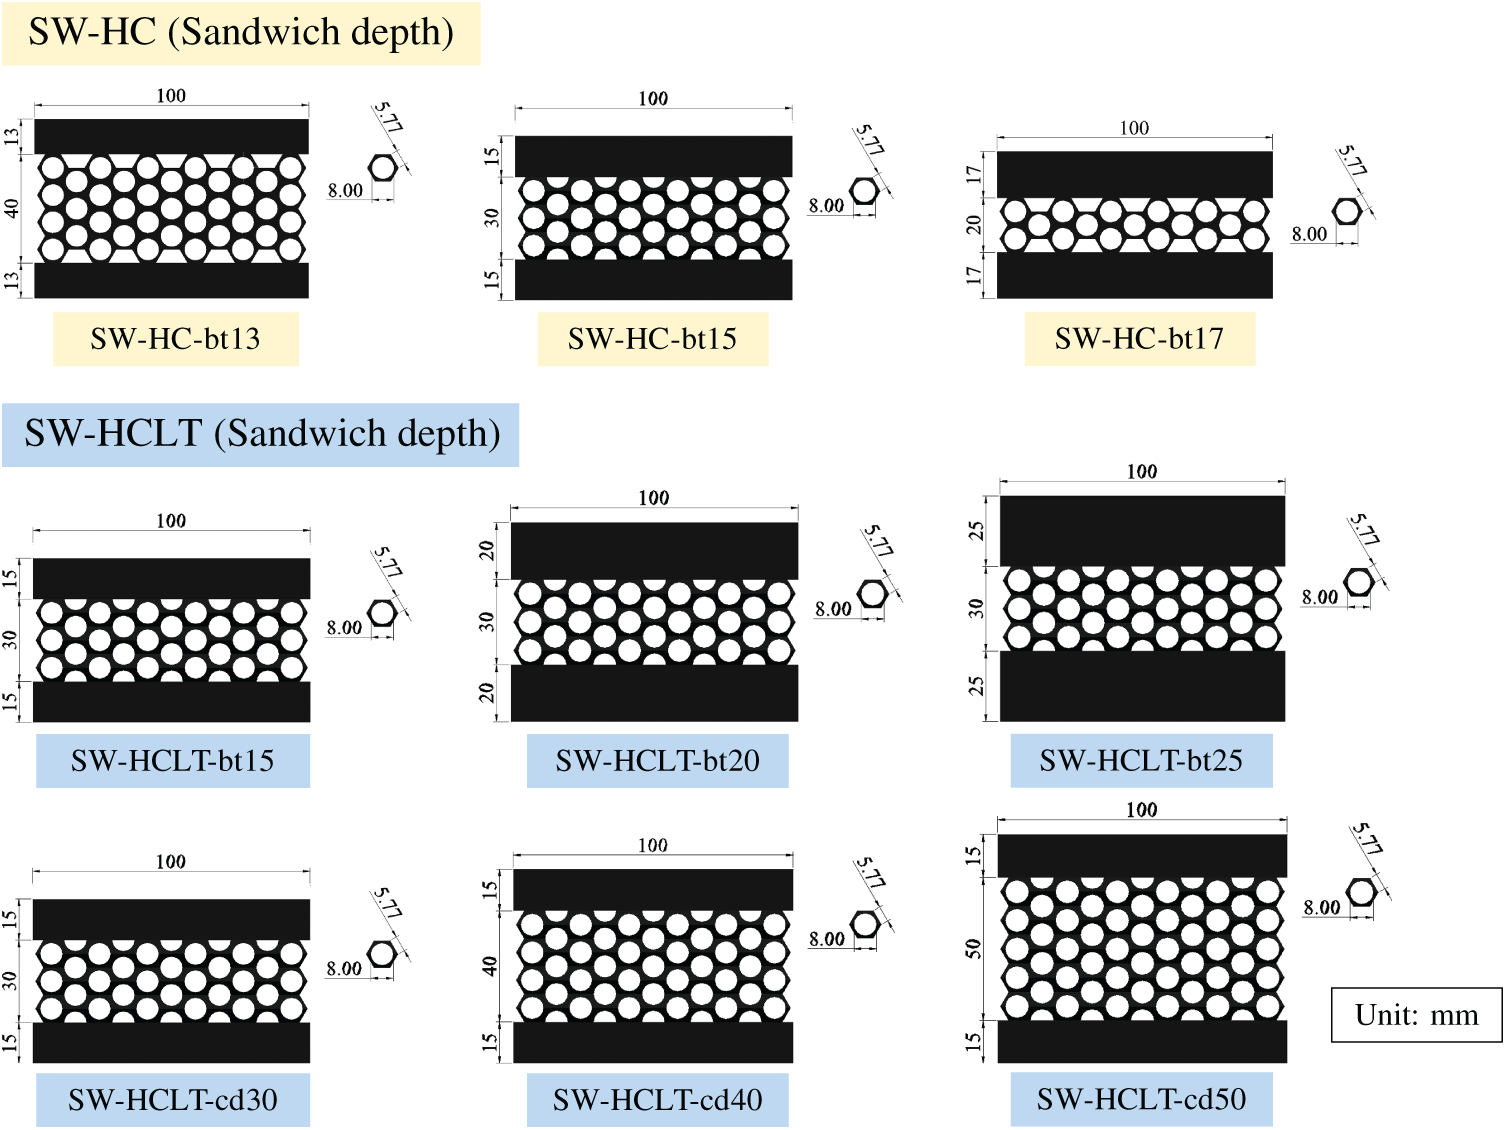
Figure 18: The configurations of the SW-HC and SW-HCLT with varying sandwich structure depths
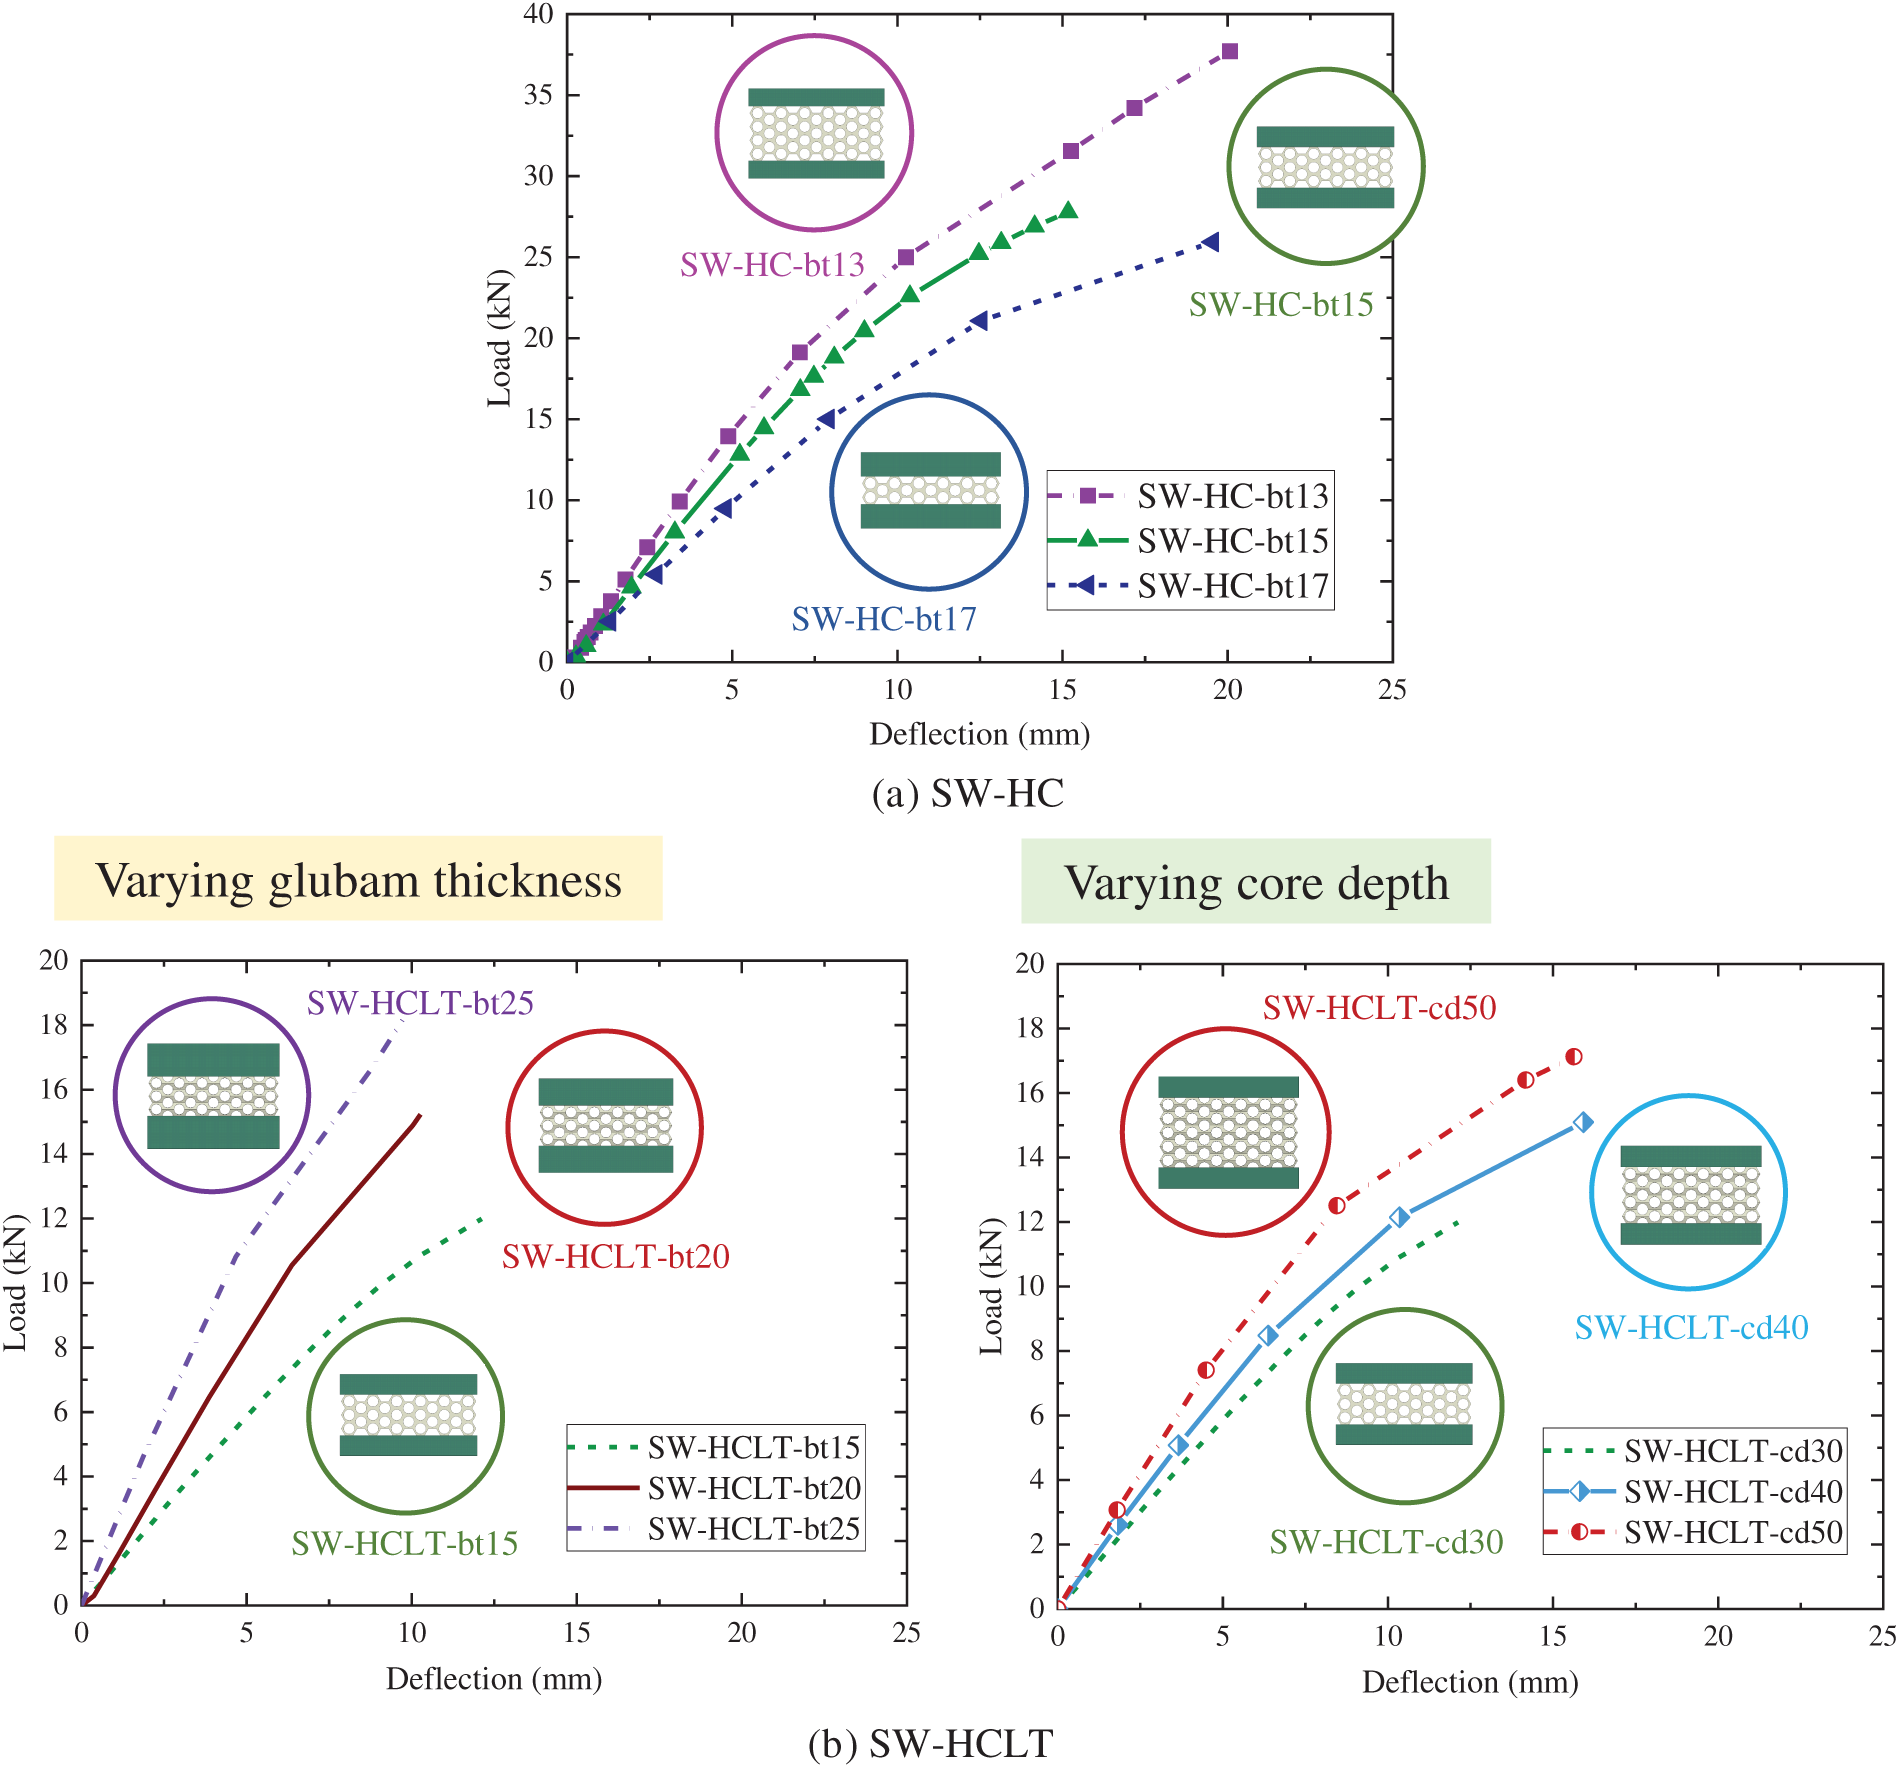
Figure 19: Load–deflection response of the SW-HC and SW-HCLT with varying sandwich structure depths
At the same time, the different 3D-printed core depths were modeled at 30, 40, and 50 mm (SW-HCLT-cd30, SW-HCLT-cd40, and SW-HCLT-cd50), which maintain a constant thickness of the Glubam panel in the outer faces at 15 mm. Based on the slope analysis shown in Fig. 19b, the initial stiffness of the SW-HCLT-cd50 model was higher than that of SW-HCLT-cd40 and SW-HCLT-cd30 by 9.30% and 24.78%, respectively. In terms of flexural capacity, SW-HCLT-cd50 also demonstrated the highest ultimate load, exceeding that of SW-HCLT-cd40 and SW-HCLT-cd30 by 13.38% and 56.35%, respectively. This enhancement is primarily attributed to the increased core depth, which results in a greater moment of inertia and, consequently, improved load-carrying capacity of the sandwich structure. However, increasing the core depth from 30 to 40 mm yielded a 37.90% gain in flexural load, whereas increasing it from 40 to 50 mm resulted in only a 13.38% improvement. This trend reflects the principle of diminishing returns, indicating that while increasing core depth does enhance flexural performance, the rate of improvement decreases with further increases. In addition, increasing the thickness of the Glubam panel also significantly improves flexural resistance, producing effects comparable to those achieved by increasing the depth of the 3D-printed core. For instance, the models SW-HCLT-bt20 and SW-HCLT-cd40 (both with total cross-sectional depths of 70 mm) and SW-HCLT-bt25 and SW-HCLT-cd50 (with total depths of 80 mm) showed improvements over SW-HCLT-cd30 by 39.09%, 37.90%, 65.75%, and 56.35%, respectively. Notably, increasing the thickness of the Glubam panels had a greater effect on flexural resistance than increasing the depth of the 3D-printed core, as the outer Glubam layers, being further from the neutral axis, contribute more significantly to the moment of inertia than the inner core.
This study suggests the flexural behavior of a sandwich structure composed of 3D-printed bioplastic material and Glubam panels. The analysis considers suitable fiber orientations and PLA additive types, selected based on the mechanical properties and cost-effectiveness of the bioplastic fibers. The FEM simulations were conducted to validate the experimental flexural test results and to extend the study through a parametric analysis of various cross-sectional configurations. Based on the results obtained in this study, the following conclusions can be drawn:
1. The results from the tension and compression tests indicated that unidirectional fiber orientation parallel to the loading direction (0°) exhibited higher strength than bidirectional alignment (45/135°), with increases of 21.83% in tensile strength and 14.69% in compressive strength, respectively. Consequently, PLA+, PLA-CF, and PLA-GF specimens were fabricated with fiber orientation at 0°.
2. Among the three bioplastic materials with different additives, PLA-CF exhibited the highest tensile and compressive strengths. However, a cost-effectiveness analysis revealed that PLA+ offered the greatest economic value. Specifically, the strength-to-cost ratio for PLA+ was 33.3% higher in tensile strength and 23.27% higher in compressive strength compared to PLA-CF. As a result, PLA+ was selected as the core material for fabricating both the honeycomb and honeycomb-lattice structures, with fiber orientation aligned at 0°, parallel to the loading direction.
3. The flexural behavior of the sandwich structures, including both SW-HC and SW-HCLT specimens, under four-point bending tests showed that the SW-HC specimen exhibited a flexural strength 88.27% greater than that of the SW-HCLT specimen, as well as a specific strength-to-weight ratio that was 57.69% higher. The failure in both specimens was characterized by horizontal shear failure in the core region, with no delamination observed. Furthermore, the experimental results showed good agreement with the finite element model simulated using ABAQUS, with differences of 4.63% in ultimate load and 7.13% in flexural strength.
4. The FEM analysis of geometric parameters in the SW-HC models revealed that variations in cross-sectional depth had a significant influence on flexural properties. For SW-HC models, the SW-HC-bt13 configuration, which involved reducing Glubam panel thickness while significantly increasing 3D-printed core depth, showed a more pronounced improvement in flexural performance compared to increasing Glubam thickness with reduced core depth. In addition, variations in the scale of the honeycomb core and the number of core elements had relatively minor effects on the flexural behavior of the SW-HC model.
5. The variation of the core elements scale, cross-sectional depth, and number of core elements in the SW-HCLT model significantly influenced the flexural properties of the specimens. Among these parameters, reducing the number of core elements while increasing the 3D-printed core depth improved flexural performance more significantly than the other parameters. In addition, the SW-HCLT-cs0.75, SW-HCLT-bt25, SW-HCLT-cd50, and SW-HCLT-en16 models exhibited the highest ultimate load and stiffness in their respective parameter studies.
Future studies should consider the environmental effects on PLA and Glubam materials, focusing on temperature and humidity, which may influence their flexural behavior as well as the interfacial adhesion in the sandwich structure between PLA and Glubam. For construction applications, the long-term performance of structural members, including creep and durability, should be considered, especially in the design of large-scale structures. In addition, production cost is a key factor in designing sandwich structures with honeycomb and honeycomb lattice cores, making it an important subject for future study. Optimizing the dimensional design of core components to enhance bending resistance while minimizing fabrication time and material consumption will further enable evaluation of the cost-effectiveness of sandwich structures in terms of their strength-to-cost ratio.
Acknowledgement: The authors would like to express their appreciation to King Mongkut’s University of Technology Thonburi for their financial support: Fiscal Year 2025, Round 2, for the project of “Development of an analysis methodology for moment-curvature relationship and flexural behavior of composite timber structural members”. The authors also extend their thanks to Timber Technology Development Co., Ltd., for preparing Glubam panels.
Funding Statement: This research was funded by King Mongkut’s University of Technology Thonburi for their financial support: Fiscal Year 2025, Round 2, for the project of “Development of an analysis methodology for moment-curvature relationship and flexural behavior of composite timber structural members.” Additional support was provided by the Thailand Science Research and Innovation (TSRI) through the Basic Research Fund, Fiscal Year 2026, for the project “Numerical Modeling and Structural Analysis of Composite Sections Built-up from Local Timber in Thailand”.
Author Contributions: The authors confirm contribution to the paper as follows: Conceptualization, Tawich Pulngern and Kasan Chanto; methodology, Nattawat Mahasuwanchai; software, Nattawat Mahasuwanchai; validation, Tawich Pulngern, Kasan Chanto and Thippakorn Udtaranakron; formal analysis, Nattawat Mahasuwanchai and Thippakorn Udtaranakron; investigation, Nattawat Mahasuwanchai; resources, Nattawat Mahasuwanchai; data curation, Nattawat Mahasuwanchai; writing—original draft preparation, Thippakorn Udtaranakron and Nattawat Mahasuwanchai; writing—review and editing, Tawich Pulngern, Kasan Chanto and Thippakorn Udtaranakron; visualization, Tawich Pulngern and Kasan Chanto; supervision, Tawich Pulngern; project administration; funding acquisition, Tawich Pulngern and Kasan Chanto. All authors reviewed the results and approved the final version of the manuscript.
Availability of Data and Materials: The authors attest that all data analyzed during this study are included in this published article.
Ethics Approval: Not applicable.
Conflicts of Interest: The authors declare no conflicts of interest to report regarding the present study.
References
1. Savini A, Savini GG. A short history of 3D printing, a technological revolution just started. In: 2015 ICOHTEC/IEEE International History of High-Technologies and their Socio-Cultural Contexts Conference (HISTELCON); 2025 Aug 18–19; Tel-Aviv, Israel. p. 1–8. doi:10.1109/HISTELCON.2015.7307314. [Google Scholar] [CrossRef]
2. Allouzi R, Al-Azhari W, Allouzi R. Conventional construction and 3D printing: a comparison study on material cost in Jordan. J Eng. 2020;2020(7):1424682. doi:10.1155/2020/1424682. [Google Scholar] [CrossRef]
3. Jandyal A, Chaturvedi I, Wazir I, Raina A, Ul Haq MI. 3D printing—a review of processes, materials and applications in industry 4.0. Sustain Oper Comput. 2022;3(43):33–42. doi:10.1016/j.susoc.2021.09.004. [Google Scholar] [CrossRef]
4. Sakin M, Kiroglu YC. 3D printing of buildings: construction of the sustainable houses of the future by BIM. Energy Proc. 2017;134:702–11. doi:10.1016/j.egypro.2017.09.562. [Google Scholar] [CrossRef]
5. Rabenantoandro AZ, Lafhaj Z, Danel T, Dakhli Z, Krimi I, Denecker M, et al. 3D printing in construction: application framework for a robotic arm based on the extrusion technique. In: Proceedings of the International Conference on Smart, Sustainable and Sensuous Settlements Transformation (3SSettlements); 2018 Mar 7–8; Munich, Germany. p. 7–8. [Google Scholar]
6. Rodríguez-Reyna SL, Díaz-Aguilera JH, Acevedo-Parra HR, García CJ, Gutierrez-Castañeda EJ, Tapia F. Design and optimization methodology for different 3D processed materials (PLA, ABS and carbon fiber reinforced nylon PA12) subjected to static and dynamic loads. J Mech Behav Biomed Mater. 2024;150(2):106257. doi:10.1016/j.jmbbm.2023.106257. [Google Scholar] [PubMed] [CrossRef]
7. Cojocaru V, Frunzaverde D, Miclosina CO, Marginean G. The influence of the process parameters on the mechanical properties of PLA specimens produced by fused filament fabrication—a review. Polymers. 2022;14(5):886. doi:10.3390/polym14050886. [Google Scholar] [PubMed] [CrossRef]
8. Kopar M, Yildiz AR. Experimental investigation of mechanical properties of PLA, ABS, and PETG 3-D printing materials using fused deposition modeling technique. Mater Test. 2023;65(12):1795–804. doi:10.1515/mt-2023-0202. [Google Scholar] [CrossRef]
9. Marsavina L, Vălean C, Mărghitas M, Linul E, Razavi N, Berto F, et al. Effect of the manufacturing parameters on the tensile and fracture properties of FDM 3D-printed PLA specimens. Eng Fract Mech. 2022;274(6):108766. doi:10.1016/j.engfracmech.2022.108766. [Google Scholar] [CrossRef]
10. Cao A, Wan D, Gao C, Elverum CW. A novel method of fabricating designable polylactic acid (PLA)/thermoplastic polyurethane (TPU) composite filaments and structures by material extrusion additive manufacturing. J Manuf Process. 2024;118:432–47. doi:10.1016/j.jmapro.2024.03.015. [Google Scholar] [CrossRef]
11. Essawi B, Abdallah S, Ali S, Nassir Abdo Mohammed A, Susantyoko RA, Pervaiz S. Optimization of infill density, fiber angle, carbon fiber layer position in 3D printed continuous carbon-fiber reinforced nylon composite. Results Eng. 2024;21(2):101926. doi:10.1016/j.rineng.2024.101926. [Google Scholar] [CrossRef]
12. Joseph TM, Kallingal A, Suresh AM, Mahapatra DK, Hasanin MS, Haponiuk J, et al. 3D printing of polylactic acid: recent advances and opportunities. Int J Adv Manuf Technol. 2023;125(3–4):1015–35. doi:10.1007/s00170-022-10795-y. [Google Scholar] [PubMed] [CrossRef]
13. Li T, Wang L. Bending behavior of sandwich composite structures with tunable 3D-printed core materials. Compos Struct. 2017;175(8):46–57. doi:10.1016/j.compstruct.2017.05.001. [Google Scholar] [CrossRef]
14. Zarna C, Chinga-Carrasco G, Echtermeyer AT. Bending properties and numerical modelling of cellular panels manufactured from wood fibre/PLA biocomposite by 3D printing. Compos Part A Appl Sci Manuf. 2023;165(3):107368. doi:10.1016/j.compositesa.2022.107368. [Google Scholar] [CrossRef]
15. Sarvestani HY, Akbarzadeh AH, Niknam H, Hermenean K. 3D printed architected polymeric sandwich panels: energy absorption and structural performance. Compos Struct. 2018;200(4):886–909. doi:10.1016/j.compstruct.2018.04.002. [Google Scholar] [CrossRef]
16. Shah SZH, Altaf K, Lee J, Sharif T, Choudhry RS, Hussain SM. Bending performance and failure mechanisms of hybrid and regular sandwich composite structures with 3D printed corrugated cores. Compos Struct. 2023;325(18):117580. doi:10.1016/j.compstruct.2023.117580. [Google Scholar] [CrossRef]
17. Brejcha V, Böhm M, Holeček T, Jerman M, Kobetičová K, Burianová I, et al. Comparison of bending properties of sandwich structures using conventional and 3D-printed core with flax fiber reinforcement. J Compos Sci. 2025;9(4):182. doi:10.3390/jcs9040182. [Google Scholar] [CrossRef]
18. Ansell MP. Wood composite. Amsterdam, The Netherlands: Elsevier; 2015. [Google Scholar]
19. Zhang X, Luo L, Xie X, Zhang Y, Li Z. Flexural bearing capacity and stiffness of stiffened hollow glulam beams: experiments, finite element analysis and calculation theory. Constr Build Mater. 2022;345(4):128407. doi:10.1016/j.conbuildmat.2022.128407. [Google Scholar] [CrossRef]
20. Udtaranakron T, Pulngern T, Rosarpitak V, Sombatsompop N. Structural performance of full-scale hybrid hollow core wall with WPVC composite materials under axial compression load via experimental investigation. Constr Build Mater. 2025;470(2):140656. doi:10.1016/j.conbuildmat.2025.140656. [Google Scholar] [CrossRef]
21. Nie S, Fu W, Wang H, Wu D, Liu M, Wang J. Experimental study of moso bamboo to-steel connections with embedded grouting materials. J Renew Mater. 2023;11(3):1401–23. doi:10.32604/jrm.2022.023446. [Google Scholar] [CrossRef]
22. Gárate AERP, Felissia FE, Area MC, Suirezs T, Vallejos ME. Potential of bamboo species Guadua trinii and Guadua angustifolia for nanocellulose production. J Renew Mater. 2024;12(9):1541–55. doi:10.32604/jrm.2024.052481. [Google Scholar] [CrossRef]
23. Shan Q, Mao M, Li Y. Theoretical analysis on deflection and bearing capacity of prestressed bamboo-steel composite beams. J Renew Mater. 2024;12(1):149–66. doi:10.32604/jrm.2023.029445. [Google Scholar] [CrossRef]
24. Lobovikov M, Paudel S, Piazza M, Ren H, Wu J. World bamboo resources, a thematic study prepared in the framework of the global forest resources assessment 2005. Rome, Italy: Food and Agriculture Organization of the United Nations (FAO); 2005. [Google Scholar]
25. Huang Y, Ji Y, Yu W. Development of bamboo scrimber: a literature review. J Wood Sci. 2019;65(1):25. doi:10.1186/s10086-019-1806-4. [Google Scholar] [CrossRef]
26. Vălean C, Stoia DI, Opris C, Linul E. Effect of fillers on mechanical properties of FDM printed PLA components. Procedia Struct Integr. 2024;56(11):97–104. doi:10.1016/j.prostr.2024.02.043. [Google Scholar] [CrossRef]
27. ASTM D638-22. Standard test method for tensile properties of plastics. West Conshohocken, PA, USA: ASTM International; 2022. [Google Scholar]
28. ASTM D695-15. Standard test method for compressive properties of rigid plastics. West Conshohocken, PA, USA: ASTM International; 2015. [Google Scholar]
29. ASTM D198-22. Standard test methods of static tests of lumber in structural sizes. West Conshohocken, PA, USA: ASTM International; 2022. [Google Scholar]
30. Tuwair H, Volz J, ElGawady MA, Chandrashekhara K, Birman V. Modeling and analysis of GFRP bridge deck panels filled with polyurethane foam. J Bridge Eng. 2016;21(5):04016012. doi:10.1061/(asce)be.1943-5592.0000849. [Google Scholar] [CrossRef]
31. Xia F, Durandet Y, Tan PJ, Ruan D. Three-point bending performance of sandwich panels with various types of cores. Thin Walled Struct. 2022;179:109723. doi:10.1016/j.tws.2022.109723. [Google Scholar] [CrossRef]
32. ASTM D143-22. Standard test methods for small clear specimens of timber. West Conshohocken, PA, USA: ASTM International; 2022. [Google Scholar]
33. Qadyani MJ, Ameri B, Taheri-Behrooz F. Critical strain energy release rate in additively manufactured polymers through comparative study of ABS and PLA across various raster angles. Theor Appl Fract Mech. 2025;138:104890. doi:10.1016/j.tafmec.2025.104890. [Google Scholar] [CrossRef]
34. Petchwattana N, Naknaen P, Narupai B. Combination effects of reinforcing filler and impact modifier on the crystallization and toughening performances of poly(lactic acid). Express Polym Lett. 2020;14(9):848–59. doi:10.3144/expresspolymlett.2020.70. [Google Scholar] [CrossRef]
35. Nadir Y, Nagarajan P, Ameen M, Arif MM. Flexural stiffness and strength enhancement of horizontally glued laminated wood beams with GFRP and CFRP composite sheets. Constr Build Mater. 2016;112(10):547–55. doi:10.1016/j.conbuildmat.2016.02.133. [Google Scholar] [CrossRef]
36. Mostafa KG, Montemagno C, Qureshi AJ. Strength to cost ratio analysis of FDM Nylon 12 3D printed parts. Procedia Manuf. 2018;26(3):753–62. doi:10.1016/j.promfg.2018.07.086. [Google Scholar] [CrossRef]
37. Molastic. 3D print filament [Internet]. 2024 [cited 2024 Jul 1]. Available from: https://molastic.com. [Google Scholar]
38. Zhou Q, Xu Z, Cui Y, Wang K, Wang B, Wang B. Evaluations of three-point bending and energy absorption performances of novel auxetic honeycomb circular tubes under different impact loading. Constr Build Mater. 2025;475(4):141132. doi:10.1016/j.conbuildmat.2025.141132. [Google Scholar] [CrossRef]
39. Jie D, Bai J, Ran M, Yin D, Lin S. Bending performance and crack propagation in biomimetic honeycomb structures for sustainable lightweight design. Eur J Mech A Solids. 2025;112:105640. doi:10.1016/j.euromechsol.2025.105640. [Google Scholar] [CrossRef]
Cite This Article
 Copyright © 2025 The Author(s). Published by Tech Science Press.
This work is licensed under a Creative Commons Attribution 4.0 International License , which permits unrestricted use, distribution, and reproduction in any medium, provided the original work is properly cited.
 Downloads
 Citation Tools