
 Submit a Paper
 Propose a Special lssue
 Open Access
ARTICLE
Comparison of IDEAL-IQ and IVIM-DWI for Differentiating between Alpha Fetoprotein-Negative Hepatocellular Carcinoma and Focal Nodular Hyperplasia
Department of Radiology, The First Affiliated Hospital of University of Science and Technology of China (Anhui Provincial Hospital), Hefei, 230032, China
* Corresponding Author: Kexue Deng. Email:
Oncologie 2022, 24(3), 527-538. https://doi.org/10.32604/oncologie.2022.022815
Received 27 March 2022; Accepted 26 June 2022; Issue published 19 September 2022
 View Full Text
 Download PDF
Abstract
Background: To compare the differential diagnostic value of iterative decomposition of water and fat with the echo asymmetrical and least-squares estimation quantitation sequence (IDEAL-IQ) with that of intravoxel incoherent motion diffusion-weighted imaging (IVIM DWI) in differentiating between alpha fetoprotein (AFP)-negative hepatocellular carcinoma (HCC) and focal nodular hyperplasia (FNH). Materials and Methods: A total of 28 AFP-negative HCC cases and 15 FNH cases were scanned using the IDEAL-IQ and IVIM-DWI magnetic resonance imaging (MRI) protocols. Two radiologists independently assessed the fat fraction (FF) and the iron level surrogate (R2*) derived from the IDEAL-IQ images and the apparent diffusion coefficient (ADC), pure diffusion coefficient (D), pseudo-diffusion coefficient (D*), and perfusion fraction (f) derived from the IVIM-DWI images. The intraclass correlation coefficients (ICC) were estimated to evaluate the agreement repeatability between the two readers. The area under the curve (AUC) of a receiver operating characteristics curve was used to compare the diagnostic efficiency of the parameters extracted from the two techniques. Results: The lesions in the HCC group had significantly higher FF than the FNH group (8.284 ± 5.756 vs. 2.559 ± 1.247, P < 0.05). ADC and D values were lower in the HCC lesions when compared with the FNH lesions (1.310 ± 0.253 and 0.909 ± 0.192, respectively, vs. 1.624 ± 0.304 and 1.230 ± 0.314; ×10−3 mm2 /s). The FF parameter had the highest AUC (0.923) followed by D (0.864) and ADC (0.854). Conclusions: FF derived from IDEAL-IQ, and ADC and D derived from IVIM-DWI were able to differentiate AFP-negative HCC from FNH. IDEAL-IQ showed better performance for the differentiation of FNH from HCC than the IVIM-DWI-derived parameters.Keywords
Hepatocellular carcinoma (HCC), the most common primary malignant tumor of the liver, is strongly associated with hepatitis B and liver cirrhosis [1]. Focal nodular hyperplasia (FNH) is the second most common focal benign liver lesion after cavernous hemangioma [2]. Most FNH patients have no history of hepatitis B and can be followed up over the long term without treatment [3]. HCC and FNH have similar imaging characteristics on computed tomography(CT) and magnetic resonance imaging(MRI), which include a rich blood supply. The serum level of alpha fetoprotein (AFP) tends to increase in most HCC patients but remains normal in FNH patients, and therefore, it is often used to distinguish between the 2 lesions. However, the AFP levels in some HCC cases are still normal, indicating that AFP is not always a reliable marker for HCC.
Gadolinium ethoxybenzyl diethylenetriaminepentaacetic acid (Gd-EOB-DTPA; Primovist, Bayer Schering, Pharma AG, Berlin) is a hepatocyte-specific contrast agent commonly used to facilitate the distinction between HCC from FNH. However, about 10% of high-grade HCCs can also take up this contrast agent and have a slightly higher signal intensity in the hepatobiliary phase [4]. Diffusion-weighted imaging (DWI) is another commonly used functional MRI technique. The apparent diffusion coefficient (ADC) quantifies the diffusion of water molecules within tissue and can be easily extracted from DWI and used to distinguish between HCC and FNH [5]. However, the ADC values may be influenced by both diffusion and microcirculation perfusion, which means that ADC values on DWI tend to be overestimated [6]. In addition, some studies also reported overlaps in ADC values between benign and malignant liver lesions [7,8]. To overcome this problem, Le Bihan proposed the intravoxel incoherent motion diffusion-weighted imaging (IVIM-DWI) method [9]. This imaging technique involves the measurement of four quantitative parameters, including ADC, pure diffusion coefficient (D), pseudo-diffusion coefficient (D*), and perfusion fraction (f). The parameter D measures the true diffusion of water molecules within the lesions by eliminating the perfusion effect caused by microcirculation. The parameter D* measures the microcirculation within the capillary network, while the parameter F measures the proportion of capillary volume. IVIM-DWI is widely used to grade HCC and in the differential diagnosis of HCC and FNH. However, this technique requires a minimum scanning time of 5 min, and the parameters selected to acquire the MRI sequences may affect the results [1,10–12].
The iterative decomposition of water and fat with the echo asymmetrical and least-squares estimation quantitation sequence (IDEAL-IQ) developed by GE Healthcare (USA), could be used to measure the iron and fat content in tissues. The whole liver can be scanned within one breath-hold (about 16 s) without contrast agents. The images are then reconstructed, and a fat fraction (FF) and R2* maps can be obtained simultaneously to measure the fat and iron content within the tissue of interest. This technique eliminates the effect of the T2*, magnetic field inhomogeneity, and T1 magnetic relaxation, and therefore, the fat and iron content within the tissue can be quantified more accurately [13,14]. Currently, IDEAL-IQ is mainly used to evaluate the fat content of the liver, bone marrow, and pancreas [14–17]. However, several studies have shown that HCC tends to be iron-deficient and undergo fatty metamorphosis [18–20].
This study aimed to use the IDEAL-IQ MRI imaging technique to measure the iron-deficiency and fatty metamorphosis in HCC and FNH. In addition, the diagnostic efficiency and reliability of the IDEAL-IQ and IVIM-DWI in distinguishing between HCC from FNH were also compared.
This retrospective study was approved by our institutional review board. Between July 2019 and December 2021, 28 HCC patients and 11 FNH patients were examined, and their diagnoses were confirmed by operation and pathology. Another 4 FNH patients were diagnosed according to the American Association for the Study of Liver Diseases (AASLD) guidelines. Since AFP is an important marker for HCC, only those patients with negative AFP were included in this study. Furthermore, only patients with a single hepatic lesion- not exceeding 1 cm and without portal vein thrombosis and hepatic lymph node metastasis were included in the study. Patients with incomplete clinical and imaging data, multiple hepatic lesions, and those who had previous liver treatment were excluded.
All patients fasted for 6 h before the MRI examination. All MRI scans were acquired on a 3.0-Tesla(T) MRI scanner (Discovery MR750W, GE Healthcare) with a 48-element body coil. The abdomen was bound with a respiratory gating device to trigger the scanning. The scanning sequences included an axial T1-weighted imaging (T1WI), an axial T2-weighted imaging (T2WI), IDEAL-IQ, and IVIM-DWI. The IVIM-DWI images were obtained using the following parameters: repetition time/echo time (TR/TE), 6666.67/66.3 ms; slice thickness, 5.0 mm with a gap of 1.0 mm; field of view, 44 cm × 44 cm; matrix size, 96 × 128; twelve b values ranging from 0 to 1200 s/mm2 (0, 10, 20, 50, 100, 150, 200, 400, 600, 800, 1000, and 1200) were used, and the number of excitations (NEX) for each b was 2, 2, 2, 2, 2, 2, 2, 3, 3, 4, 4, 6. A three-dimensional liver acquisition with volume accelerated extended volume (LAVA-XV) multi-phase dynamic contrast-enhanced scanning was performed by injecting GD-EOB-DTPA (Primovist, Bayer Schering, Pharma AG, Berlin) through the cubital vein with a high-pressure syringe. The contrast agent was first injected at a dose of 0.1 ml/kg at a flow rate of 1–2 ml/s followed by a 10-ml saline flush. Images of the early and late arterial phase, portal phase, delayed phase, and hepatobiliary phase were collected at 15 s, 60 s, 180 s and 20 min, respectively, after the contrast agent injection.
All images were transferred to the AW4.7 workstation (GE Medical System) for image processing, analysis, and measurement of the relevant parameters. Two radiologists, one with 9 years and one with 15 years of clinical experience in reporting abdominal MRIs, evaluated the images visually and quantitatively. The radiologists were blinded to the diagnosis of the evaluated patients. The visual assessment involved evaluating the contrast enhancement and the signal intensity of the lesion on the T1W1 and T2WI for all 4 phases. For the quantitative assessment, the 2 radiologists were asked to select regions of interest (ROI) within the lesions to perform the quantitative measurements as described by Luo et al. [1,10]. If the lesion was homogeneous, the ROI was drawn along the edge of the lesion, within a 2 mm margin to the outer border of the lesion. If the lesion was heterogeneous, three identical ROIs were placed on the slice showing the largest area of the lesion, avoiding hemorrhagic, necrotic, and cystic change. ROIs were also placed on the FF maps and R2* maps derived from the IDEAL-IQ using the same methods. In addition, to ensure the accuracy of the FF and R2* results of the normal liver, 3 ROIs of about 150 mm2 were drawn in the right anterior lobe, right posterior lobe and left inner lobe of the liver near the level of the porta hepatis [19]. The blood vessels, bile ducts, and lesions were excluded from the ROIs.
The statistical package for the social sciences (SPSS) software version 19.0 was used to analyze the data. Unless otherwise specified, data are reported as mean ± standard deviation. The intraclass correlation coefficient (ICC) was used to evaluate the agreement between the two radiologists. An ICC value above 0.75 was deemed to be consistent and acceptable. The independent two-sample t test was used to compare the IVIM-derived parameters (ADC, D, D* and f) and IDEAL-IQ-derived parameters (FF and R2*). The categorical data were expressed as case numbers or rate (%) and were compared using the Chi-square test. The diagnostic performance of each of the parameters that differed significantly between the HCC and FNH groups was assessed by calculating the area under the curve (AUC) of a receiver operating characteristics curve (ROC). The AUC ranges from 0 to 1, and a higher AUC indicates higher diagnostic efficacy. For all statistical tests, a p-value below 0.05 was deemed statistically significant.
The demographic and clinical characteristics of the patients are summarized in Table 1. The HCC group consisted of 28 patients (23 men and 5 women) with an average age 62.3 ± 9.9 years. The FNH group consisted of 15 patients (7 men and 8 women) with an average age 28.3 ± 5.9 years. The proportion of male patients in the HCC group was significantly higher than that in the FNH group (p = 0.045). The maximum lesion diameter in the HCC group ranged from 1.7 to 13.6 cm (average 5.6 ± 3.1 cm), whereas the maximum lesion diameter in the FNH group ranged from 3.5 to 9.6 cm (average 5.3 ± 2.0 cm). However, the lesion diameter did not differ significantly between the 2 groups (P = 0.73). 10 (35.7%) patients had a history of cirrhosis in the HCC group, while no patients in the FNH group. In the HCC group, there were 8 cases of well differentiated HCC, 19 cases of moderately differentiated HCC and 1 case of poorly differentiated HCC.
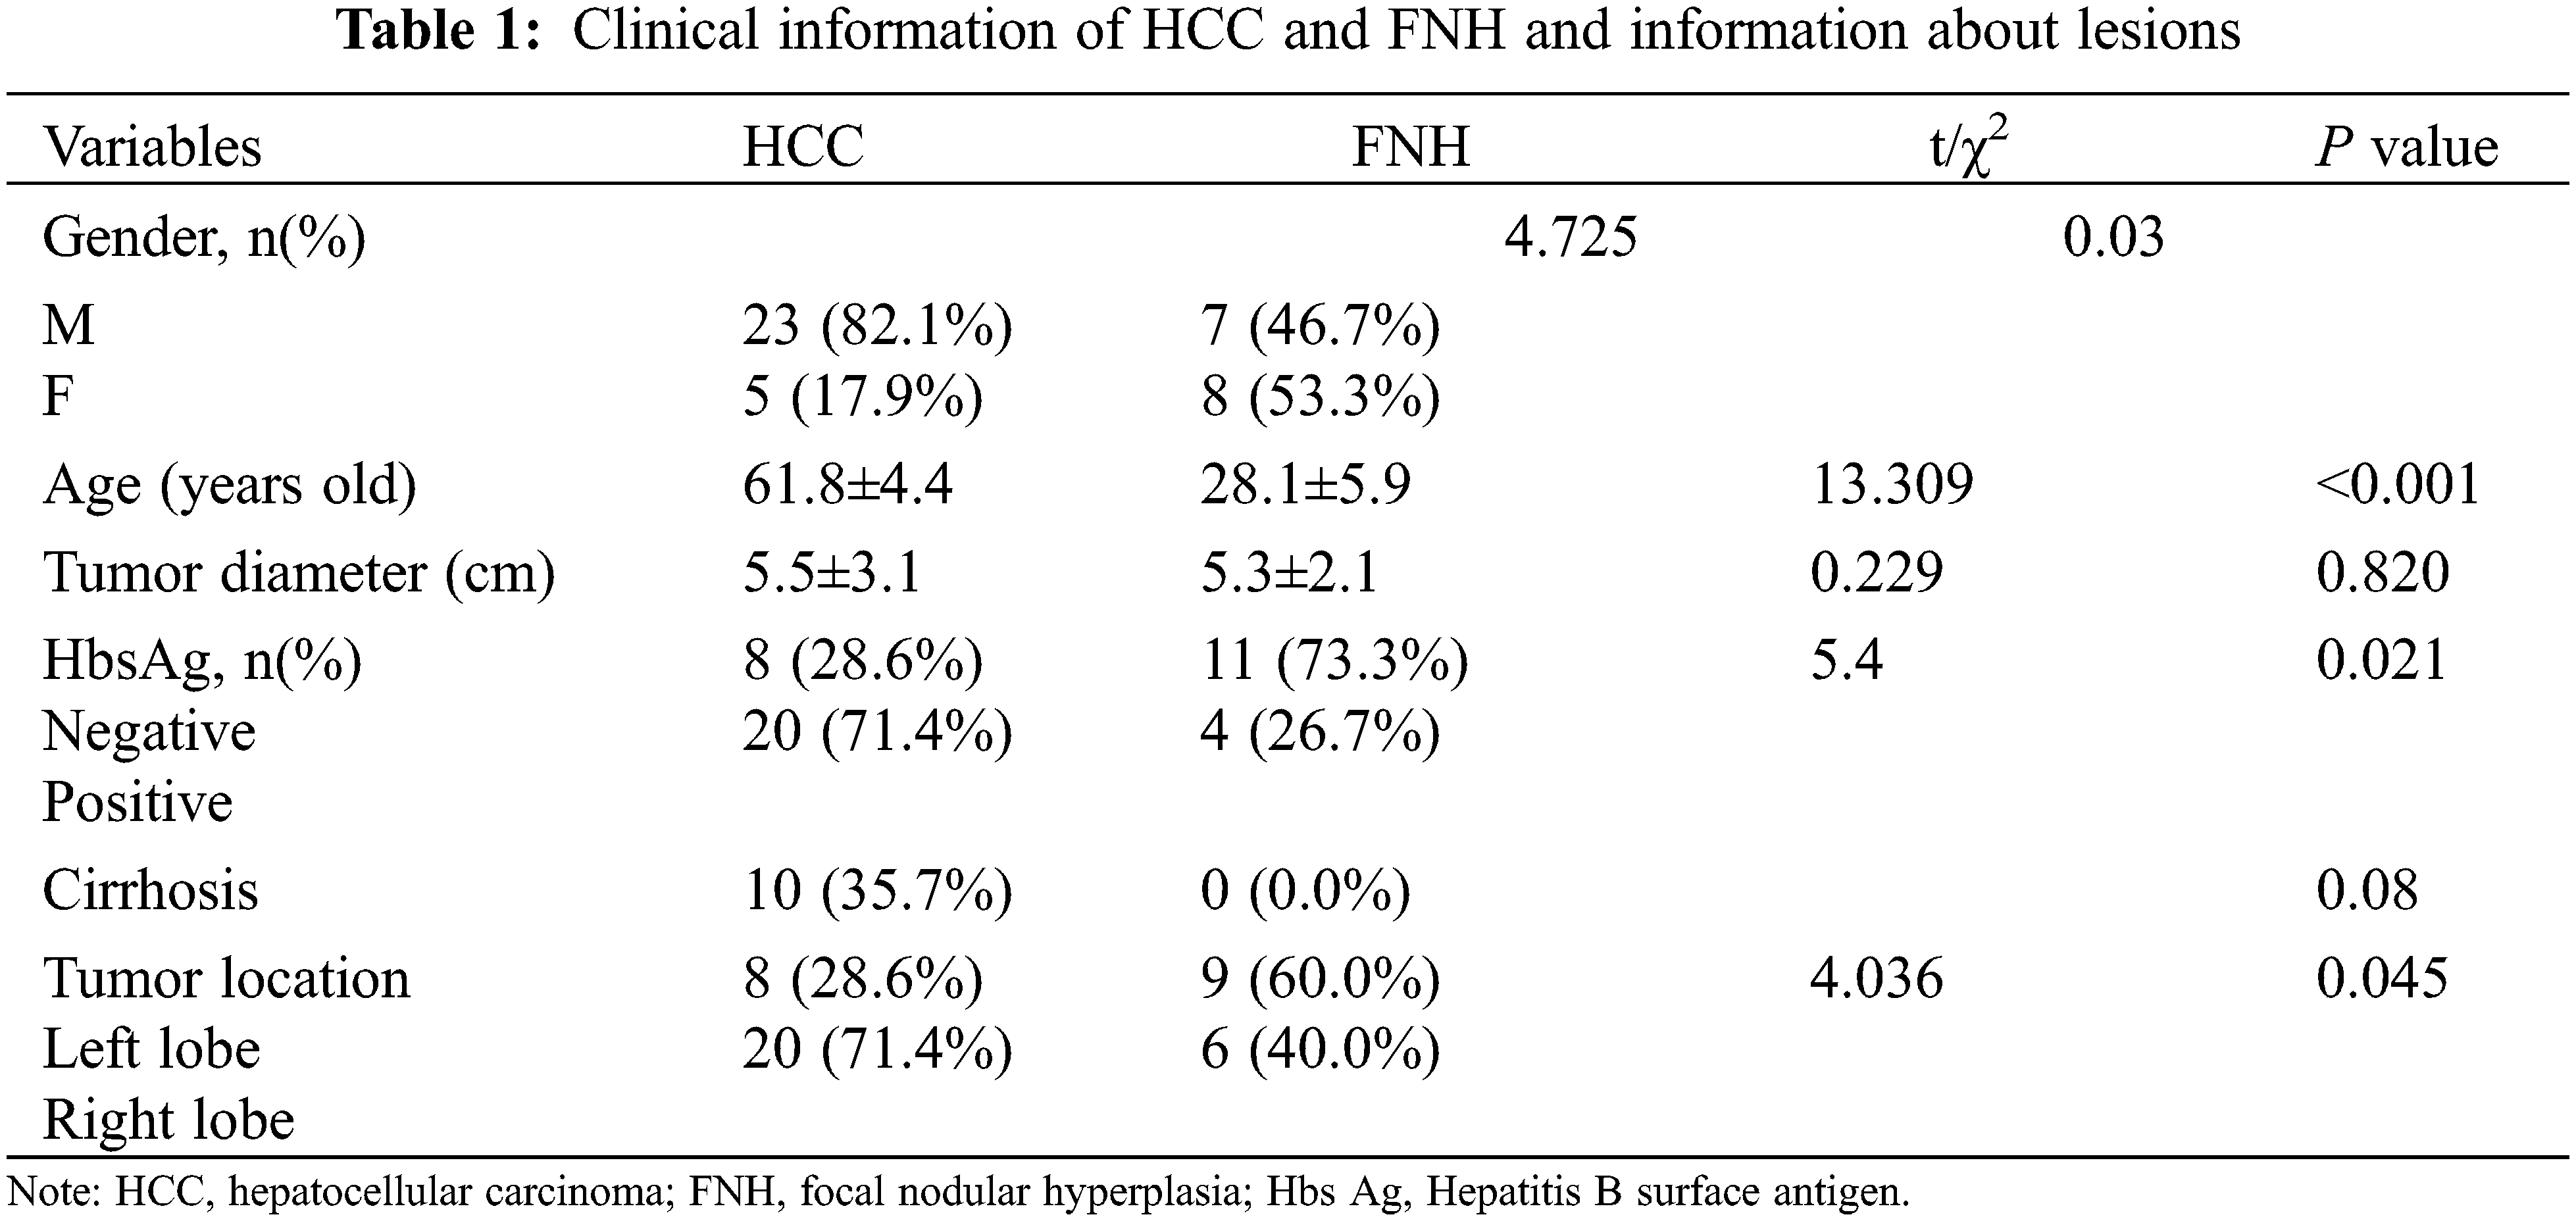
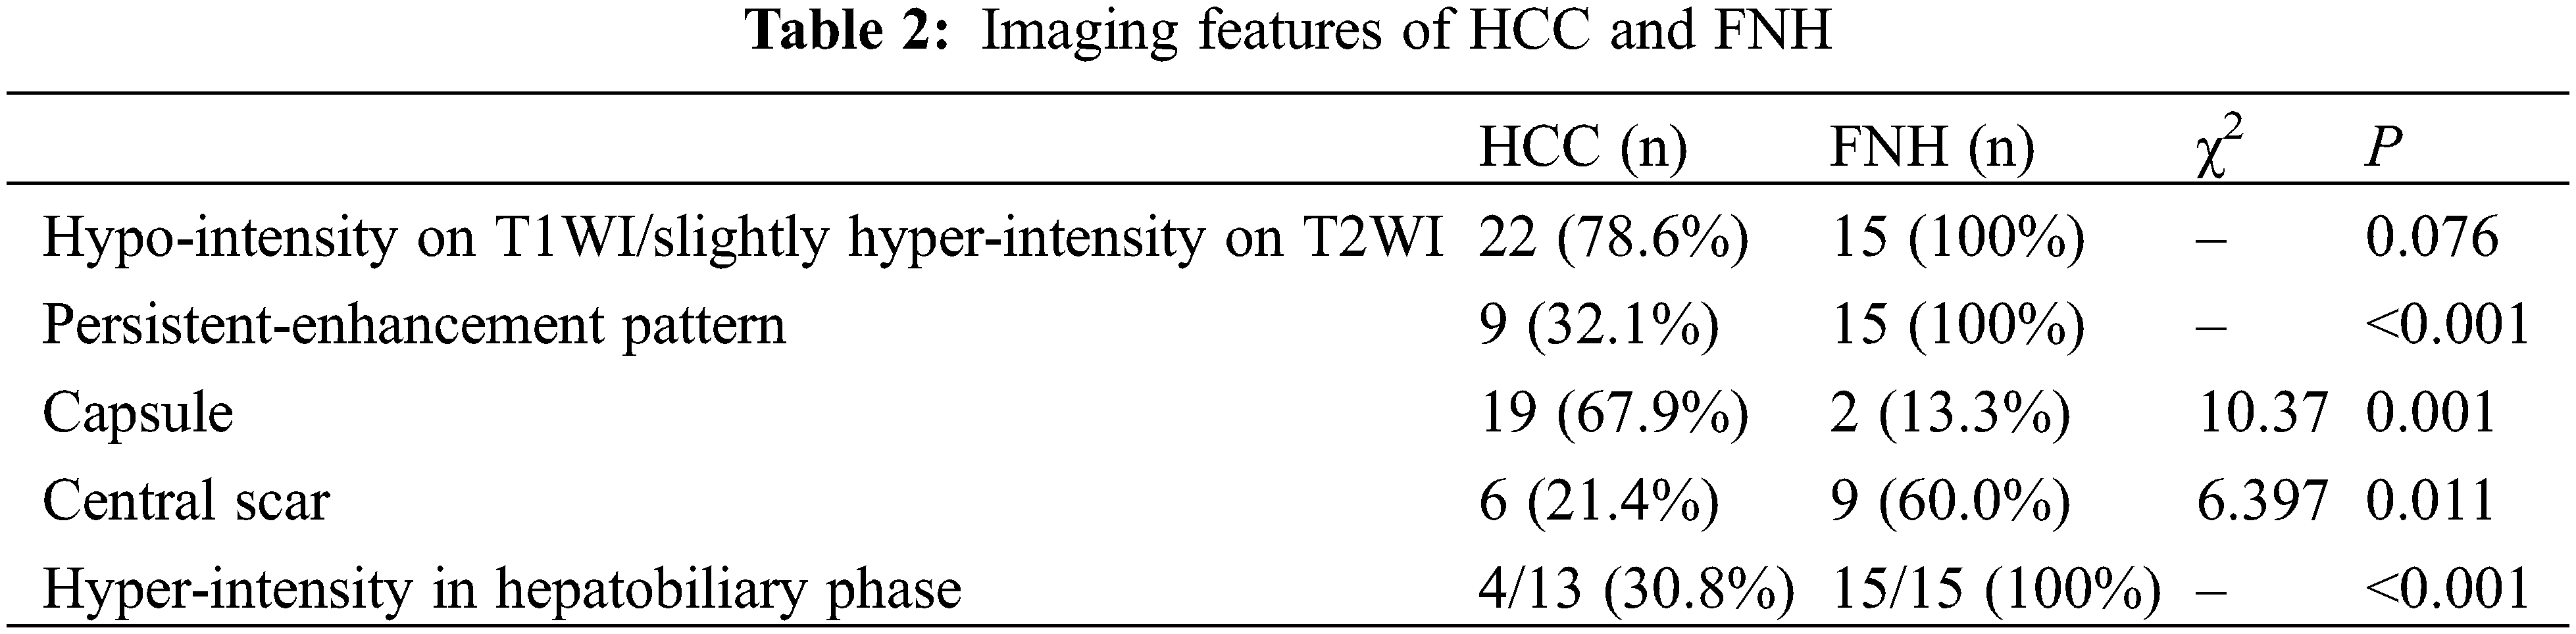
Due to obvious fatty metamorphosis, 6 cases in the HCC group showed a mixed signal intensity on T1WI and T2WI. The signal intensity decreased on the T1WI in-phase/opposed-phase (IP/OP) images. The remaining 22 HCC cases and all FNH cases revealed slight hypo-intensity on the T1WI and slight hyper-intensity on the T2WI. In the HCC group, a central scar was observed in 9 cases and a capsule was noted in 19 cases. On the other hand, in the FNH group, a central scar was noted in 9 cases and a capsule was noted in 2 cases. The enhancement pattern was persistent in 9 HCC cases. A “washin-washout” enhancement pattern was noted in the rest of the HCC lesions. GD-EOB-DTPA enhanced MR scanning was performed for 13 of the HCC cases, and 4 showed hyper-intensity in the hepatobiliary phase. All patients in the FNH group underwent GD-EOB-DTPA enhanced MR scanning and a persistent-enhancement pattern and hyper-intensity in the hepatobiliary phase (Table 2).
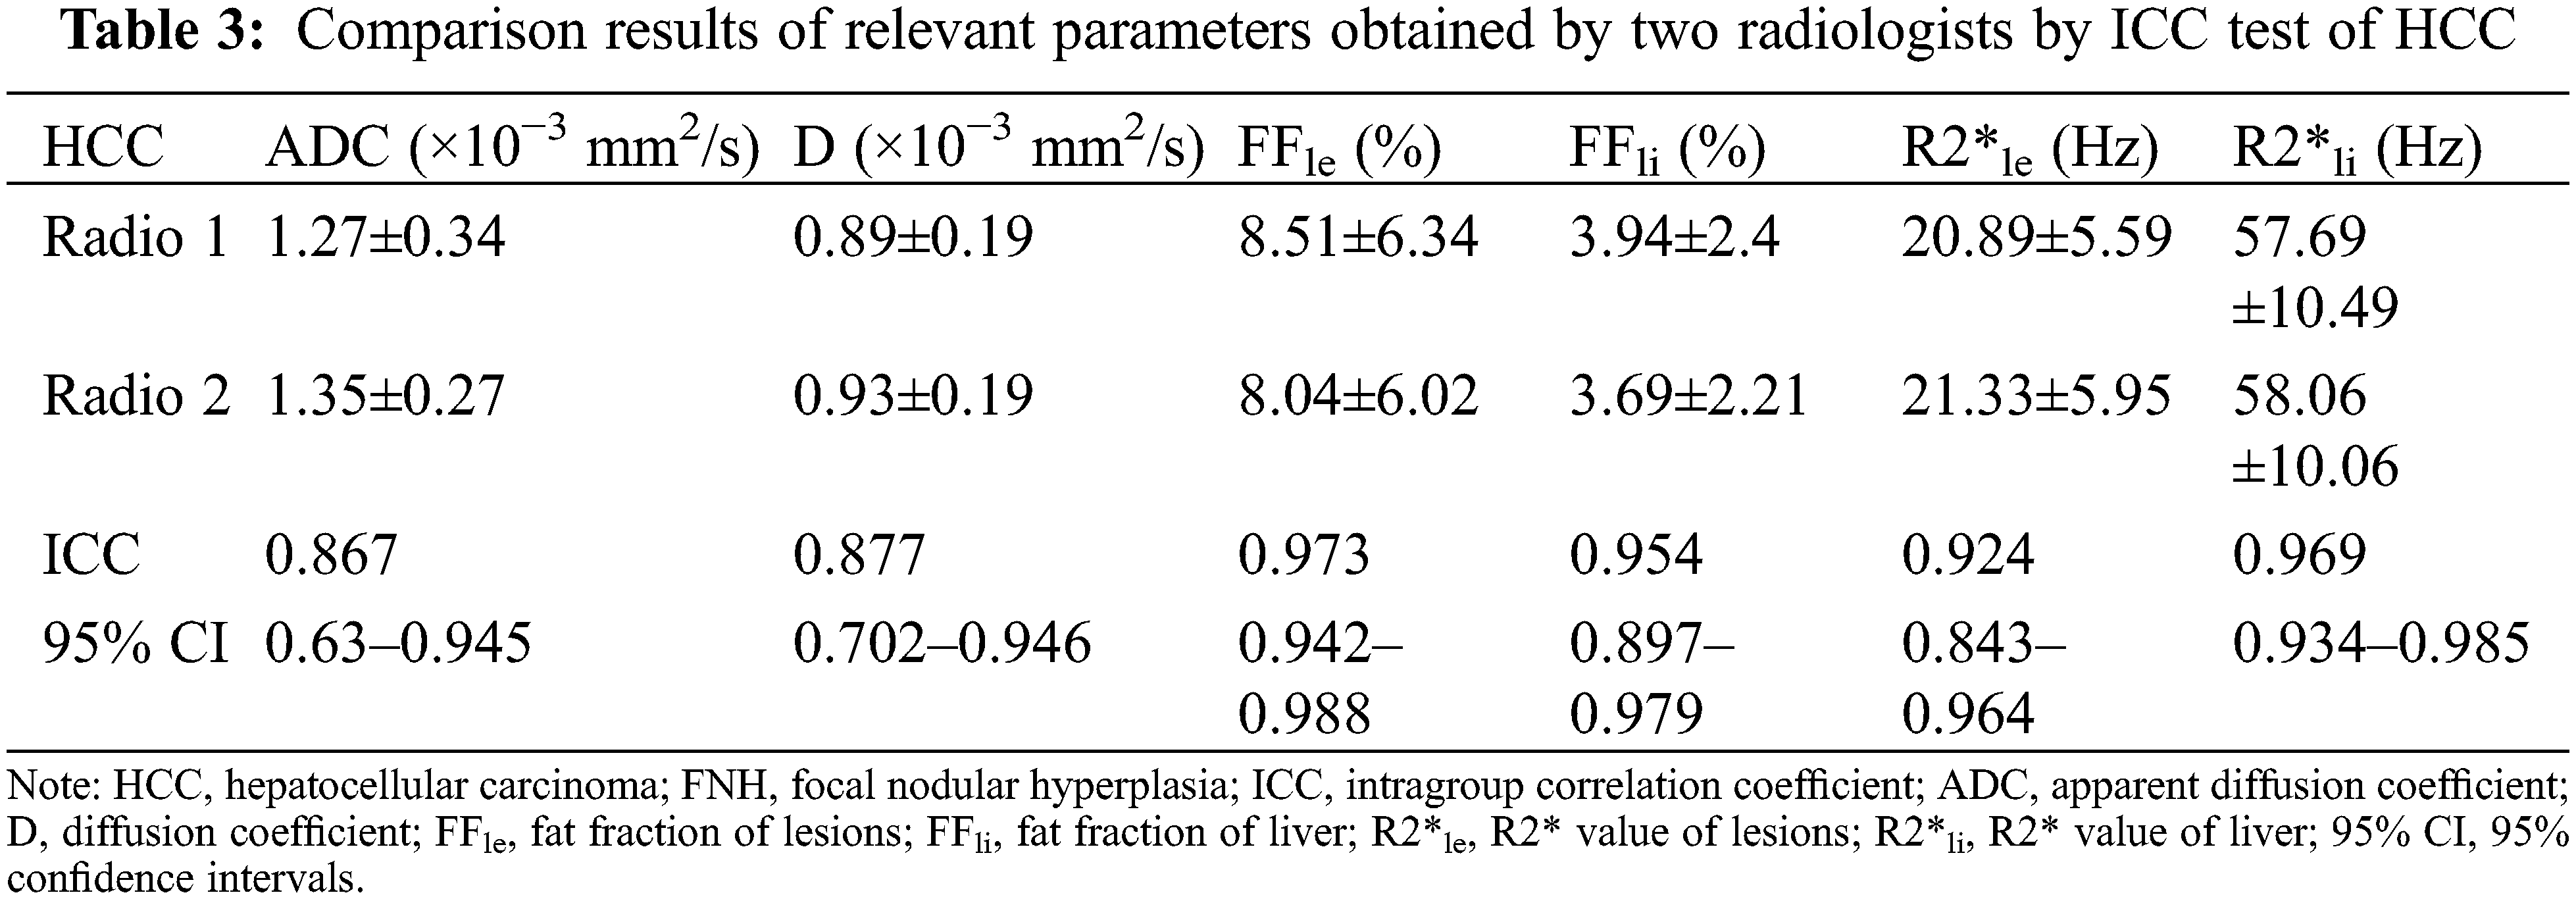
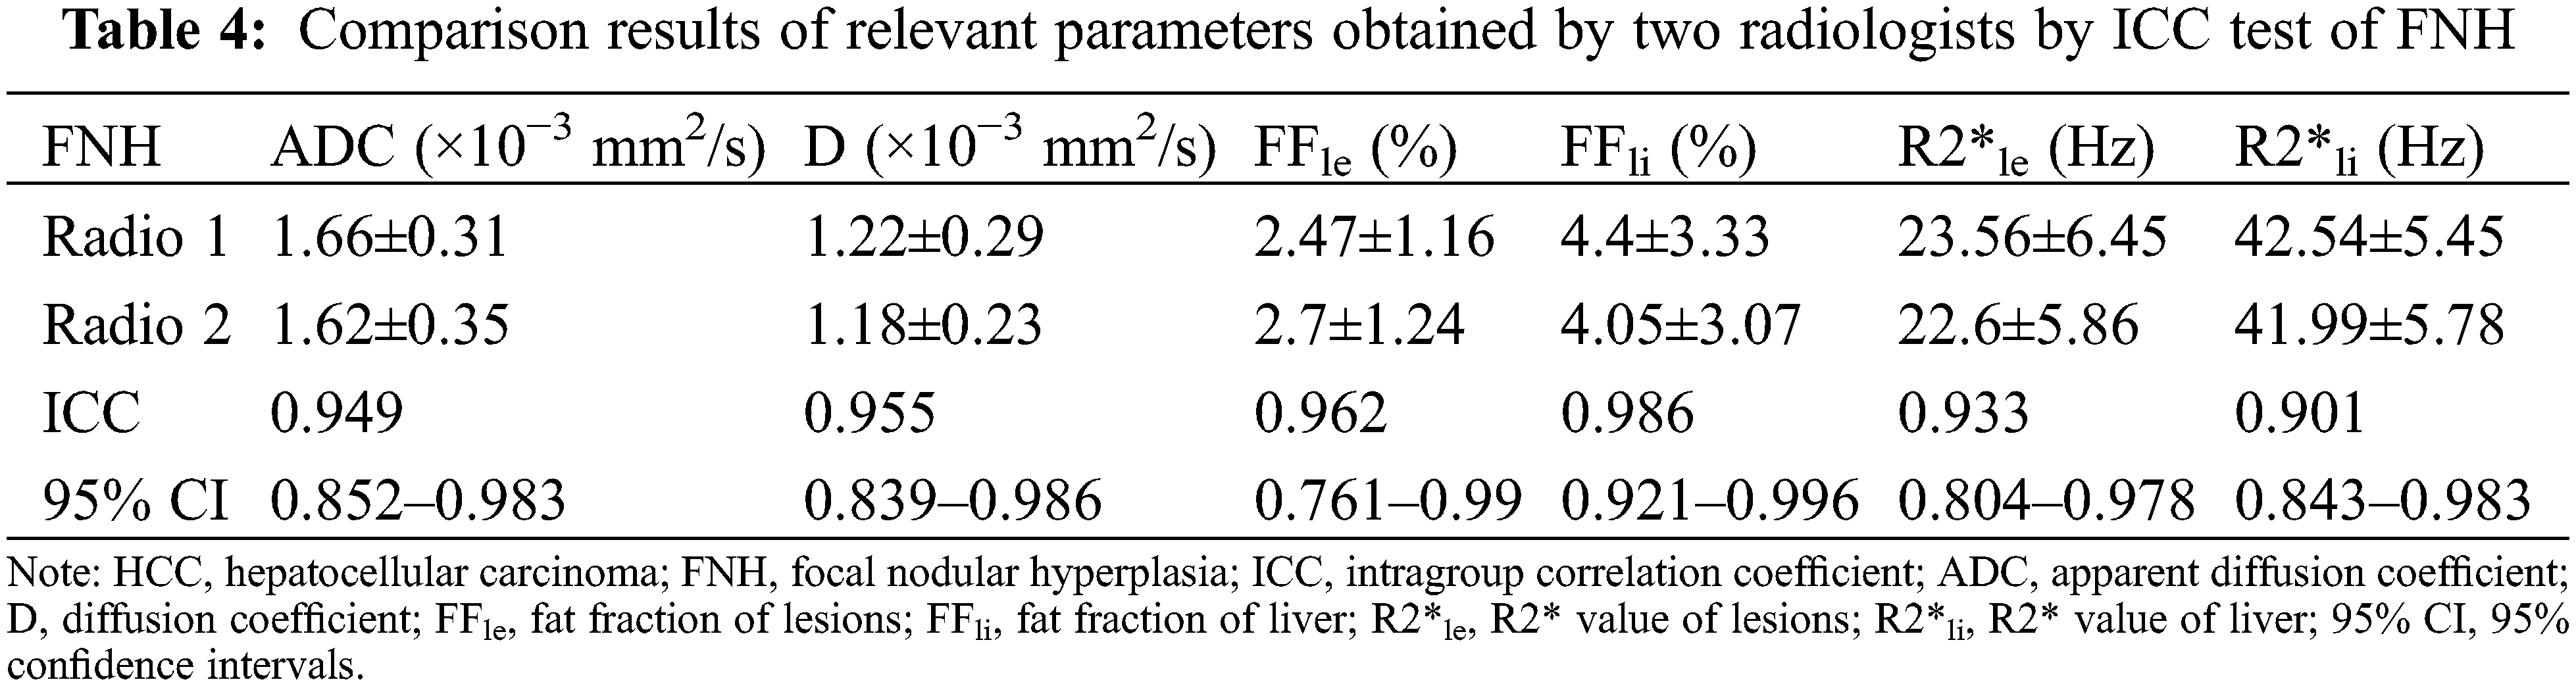
The ICCs of the parameters obtained by the two observers were all >0.75, indicating near perfect agreement between the two radiologists, and that the measurements were suitable for further statistical analysis (Tables 3 and 4).
ADC and D were significantly lower in the HCC group than in the FNH group, while the liver R2* and lesion FF were significantly higher in the HCC groups (all P < 0.05). The D*, f, lesion R2* and liver FF showed no significant difference between the HCC and FNH groups (all P > 0.05; Table 5). The AUCs of ADC, D and lesion FF were 0.854, 0.864 and 0.923, respectively (P < 0.001). The highest sensitivity and specificity rates were obtained using cut-offs of 1.44, 1.09 and 3.6, respectively (Table 6 and Figs. 1–3).
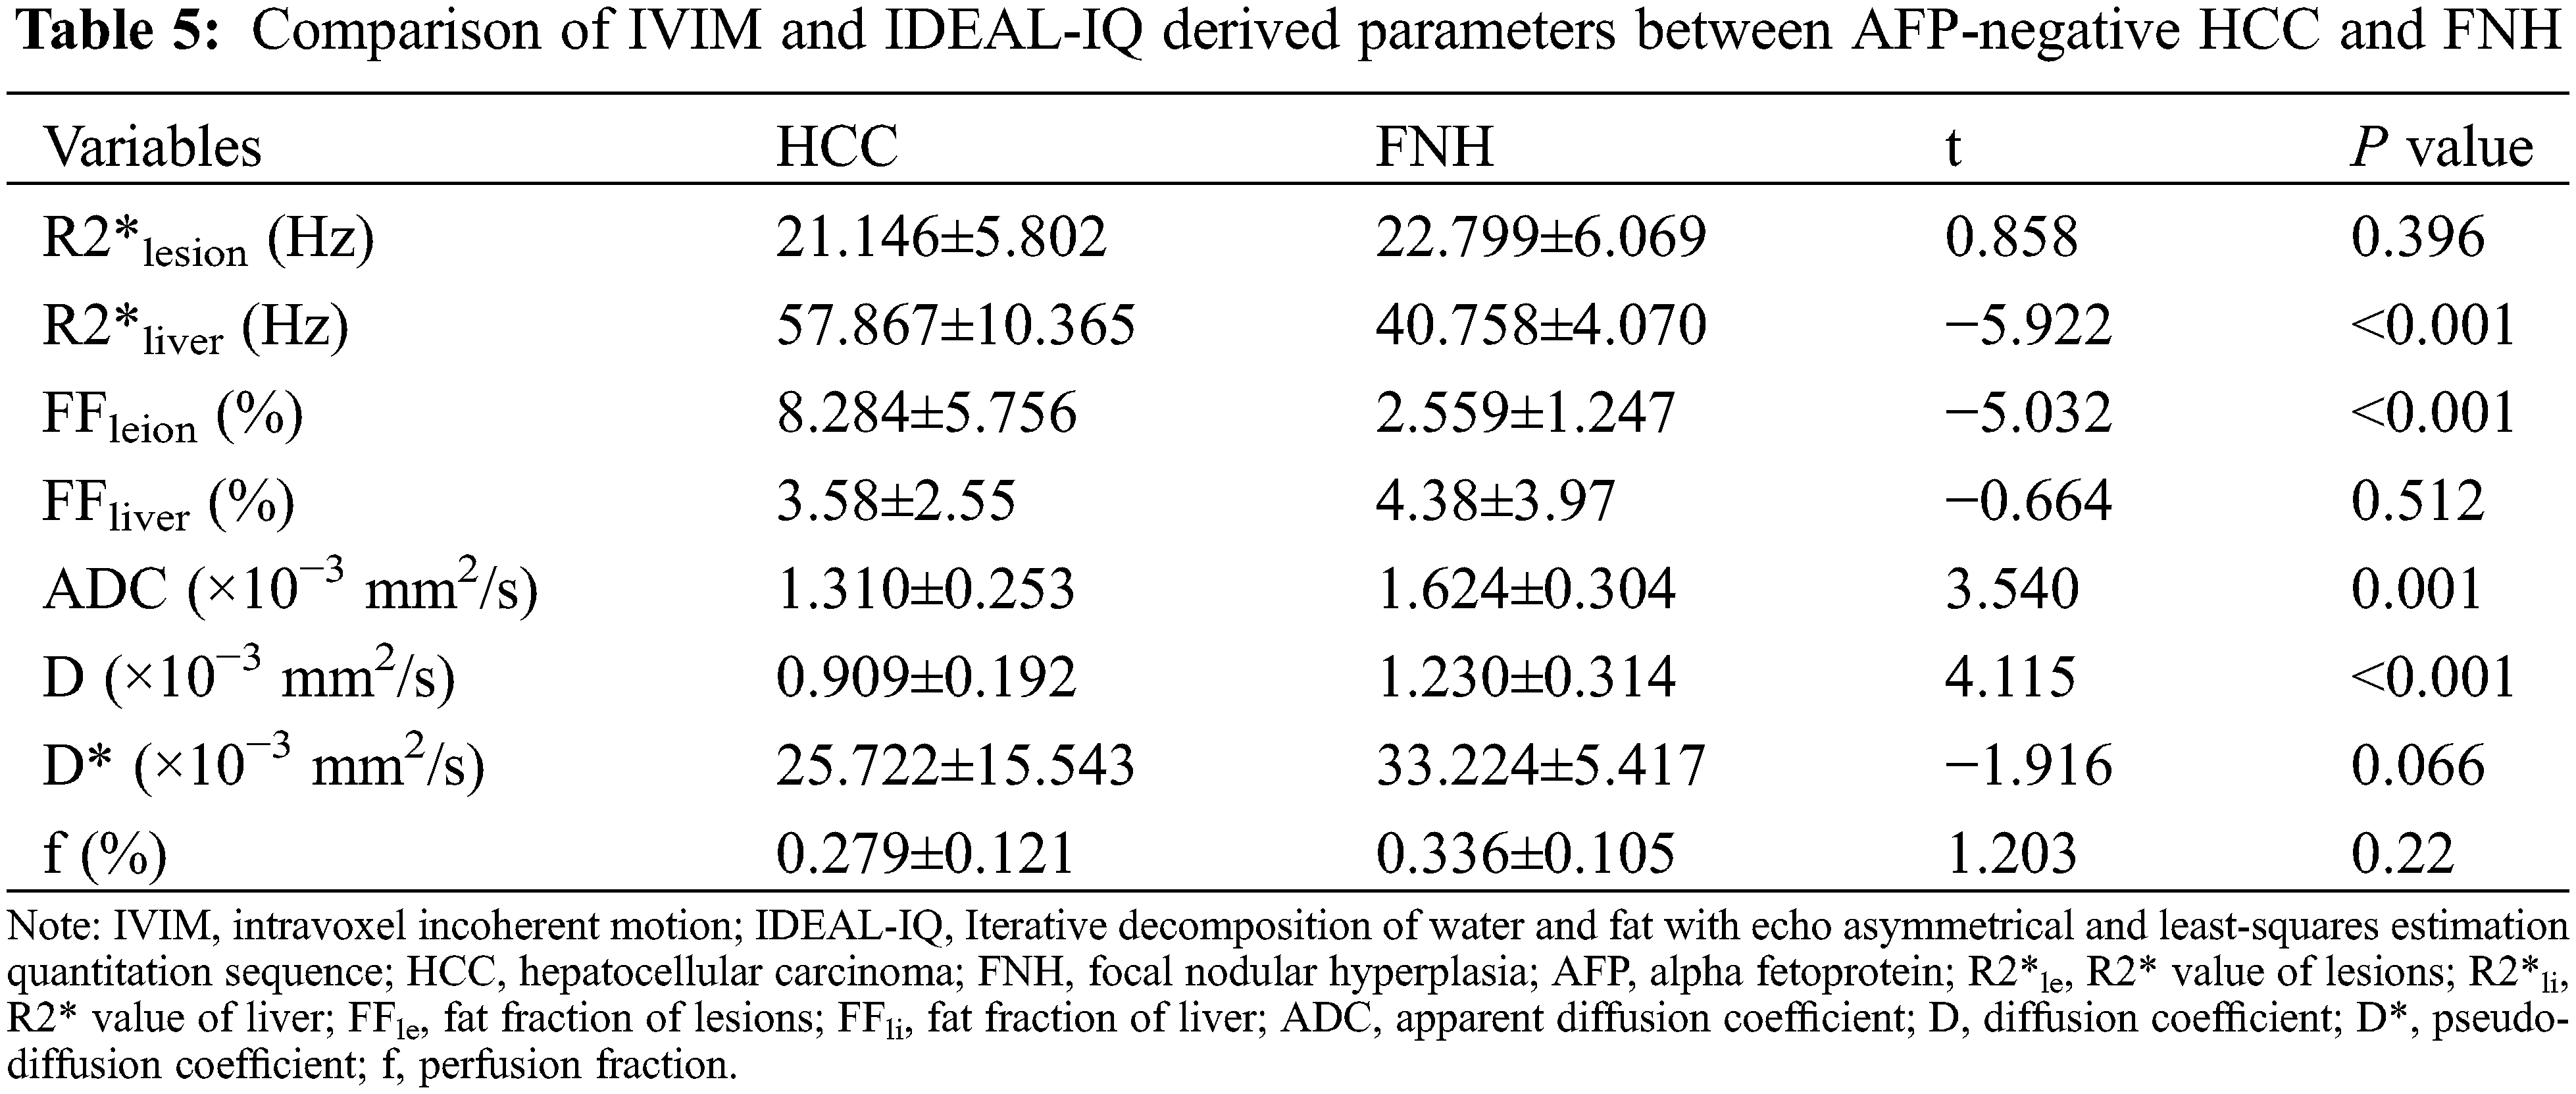
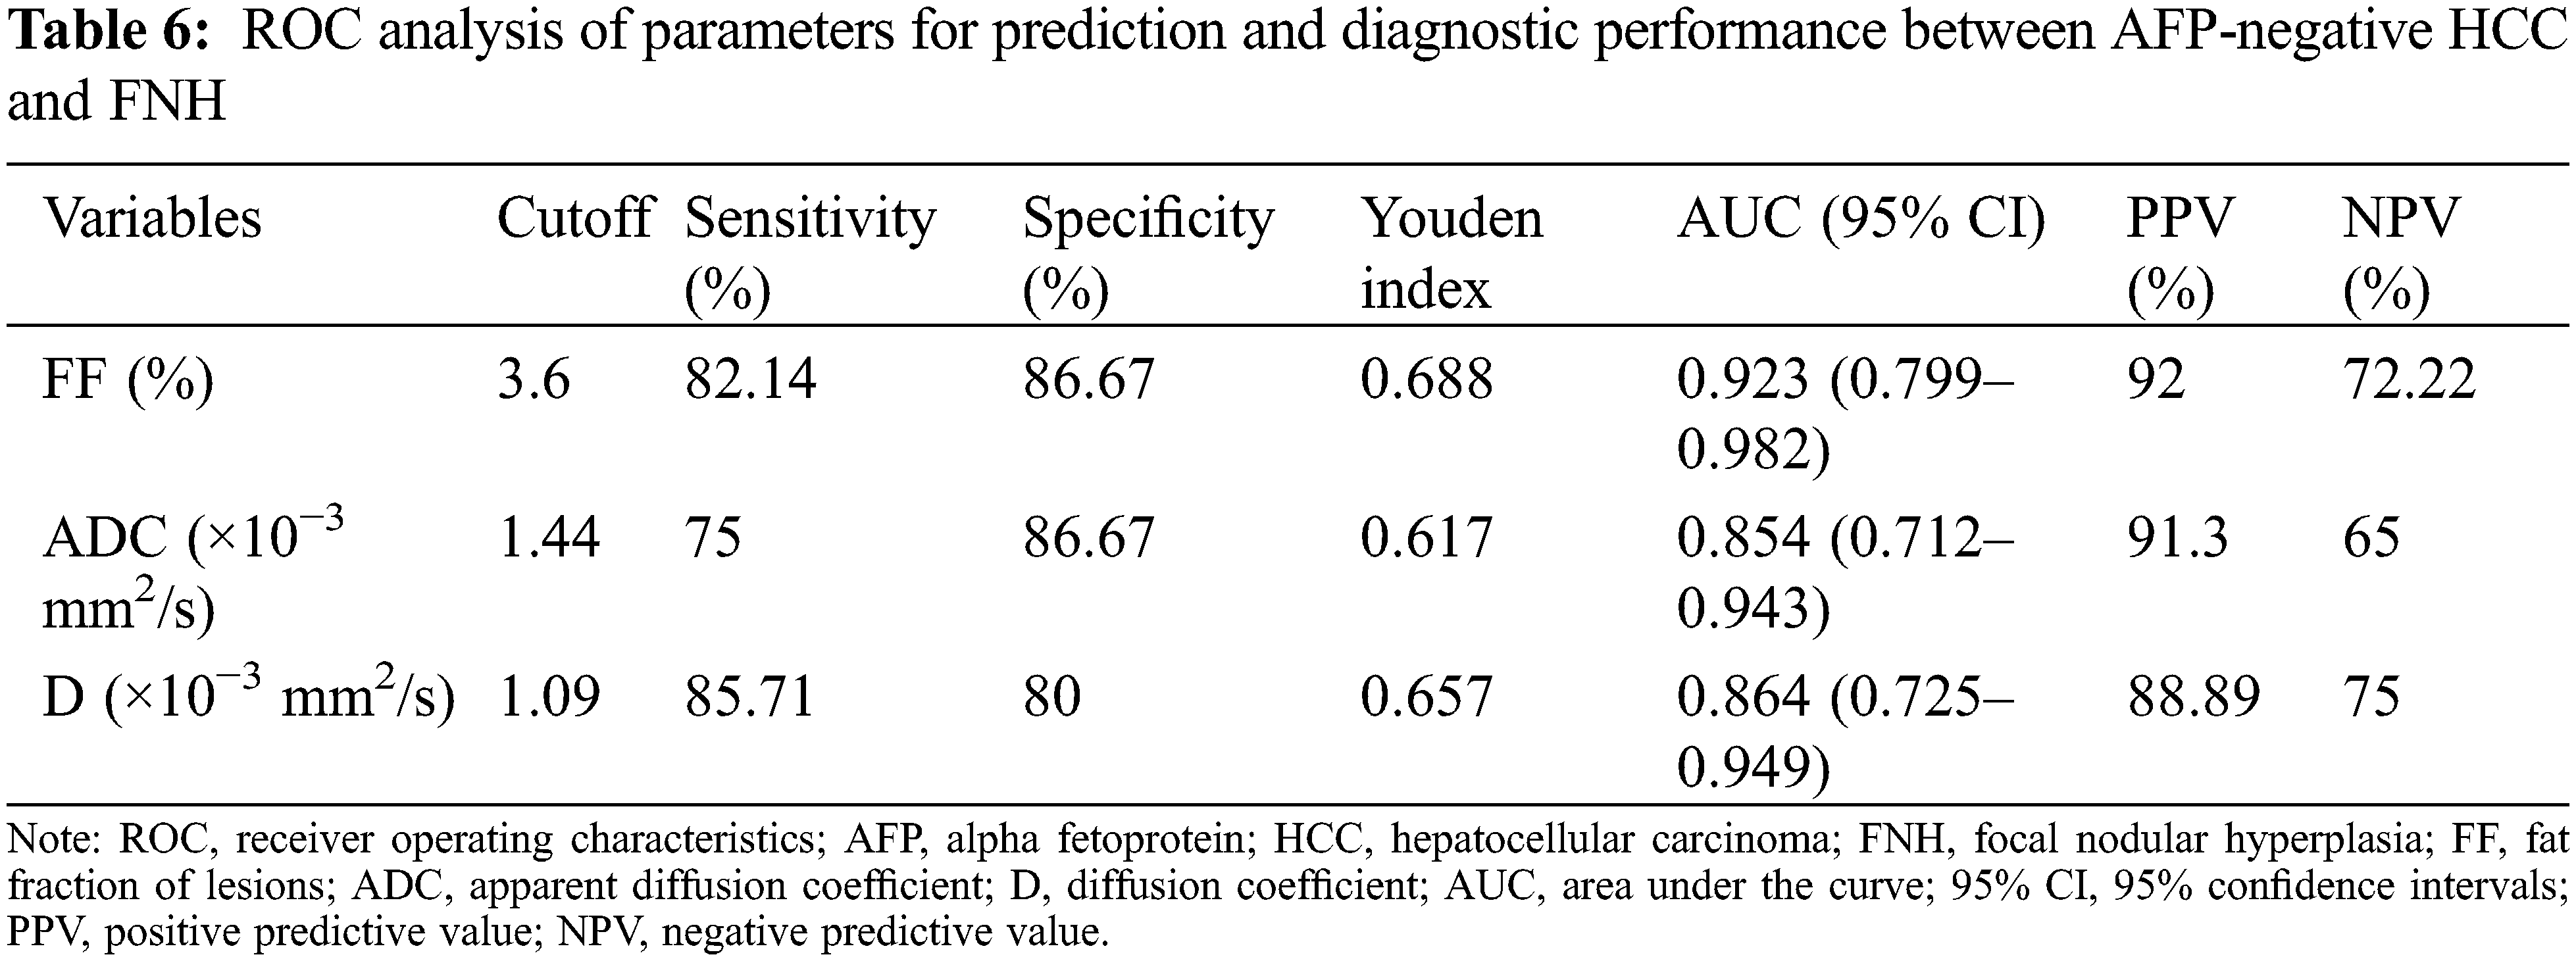
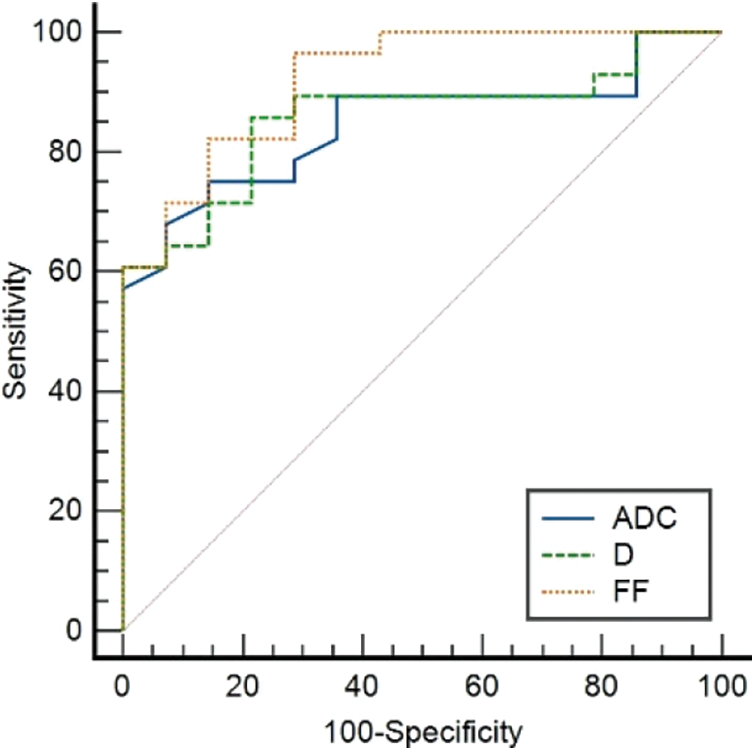
Figure 1: The ROC curves of ADC, D deprived from IVIM and FF deprived from IDEAL-IQ to distinguish AFP-negative HCC and FNH
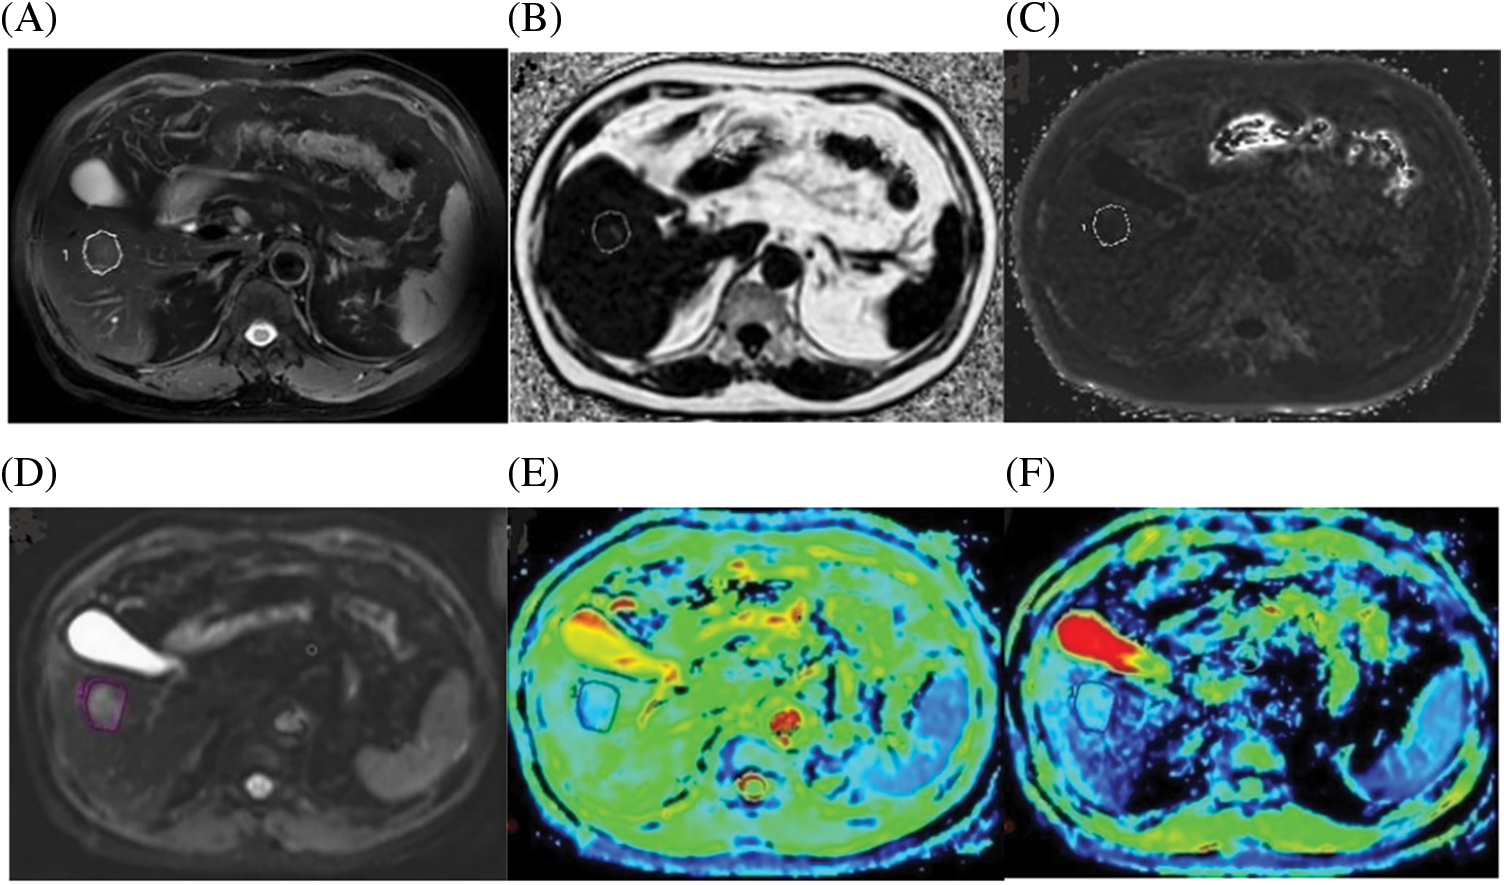
Figure 2: A case of a 72-year-old male with HCC confirmed by histopathology. (A) Axial fat-suppressed T2-weighted unenhanced image showing a freehand ROI. (B) Fat Fraction (FF) = 10.21%. (C) R2* relaxation rate = 21.56 Hz. (D) IVIM Diffusion-weighted image (b = 0 s/mm2), according to regular MRI sequences, shows a freehand ROI. (E) ADC = 1.042 A × 10−3 mm2/s. (F) D = 0.635 × 10⁻³ mm2/s
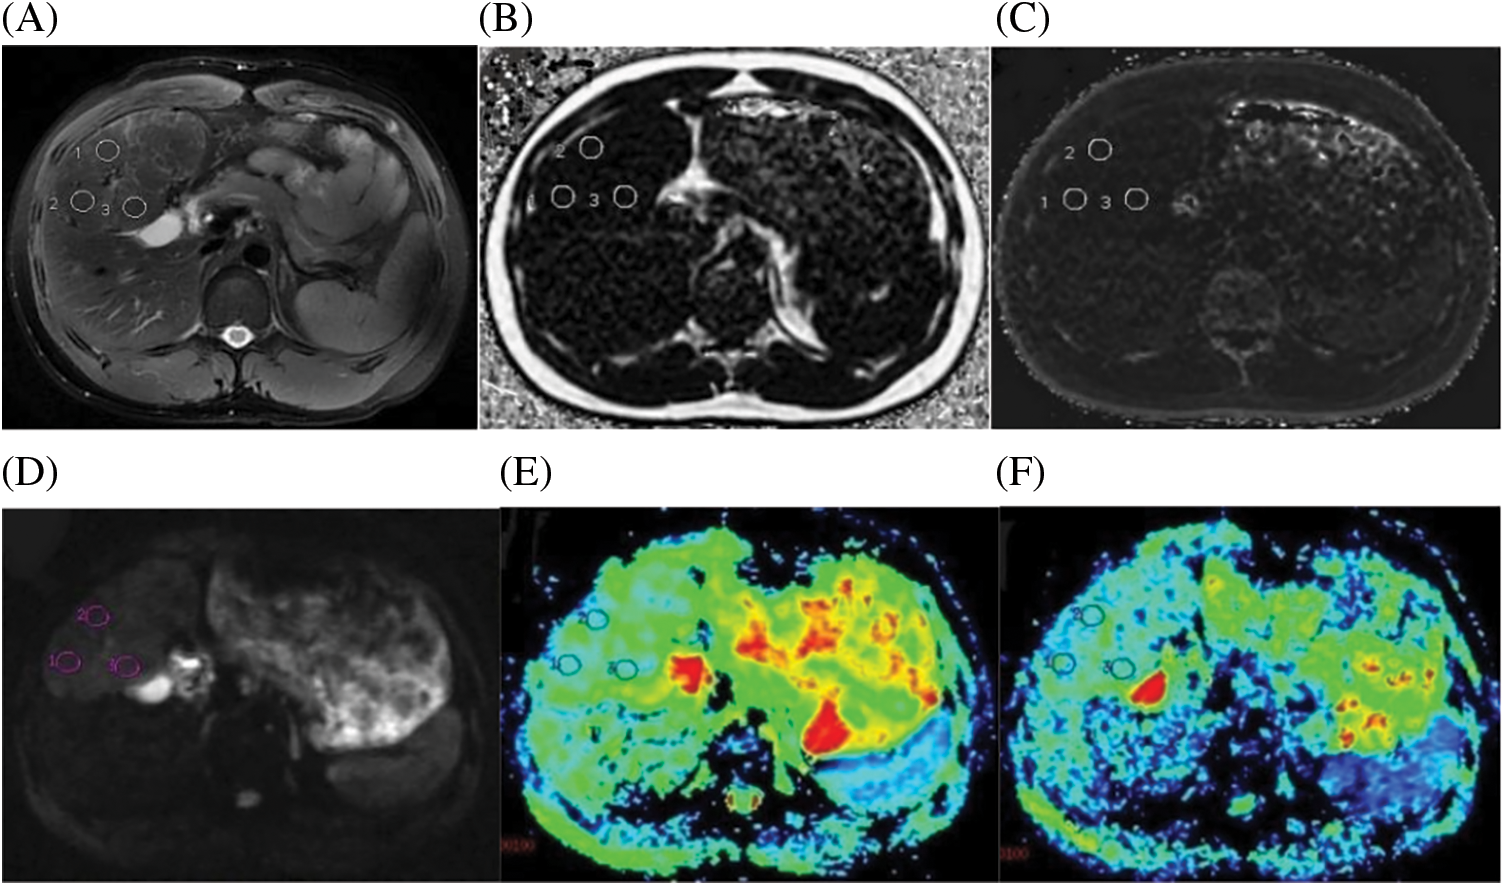
Figure 3: A case of a 21-year-old male with FNH confirmed by histopathology. (A) Axial fat-suppressed T2-weighted unenhanced image showed three circular ROIs with the same size. (B) Fat Fraction(FF) = 2.61%. (C) R2* relaxation rate = 21.68 Hz. (D) IVIM Diffusion-weighted image (b = 0 s/mm2) showing three circular ROIs, according to regular MRI sequences to avoid multiple internal foci of the necrosis area. (E) ADC = 1.45 × 10⁻³ mm2/s. (F) D = 1.138 × 10⁻³ mm2/s
HCC and FNH are focal hypervascular lesions of the hepatic system that tend to be associated with different medical histories. The AFP level is important for the differential diagnosis of HCC and FHN. Although AFP generally tends to be higher in HCC, the AFP levels of the HCC cases evaluated in our study were normal. This means that AFP is not always a reliable tumor marker for HCC, and thus there is a need to develop new non-invasive methods to characterize liver lesions. Therefore, this study aimed to evaluate the diagnostic efficacy of two different MRI techniques (IDEAL-IQ and IVIM-DWI) for the differential diagnosis of HCC and FHN lesions.
Consistent with our findings, previous studies reported that hepatitis B was more common in HCC patients than in FNH patients [21]. In terms of lesion size, although the average maximum diameter of HCC was smaller than that of FNH, the difference was not statistically significant (P > 0.05). Similar contrast enhancement patterns and signal intensities were noted for both lesions on the T1WI and T2WI. A central scar and capsule were also noted for both lesions. These findings confirmed that new imaging methods need to be developed to distinguish between HCC and FNH.
Our study showed that the ADC and D extracted from the IVIM images could detect histological differences accurately and reliably (ICC > 0.75). The mean values for both parameters significantly lower in HCC lesions when compared the FNH lesions. However, D* and f showed no significant difference between the two patient groups (P > 0.05). All these results are in line with previous studies [12,22,23], although there are some differences in the numerical values. These differences may be related to the following factors. First of all, the scanner manufacturers and types differed. In our study, we used a 3.0-T MRI scanner produced by GE Healthcare (Discovery MR750W), whereas other researchers used machines produced by Siemens or Philips. Additionally, the sequence parameters differed from those used in previous studies, especially for those used to acquire IVIM-DWI. There are currently no unified standards for acquiring IVIM-DWI such as b values. In this study, we used 12 different b-value up to a maximum of 1200 s/mm2. Moreover, variations in the pre-examination fasting time, the size and location of lesions, and the pathological characteristics of the lesions could also have contributed to differences in the numerical results between our study and previously published studies [1,24,25].
The average R2* liver value was higher in the HCC group than in the FNH group, while the average R2* lesions values were similar in the HCC and FNH groups and lower than the average R2* liver values. These results indicated that the liver in the HCC group was subject to iron overload while iron deficiency was present in both HCC and FNH lesions. Although iron is an essential trace element for human metabolism, excessive iron liver deposits may cause hepatocyte edema, degeneration, necrosis, an increase in the liver matrix, and accumulation of collagen fibers. This eventually leads to liver fibrosis, cirrhosis, and the development of HCC. Moreover, liver fibrosis will promote further iron deposition in the liver [26]. The possible mechanisms for this include the role iron plays in the production of oxygen free radicals, and secondary damage to hepatocyte nucleic acids [18]. In this study, most of the patients in the HCC group had a history of hepatitis B for many years, with varying degrees of liver fibrosis, cirrhosis, and iron deposition. In contrast, most of the patients in the FNH group had no history of hepatitis B, and the iron content in the liver was normal. As a result, the liver R2* values in HCC were higher than those in the FNH group. Pathological analysis showed that liver regeneration nodules develop into dysplastic nodules and finally evolve into HCC is combined with iron deficiency. It is considered an early feature of HCC in dysplastic nodule. Iron deficiency may be due to the tumor cells consuming high quantities of iron to meet the metabolic needs required for proliferation [27–29]. Studies have shown that the iron content is lower in HCC lesions when compared with the surrounding normal liver tissues, and the lesion iron content was found to be correlated with the pathological HCC grade [30].
FNH is a nodule composed of benign-appearing hepatocytes and is not a real neoplastic lesion. It is mainly composed of normal hepatocytes, blood vessels, bile ducts, and Kupffer cells. Not all patients diagnosed with FNH have chronic liver disease. Therefore, there is typically no iron overload in the liver in FNH patients. We speculate that the mechanism behind the R2* decrease in FNH is different from that in HCC. In HCC, the iron deficiency is caused by the tumor, while in FNH, it is caused by other clinical factors such as poor nutrition and malabsorption. In FNH, the ROIs contained hepatocytes, bile ducts, Kupffer cells, as well as other non-iron-containing components. The non-iron-containing components reduced the R2* value within the lesion. Furthermore, most of the patients in the HCC group had a history of hepatitis B and older, leading to a further reduction in the liver iron content. However, the R2* value within the HCC and FNH lesions did not differ significantly.
The FF differed significantly between the HCC and FNH groups (P < 0.05). FF also achieved the highest AUC of all the 4 evaluated parameters. These findings indicate that HCC is more commonly associated with fatty metamorphosis rather than iron deficiency. Studies have shown that the mechanism of fatty metamorphosis in HCC is related to the blood supply to the lesions [31–33]. In the transformation process from regeneration nodules to HCC, the main blood supply to the lesion seems to switch from the portal tracts to the arterioles. As a result, the contrast enhancement within the lesion changes as the disease progresses [32–35]. Furthermore, the hypervascularity rate is also closely correlated with the HCC grade [36]. As the disease progresses, the blood supply of the lesion will decrease and become insufficient. This leads to a state of hypoxia in the tumor cells, which affects their metabolism and leads to fatty metamorphosis. Studies showed that small well-differentiated HCCs are more likely to be associated with fatty metamorphosis [32,37]. Further pathological analysis showed that the number of arteries in HCC with fatty metamorphosis was significantly less than in HCC without fatty metamorphosis. Conversely, the number of veins did not change significantly [31,38]. However, the presence of fat in FNH is extremely rare. Some scholars propose that the occurrence of fatty metamorphosis in FNH has been associated with diffuse hepatic steatosis or compression of surrounding liver tissue by the lesion leading to ischemia or unknown by-products [39,40]. Contrary to the study by Tang [41], no significant difference in the liver FF values between the HCC group and FNH group (both less than 5%) was noted. A possible explanation for this finding could be that the etiology of liver fibrosis differs worldwide. In the western world, fibrosis is mostly caused by non-alcoholic fatty liver disease (NAFLD), diabetes, and obesity [42], whereas in China, it is mainly caused by hepatitis B. Although the mechanism is still not clear, studies have shown that liver fibrosis will affect the concordance of FF values with liver biopsy [43]. Furthermore, MR imaging measures the number of protons in lipid vs. water, while pathologic analysis measures the fraction of hepatocytes that show steatosis.
This study has several limitations that have to be acknowledged. The patient population in this study was small, and therefore larger studies are needed to confirm our findings. Moreover, in this study, one-third of the cases in the HCC group were well-differentiated, and only one case was poorly differentiated. The difference in HCC grade results in different diffusion and perfusion-related values. However, due to the small sample size, we could not analyze the impact of the pathological grade on the different MRI parameters. Finally, as the post-processing methods for IDEAL-IQ and IVIM-DWI were different, the location and size of the ROIs may not have been exactly the same. However, the ICCs between the two observers were all above 0.75, which indicates good agreement.
AFP-negative HCC and FNH are hypervascular lesions on contrast-enhanced CT and MRI scans, and their imaging features are sometimes similar. The parameters of FF derived from IDEAL-IQ, and ADC and D derived from IVIM-DWI, showed a good diagnostic efficiency for differentiating AFP-negative HCC and FNH. The diagnostic efficiency of FF was higher than ADC and D, which indicates that IDEAL-IQ may be a good complement to IVIM-DWI. The obvious fatty metamorphosis in the HCC lesions can be observed on routine MRI sequences, but in cases with limited fatty metamorphosis, we can obtain accurate results through FF value. The density of the tumor cells tends to be lower in high-grade HCC, while the ADC and D values tend to be higher when compared with low-grade HCC. As a result, HCC can be difficult to distinguish from FNH [1,44]. The IDEAL-IQ imaging technique provides a new and effective method for differentiating FNH from AFP-negative HCC.
Acknowledgement: We would like to thank TopEdit (www.topeditsci.com) for the English language editing of this manuscript.
Author Contributions: The authors confirm contribution to the paper as follows: study conception and design: Shaopeng LI, Kexue DENG, Jun QIU, Peng WANG; data collection: Shaopeng LI, Yiju XIE, Dawei YIN; analysis, interpretation of results and draft manuscript preparation: Shaopeng LI, Kexue DENG, Peng WANG. All authors reviewed the results and approved the final version of the manuscript.
Ethics Approval and Informed Consent Statement: This study was approved by the Ethics Committee of The First Affiliated Hospital of University of Science and Technology of China (Anhui Provincial Hospital) (Approval No. 2022-RE-031).
Availability of Data and Materials: All data are presented in the article and can be accessed by communicating with the corresponding author.
Funding Statement: The authors received no specific funding for this study.
Conflicts of Interest: The authors declare that they have no conflicts of interest to report regarding the present study.
References
1. Luo M., Zhang L., Jiang X. H., Zhang W. D. (2017). Intravoxel incoherent motion: Application in differentiation of hepatocellular carcinoma and focal nodular hyperplasia. Diagnostic and Interventional Radiology, 23(4), 263–271. DOI 10.5152/dir.2017.16595. [Google Scholar] [CrossRef]
2. Marin, D., Brancatelli, G., Federle, M. P., Lagalla, R., Catalano, C. et al. (2008). Focal nodular hyperplasia: Typical and atypical MRI findings with emphasis on the use of contrast media. Clinical Radiology, 63(5), 577–585. DOI 10.1016/j.crad.2007.06.011. [Google Scholar] [CrossRef]
3. Donati, F., Boraschi, P., Gigoni, R., Salemi, S., Falaschi, F. et al. (2013). Focal nodular hyperplasia of the liver: Diffusion and perfusion MRI characteristics. Magnetic Resonance Imaging, 31(1), 10–16. DOI 10.1016/j.mri.2012.06.031. [Google Scholar] [CrossRef]
4. Granito, A., Galassi, M., Piscaglia, F., Romanini, L., Lucidi, V. et al. (2013). Impact of gadoxetic acid (Gd-EOB-DTPA)-enhanced magnetic resonance on the non-invasive diagnosis of small hepatocellular carcinoma: A prospective study. Alimentary Pharmacology and Therapeutics, 37(3), 355–363. DOI 10.1111/apt.12166. [Google Scholar] [CrossRef]
5. Yoon, J. H., Lee, J. M., Yu, M. H., Kiefer, B., Han, J. K. et al. (2014). Evaluation of hepatic focal lesions using diffusion-weighted MR Imaging: comparison of apparent diffusion coefficient and intravoxel incoherent motion-derived parameters. Journal of Magnetic Resonance Imaging, 39(2), 276–285. DOI 10.1002/jmri.24158. [Google Scholar] [CrossRef]
6. Le, B. D., Breton, E., Lallemand, D., Aubin, M. L., Vignaud, J. et al. (1988). Separation of diffusion and perfusion in intravoxel incoherent motion MR imaging. Radiology, 168(2), 497–505. DOI 10.1148/radiology.168.2.3393671. [Google Scholar] [CrossRef]
7. Parikh, T., Drew, S. J., Lee, V. S., Wong, S., Hecht, E. M. et al. (2008). Focal liver lesion detection and characterization with diffusion-weighted MR imaging: Comparison with standard breath-hold T2-weighted imaging. Radiology, 246(3), 812–822. DOI 10.1148/radiol.2463070432. [Google Scholar] [CrossRef]
8. Gourtsoyianni, S., Papanikolaou, N., Yarmenitis, S., Maris, T., Karantanas, A. et al. (2008). Respiratory gated diffusion-weighted imaging of the liver: Value of apparent diffusion coefficient measurements in the differentiation between most commonly encountered benign and malignant focal liver lesions. European Radiology, 18(3), 486–492. DOI 10.1007/s00330-007-0798-4. [Google Scholar] [CrossRef]
9. Le, B. D., Breton, E., Lallemand, D., Grenier, P., Cabanis, E. et al. (1986). MR imaging of intravoxel incoherent motions: Application to diffusion and perfusion in neurologic disorders. Radiology, 161(2), 401–407. DOI 10.1148/radiology.161.2.3763909. [Google Scholar] [CrossRef]
10. Zhu, S. C., Liu, Y. H., Wei, Y., Li, L. L., Dou, S. W. et al. (2018). Intravoxel incoherent motion diffusion-weighted magnetic resonance imaging for predicting histological grade of hepatocellular carcinoma: Comparison with conventional diffusion-weighted imaging. World Journal of Gastroenterology, 24(8), 929–940. DOI 10.3748/wjg.v24.i8.929. [Google Scholar] [CrossRef]
11. Granata, V., Fusco, R., Catalano, O., Guarino, B., Granata, F. et al. (2016). Intravoxel incoherent motion (IVIM) in diffusion-weighted imaging (DWI) for Hepatocellular carcinoma: Correlation with histologic grade. Oncotarget, 7(48), 79357–79364. DOI 10.18632/oncotarget.12689. [Google Scholar] [CrossRef]
12. Zhang, H. X., Zhang, X. S., Kuai, Z. X., Zhou, Y., Sun, Y. F. et al. (2018). Determination of hepatocellular carcinoma and characterization of hepatic focal lesions with adaptive multi-exponential intravoxel incoherent motion model. Translational Oncology, 11(6), 1370–1378. DOI 10.1016/j.tranon.2018.08.011. [Google Scholar] [CrossRef]
13. Wang, Q., Ye, F., Ma, P. Q., Chen, F., Che, Y. Q. et al. (2019). Quantitative magnetic resonance imaging evaluation of hepatic fat content with iron deposition:will it be disturbed? Journal International Medical Research, 47(5), 1958–1974. DOI 10.1177/0300060519836033. [Google Scholar] [CrossRef]
14. Chen, Y. D., Long, L. L., Jiang, Z. J., Zhang, L., Zhong, D. L. et al. (2019). Quantification of pancreatic proton density fat fraction in diabetic pigs using MR imaging and IDEAL-IQ sequence. BMC Medical Imaging, 19(1), 38. DOI 10.1186/s12880-019-0336-2. [Google Scholar] [CrossRef]
15. Permutt, Z., Le, T. A., Peterson, M. R., Seki, E., Brenner, D. A. et al. (2012). Correlation between liver histology and novel magnetic resonance imaging in adult patients with non-alcoholic fatty liver disease-MRI accurately quantifies hepatic steatosis in NAFLD. Alimentary Pharmacology and Therapeutics, 36(1), 22–29. DOI 10.1111/j.1365-2036.2012.05121.x. [Google Scholar] [CrossRef]
16. Ognard, J., Demany, N., Mesrar, J., Aho-Glélé, L. S., Saraux, A. et al. (2021). Mapping the medullar adiposity of lumbar spine in MRI: A feasibility study. Heliyon, 7(1), e05992. DOI 10.1016/j.heliyon.2021.e05992. [Google Scholar] [CrossRef]
17. Meng, X. Y., Chen, X., Shen, Y. Q., Hu, X. M., Tang, H. et al. (2017). Proton-density fat fraction measurement: A viable quantitative biomarker for differentiating adrenal. European Journal of Radiology, 86(1), 112–118. DOI 10.1016/j.ejrad.2016.11.001. [Google Scholar] [CrossRef]
18. Kew, M. C. (2014). Hepatic iron overload and hepatocellular carcinoma. Liver Cancer, 3(1), 31–40. DOI 10.1159/000343856. [Google Scholar] [CrossRef]
19. Zhang, J. B., Krinsky, G. A. (2004). Iron-containing nodules of cirrhosis. NMR in Biomedicine, 17(7), 459–464. DOI 10.1002/nbm.926. [Google Scholar] [CrossRef]
20. Han, D. H., Choi, G. H., Kim, K. S., Choi, J. S., Park, Y. N. et al. (2013). Prognostic significance of the worst grade in Hepatocellular carcinoma with heterogeneous histologic grades of differentiation. Journal of Gastroenterology and Hepatology, 28(8), 1384–1390. DOI 10.1111/jgh.12200. [Google Scholar] [CrossRef]
21. Park, S. J., Jang, J. Y., Jeong, S. W., Cho, Y. K., Lee, S. H. et al. (2017). Usefulness of AFP, AFP-L3, and PIVKA-II,and their combinations in diagnosing hepatocellular carcinoma. Medicine, 96(11), e5811. DOI 10.1097/MD.0000000000005811. [Google Scholar] [CrossRef]
22. Jerjir, N., Bruyneel, L., Haspeslagh, M., Quenet, S., Coenegrachts, K. (2017). Intravoxel incoherent motion and dynamic contrast-enhanced MRI for differentiation between hepatocellular adenoma and focal nodular hyperplasia. The British Journal of Radiology, 90(1076), DOI 10.1259/bjr.20170007. [Google Scholar] [CrossRef]
23. Luo, M., Zhang, L., Jiang, X. H., Zhang, W. D. (2017). Intravoxel incoherent motion diffusion-weighted imaging: Evaluation of the differentiation of solid hepatic lesions. Translational Oncology, 10(5), 831–838. DOI 10.1016/j.tranon.2017.08.003. [Google Scholar] [CrossRef]
24. Dyvorne, H., Jajamovich, G., Kakite, S., Kuehn, B., Taouli, B. (2014). Intravoxel incoherent motion diffusion imaging of the liver: Optimal b-value subsampling and impact on parameter precision and reproducibility. European Journal of Radiology, 83(12), 2109–2113. DOI 10.1016/j.ejrad.2014.09.003. [Google Scholar] [CrossRef]
25. Zhao, W., Liu, W. G., Liu, H. P., Yi, X. P., Hou, J. L. et al. (2018). Preoperative prediction of microvascular invasion of hepatocellular carcinoma with IVIM diffusion-weighted MR imaging and Gd-EOB-DTPA-enhanced MR imaging. PLoS One, 13(5), e0197488. DOI 10.1371/journal.pone.0197488. [Google Scholar] [CrossRef]
26. Tao, R., Zhang, J. Q., Dai, Y. M., You, Z. L., Fan, Y. et al. (2012). An in vitro and in vivo analysis of the correlation between susceptibility-weighted imaging phase values and R2* in cirrhotic livers. PLoS One, 7(9), e45477. DOI 10.1371/journal.pone.0045477. [Google Scholar] [CrossRef]
27. Gurusamy, K. (2007). Trace element concentration in primary liver cancers-a systematic review. Biological Trace Element Research, 118(3), 191–206. DOI 10.1007/s12011-007-0008-x. [Google Scholar] [CrossRef]
28. Holmström, P., Gåfvels, M., Eriksson, L. C., Dzikaite, V., Hultcrantz, R. et al. (2006). Expression of iron regulatory genes in a rat model of hepatocellular carcinoma. Liver International, 26(8), 976–985. DOI 10.1111/j.1478-3231.2006.01316.x. [Google Scholar] [CrossRef]
29. Golfeyz, S., Lewis, S., Weisberg, I. S. (2018). Hemochromatosis: Pathophysiology, evaluation, and management of hepatic iron overload with a focus on MRI. Expert Review of Gastroenterology and Hepatology, 12(8), 767–778. DOI 10.1080/17474124.2018.1496016. [Google Scholar] [CrossRef]
30. Li, R. K., Palmer, S. L., Zeng, M. S., Qiang, J. W., Chen, F. et al. (2015). Detection of endogenous iron reduction during hepatocarcinogenesis at susceptibility-weighted MR imaging: Value for characterization of hepatocellular carcinoma and dysplastic nodule in cirrhotic live. PLoS One, 10(11), e0142882. DOI 10.1371/journal.pone.0142882. [Google Scholar] [CrossRef]
31. Toyoda, H., Fukuda, Y., Hayakawa, T., Kumada, T., Nakano, S. (1997). Changes in blood supply in small hepatoceilular carcinoma: Correlation of angiographic images and immunohistochemical findings. Journal of Hepatology, 27(4), 654–660. DOI 10.1016/S0168-8278(97)80082-7. [Google Scholar] [CrossRef]
32. Kutami, R., Nakashima, Y., Nakashima, O., Shiota, K., Kojiro, M. (2000). Pathomorphologic study on the mechanism of fatty change in small hepatocellular carcinoma of humans. Journal of Hepatology, 33(2), 282–289. DOI 10.1016/S0168-8278(00)80369-4. [Google Scholar] [CrossRef]
33. Huh, J., Kim, K. W., Kim, J., Yu, E. (2015). Pathology-MRI correlation of hepatocarcinogenesis: Recent update. Journal of Pathology and Translational Medicine, 49(3), 218–229. DOI 10.4132/jptm.2015.04.15. [Google Scholar] [CrossRef]
34. Choi, B. I. (1998). Hepatocarcinogenesis in liver cirrhosis: Imaging diagnosis. Journal of Korean Medical Science, 13(2), 103–116. DOI 10.3346/jkms.1998.13.2.103. [Google Scholar] [CrossRef]
35. Fournier, L. S., Cuenod, C. A., de Bazelaire, C., Siauve, N., Rosty, C. et al. (2004). Early modifications of hepatic perfusion measured by functional CT in a rat model of hepatocellular carcinoma using a blood pool contrast agent. European Radiology, 14(11), 2125–2133. DOI 10.1007/s00330-004-2339-8. [Google Scholar] [CrossRef]
36. Yamamoto, K., Shiraki, K., Deguchi, M., Sugimoto, K., Sakai, T. et al. (2002). Diagnosis of hepatocellular carcinoma using digital subtraction imaging with the contrast agent, Levovist: Comparison with helical CT, digital subtraction angiography, and US angiography. Oncology Reports, 9(4), 789–792. DOI 10.3892/or.9.4.789. [Google Scholar] [CrossRef]
37. Yu, J. S., Chung, J. J., Kim, J. H., Kim, K. W. (2007). Fat-containing nodules in the cirrhotic liver: Chemical shift MRI features and clinical implications. American Journal of Roentgenology, 188(4), 1009–1016. DOI 10.2214/AJR.06.0756. [Google Scholar] [CrossRef]
38. Choi, J. Y., Lee, J. M., Sirlin, C. B. (2014). CT and MR imaging diagnosis and staging of hepatocellular carcinoma: Part I. Development, growth, and spread: Key pathologic and imaging aspects. Radiology, 272(3), 635–654. DOI 10.1148/radiol.14132361. [Google Scholar] [CrossRef]
39. Stanley, G., Jeffrey Jr, R. B., Feliz, B. (2002). CT findings and histopathology of intratumoral steatosis in focal nodular hyperplasia: Case report and review of the literature. Journal of Computer Assisted Tomography, 26(5), 815–817. DOI 10.1097/00004728-200209000-00025. [Google Scholar] [CrossRef]
40. Eisenberg, L. B., Warshauer, D. M., Woosley, J. T., Cance, W. G., Bunzendahl, H. et al. (1995). CT and MRI of hepatic focal nodular hyperplasia with peripheral steatosis. Journal of Computer Assisted Tomography, 19(3), 498–500. DOI 10.1097/00004728-199505000-00028. [Google Scholar] [CrossRef]
41. Tang, A., Desai, A., Hamilton, G., Wolfson, T., Gamst, A. et al. (2015). Accuracy of MR imaging-estimated proton density fat fraction for classification of dichotomized histologic steatosis grades in nonalcoholic fatty liver disease. Radiology, 274(2), 416–425. DOI 10.1148/radiol.14140754. [Google Scholar] [CrossRef]
42. Zhou, J. H., Cai, J. J., She, Z. G., Li, H. L (2019). Noninvasive evaluation of nonalcoholic fatty liver disease: Current evidence and practice. World Journal of Gastroenterology, 25(11), 1307–1326. DOI 10.3748/wjg.v25.i11.1307. [Google Scholar] [CrossRef]
43. Idilman, I. S., Aniktar, H., Idilman, R., Kabacam, G., Savas, B. et al. (2013). Hepatic steatosis: Quantification by proton density fat fraction with MR imaging versus liver biopsy. Radiology, 267(3), 767–775. DOI 10.1148/radiol.13121360. [Google Scholar] [CrossRef]
44. Zhu, S. C., Liu, Y. H., Wei, Y., Li, L. L., Dou, S. W. et al. (2018). Intravoxel incoherent motion diffusion-weighted magnetic resonance imaging for predicting histological grade of hepatocellular carcinoma: Comparison with conventional diffusion-weighted imaging. World Journal of Gastroenterology, 24(8), 929–940. DOI 10.3748/wjg.v24.i8.929. [Google Scholar] [CrossRef]
Cite This Article
 Copyright © 2022 The Author(s). Published by Tech Science Press.
This work is licensed under a Creative Commons Attribution 4.0 International License , which permits unrestricted use, distribution, and reproduction in any medium, provided the original work is properly cited.
 Downloads
 Citation Tools