
 Submit a Paper
 Propose a Special lssue
 Open Access
ARTICLE
A UHPLC/MS/MS Assay Based on an Isotope-Labeled Peptide for Sensitive miR-21 Detection in HCC Serum
1
Department of Laboratory Medicine, School of Public Health, Nantong University, Nantong, 226001, China
2
Department of Clinical Laboratory, Affiliated Hospital of Nantong University, Nantong, 226001, China
3
Department of Hepatology Laboratory, Nantong Third Hospital Affiliated to Nantong University, Nantong, 226006, China
* Corresponding Authors: Feng Wang. Email: ; Ruoyu Yuan. Email:
# These authors contributed equally to this work.
Oncologie 2022, 24(3), 513-526. https://doi.org/10.32604/oncologie.2022.024373
Received 29 May 2022; Accepted 17 August 2022; Issue published 19 September 2022
 View Full Text
 Download PDF
Abstract
Background: MicroRNAs (miRNAs) have been identified as promising novel biomarkers for cancer diagnosis and prognosis, especially for hepatocellular carcinoma (HCC). Nowadays, the expression level of miR-21 in serum samples is a diagnostic indicator for HCC diagnosis. Thus, the quantitative determination of miRNA concentration is of significance in clinical practice. It is particularly important to establish an analytical detection method for miR-21 in patient serum. Methods: The signal readout for miR-21 was based on the mass response of a reporter peptide using an isotope dilution mass spectrometry (MS) method in this work. To be more specific, miR-21 was biotinylated before being coupled with streptavidin (SA) agarose and then hybridized with a newly synthesized DNA-peptide probe. The release and purification of the sample was based on the method including trypsin digestion, solid-phase extraction, and drying, and the detection of the reporter peptide was carried out by UHPLC/MS/MS. The miR-21 in the corresponding samples was quantified by the ratio of the chromatographic peak area of the redissolved polypeptide to that of the isotope-labeled polypeptide. Additionally, within the calibration range, the performance of the method (including precision, accuracy, linearity, and recovery) was evaluated. Results: The concentration of miR-21 was determined using the ratio of relative peak area of stable isotope-labeled internal standard and reporter peptide, yielding a linear range of 0.1∼30.0 nM (y = 0.0818x + 0.7554, R2 = 0.9586, P < 0.01). The limit of detection (LOD) for miR-21 was 10 pM. For y5 , the recoveries (n = 3) were 91.36 ± 2.19%, 93.64 ± 3.55%, and 96.04 ± 2.02% for the levels of three miR-21 samples including RL, RM, and RH, respectively. Conclusions: Overall, this research provides a novel analytical approach for quantitative detection of miRNAs in clinical serum samples.Keywords
MicroRNAs (miRNAs) are a class of small single-stranded non-coding RNAs that regulate gene expression [1–3]. They are involved in various primary cellular processes such as cell proliferation, migration, and apoptosis. Besides, they are also found to be associated with the development of many cancers [4–6]. Among the miRNA associated diseases, hepatocellular carcinoma (HCC) has been reported as one of the most prevalent malignant tumors, with a poor prognosis and a high mortality rate [7–9]. Currently, several studies have indicated that abnormal miRNA expression, especially miR-21, is associated with HCC patient tissues, cells, and serum [10,11]. Thus, the level of miR-21 is directly related to and prevalent in human cancers [12–14].
The miR-21 expression level was found to be significantly higher in different types of malignant tumors, including liver cancer, lung cancer, etc. [15]. Recently, some studies have reported that miR-21 was overexpressed in the serum of HCC patients, indicating it could play an important role in tumorigenesis and could have clinical significance in treatment. As a result, miR-21 can be a latently expressed biomarker for initial HCC diagnosis. As one of the earliest miRNAs discovered in the human genome, miR-21 is a classical miRNA. A large number of literatures have confirmed that miR-21 is highly expressed in a variety of human tumors and cancer cell lines, plays an important role in carcinogenesis, and is associated with high proliferation, low apoptosis, high invasion and metastasis potential of tumor cells. It is different from other miRNAs that have inconsistent effects in various tumors. More and more studies have shown that miR-21 plays an important role in the occurrence and development of tumors, and shows great potential in the diagnosis, treatment and prognosis of tumor diseases, which has important research value. Since miR-21 is an oncogene that has been proven in various cancers, it is crucial to detect it. If the expression level of miR-21 can be detected quickly, it will play a certain role in the auxiliary diagnosis of cancer. Therefore, we chose miR-21 as the miRNA for the experiment, and also conducted preliminary experiments.
It is generally accepted that the significance of miRNAs as biomarkers is based on the quantification in patient samples. Therefore, accurate detection of miRNA expression is crucial. Common methods for quantitative miRNA detection can be classified into two groups: indirect methods (i.e., quantitative reverse transcription PCR (qRT-PCR) [16–19], gene chip methods, and high-throughput sequencing technology (RNA-seq) [20] and direct methods (i.e., electrochemistry [21], capillary electrophoresis [22–24], and laser desorption ionization time-of-flight mass spectrometry (LDI-TOF-MS)). However, these conventional methods often have issues for being insensitive, leading to qualitative results to a limited extent [25–27]. To solve the problem, various signal amplification methodologies have been developed as indirect methods for miRNA quantification to obtain high sensitivity. In contrast, the readout amplification is normally not required for direct miRNA quantification. Mass spectrometry (MS) has shown great potential in miRNA analysis [28]. However, the method for directly miRNAs is sometimes not sensitive enough, and the quantitative results might be inaccurate. As a result, a novel and sensitive approach for direct quantification of miRNAs is urgently required.
Considering all the above-mentioned factors, we have developed a sensitive miRNA-detecting assay based on an isotope dilution MS approach. MS is considered as one of the most powerful measurement techniques, with great specificity and sensitivity [29]. It is also a widely used method for accurately quantifying compounds. As a result, it has the potential to be an effective method for miRNAs quantification. In this study, miR-21 was biotinylated and coupled with streptavidin agarose into complex. Then, the complexes were captured using synthetic peptide complementary DNA probes. Furthermore, the complexes were analyzed using MS after trypsin digestion. The readout (y) was obtained as the ratio of two chromatographic peak areas between the redissolved polypeptide and the isotope-labeled polypeptide. The horizontal vibrable (x) was the different concentrations of the working solution of the corresponding miR-21 standard. Thus, the methodological evaluation could be conducted by linear fitting and the quantitative level of miR-21 in serum could be determined to estimate the analyte concentration in samples [30].
MiR-21 single-stranded RNA was synthesized by Sangon Biotech Co., Ltd. (Shanghai, China). The DNA peptide probe (5′-TCAACATCAGTCTGATAAGCTA-3′-PEG2-GDRALFVPEPNR) was synthesized by Taihe Biotechnology Co., Ltd. (Hangzhou, China) in this work. The peptide (ALFVPEPNR) and the isotope-labeled peptide (A[13C615N]LFVPEPNR) for MS detection were synthesized by Qiangyao Biological Technology Co., Ltd. (Shanghai, China). The streptavidin agarose was purchased from Life Technologies Co., Ltd. (USA). offered RNase-free BSA was got from Ambion Co., Ltd. (USA). PierceTM RNA 3′ end Biotinylation Kit was purchased from Thermo Fisher Scientific Inc. (USA). The sequence modified trypsin was bought from Promega Company (USA).
Furthermore, NH4HCO3 and formic acid (FA) was purchased from Fluke Company (USA). Methanol and pure acetonitrile were got from J.T. Baker Company (USA). Dithiothreitol (DTT), iodoacetamide (IAM), phosphate buffer saline (PBS), and urea were achieved from Sigma-Aldrich Company (USA). Ultra-pure water used in this study were provided by the Milli-Q ultra-pure water system (Merck Millipore, Germany). AB Sciex 5500 Triple Quadrupole Mass Spectrometer (Applied Biosystems Co., Ltd., USA) equipped with an electrospray ionization was used for detection. In addition, Nexera X2 Ultra-High Performance Liquid Chromatograph (Shimadzu, Japan) was used for sample purification. Sep-pak C18 cartridges (60 mg, 3 mL) solid-phase extraction column and SymmetryShieldTMRP18 chromatographic column (2.1 mm × 150 mm, 3.5 μm) were bought from Waters Company (USA). The ABN2ZA nitrogen generator was purchased from PEAK Company (USA). The N2 Evaporation System NV-15G nitrogen blowing instrument was bought from Agela Technologies (Germany). G560E vortex mixer was offered by Scientific Industries Company (USA). The AllegraTM 64R desktop high-speed refrigerated centrifuge was bought from BECKMAN COULTER (USA). CSB-10BT Ultrasonic cleaner was purchased from Aipu Instrument Co., Ltd. (Hangzhou, China). DKB-501S Thermostatic water bath was bought from Jinghong Experimental Equipment Co., Ltd. (Shanghai, China). The hybridizer instrument was purchased from Woxin Instrument Manufacturing Co., Ltd. (Wuxi, China).
2.2 Patients and Sera Samples Collection
The collection of serum for this investigation was approved by the Ethics Committee of Nantong University’s Affiliated Hospital. In addition, all individuals provided written informed consent before the study. Forty HCC patients and forty healthy volunteers were selected to participate in the study. The HCC patients, including 25 males and 15 females, were in an age range of 41∼64 years old, with a mean of 49.5 ± 6.8 years (median age 54 years). The diagnosis of each HCC patient was independently confirmed by hyphological study. The ages of the healthy volunteer ranged from 50 to 55 years (median age was 52 years), including 28 males and 12 females. Each subject’s peripheral blood was collected in the morning, and the blood samples were centrifuged and stored at −80°C.
2.3 Biotinylation of miRNA and Hybridization
The biotinylation kit and miRNA (extracted RNA) were taken out of the freezer and kept on ice. After all the kit’s components (except 30% PEG) were dissolved, 5 μL of miRNA (extracted RNA) was transferred into a microEP tube, followed by performing the labeling reaction. The final components were reacted at 16°C for 2 h and then ligated overnight to obtain a high ligation efficiency. After that, 100 μL of streptavidin agarose magnetic beads were reacted with 10 μL (10 mg/mL) BSA. Then, 20 μL of the biotinylated RNA was reacted with 20 μL streptavidin agarose magnetic beads and shaken at 37°C for 2 h. The obtained product was added with 100 μL DNA peptide probe (0.01 μM) and 25 μL buffer for hybridization at 65°C for 16 h. Finally, the product was washed and centrifuged several times with PBS to remove the unbound probe as much as possible.
To obtain the enzymatic hydrolysates, the product was redissolved in 950 μL diethyl pyrocarbonate (DEPC) treated water. Then 50 μL isotope-labeled peptide (0.1 mg/L) was added, followed by enzymatic hydrolysis via the addition of 10 μL trypsin (0.04 μg/μL) and incubation at 37°C for 4 h. The as-prepared enzymatic hydrolysates contained 5′-TCAACATCAGTCTGATAAGCTA-3′-PEG2-GDR and ALFVPEPNR, as well as isotope-labeled peptides that were hydrolyzed into GDR and A[13C615N]LFVPEPNR.
2.5 Solid-Phase Extraction and Blow Drying
The Sep-pak C18 column was activated with 3 mL methanol and then balanced with 3 mL ultrapure water. The column was then washed with 2 mL ultra-pure water after the injection of enzymatic hydrolysate. Finally, ALFVPEPNR and A[13C615N]LFVPEPNR peptides were extracted with 1 mL methanol containing 0.2% FA and then dried with nitrogen gas.
The reporter peptide was detected using liquid chromatography-tandem mass spectrometry (LC-MS/MS) and ultra-high performance liquid-phase chromatography (UHPLC). The mobile phase was made up of 0.1% FA aqueous solution (A), and 0.1% FA in acetonitrile (B). The injection volume was 10 μL with a 0.2 mL/min flow rate. The positive ion multiple reaction monitoring (MRM) mode was selected to access the signal strength of ALFVPEPNR and A[13C615N]LFVPEPNR. The ions employed in the quantitative study had a mass range of 521.9 to 612.3 m/z (ALFVPEPNR) and 525.5 to 612.3 m/z (A[13C615N]LFVPEPNR). CE were 20 eV (ALFVPEPNR) and 22 eV (A[13C615N]LFVPEPNR), and DP was 100 V.
To validate the developed method, the precision, linear range, stability, accuracy, sensitivity, and recovery were all evaluated in this study.
The statistical analysis was conducted using SPSS statistics software version 20.0 (SPSS Inc., Chicago, USA). The statistical significance was calculated using the t-test and variance analysis. The figures were plotted by GraphPad Prism 5.0 software (GraphPad Software Inc., USA), and P < 0.05 was considered statistically significant.
3.1 Selection of Reporter and Substrate Peptides
As designed, peptide with the sequence ALFVPEPNR was selected as a reporter peptide. In mass spectrometric analysis, the ALFVPEPNR peptide with the double-charged ion should have high detection efficiency. In addition, this peptide sequence has yet to be discovered in any protein, which will improve the specificity of the method. As a result, the UHPLC/MS/MS chromatogram and product ion spectrum were obtained. The internal standard was the homologous stable isotope-labeled peptide A[13C615N]LFVPEPNR. Moreover, the response to the ion of this peptide product and the corresponding MRM transition were also contented. The MRM transitions from 521.9 to 612.3 m/z were used for ALFVPEPNR (Fig. 1A), while the MRM transitions from 525.5 to 612.3 m/z for the internal standard (Fig. 1B). The ALFVPEPNR peptide and the isotope-labeled peptide (A[13C615N]LFVPEPNR) both had retention times of 5.06 min (Fig. 1C).
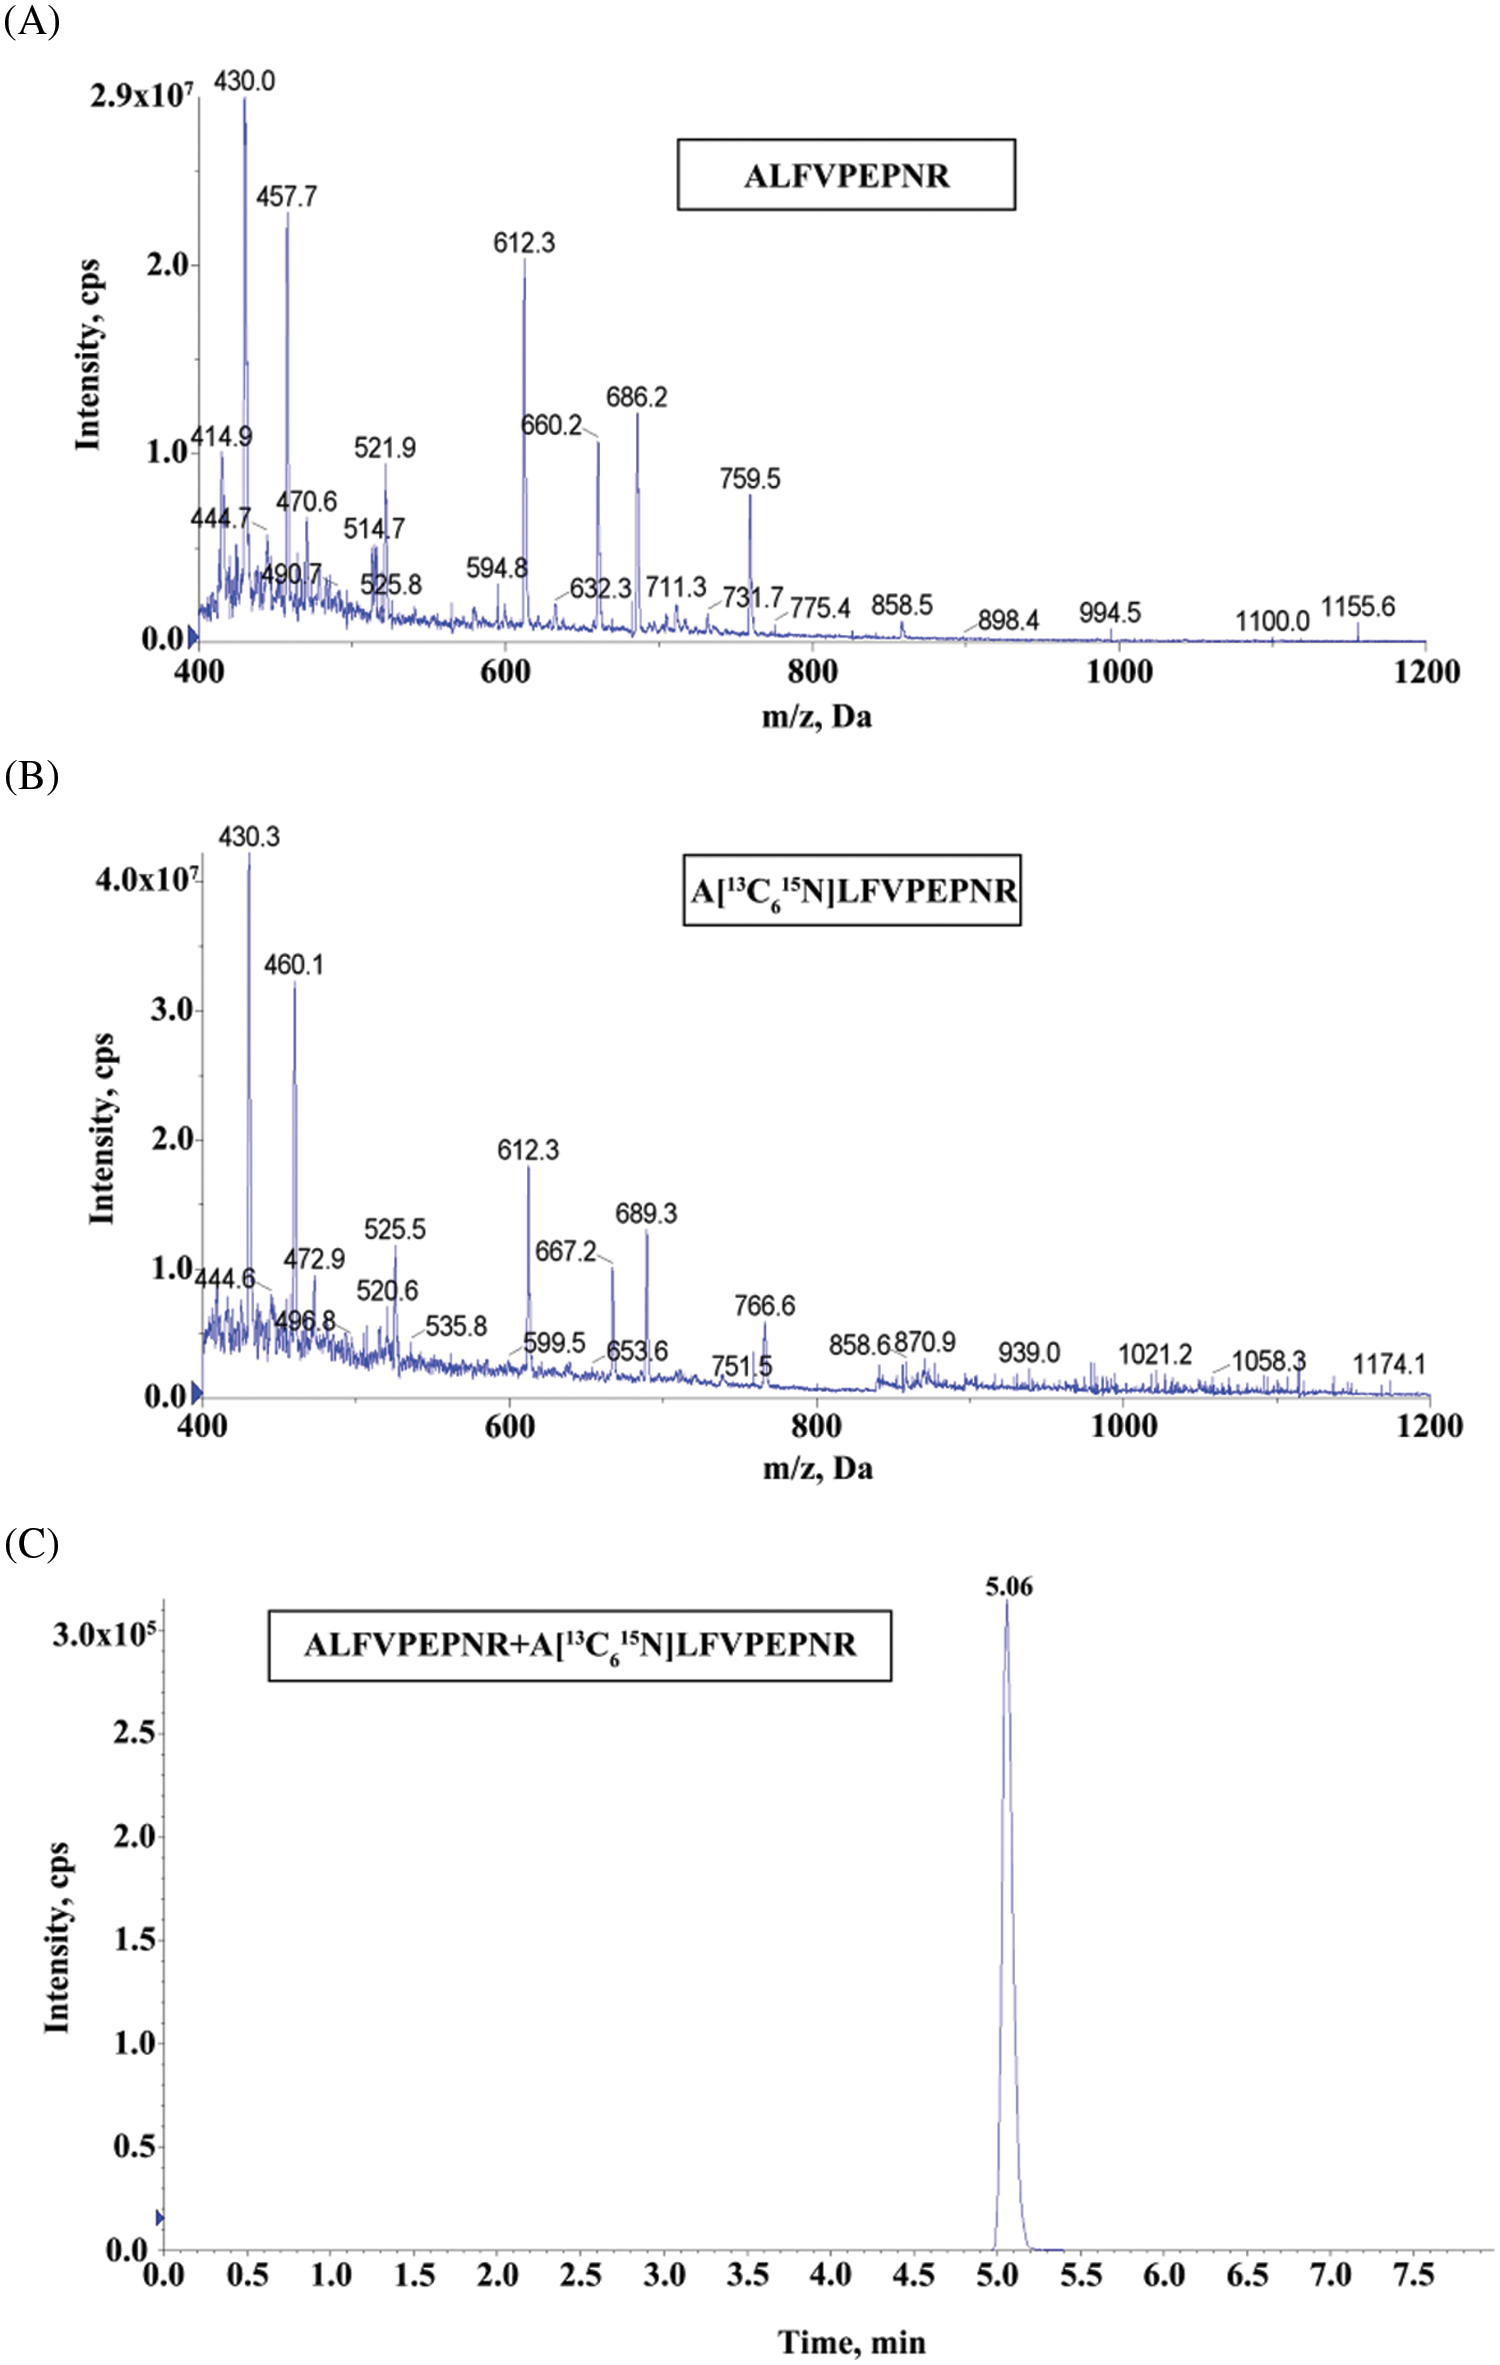
Figure 1: The UHPLC/MS/MS chromatograms and product ion spectra. (A) Product ion spectrum of ALFVPEPNR, the MRM transitions of m/z 521.9–612.3 for ALFVPEPNR. (B) Product ion spectrum of A[13C615N]LFVPEPNR, the MRM transitions of m/z 525.5–612.3 for internal standard. (C) UHPLC/MS/MS chromatograms of ALFVPEPNR peptide and the corresponding isotope-labeled internal standard peptide (A[13C615N]LFVPEPNR)
The GDRALFVPEPNR (substrate peptide) and the corresponding GDRA[13C615N]LFVPEPNR (isotope-labeled internal standard) were formed by combining a three-amino acid peptide (GDR) that contains arginine residues at its carboxyl terminus with the reporter peptide (ALFVPEPNR). The digestibility of the designed peptides was calculated by the response ratio before/after digestion and the response ratio before/after standard digestion of the isotope-labeled report peptides, respectively. As a result, the estimated digestion ratio was 99.9% (Fig. 2).
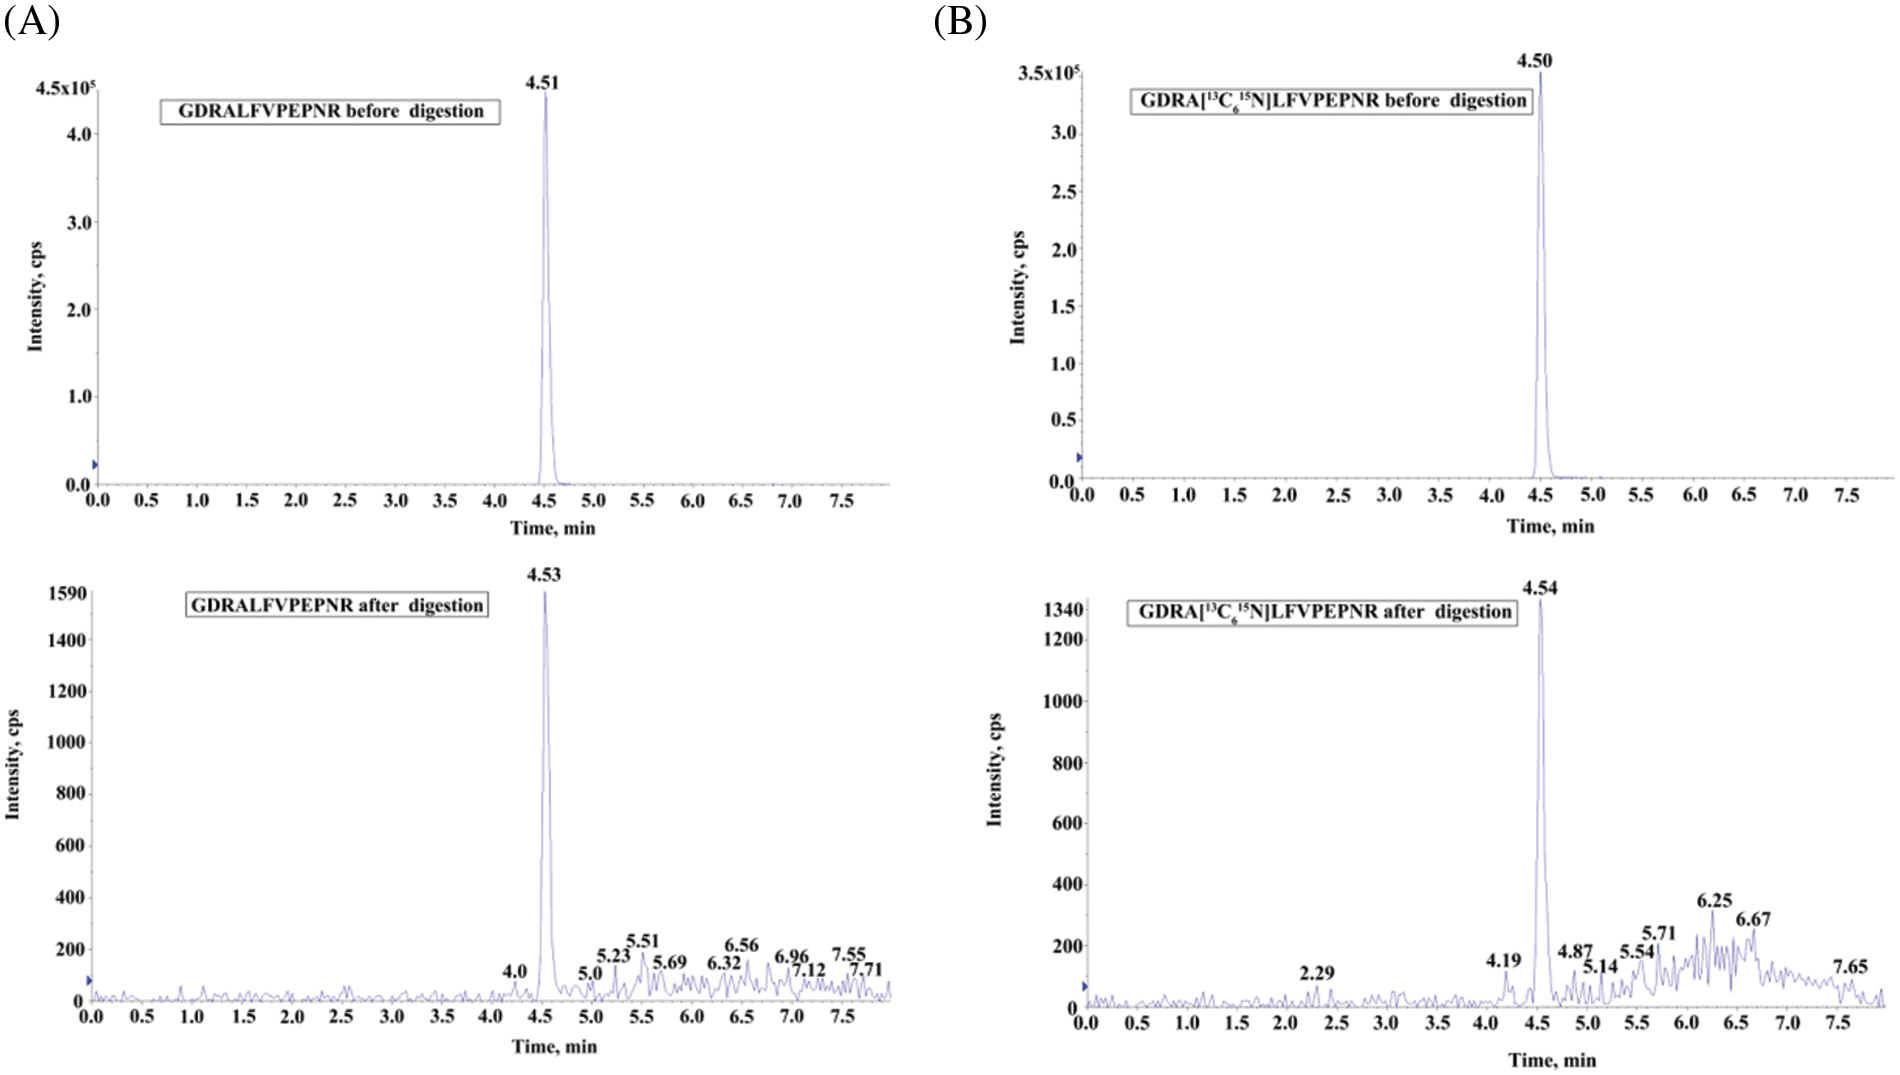
Figure 2: The digestibility study of peptides. (A) UHPLC/MS/MS chromatograms of GDRALFVPEPNR before and after the tryptic digestion. (B) UHPLC/MS/MS chromatograms of GDRA[13C615N]LFVPEPNR before and after the tryptic digestion
3.2 Characterization of DNA-Peptide Probe
As the miR-21 complementary sequence was designed as 5′-TCAACATCAGTCTGATAAGCTA-3′, thus the DNA peptide probe sequence was 5′-TCAACATCAGTCTGATAAGCTA-3′-PEG2-GDRALFVPEPNR. Trypsin can specifically hydrolyze the carboxy-terminated peptide bonds of arginine or lysine residues, converting the carboxyl terminus of CO-OH to CO-NH2, resulting in a ∼1 Da shift in molecular mass. Finally, the quantitative detection was performed according to the peak area of the transition from 520.9 to 611.5 m/z (Fig. 3).
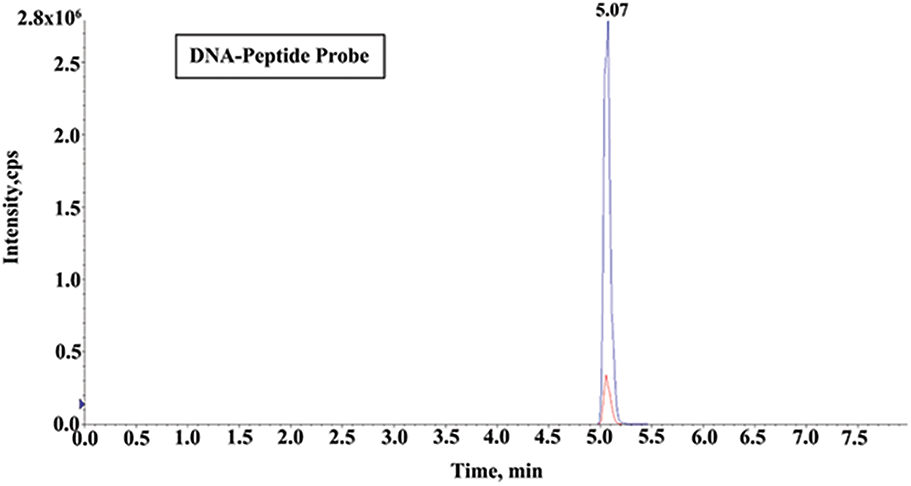
Figure 3: UHPLC/MS/MS chromatograms of ALFVPEPNR after the tryptic digestion from DNA-peptide probe
3.3 Sample Loading Efficiency on Beads
The most common technique in hybridization involves immobilizing nucleotide molecules onto a solid substrate. Biotin-streptavidin interaction is one of the most commonly used methods for biomolecule immobilization. In this study, miR-21 was biotinylated and then incubated with streptavidin agarose. Previous research has indicated that 25 μL of biotin can reach the maximum loading capacity of the agarose beads [31], which matches our data in this study (Fig. 4).
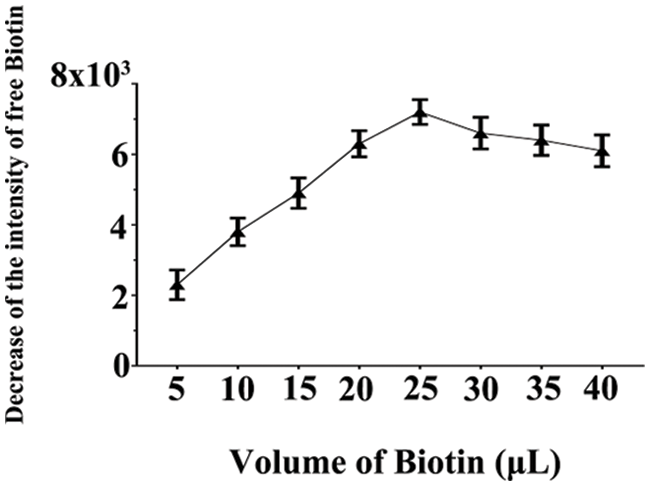
Figure 4: The intensity decreasing of free biotin plotted as a function of the volume of added biotin, which was due to its binding with streptavidin agarose beads. To evaluate the maximum loading capacity of agarose beads for biotinylated miRNAs, for 3 samples, increased amounts of biotin (5, 10, 15, 20, 25, 30, 35 and 40 μL; 100 μM) were reacted with 20 μL of streptavidin agarose (4∼6 mg/mL of streptavidin) and the result indicated that 25 μL of biotin reached saturation
A complementary DNA peptide probe was used to hybridize the immobilized miR-21. Theoretically, if there are too many DNA-peptides, then all target miR-21 can hybridized with the peptides. However, in practice, the efficiency of hybridization is also related to the incubation time and hybridization temperature. Therefore, we optimized the two parameters, resulting in the best processing time of 16 h and the best reaction temperature of 60°C (Fig. 5).
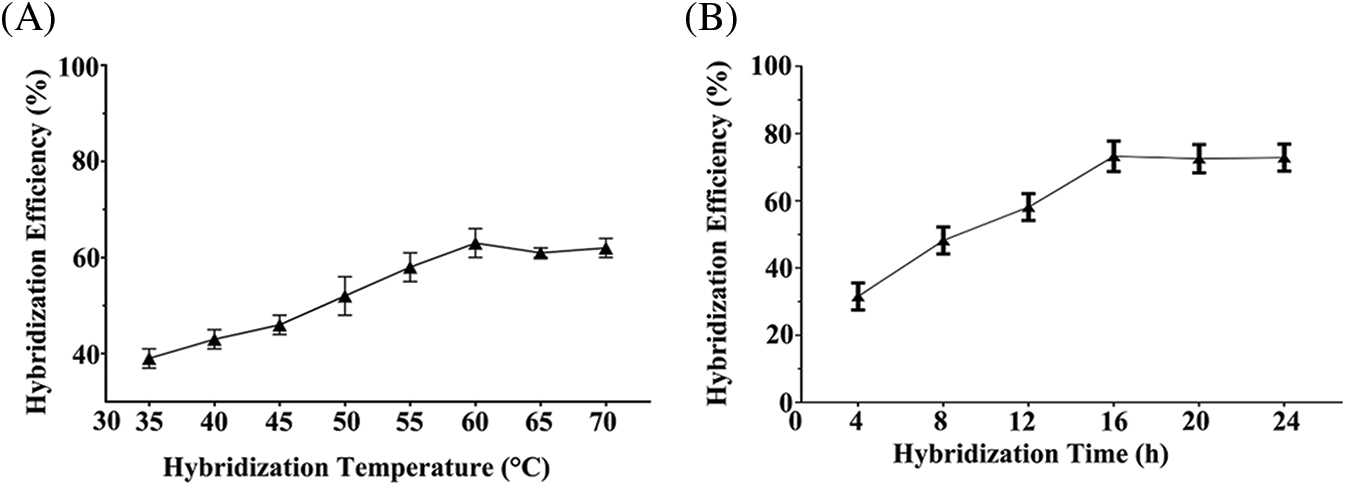
Figure 5: Hybridization temperature and time were optimized for 3 samples. (A) The best reaction temperature was 60°C. (B) The best processing time was 16 h
3.5 Development and Validation of a UHPLC/MS/MS-based Quasi-Targeted Proteomics Assay for miR-21 Quantification
3.5.1 Linear Regression Equation and Linear Range
To obtain the linear range, the final concentrations of calibration standards were set as 0.1, 0.5, 1.0, 2.5, 5.0, 10.0, 15.0, 20.0, 25.0, and 30 nmol/L. 50 μL internal standard (1 μg/L) was added to each sample. The calibration curve was established on the basis of the reporter peptide’s relative peak area ratio (y). The stable isotope-labeled internal standard was plotted against miR-21 concentrations (x). The linear regression was then applied to obtain the serum miR-21 concentration. A linear range of 0.1 to 30.0 nM was obtained for y5 (y = 0.0818x + 0.7554, R2 = 0.9586, P < 0.01) (Fig. 6).
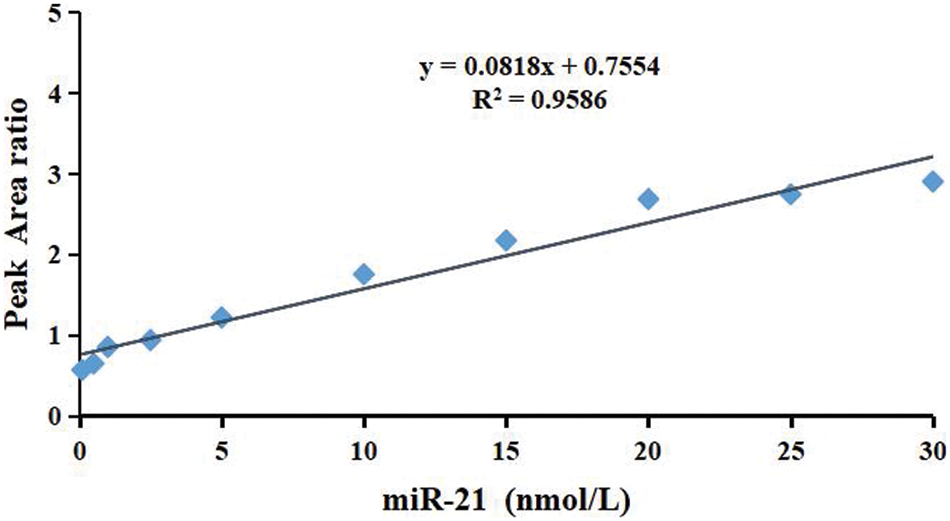
Figure 6: Representative calibration curve (0.1∼30 nM) for the miR-21 standards. The relative peak area ratio of the reporter peptide and the stable isotope-labeled internal standard with the same sequence was plotted against concentration
Given the linear regression equation, the limit of detection (LOD) for miR-21 was calculated to be 1.2 pM. A coefficient of variation (CV) of less than 20% must be used to determine the minimum concentration of miR-21, which may then be used as a limit of quantification (LOQ) [32]. The 0.1 nM miR-21 samples were diluted 10, 20, and 30 folds in 100 μL of internal standard (1 μL) and analyzed by UHPLC/MS/MS, respectively. The CV of miR-21 (n = 10) was 11.4% at 30 pM, 18.6% at 20 pM, and 23.2% at 10 pM for y5. Therefore, LOQ for miR-21 was determined as 10 pM.
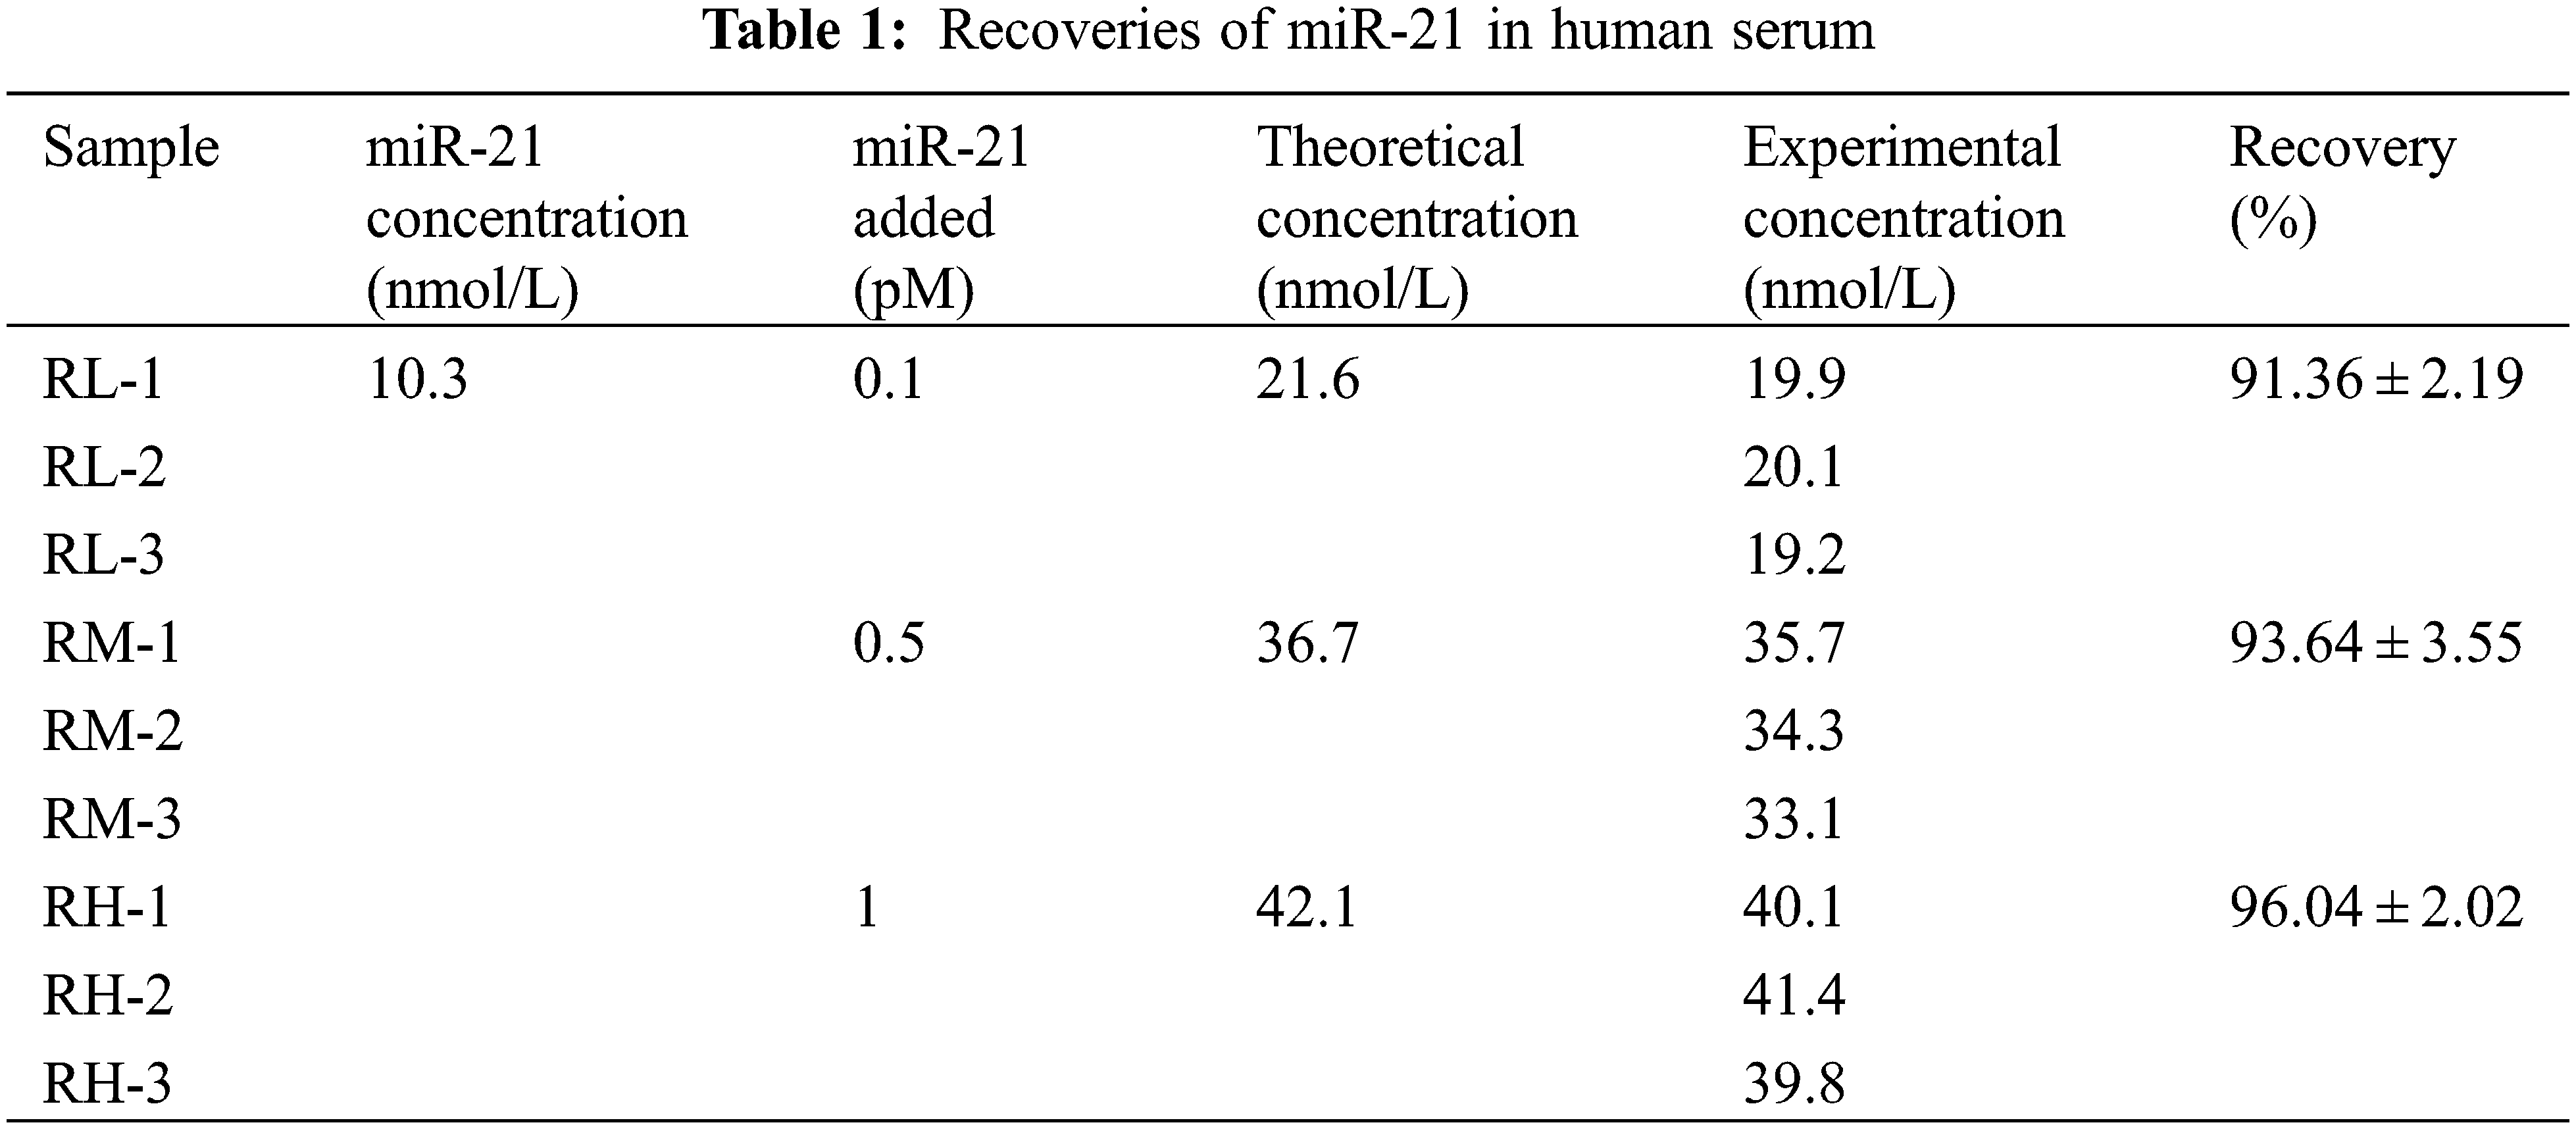
The concentration of miR-21 in the serum sample was 10.3 nmol/L, and different molar masses of miR-21 were added to determine the recovery of the RNA detected by the UHPLC/MS/MS. Their theoretical concentrations were calculated to be 21.6, 36.7, and 42.1 nmol/L, respectively. The concentrations of actual miR-21 were then measured. The recoveries (n = 3) for the three miR-21 levels such as RL, RM, and RH were 91.36 ± 2.19%, 93.64 ± 3.55% and 96.04 ± 2.02% for y5 (Table 1).
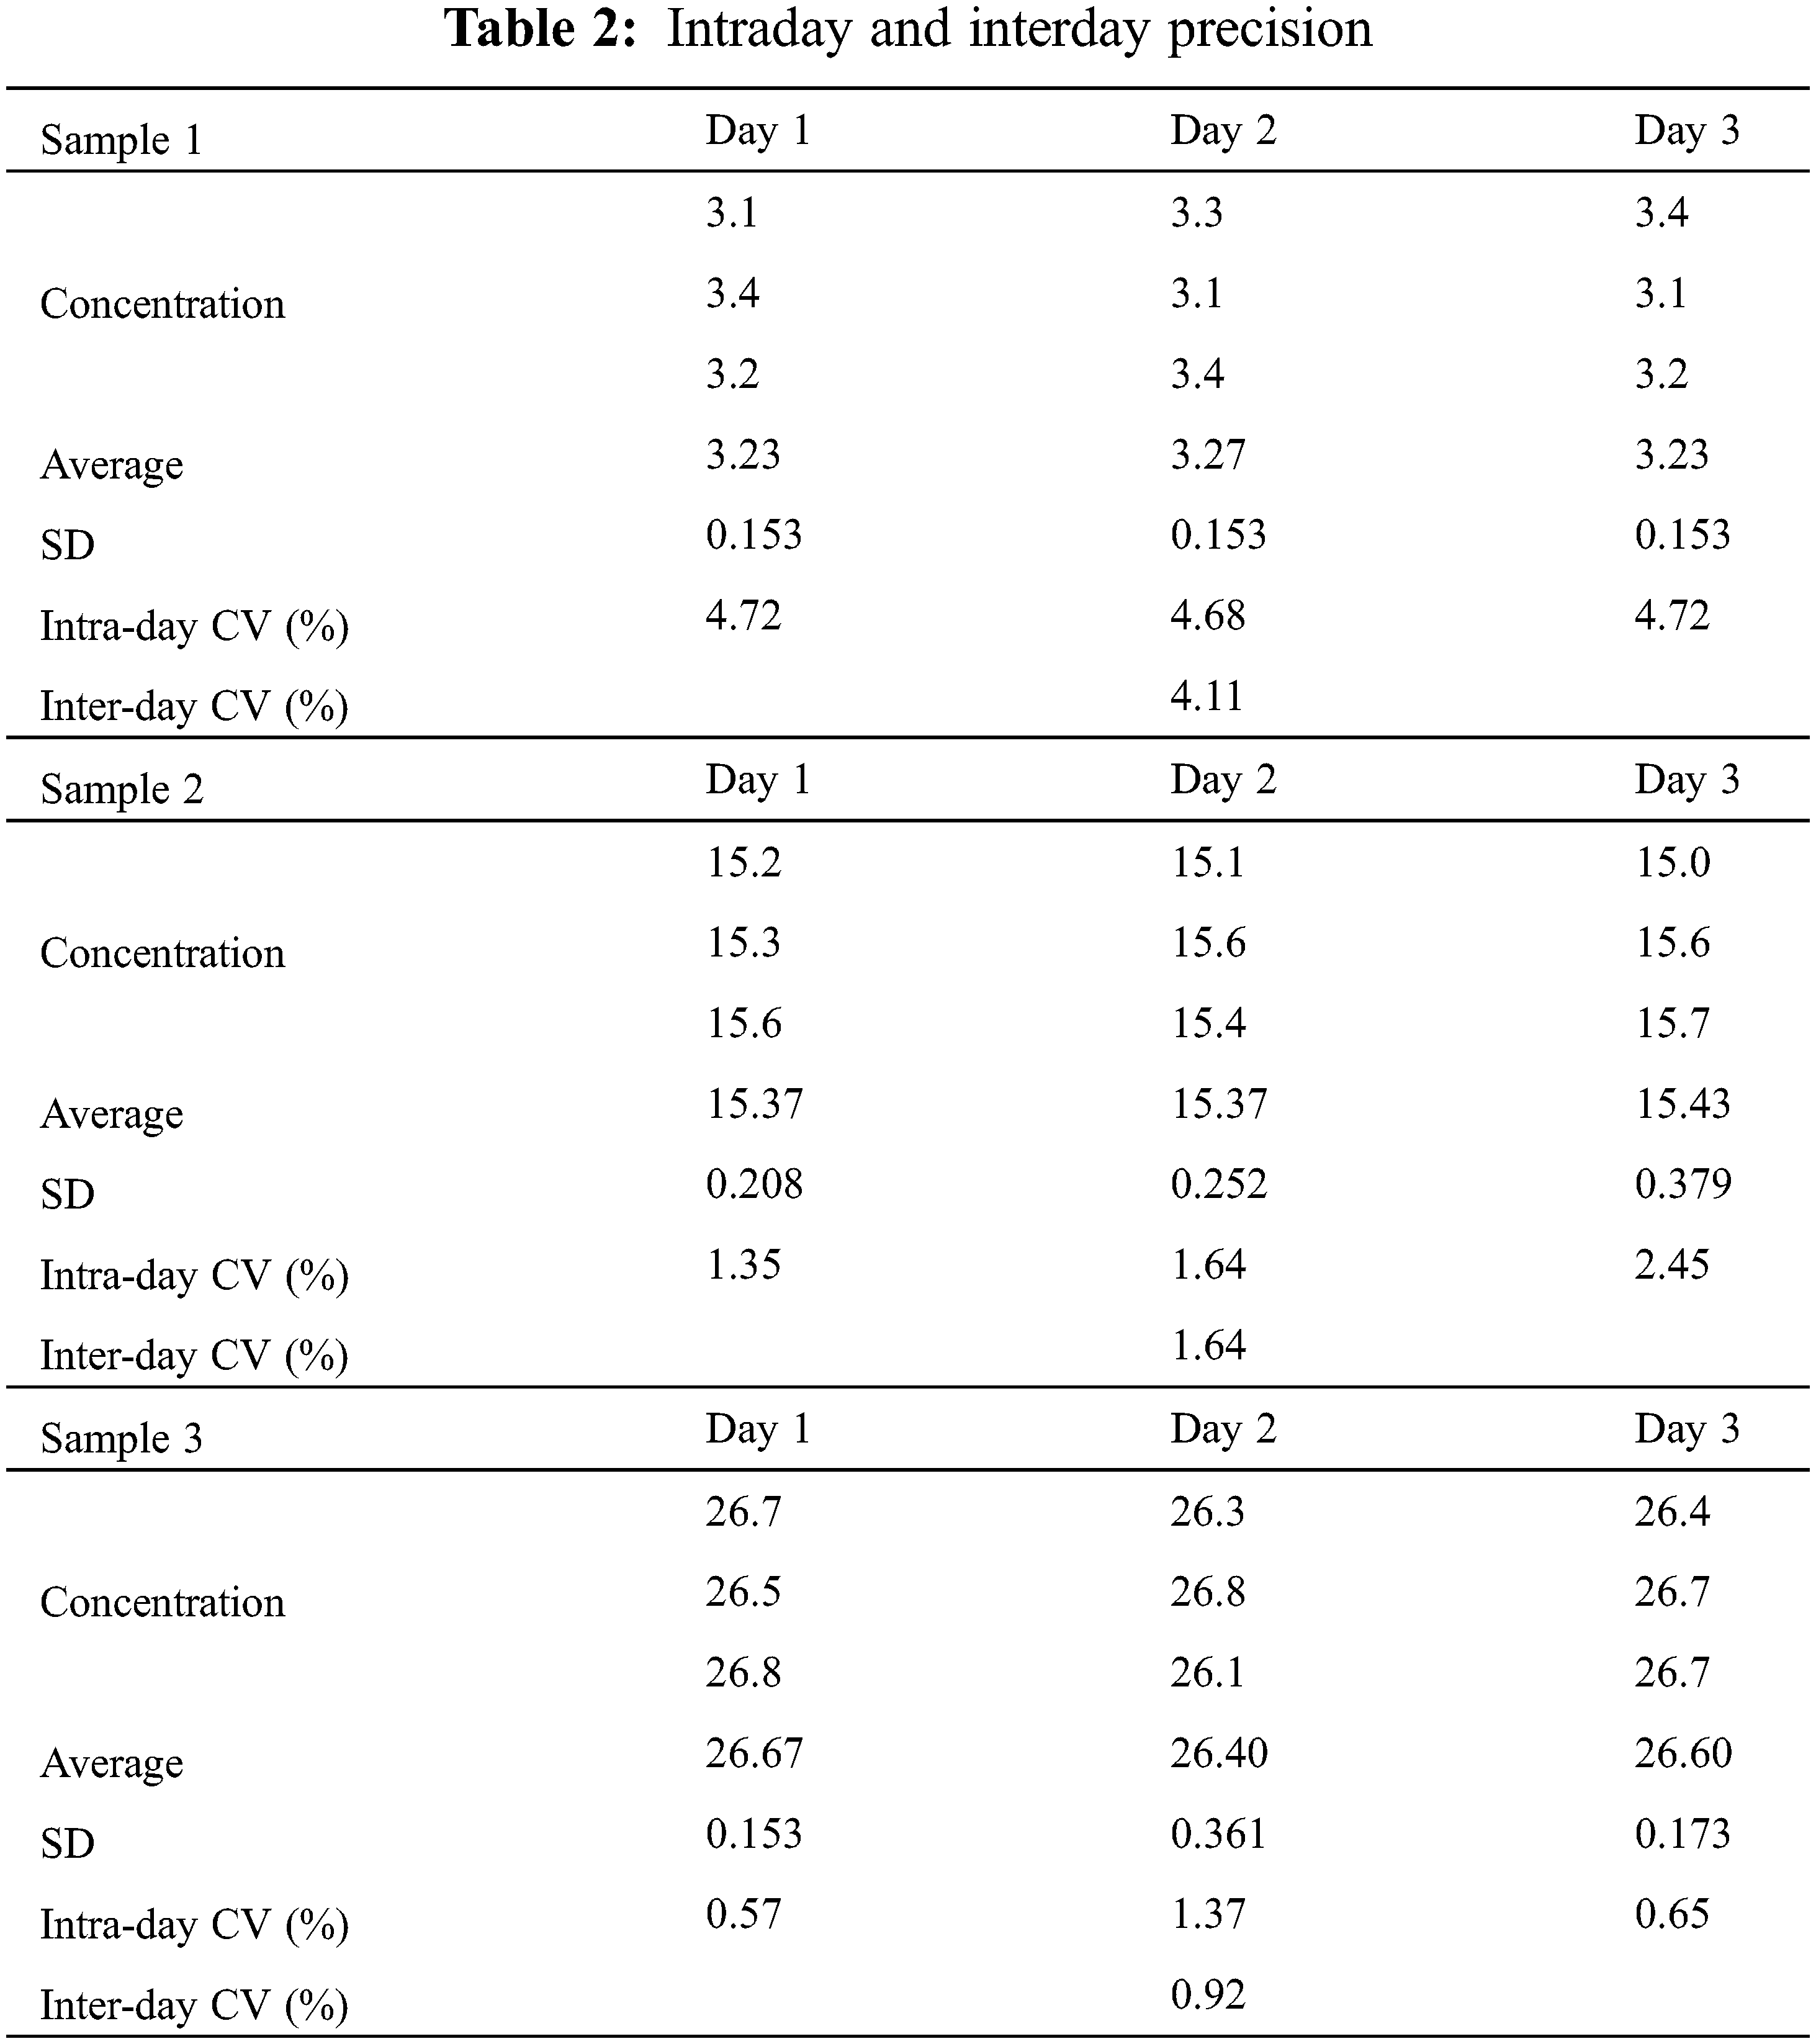
The accuracy of the developed method was assessed by evaluating the responses of three miR-21 samples at different concentrations in three consecutive days. Intraday and interday precision values were expressed as CVs (Table 2).
3.5.5 Evaluation of the Clinical Value of miR-21
We analyzed the serum samples of 35 HCC patients and 35 healthy controls. As a result, the quantified miR-21 level in healthy controls was 0.66 nM (range: 0.52∼0.83 nM), and the level of miR-21 in HCC patients’ serum was 1.60 nM (range: 1.34∼1.88 nM) (Fig. 7). These results revealed the significantly increase of miR-21 level in the serum of HCC patients, suggesting that miR-21 can be used as a potential biomarker for HCC.
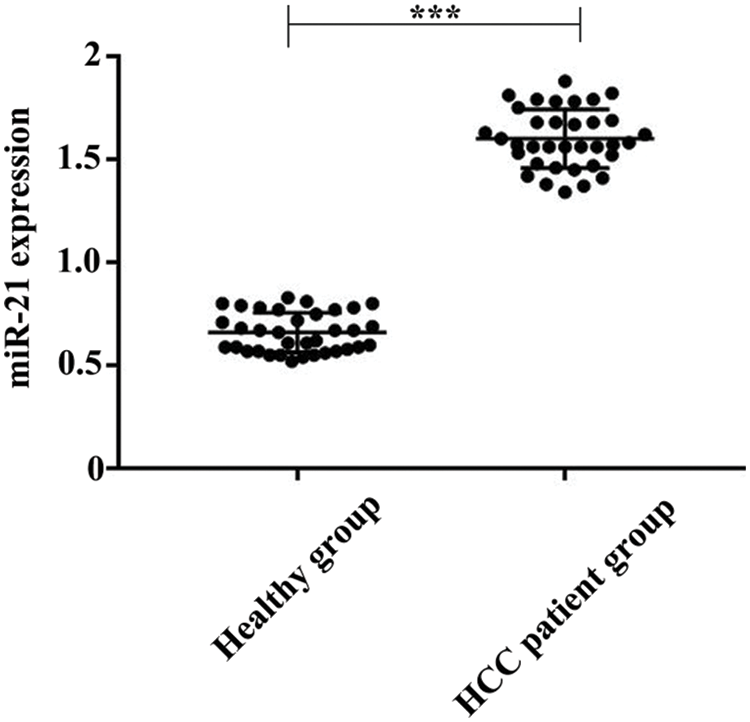
Figure 7: Comparison of the quantified miR-21 concentrations in serum for healthy group (N = 35) and HCC patient group (N = 35). ***P < 0.001
The mass determination based on the conversion of miRNA signals into reporter peptides is the most commonly used proteomic assay using MS [33,34]. Therefore, in this study, the first step was to quantify the DNA peptide probe [35,36]. In such experiments, proteolytic enzymes such as trypsin are often used to cleave the substrate peptides, where the substrate peptides must have trypsin cleavage sites. It is worth noting that the enzyme digestion requires certain conditions, including temperature, and time, etc. So, the digestion efficiency is the key issue to be considered [37].
MS has become a practical method for quantifying biomolecules in recent years due to its high sensitivity and specificity [38]. Proteomics detection with UHPLC/MS/MS is one of the most extensively used MS methods which is based on the principle of targeted analysis [39]. This method is mainly based on converting proteins to peptides for quantitative detection. Peptides can be detected using selective reaction monitoring (SRM) or multiple reaction monitoring (MRM). The peptide used in this study is a substituted peptide as well as a substitute analyte, which is prepared by proteolytic enzymes of the target protein. In our study, the concept of the substitute analyte is also used for reference. To quantitatively determine the miR-21 in solution, we established a direct analytical method in which miR-21 signals were transformed into reporter peptides and the reporter peptides were quantified using MS. For validation, we optimized the binding, coupling, hybridization, and other parameters for miR-21 measurement. Furthermore, we used this method to measure miR-21 levels in the serum of healthy volunteers and HCC patients.
In this experiment, a designed DNA-peptide probe was used to convert the miR-21 signal into a reporter peptide. The quantification of the reporter peptide was assessed to reflect the quantity of miR-21 in serum. Thus, a direct and sensitive quantitative detection method for miRNA level measurement in biological samples was developed. Besides, all the experiments were conducted in a nuclease-free environment to prevent miRNA degradation [40,41]. Studies have developed and validated a sensitive quantitative miRNA analysis method for combining DNA-Peptide dendrimer probe and LC-MS/MS. To quantify the target miRNA, all miRNA samples were predefined as biotinylated and then immobilized on streptavidin-agarose beads [42].
To evaluate the performance of the method for miR-21 quantification, results obtained by UHPLC/MS/MS were compared with qRT-PCR analysis. We should compare our established UHPLC-MS/MS method with qRT-PCR analysis. However, miR-21 quantification by qRT-PCR analysis has not been carried out in our hospital, and will not carry out soon. We can carry out further research in the later stage by the comparison experiment between methods.
To quantify miR-21 in serum samples, A quasi-targeted proteomics method based on UHPLC/MS/MS was developed in this study. This method has the capability to analyze miR-21 expression level in biological samples directly and quantitatively without the need for miRNA pretreatment, allowing for direct miRNA quantification. The results showed the concentration of miR-21 was calculated using reporter peptide relative peak area ratio and the stable isotope-labeled internal standard, resulting in a linear range of 0.1∼30.0 nM (y = 0.0818x + 0.7554, R2 = 0.9586, P < 0.01). To conclude, a method for direct quantitative measurement of miR-21 in serum samples has been developed. The developed analytical method is significant to biomarker study as well as clinical treatments. However, further exploration is needed to improve the performance of the method.
Ethical Approval and Informed Consent Statement: Written informed consents were obtained from all participants, and this study was permitted by the Ethics Committee of Affiliated Hospital of Nantong University (No. 2019-L071, Approval Date: 2019.03.23).
Availability of Data and Materials: The dataset supporting the conclusions of this article is included within this article and is available from the corresponding author upon request.
Authors’ Contributions: X.W. and J.X. jointly collected the paper and wrote the manuscript. Q.G., D.T., H.J. and S.J. revised the manuscript. F.W., L.C. and R.Y. participated in the review and helped revise the manuscript. All authors read and approved the final manuscript.
Funding Statement: This work was supported by the College Students’ Innovation and Entrepreneurship Project of Jiangsu (202110304103Y), the Project of Jiangsu Commission of Health (Z2020011), and Postdoctoral Research Funding Project of Jiangsu Province (2021K012A).
Conflicts of Interest: As an Editorial Board Member of Oncologie, the author Feng Wang did not participate in the review process of this manuscript. Other authors declare that they have no conflicts of interest to report regarding the present study.
References
1. Wang, Z., He, Y., Song, Y., Wang, Y., Chen, F. (2021). microRNA in HCC: Biomarkers and therapeutic targets. Oncologie, 23(2), 177–184. DOI 10.32604/Oncologie.2021.014773. [Google Scholar] [CrossRef]
2. Xu, F. F., Zhou, W. X., Cao, J. X., Xu, Q. Q., Jiang, D. C. et al. (2017). A combination of DNA-peptide probes and liquid chromatography-tandem mass spectrometry (Lc-Ms/MsA quasi-targeted proteomics approach for multiplexed microRNA quantification. Theranostics, 7(11), 2849–2862. DOI 10.7150/thno.19113. [Google Scholar] [CrossRef]
3. Wu, J., Tang, W., Huang, L., Hou, N., Wu, J. et al. (2019). The analysis of cell-free DNA concentrations and integrity in serum of initial and treated of lymphoma patients. Clinical Biochemistry, 63, 59–65. DOI 10.1016/j.clinbiochem.2018.10.002. [Google Scholar] [CrossRef]
4. Stefanie, J., Elisa, I. (2015). Towards a molecular understanding of microRNA-mediated gene silencing. Nature Reviews Genetics, 16(7), 421–433. DOI 10.1038/nrg3965. [Google Scholar] [CrossRef]
5. Zhang, B. G., Li, J. F., Yu, B. Q., Zhu, Z. G., Liu, B. Y. et al. (2012). microRNA-21 promotes tumor proliferation and invasion in gastric cancer by targeting PTEN. Oncology Reports, 27(4), 1019–1026. DOI 10.3892/or.2012.1645. [Google Scholar] [CrossRef]
6. He, Y., Wang, Z., Wang, Y., Sun, M. (2021). The functions of microRNAs and their potential applications in the diagnosis and treatment of gastric cancer. Oncologie, 23(3), 351–357. DOI 10.32604/Oncologie.2021.014772. [Google Scholar] [CrossRef]
7. Li, Q., Ding, C. C., Chen, C., Zhang, Z. M., Xiao, H. et al. (2014). miR-224 promotion of cell migration and invasion by targeting homeobox D 10 gene in human hepatocellular carcinoma. Journal of Gastroenterology and Hepatology, 29(4), 835–842. DOI 10.1111/jgh.12429. [Google Scholar] [CrossRef]
8. Ando, Y. G., Yang, G. X., Kenny, T. P., Kawata, K., Zhang, W. C. et al. (2013). Overexpression of microRNA-21 is associated with elevated pro-inflammatory cytokines in dominant-negative TGF-beta receptor type II mouse. Journal of Autoimmunity, 41, 111–119. DOI 10.1016/j.jaut.2012.12.013. [Google Scholar] [CrossRef]
9. Bertoli, G., Cava, C., Castiglioni, I. (2015). MicroRNAs: New biomarkers for diagnosis, prognosis, therapy prediction and therapeutic tools for breast cancer. Theranostics, 5(10), 1122–1143. DOI 10.7150/thno.11543. [Google Scholar] [CrossRef]
10. Pritchard, C. C., Cheng, H. H., Tewari, M. (2012). MicroRNA profiling: Approaches and considerations. Nature Reviews Genetics, 13(5), 358–369. DOI 10.1038/nrg3198. [Google Scholar] [CrossRef]
11. Li, M., He, Y., Zhou, Z., Ramirez, T., Gao, Y. Q. et al. (2017). MicroRNA-223 ameliorates alcoholic liver injury by inhibiting the Il-6-P47(Phox)-oxidative stress pathway in neutrophils. Gut, 66(4), 705–715. DOI 10.1136/gutjnl-2016-311861. [Google Scholar] [CrossRef]
12. An, F. M., Olaru, A. V., Mezey, E., Xie, Q., Li, L. et al. (2015). MicroRNA-224 induces G1/S checkpoint release in liver cancer. Journal of Clinical Medicine, 4(9), 1713–1728. DOI 10.3390/jcm4091713. [Google Scholar] [CrossRef]
13. Gumireddy, K., Young, D. D., Xiong, X., Hogenesch, J. B., Huang, Q. et al. (2008). Small-molecule inhibitors of microRNA miR-21 function. Angewandte Chemie-International Edition, 47(39), 7482–7484. DOI 10.1002/anie.200801555. [Google Scholar] [CrossRef]
14. van Schooneveld, E., Wildiers, H., Vergote, I., Vermeulen, P. B., Dirix, L. Y. et al. (2015). Dysregulation of microRNAs in breast cancer and their potential role as prognostic and predictive biomarkers in patient management. Breast Cancer Research, 17, 21. DOI 10.1186/s13058-015-0526-y. [Google Scholar] [CrossRef]
15. Lan, S. H., Wu, S. Y., Zuchini, R., Lin, X. Z., Su, I. J. et al. (2014). Autophagy-preferential degradation of miR224 participates in hepatocellular carcinoma tumorigenesis. Autophagy, 10(9), 1687–1689. DOI 10.4161/auto.29959. [Google Scholar] [CrossRef]
16. Zhang, P. B., Zhang, J. Y., Wang, C. L., Liu, C. H., Wang, H. et al. (2014). Highly sensitive and specific multiplexed microRNA quantification using size-coded ligation chain reaction. Analytical Chemistry, 86(2), 1076–1082. DOI 10.1021/ac4026384. [Google Scholar] [CrossRef]
17. Kotlarek, M., Kubiak, A., Jazdzewski, K., Wojcicka, A. (2018). MicroRNA analysis using the quantitative real-time PCR reaction. Methods in Molecular Biology, 1823, 69–85. DOI 10.1007/978-1-4939-8624-8. [Google Scholar] [CrossRef]
18. Redshaw, N., Wilkes, T., Whale, A., Cowen, S., Huggett, J. et al. (2013). A comparison of miRNA isolation and Rt-qPCR technologies and their effects on quantification accuracy and repeatability. BioTechniques, 54(3), 155–164. DOI 10.2144/000114002. [Google Scholar] [CrossRef]
19. Mauroy, A., van der Poel, W. H., der Honing, R. H., Thys, C., Thiryet, E. (2012). Development and application of a SYBR green RT-PCR for first line screening and quantification of porcine sapovirus infection. BMC Veterinary Research, 8, 193. DOI 10.1186/1746-6148-8-193. [Google Scholar] [CrossRef]
20. Hu, Y., Lan, W., Miller, D. (2017). Next-generation sequencing for microrna expression profile. Methods in Molecular Biology, 1617, 169–177. DOI 10.1007/978-1-4939-7046-9. [Google Scholar] [CrossRef]
21. Cheng, F. F., He, T. T., Miao, H. T., Shi, J. J., Jiang, L. P. et al. (2015). Electron transfer mediated electrochemical biosensor for microRNAs detection based on metal ion functionalized titanium phosphate nanospheres at attomole level. ACS Applied Materials & Interfaces, 7(4), 2979–2985. DOI 10.1021/am508690x. [Google Scholar] [CrossRef]
22. Hu, L., Stasheuski, A. S., Wegman, D. W., Wu, N., Yang, B. B. et al. (2017). Accurate microRNA analysis in crude cell lysate by capillary electrophoresis-based hybridization assay in comparison with quantitative reverse transcription-polymerase chain reaction. Analytical Chemistry, 89(8), 4743–4748. DOI 10.1021/acs.analchem.7b00707. [Google Scholar] [CrossRef]
23. Dodgson, B. J., Mazouchi, A., Wegman, D. W., Gradinaru, C. C., Krylov, S. N. (2012). Detection of a thousand copies of miRNA without enrichment or modification. Analytical Chemistry, 84(13), 5470–5474. DOI 10.1021/ac301546p. [Google Scholar] [CrossRef]
24. Wang, T., Viennois, E., Merlin, D., Wang, G. (2015). Microelectrode miRNA sensors enabled by enzymeless electrochemical signal amplification. Analytical Chemistry, 87(16), 8173–8180. DOI 10.1021/acs.analchem.5b00780. [Google Scholar] [CrossRef]
25. Liu, L., Xu, Q. Q., Hao, S., Chen, Y. (2017). A quasi-direct Lc-Ms/Ms-based targeted proteomics approach for miRNA quantification via a covalently immobilized DNA-peptide probe. Scientific Reports, 7(1), 5669. DOI 10.1038/s41598-017-05495-7. [Google Scholar] [CrossRef]
26. Marx, H., Lemeer, S., Schliep, J. E., Matheron, L., Mohammed, S. et al. (2013). A large synthetic peptide and phosphopeptide reference library for mass spectrometry-based proteomics. Nature Biotechnology, 31(6), 557–564. DOI 10.1038/nbt.2585. [Google Scholar] [CrossRef]
27. Degliangeli, F., Kshirsagar, P., Brunetti, V., Pompa, P. P., Fiammengo, R. (2014). Absolute and direct microRNA quantification using DNA-gold nanoparticle probes. Journal of the American Chemical Society, 136(6), 2264–2267. DOI 10.1021/ja412152x. [Google Scholar] [CrossRef]
28. Xu, F. F., Yang, T., Chen, Y. (2016). Quantification of microrna by DNA-peptide probe and liquid chromatography-tandem mass spectrometry-based quasi-targeted proteomics. Analytical Chemistry, 88(1), 754–763. DOI 10.1021/acs.analchem.5b03056. [Google Scholar] [CrossRef]
29. Nakayama, H., Yamauchi, Y., Taoka, M., Isobe, T. (2015). Direct identification of human cellular microRNAs by nanoflow liquid chromatography-high-resolution tandem mass spectrometry and database searching. Analytical Chemistry, 87(5), 2884–2891. DOI 10.1021/ac504378s. [Google Scholar] [CrossRef]
30. Amr, K. S., Elmawgoud Atia, H. A., Elazeem Elbnhawy, R. A., Ezzat, W. M. (2017). Early diagnostic evaluation of miR-122 and miR-224 as biomarkers for hepatocellular carcinoma. Genes and Diseases, 4(4), 215–221. DOI 10.1016/j.gendis.2017.10.003. [Google Scholar] [CrossRef]
31. Wu, A. Q., Ji, H. Y., Li, Y., Liu, R. Y., Hu, Z. Y. et al. (2020). Establishment of a direct quantitative method for measurement of microRNA-224 in serum by UHPLC/Ms/Ms. Journal of Chromatography B, 1152, 122199. DOI 10.1016/j.jchromb.2020.122199. [Google Scholar] [CrossRef]
32. Matsuda, C., Shiota, Y., Sheikh, A. M., Okazaki, R., Yamada, K. et al. (2018). Quantification of CSF cystatin C using liquid chromatography tandem mass spectrometry. Clinica Chimica Acta, 478, 1–6. DOI 10.1016/j.cca.2017.12.016. [Google Scholar] [CrossRef]
33. Putz, S., Reinders, J., Reinders, Y., Sickmann, A. (2005). Mass spectrometry-based peptide quantification: Applications and limitations. Expert Review of Proteomics, 2(3), 381–392. DOI 10.1586/14789450.2.3.381. [Google Scholar] [CrossRef]
34. Calvo, E., Camafeita, E., Fernandez-Gutierrez, B., Lopez, J. A. (2011). Applying selected reaction monitoring to targeted proteomics. Expert Review of Proteomics, 8(2), 165–173. DOI 10.1586/epr.11.11. [Google Scholar] [CrossRef]
35. Duan, D., Zheng, K. X., Shen, Y., Cao, R., Jiang, L. et al. (2011). Label-free high-throughput microRNA expression profiling from total RNA. Nucleic Acids Research, 39(22), e154. DOI 10.1093/nar/gkr774. [Google Scholar] [CrossRef]
36. Cai, S., Lau, C., Lu, J. (2010). Sequence-specific detection of short-length DNA via template-dependent surface-hybridization events. Analytical Chemistry, 82(17), 7178–7184. DOI 10.1021/ac101892t. [Google Scholar] [CrossRef]
37. Kutanzi, K. R., Yurchenko, O. V., Beland, F. A., Checkhun, V. F., Pogribny, I. P. (2011). MicroRNA-mediated drug resistance in breast cancer. Clinical Epigenetics, 2(2), 171–185. DOI 10.1007/s13148-011-0040-8. [Google Scholar] [CrossRef]
38. Chen, S., Wan, Q., Badu-Tawiah, A. K. (2016). Mass spectrometry for paper-based immunoassays: Toward on-demand diagnosis. Journal of the American Chemical Society, 138(20), 6356–6359. DOI 10.1021/jacs.6b02232. [Google Scholar] [CrossRef]
39. Kullolli, M., Knouf, E., Arampatzidou, M., Tewari, M., Pitteri, S. J. (2014). Intact microRNA analysis using high resolution mass spectrometry. Journal of the American Society for Mass Spectrometry, 25(1), 80–87. DOI 10.1007/s13361-013-0759-x. [Google Scholar] [CrossRef]
40. Tombelli, S., Minunni, M., Luzi, E., Mascini, M. (2005). Aptamer-based biosensors for the detection of HIV-1 Tat protein. Bioelectrochemistry, 67(2), 135–141. DOI 10.1016/j.bioelechem.2004.04.011. [Google Scholar] [CrossRef]
41. Javaherian, S., Musheev, M. U., Kanoatov, M., Berezovski, M. V., Krylov, S. N. (2009). Selection of aptamers for a protein target in cell lysate and their application to protein purification. Nucleic Acids Research, 37(8), e62. DOI 10.1093/nar/gkp176. [Google Scholar] [CrossRef]
42. Liu, L., Kuang, Y., Yang, H., Chen, Y. (2019). An amplification strategy using DNA-peptide dendrimer probe and mass spectrometry for sensitive microRNA detection in breast cancer. Analytica Chimica Acta, 1069, 73–81. DOI 10.1016/j.aca.2019.04.009. [Google Scholar] [CrossRef]
Cite This Article
 Copyright © 2022 The Author(s). Published by Tech Science Press.
This work is licensed under a Creative Commons Attribution 4.0 International License , which permits unrestricted use, distribution, and reproduction in any medium, provided the original work is properly cited.
 Downloads
 Citation Tools