
 Submit a Paper
 Propose a Special lssue
 Open Access
ARTICLE

Racial Disparities in Clinical Features and Survival Outcomes among Patients with Pancreatic Neuroendocrine Tumor: A Contemporary SEER Database Analysis
1
Department of Gastroenterology, The First Affiliated Hospital of Guangxi Medical University, Nanning, 530021, China
2
Department of Biostatistics, University of Nebraska Medical Center, Omaha, 987521, USA
3
Department of Radiation Oncology, Fred & Pamela Buffett Cancer Center, University of Nebraska Medical Center, Omaha, 987521,
USA
* Corresponding Authors: Chi Lin. Email: ; Haixing Jiang. Email:
Oncologie 2022, 24(4), 865-895. https://doi.org/10.32604/oncologie.2022.025447
Received 12 July 2022; Accepted 30 September 2022; Issue published 31 December 2022
 View Full Text
 Download PDF
Abstract
Objective: The characteristics of clinical features and prognoses among patients with different racial backgrounds have not been clearly studied. We thus investigated the clinical characteristics and overall survival (OS) differences among Asian, White, and Black patients with pancreatic neuroendocrine tumors (pNETs). Materials and Methods: The Surveillance, Epidemiology, and End Results (SEER) database was queried to identify patients with pNETs between 1983 and 2015. We performed univariable (UVA) and multivariable logistic regression (MVA) to assess the association between variables and race category. A Kaplan-Meier (KM) plot was used to calculate the OS rates. The Cox proportional hazard regression was used to report the hazard of death. Results: We identified 9,494 patients with a median follow-up of 31 months. There were 5,541 Whites (78.6%), 942 Blacks (13.4%), and 569 Asians (8.1%). Asians were more likely to be younger, married, diagnosed at an earlier stage, and have a tumor located at the head of the pancreas. White patients were less likely to be married and had, on average, a higher percentage of the primary tumor at the tail of the pancreas, while Black patients were generally diagnosed at a much later stage. The median OS of Asians (71 months) was significantly higher than that of Whites (50 months, p = 0.03) and Blacks (53 months, p = 0.01). Multivariable Cox regression showed no OS difference among the three races after adjusting for independent prognostic factors, including age, marital status, primary site, TNM stage and treatment. Subgroup analysis in each race showed that age, M stage, and surgical treatment were independent prognostic factors for survival in all three races while being female, married, and in the N0 stage were positive prognostic factors of OS only in Whites. Among patients with surgery, Asians had the best OS. Conclusions: Asians had the best OS among those who received surgery. Age, M stage, and surgical treatment were the independent prognostic factors for survival across the three races. Female, married, and in the N0 stage were positive predictive factors for survival only in White patients.Keywords
Pancreatic neuroendocrine tumors (pNETs) originate from precursor cells in the pancreatic ductal epithelium with neuroendocrine differentiation and constitute up to 7% of all gastroenteropancreatic (GEP) neuroendocrine neoplasms (NENs) and 2% of all pancreatic neoplasmas [1,2]. pNET diagnoses have been dramatically increasing in the past few decades due to increased awareness and the improvement of detection methods [1]. A large retrospective population-based study reviewing the records of patients with pNETs from 1973 to 2012 reported that the incidence of pNETs in the US is 0.48 cases per 100,000 population, with a 5-year overall survival (OS) rate of around 50%. In Canada, the incidence of primary NETs increased more than two times from 1994 to 2009, with 0.5 cases per 100,000 increases of pNETs, which accounts for 9.3% of all GEP NETs [3]. PNETs appear to be much more common in continental Asians than in North Americans. Studies from China reported that pNETs represent 13.7%–35% of all GEP NENs with a median OS of 4.1 years [4,5]. The incidence of pNETs in Japan was 1.01 cases per 100,000 in 2005, which increased to 1.27 cases per 100,000 in 2010 [6,7]. The reasons for such geographic and ethnic predilections are not fully understood.
The treatment for pNETs is highly personalized and needs multidisciplinary effort. Surgery, as the only curative approach, is the first-line treatment for patients with pNETs [8]. Systemic chemotherapy is required in many patients with advanced, recurrent, or metastatic pNETs who are not eligible for surgery. Radiation therapy such as peptide receptor radionuclide therapy (PRRT) can also be applied in patients with advanced NETs who cannot undergo surgical resection [9]. To our best knowledge, no publication has reported the role which patients’ race including White, Black and Asian plays on treatment patterns and their associated outcomes.
Racial disparities are long-standing and well-documented for patients with various tumors in the United States. Other than incidence rates, clinical features, prognostic factors, and outcomes also vary regionally and genetically [10,11]. However, published studies describing the clinical characteristics of neuroendocrine neoplasms by race are limited. Typically, studies have grouped all GEP NENs together or have predated the current 8th edition AJCC staging. Comparisons among patients with diverse genetic and cultural backgrounds in the US have been poorly studied regarding incidence, clinical features, and prognostic factors for survival outcomes regarding pNETs. Considering the diverse population and ongoing demographic changes in the U.S., it is imperative for clinicians to recognize the racial/ethnic determinants which affect the risk and survival of patients with pNETs. Using the data from the National Cancer Institute’s Surveillance, Epidemiology and End Results (SEER) in the period between 1983 to 2015, we investigated the characteristics and prognostic factors associated with different racial groups and the impact of race on survival outcomes of pNET patients.
This study was conducted using the National Cancer Institute’s Surveillance, Epidemiology and End Results (SEER) database. Analyses were restricted to all cases diagnosed with pNETs from 1983 to 2015 in adults aged 19 and older. Patients with ICD-O-3 histology codes of 8150, 8151, 8152, 8153, 8155, 8156, 8157, 8240, 8241, 8242, 8243, 8246, and 8249 and pancreatic anatomical sites codes of C250, C251, C252, C253, C254, C255, C256, C258, and C259 were included. We categorized patients into three ethnic groups: White, Black, and Asian. Patients who did not fall into these three racial classifications or had incomplete follow-up information, unknown survival length, or incomplete histologic information were excluded from this study. Participants in the SEER database cannot be identified, neither directly nor through identifiers linked to the patients. Therefore, this research is eligible for exemption from IRB approval under 45 CFR 46.101(b)(4). The study followed the Strengthening the Reporting of Observational Studies in Epidemiology (STROBE) reporting guideline.
Variables such as race, age, year of diagnosis, gender, marital status, primary tumor location, TNM stage, treatment, and metro-rural residence were obtained from the SEER database. Age was transformed into a categorical variable and categorized into four groups: 19–49, 50–59, 60–69, and >70 years old. Treatment was classified as no treatment, chemotherapy only, surgery only, chemotherapy and surgery, and radiation therapy (all the patients who received radiation therapy regardless of any other treatments they have received). Marital status was registered as single/unmarried partner, married, separated/divorced, widowed, and unknown marital status. The year of diagnosis was categorized into four groups 1983–2002, 2003–2007, 2008–2012, and 2013–2015. OS was used as the metric for survival outcome, which was defined as the time from the date of the diagnosis to the date of any death or last follow-up.
Categorical and continuous variables were described. Univariable and multivariable logistic regression analyses were performed to assess the association between variables and race category. Logistic regression was used to estimate odds ratios (ORs) and 95% confidence interval (CIs) for the race by potential risk factors. Multivariable survival analyses were also conducted, and the adjusted odds ratios (ORs-adj) with 95% CIs were reported after adjusting for age, year of diagnosis, gender, marital status, primary site, TNM stage, treatment, and rural-metro residence. Kaplan-Meier survival curves were plotted, and the log-rank test was used to estimate the difference among groups. Cox proportional hazards regression was used to report the hazard ratio (HR) and its 95% CIs for all variables of interest. The propensity match was carried out using nearest neighbor matching selections with an exact match in gender. In the process, 1:1 matching was done sequentially for White or Black to be matched with each Asian record based on propensity score without replacement but to have the same value for gender [12].
Variables that showed a significant association with a p-value of <0.05 in univariable analysis were included in multivariable regression models. Statistical significance was set at two-sided with a p-value less than 0.05. All the statistical analyses were performed with SAS software (version 9.4).
3.1 Demographic and Clinical Characteristics among White, Asian, and Black Patients
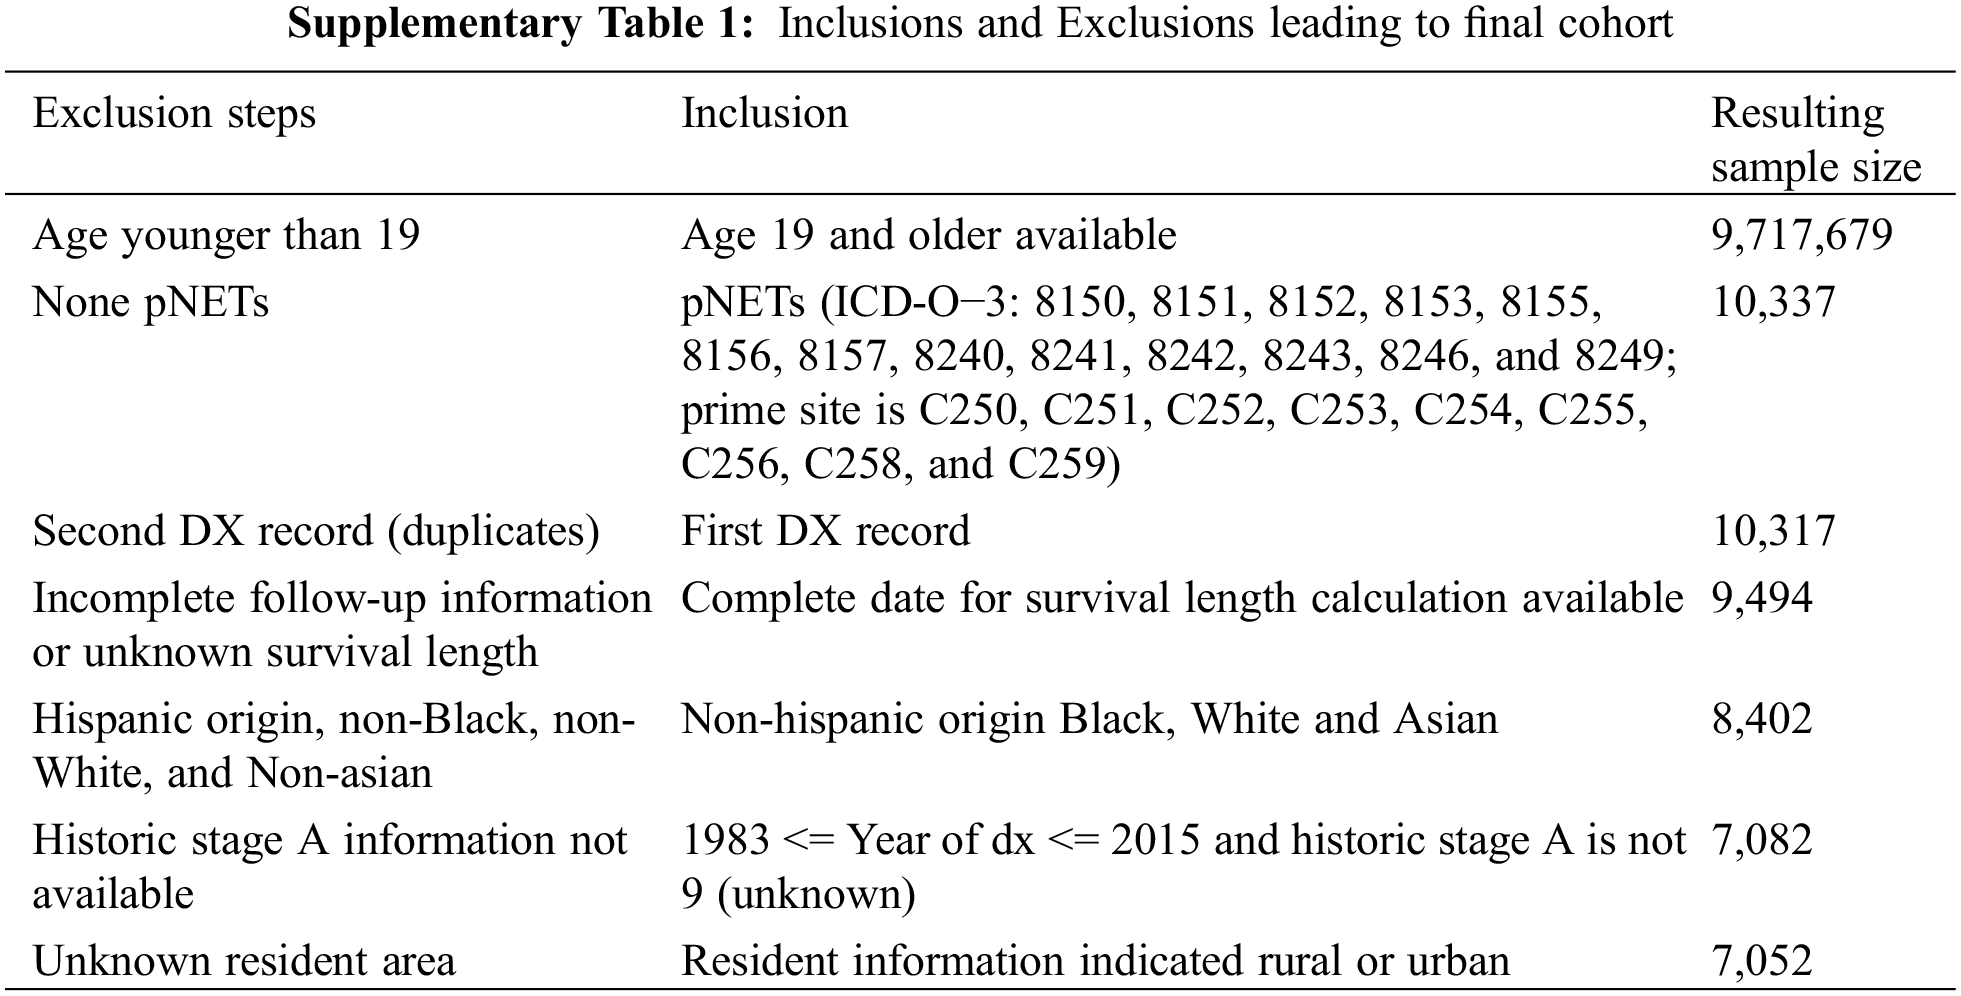
This study identified 10,337 patients diagnosed with pNETs at 19 or older between 1983 and 2015. Of these, 9,494 patients had follow-up information after removing duplicates. We excluded patients of Hispanic, non-Black, non-White, or non-Asian origin and those that lacked race and/or historical information, leading to a total of 7,052 eligible patients who met the study criteria and were included in the study (Supplemental Table 1). Of 7,052, 5,541 were non-Hispanic White patients (78.6%), 942 non-Hispanic Black patients (13.4%), and 569 non-Hispanic Asian patients (8.1%) (Table 1).
The median age of the entire cohort was 62 years (range 19–98 years), while the median ages of White, Black, and Asian were 63 years (range 19–98 years), 59 years (range 19–92 years), and 61 years (range 22–97 years), respectively. Compared to Black and White patients, Asian patients tended to be younger at diagnosis. On the other hand, more than half (54.28%) of Black patients were diagnosed between the ages of 50–69, and most White patients tended to be diagnosed at an age older than 60 (p < 0.01) (Table 1).
The entire study cohort included 3,969 (56%) males. A majority of patients were male in White (57.9%) and Asian patient populations (54.8%), whereas a majority of Black patients were female (52.3%). Compared to Black patients, a remarkably higher percentage of Asian and White patients were married. Although more patients have been diagnosed in recent years for all three races, the total number of Asian patients has increased much faster than Black and White patients in the last two decades (Table 1).
The most common primary site was the head of the pancreas in Black and Asian patients (33.3% and 33.0%, respectively), while the tail of the pancreas was the most common location in White patients (32%). Black patients were significantly less likely to develop pNETs on the tail of the pancreas than Asians (p = 0.01) and Whites (p < 0.001). In addition, Asian patients were more frequently diagnosed at earlier stages than other racial groups. In contrast, more Black patients presented with more advanced T stages than Asian and White patients, as well as more advanced N and M stages than Asian patients. Furthermore, a higher percentage of Asian and Black patients lived in a metropolitan area than White patients (96.8%, 94.1%, and 88.6%, respectively) (Table 1).
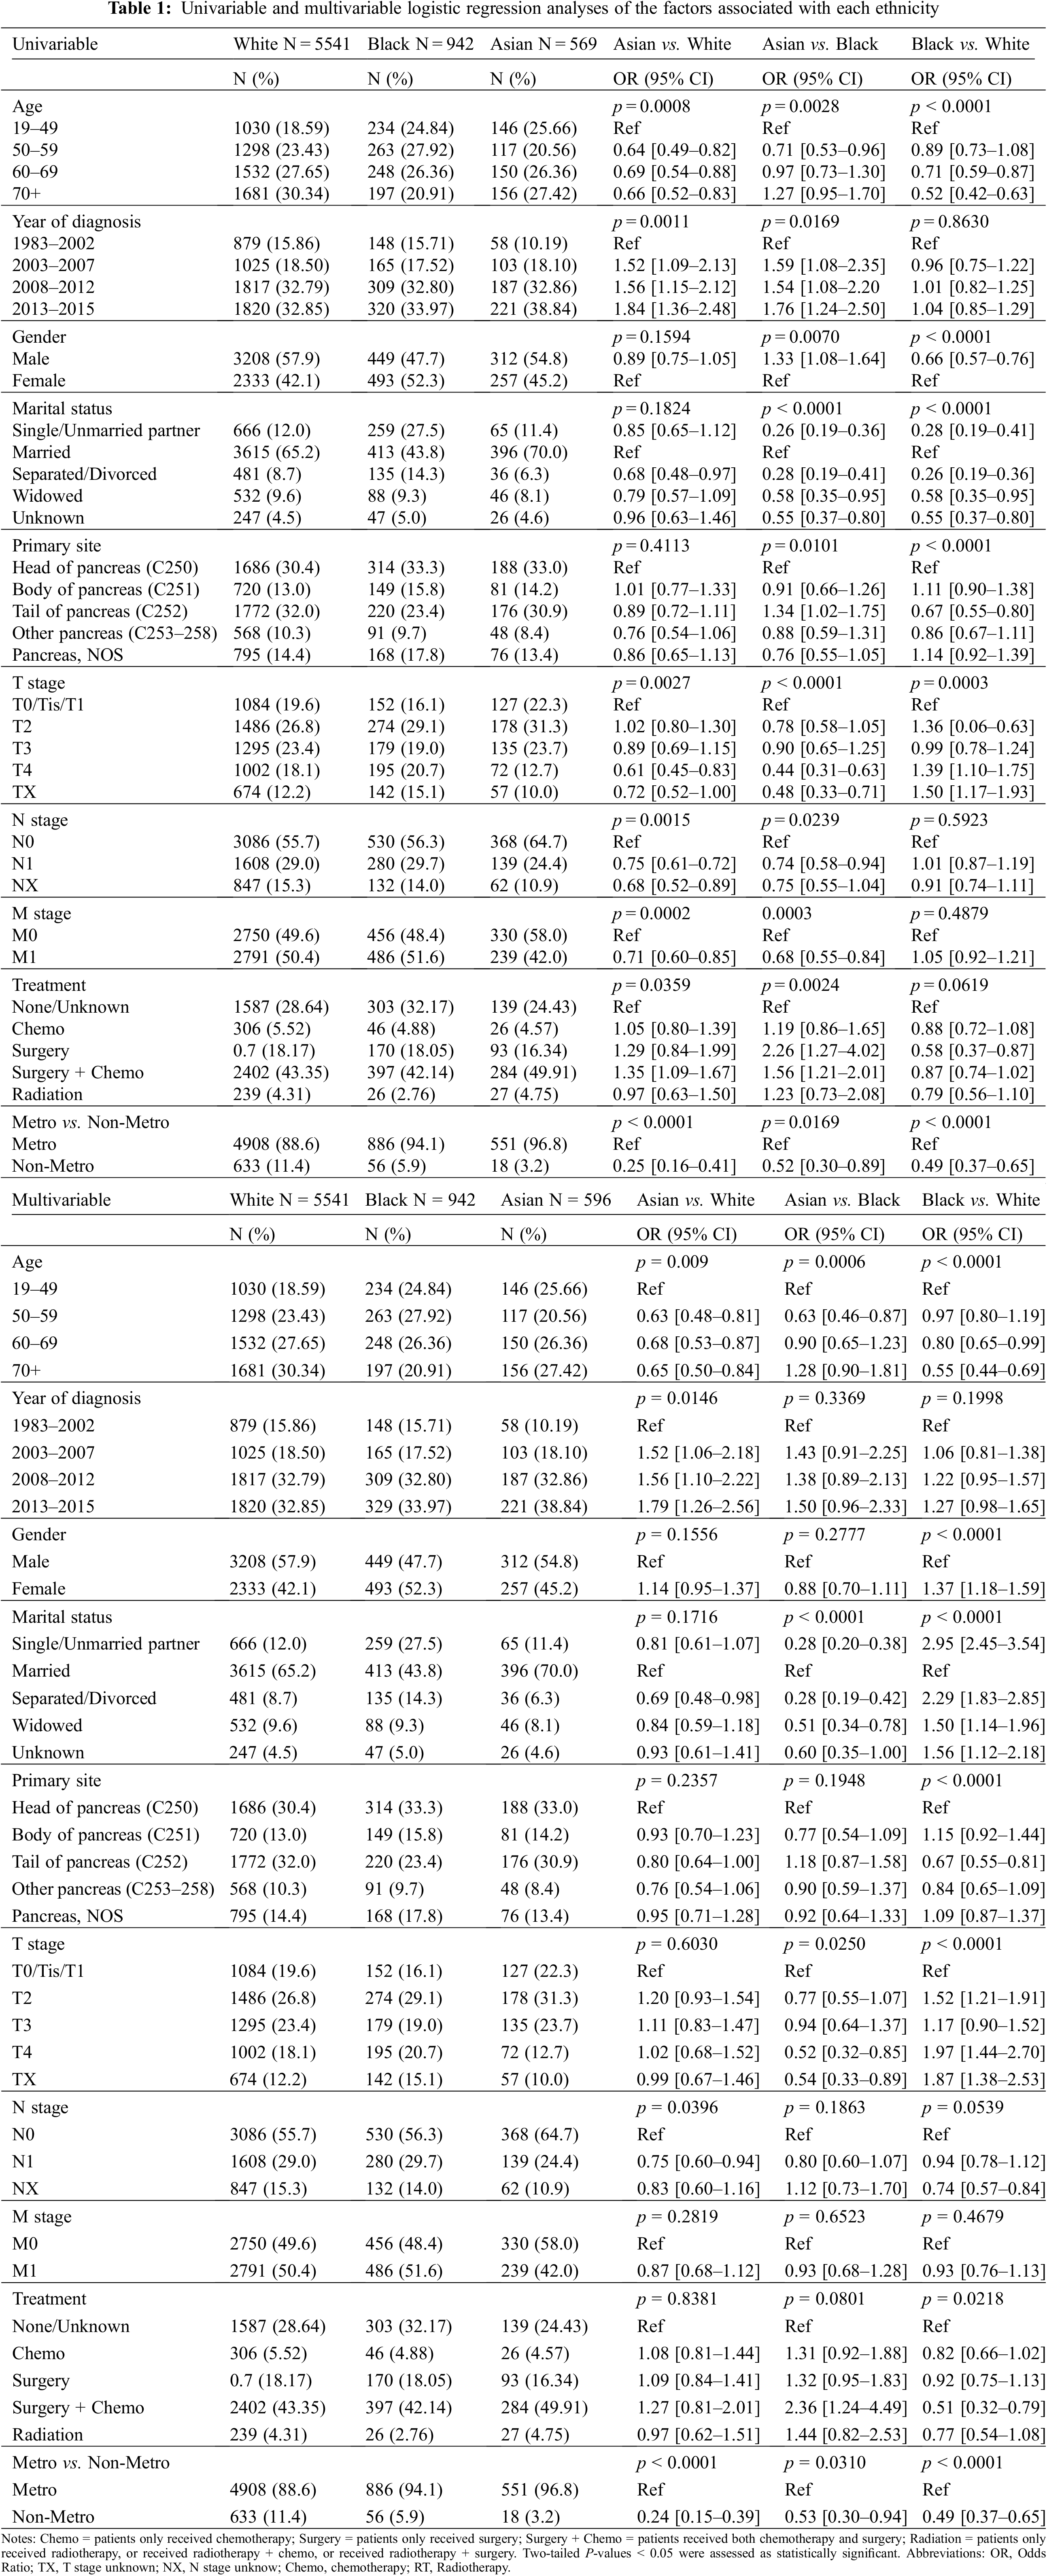
3.2 Logistic Regression Analysis of the Factors Associated with Each Race
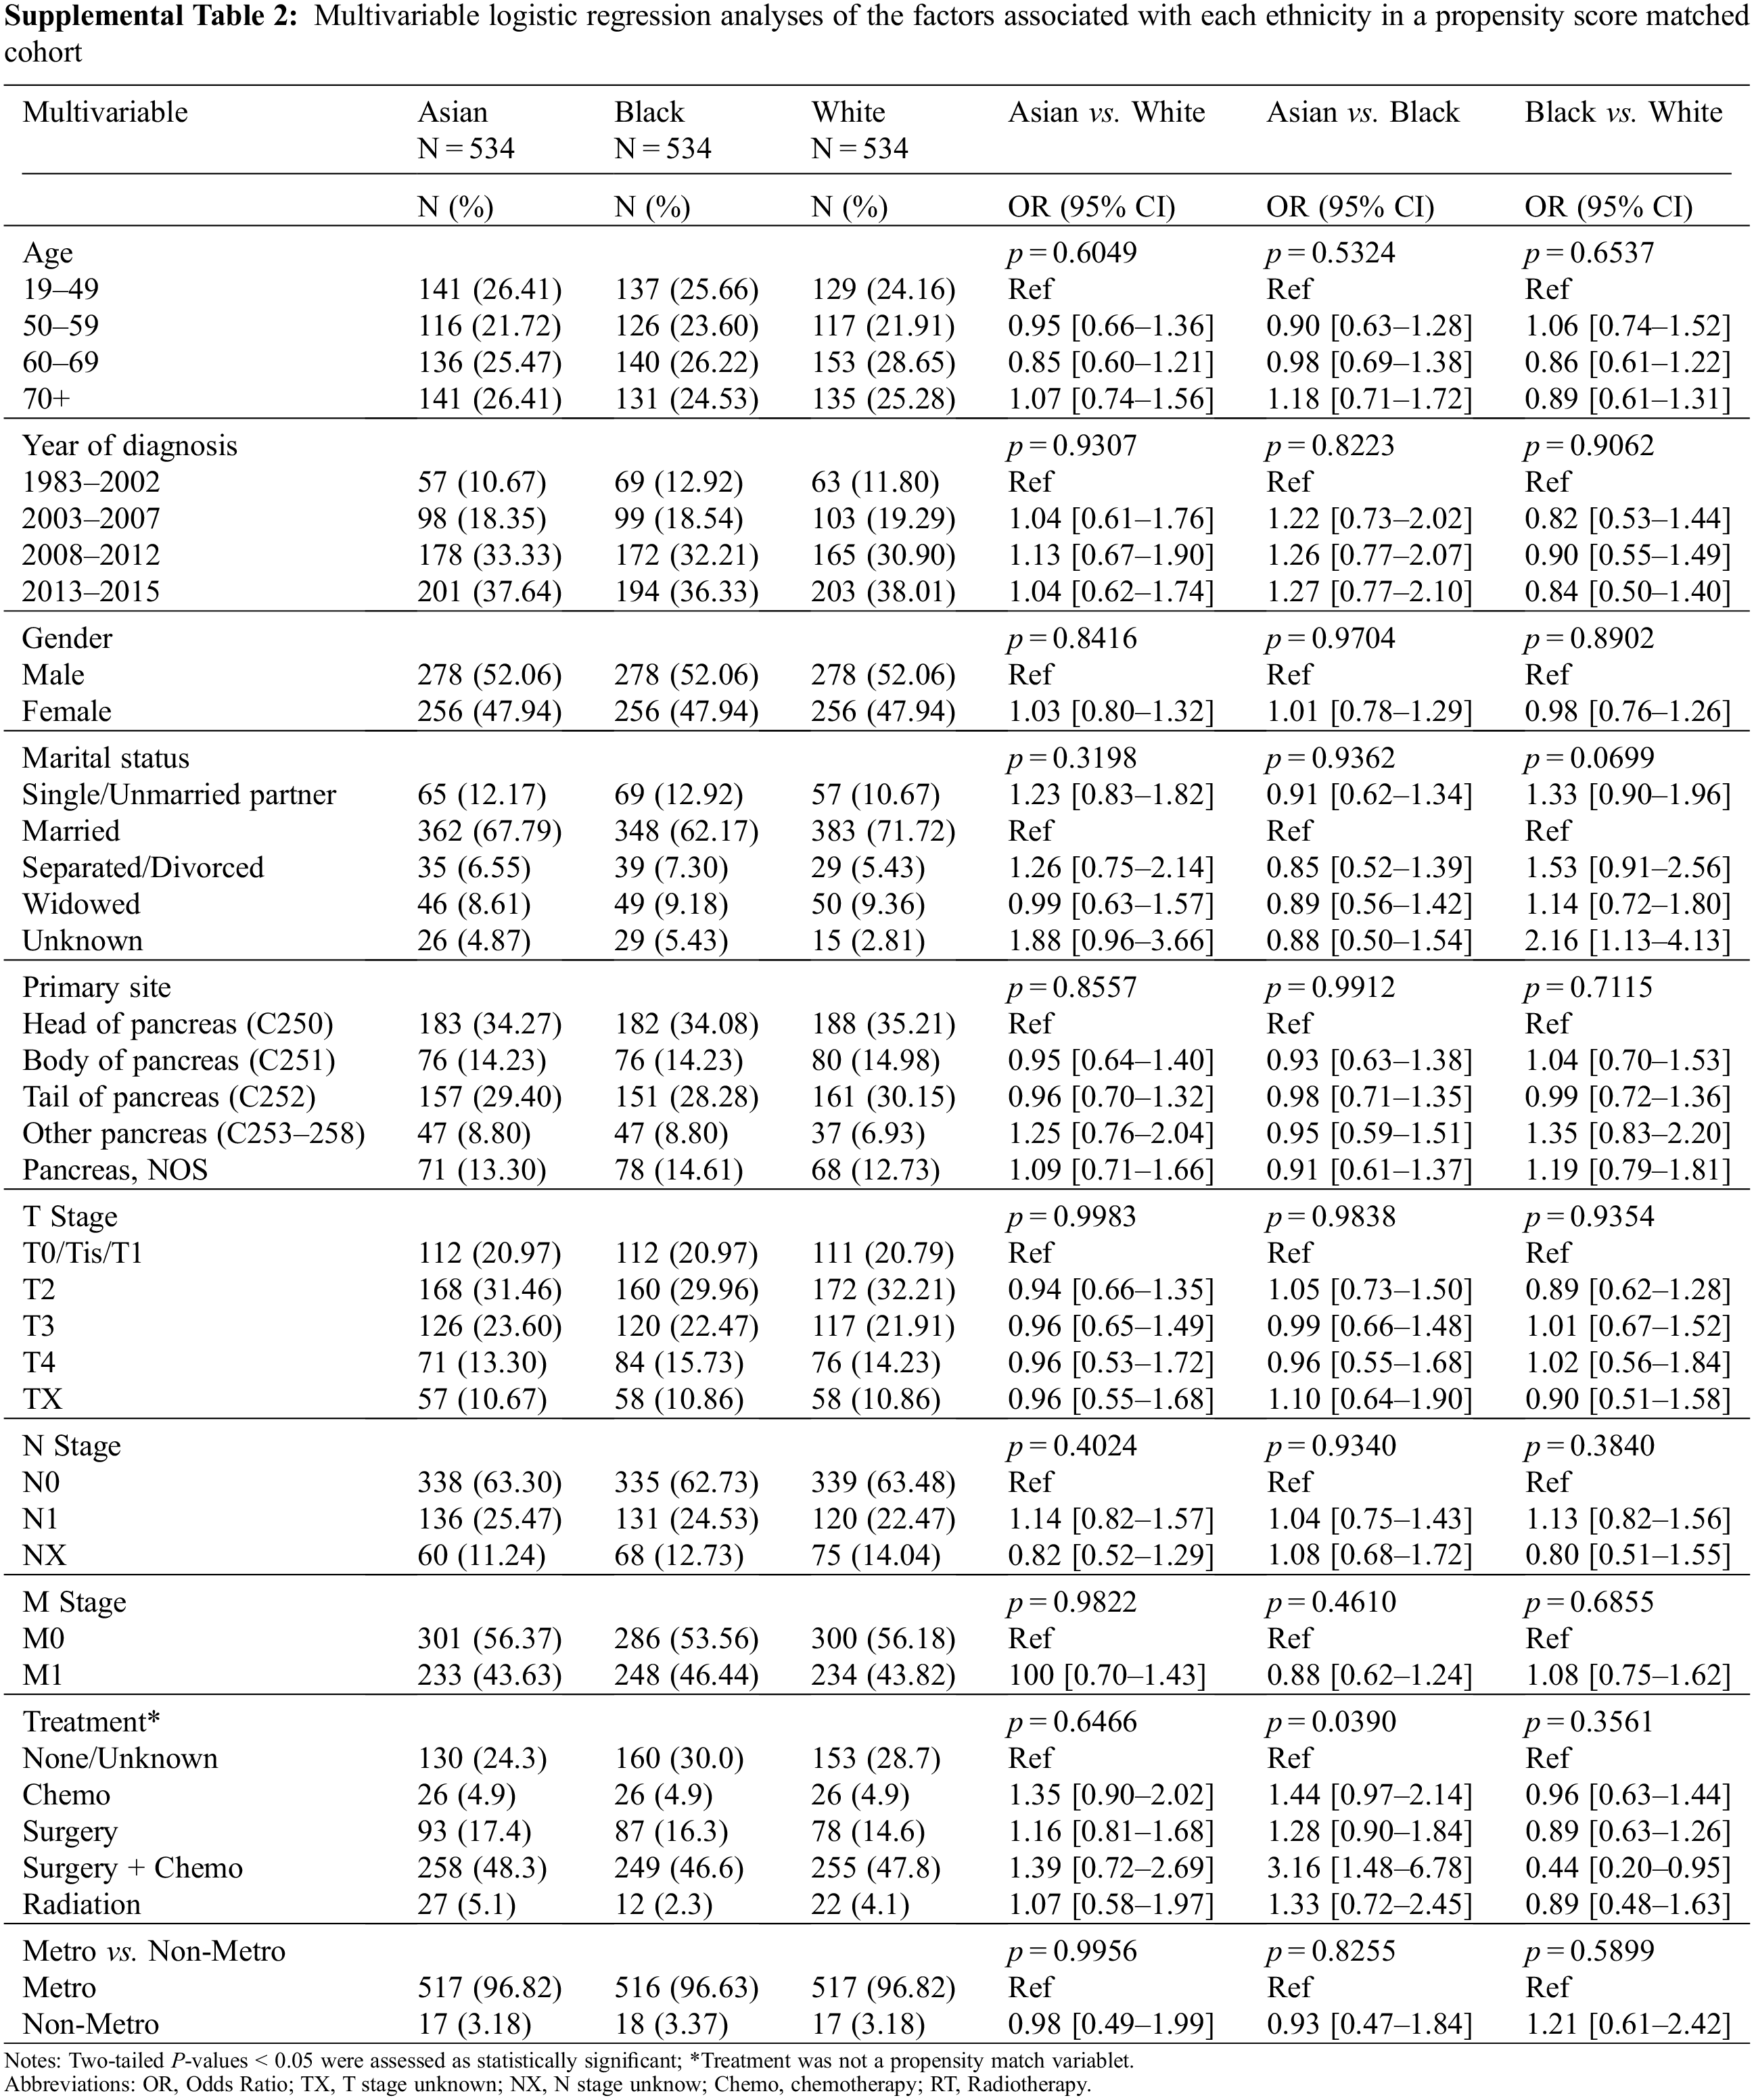
After adjusting for the covariates such as age, year of diagnosis, gender, marital status, primary site, TNM stage, treatment, and metro-rural residence, the multivariable logistic analysis revealed that a statistically significant difference was observed among races in the distribution of age, marital status, T stage, and metro-rural residence (Table 1). When comparing Asian to White patients, those with ages ranging from 19 to 49 were more likely to be Asian (p < 0.01). Patients diagnosed later than 2003 were more likely to be White (p < 0.01). Patients with a higher TNM stage (T4 vs. T0-1, N1 vs. N0, and M1 vs. M0) were less likely to be Asian, and patients who lived in a non-metro area were also less likely to be Asian (OR 0.25, p < 0.01). When comparing Asian to Black patients, those that were Asian were more likely to be younger than 50 years old, married, diagnosed after 2003, have an earlier T stage at diagnosis, and live in a metropolitan area (p < 0.01). Finally, when comparing Black and White patients, those older than 50, female, not married, and in an earlier T stage were more likely to be Black. The ORs-adj are shown in Table 1.
3.3 The Association of Race with Overall Survival in the Entire Study Cohort
There were 176 deaths (30.9%) in Asian patients (n = 569), 343 deaths (36.4%) in Black patients (n = 942), and 1,963 deaths (35.4%) in White patients (n = 5541). The median follow-up was 31 months. The median survival and mean survival for all patients were 31 and 44.56 months, respectively. Kaplan-Meier survival curves for all patients and for each race are displayed in Figs. 1A and 1B. The median survival (71 months) and 5-year OS (55.1%) of Asian patients were significantly higher than that of White (50 months, 46.9%, p = 0.03) and Black patients (53 months, 46.5%, p = 0.01) (Fig. 1B).
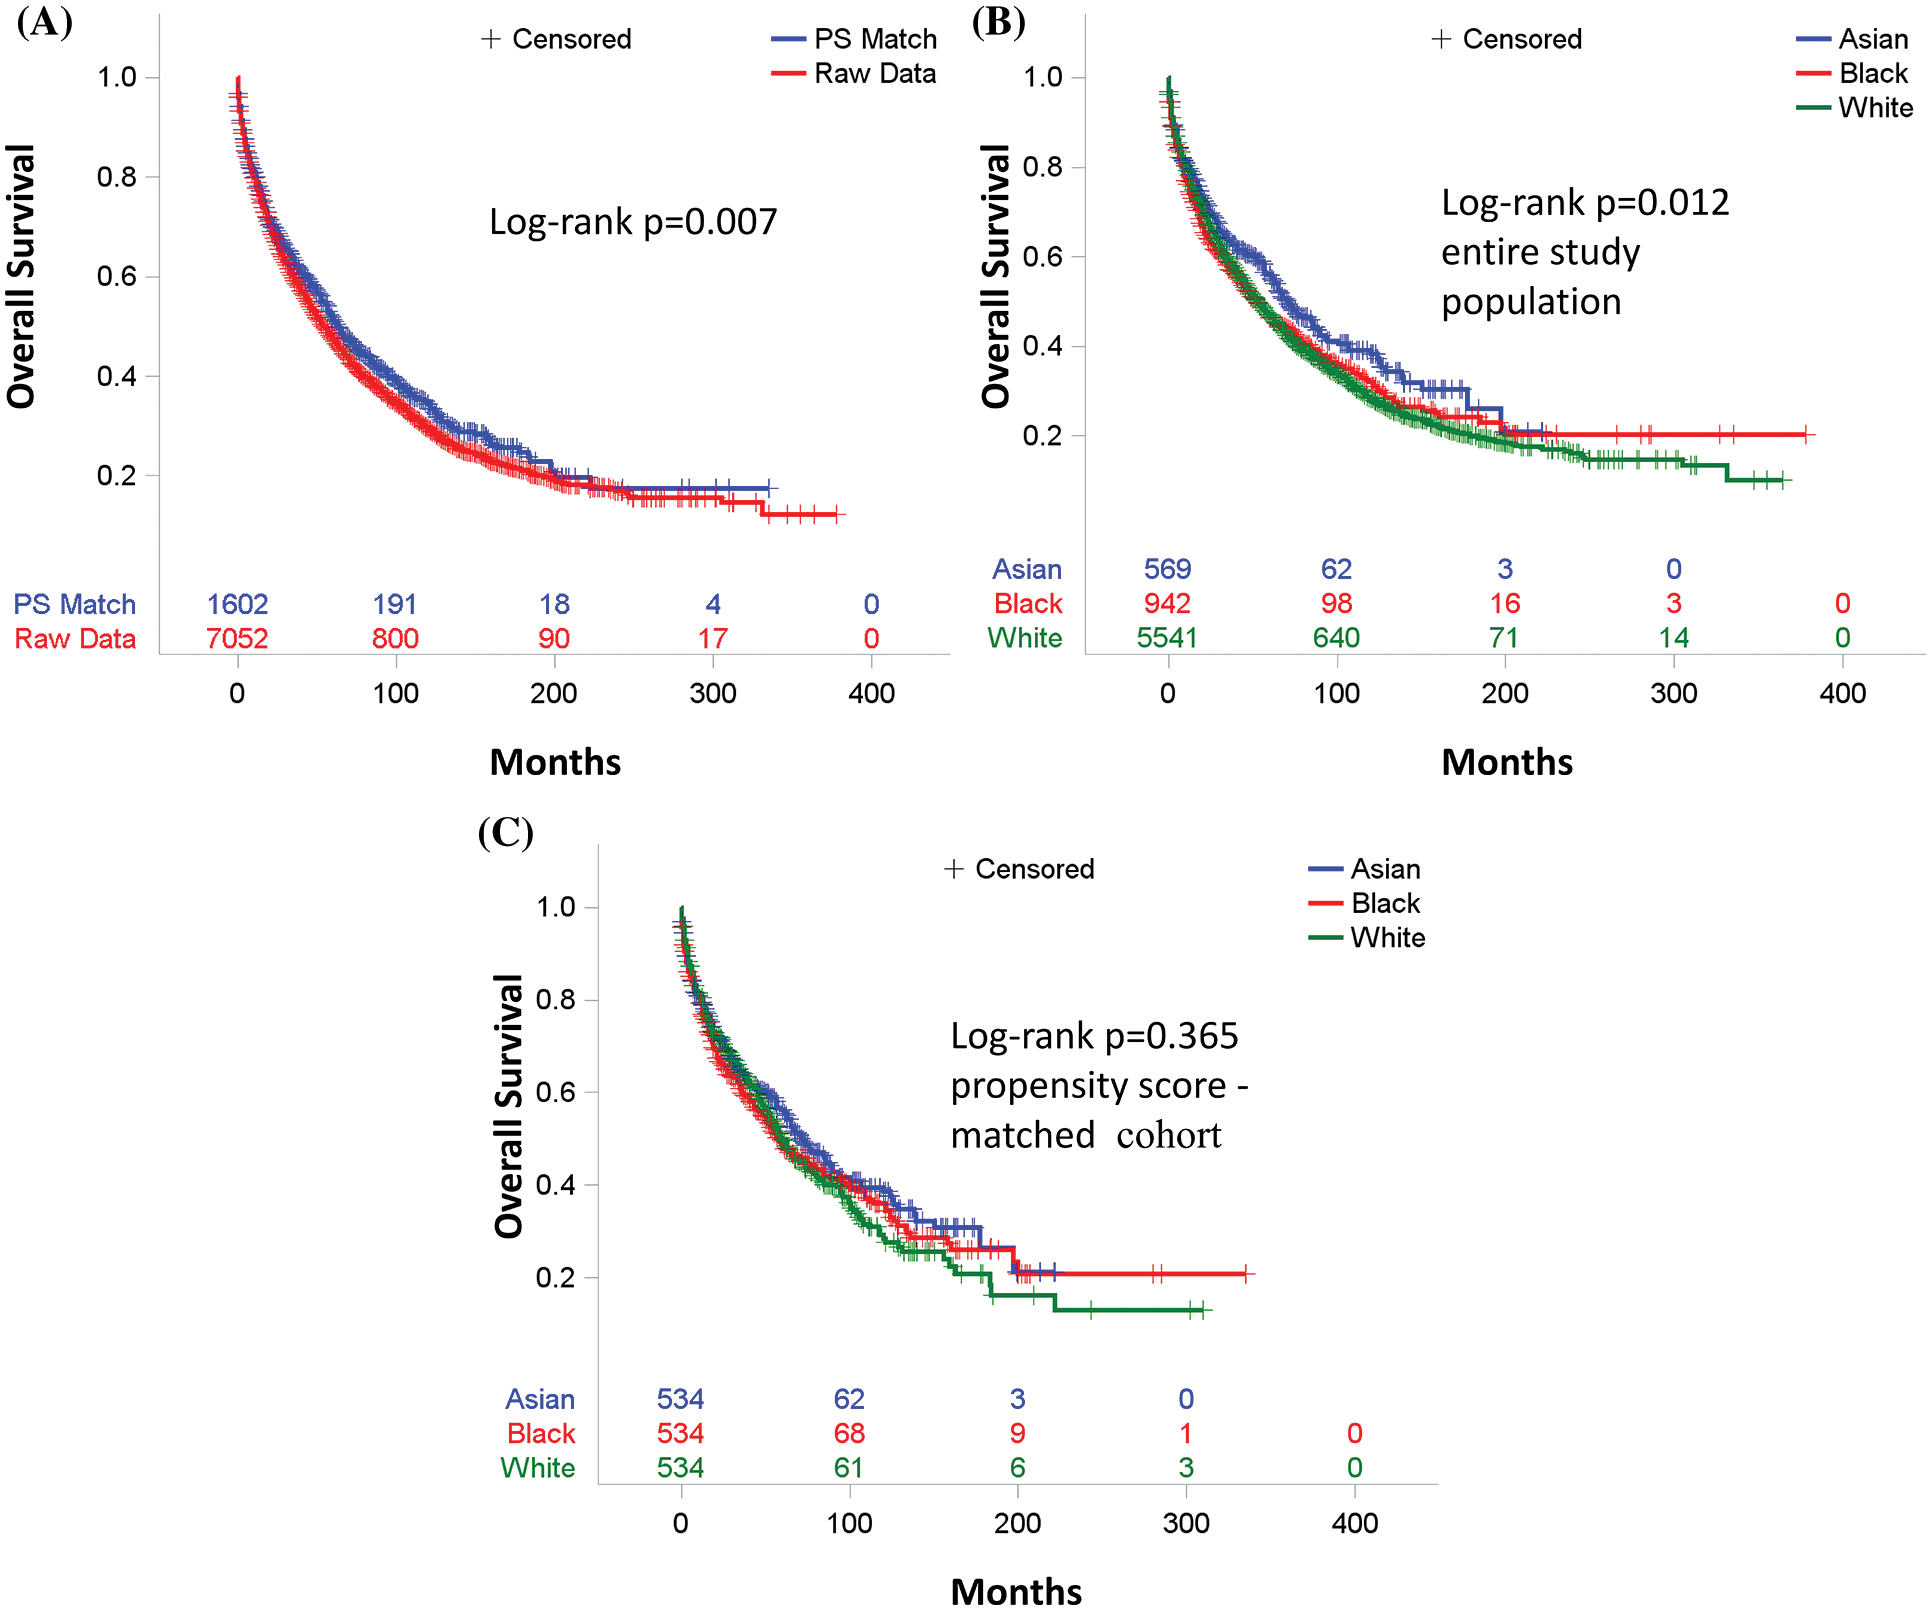
Figure 1: Overall survival. (A) For entire study population (Red) and propensity score-matched (Blue) cohort. (B) For entire study population by race [Asian (Blue) vs. Black (Red) vs. White (Green)]. p value (Asian vs. Black) = 0.01, p value (Asian vs. White) = 0.03, and p value (White vs. Black) = 1. (C) For propensity score–matched cohort by race [Asian (Blue) vs. Black (Red) vs. White (Green)]. p value (Asian vs. Black) = 0.72, p value (Asian vs. White) = 0.57, and p value (White vs. Black) = 1
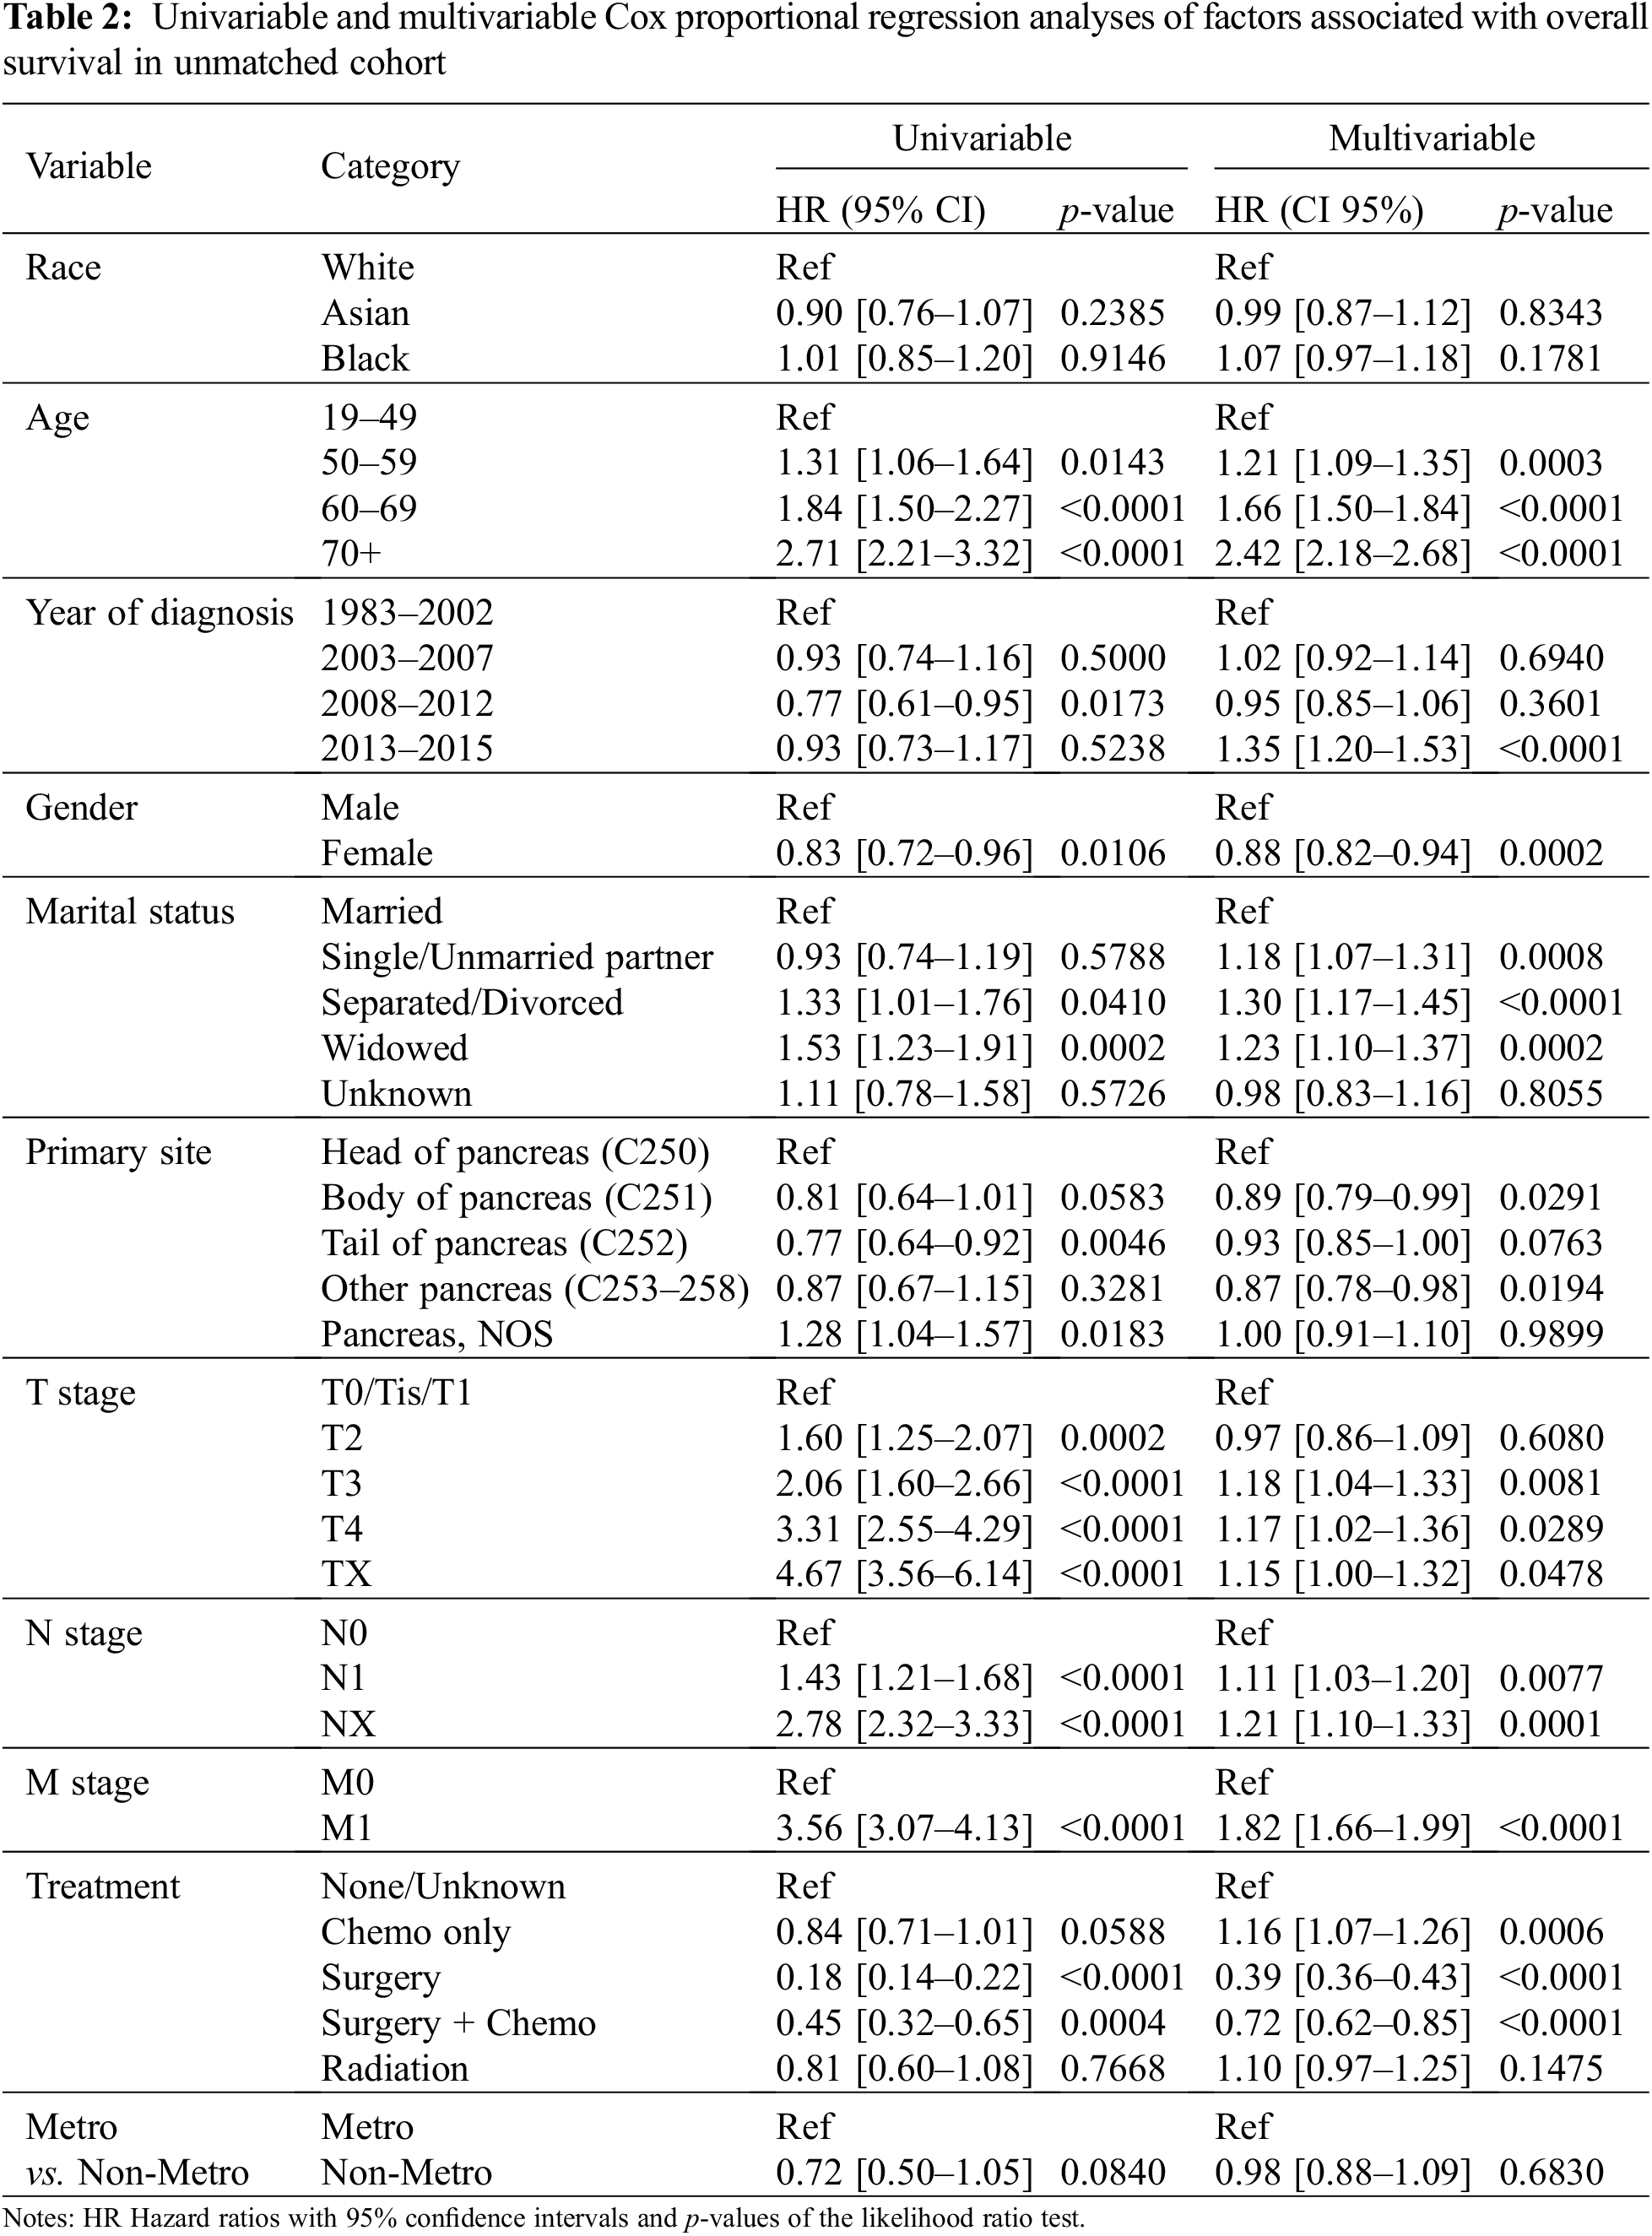
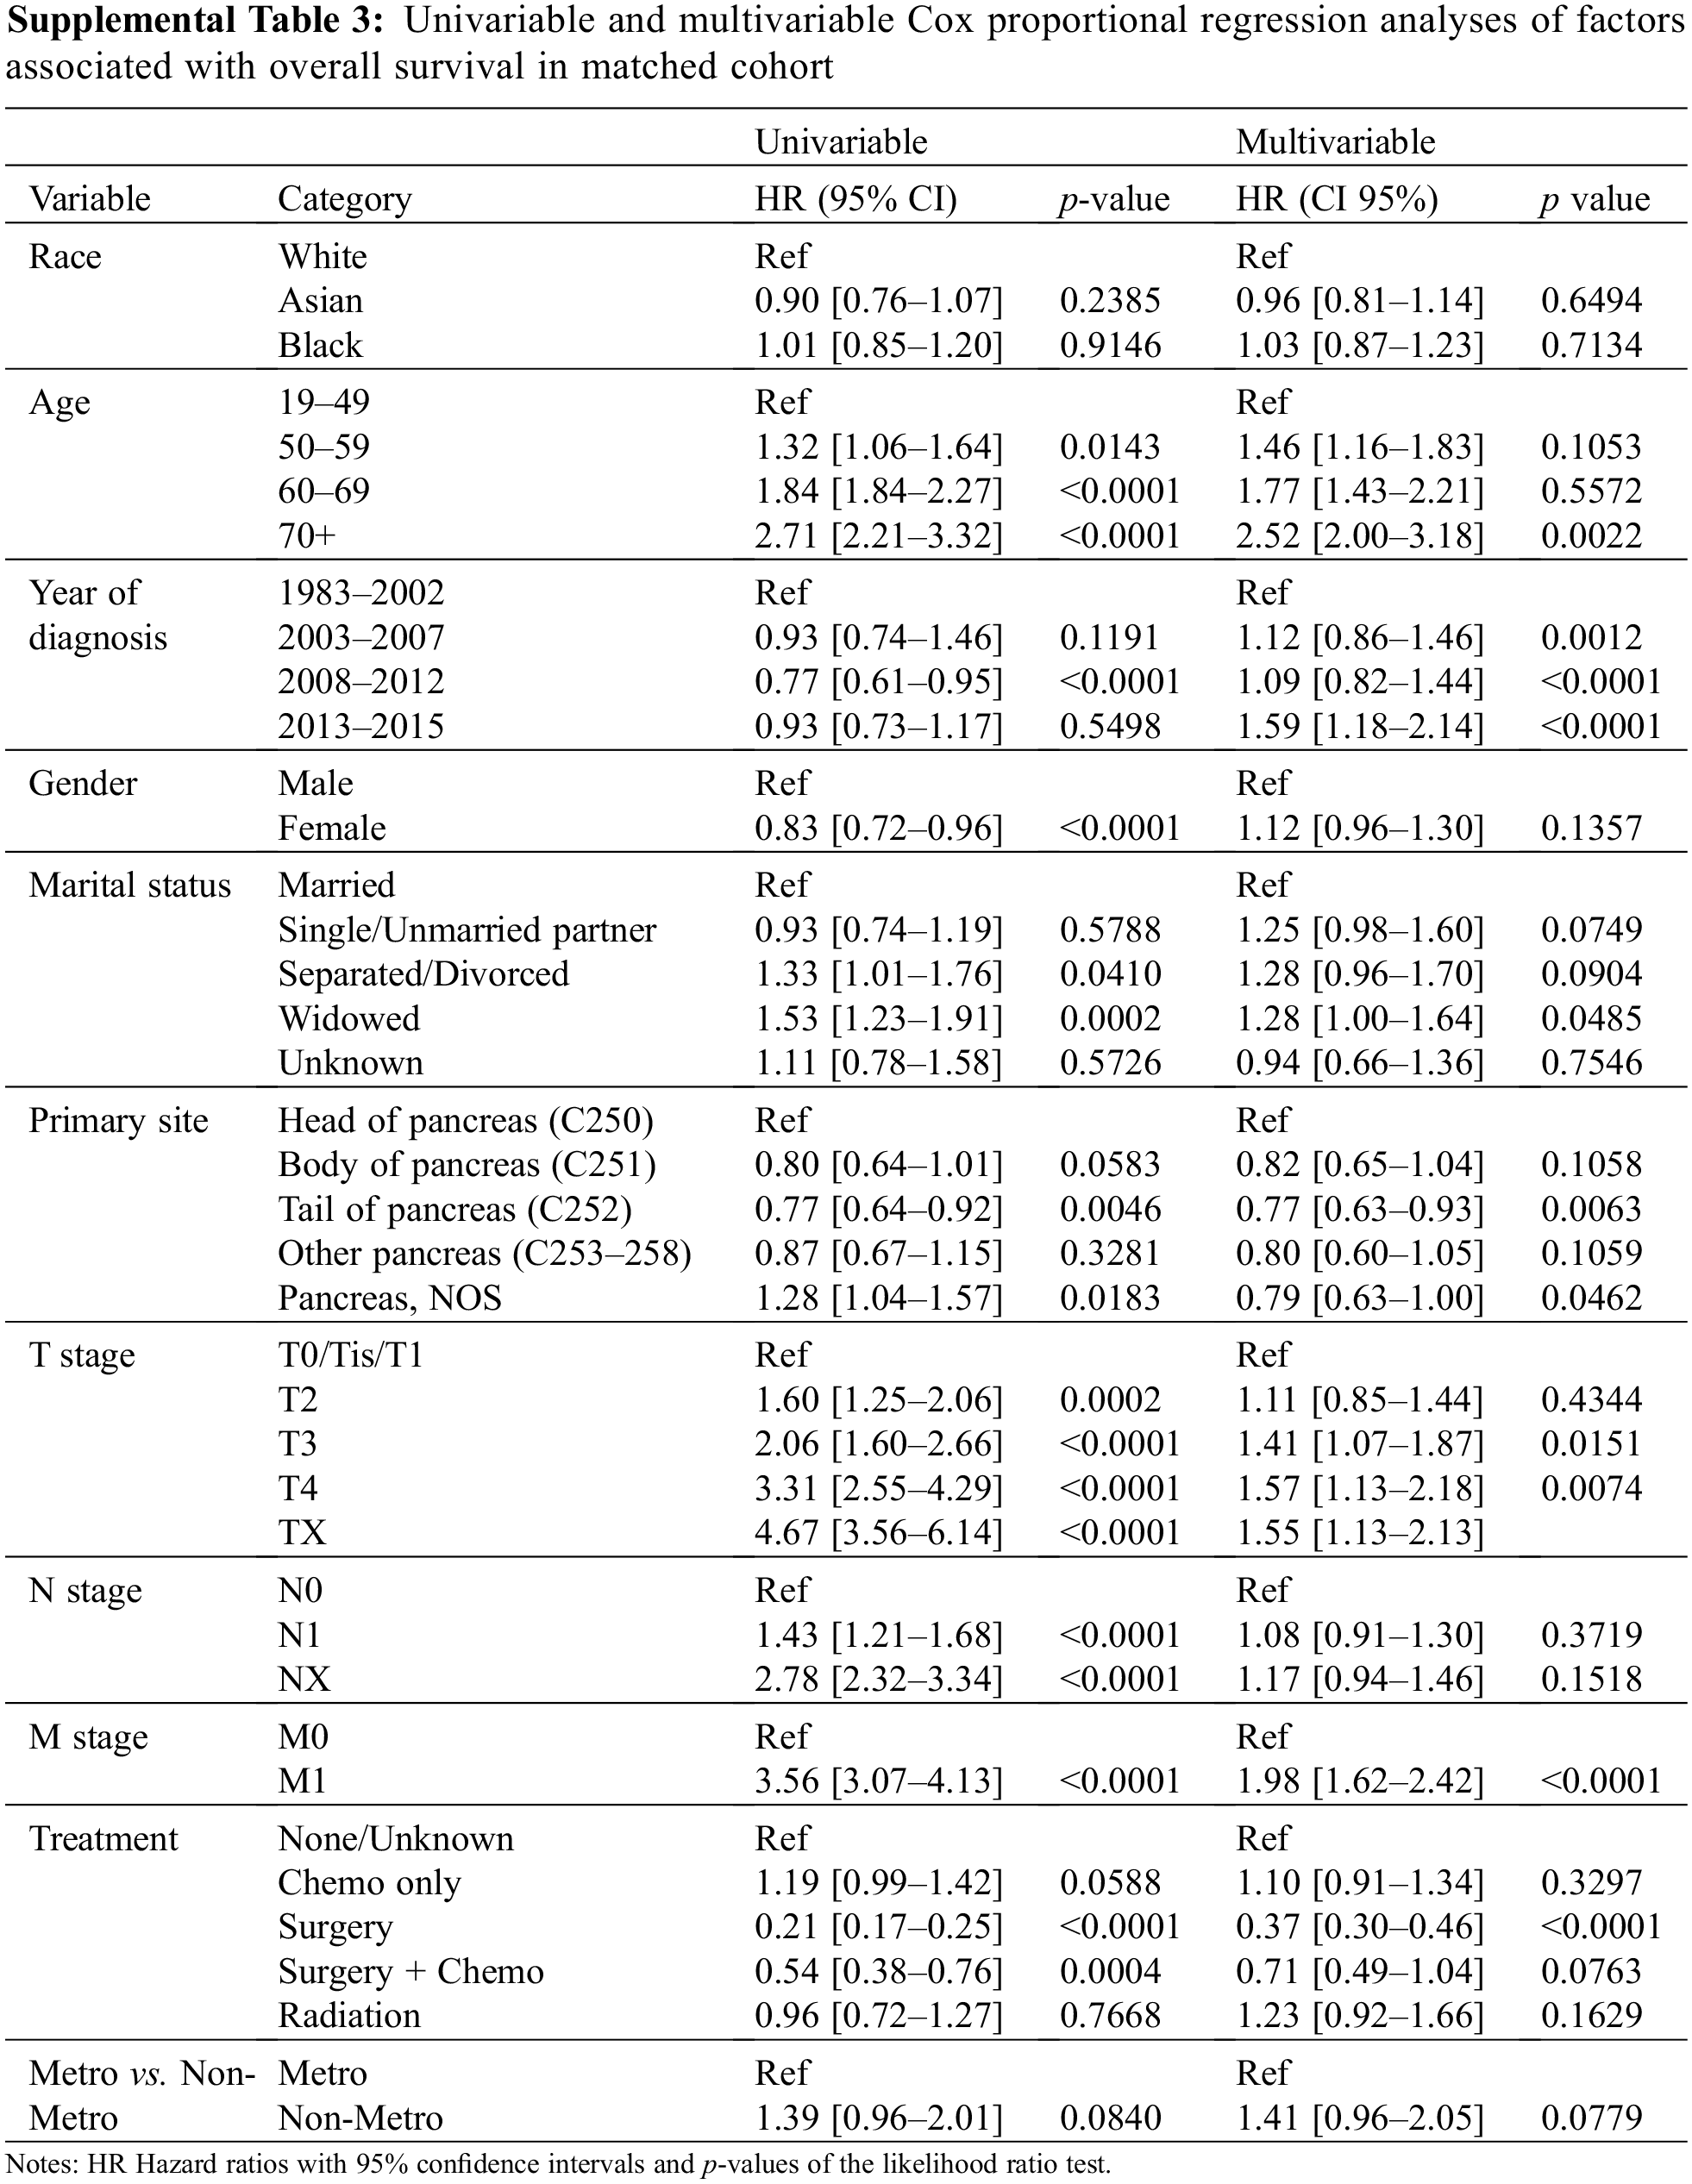
Univariable Cox proportional hazard analysis revealed no association between race and the OS in the entire study cohort (Table 2). After adjusting for age, year of diagnosis, gender, marital status, primary site, TNM stage, treatment, and residency area, race still is not a prognostic factor for OS in a multivariable Cox proportional hazard analysis (Table 2).
3.4 The Association of Race with Overall Survival in the Propensity Score-Matched Cohort
To minimize selection bias, a propensity score (PS)-matched analysis was performed. After matching age, gender, marital status, primary site, year of diagnosis, TNM stage, treatment, and metro-rural residence, 534 patients were identified in each ethnic group. Patient characteristics in three ethnic groups were well-balanced across all known covariates (Supplemental Table 2). Kaplan-Meier survival curves for unmatched and PS-matched cohorts are displayed in Fig. 1A. In the PS-matched cohort, median survival and 5-year OS for Asian patients (71 months, 55.5%) were slightly higher than that of White (60 months, 49.9%, p = 0.57) and Black patients (58 months, 47.9%, p = 0.72), but with no statistical significance. No difference in OS was seen between White and Black patients in the PS-matched cohort (p = 1) (Fig. 1C). Although Asian as race is associated with a better OS than White in a univariable Cox proportional hazard analysis (Supplemental Table 3), race no longer becomes a prognostic factor for OS within the PS-matched cohort after adjusting for age, year of diagnosis, gender, marital status, primary site, TNM stage, treatment, and residency area in the multivariable Cox proportional hazard analysis (Supp Table 3).
3.5 The Association of Race with Overall Survival in the Sub-Treatment Groups
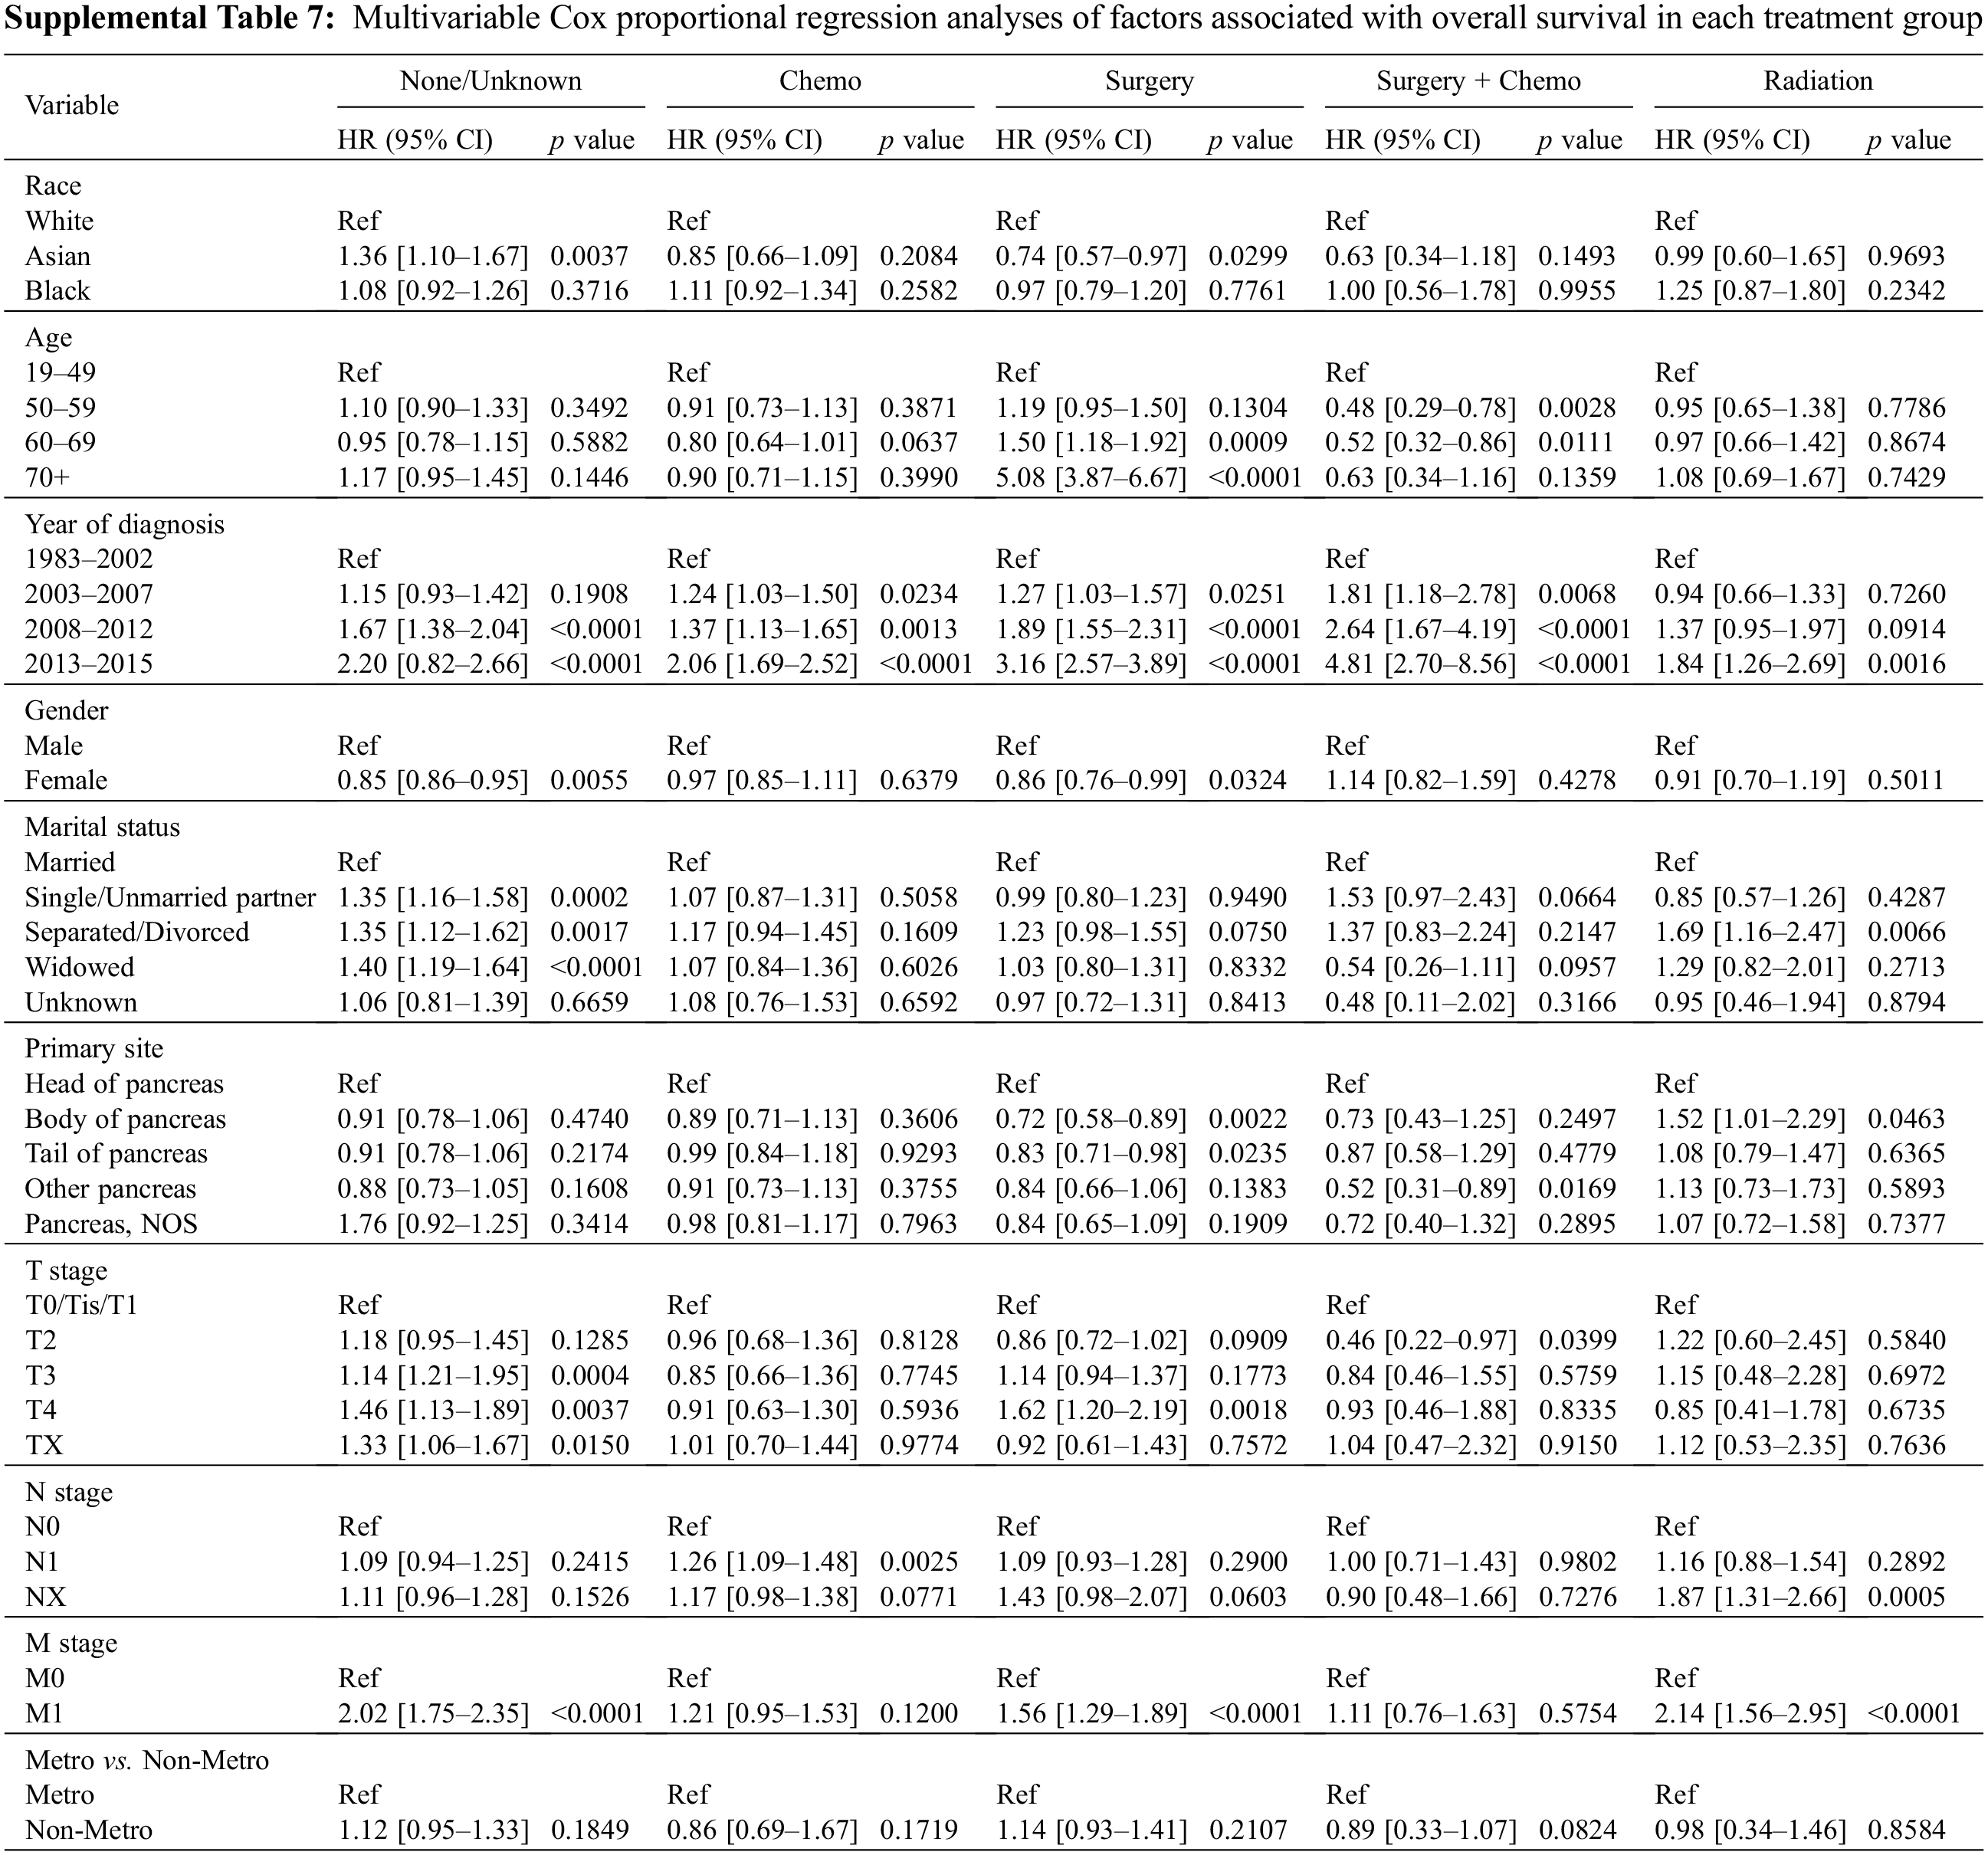
To further explore the association of race with OS in different subpopulations, we stratified the study cohort by type of treatment, age, and year of diagnosis. We first compared the OS among three races in the five treatment subgroups. In patients who received surgery, those that were Asian had the best OS (Fig. 2C, p = 0.03). In patients who received surgery and chemotherapy, the OS of Asian patients again exceeded the OS of Black and White patients (Fig. 2D, p = 0.048). There are no statistically significant differences in OS among the three races in all other treatment subgroups, including chemotherapy, radiation, and none/unknown groups (Figs. 2A, 2B and 2E). Multivariable analysis was conducted after adjusting for the covariates, including age, year of diagnosis, gender, marital status, primary site, TNM stage, treatment, and residency area. The risk of death of Asian patients in the surgery group was 26% less than that of White patients (HR 0.74, 95% CI 0.57–0.97, p = 0.0299) but not significantly less than that of Black patients (HR 0.77, 95% CI 0.56–1.06, p > 0.05) (Fig. 3C, Supplemental Table 7).
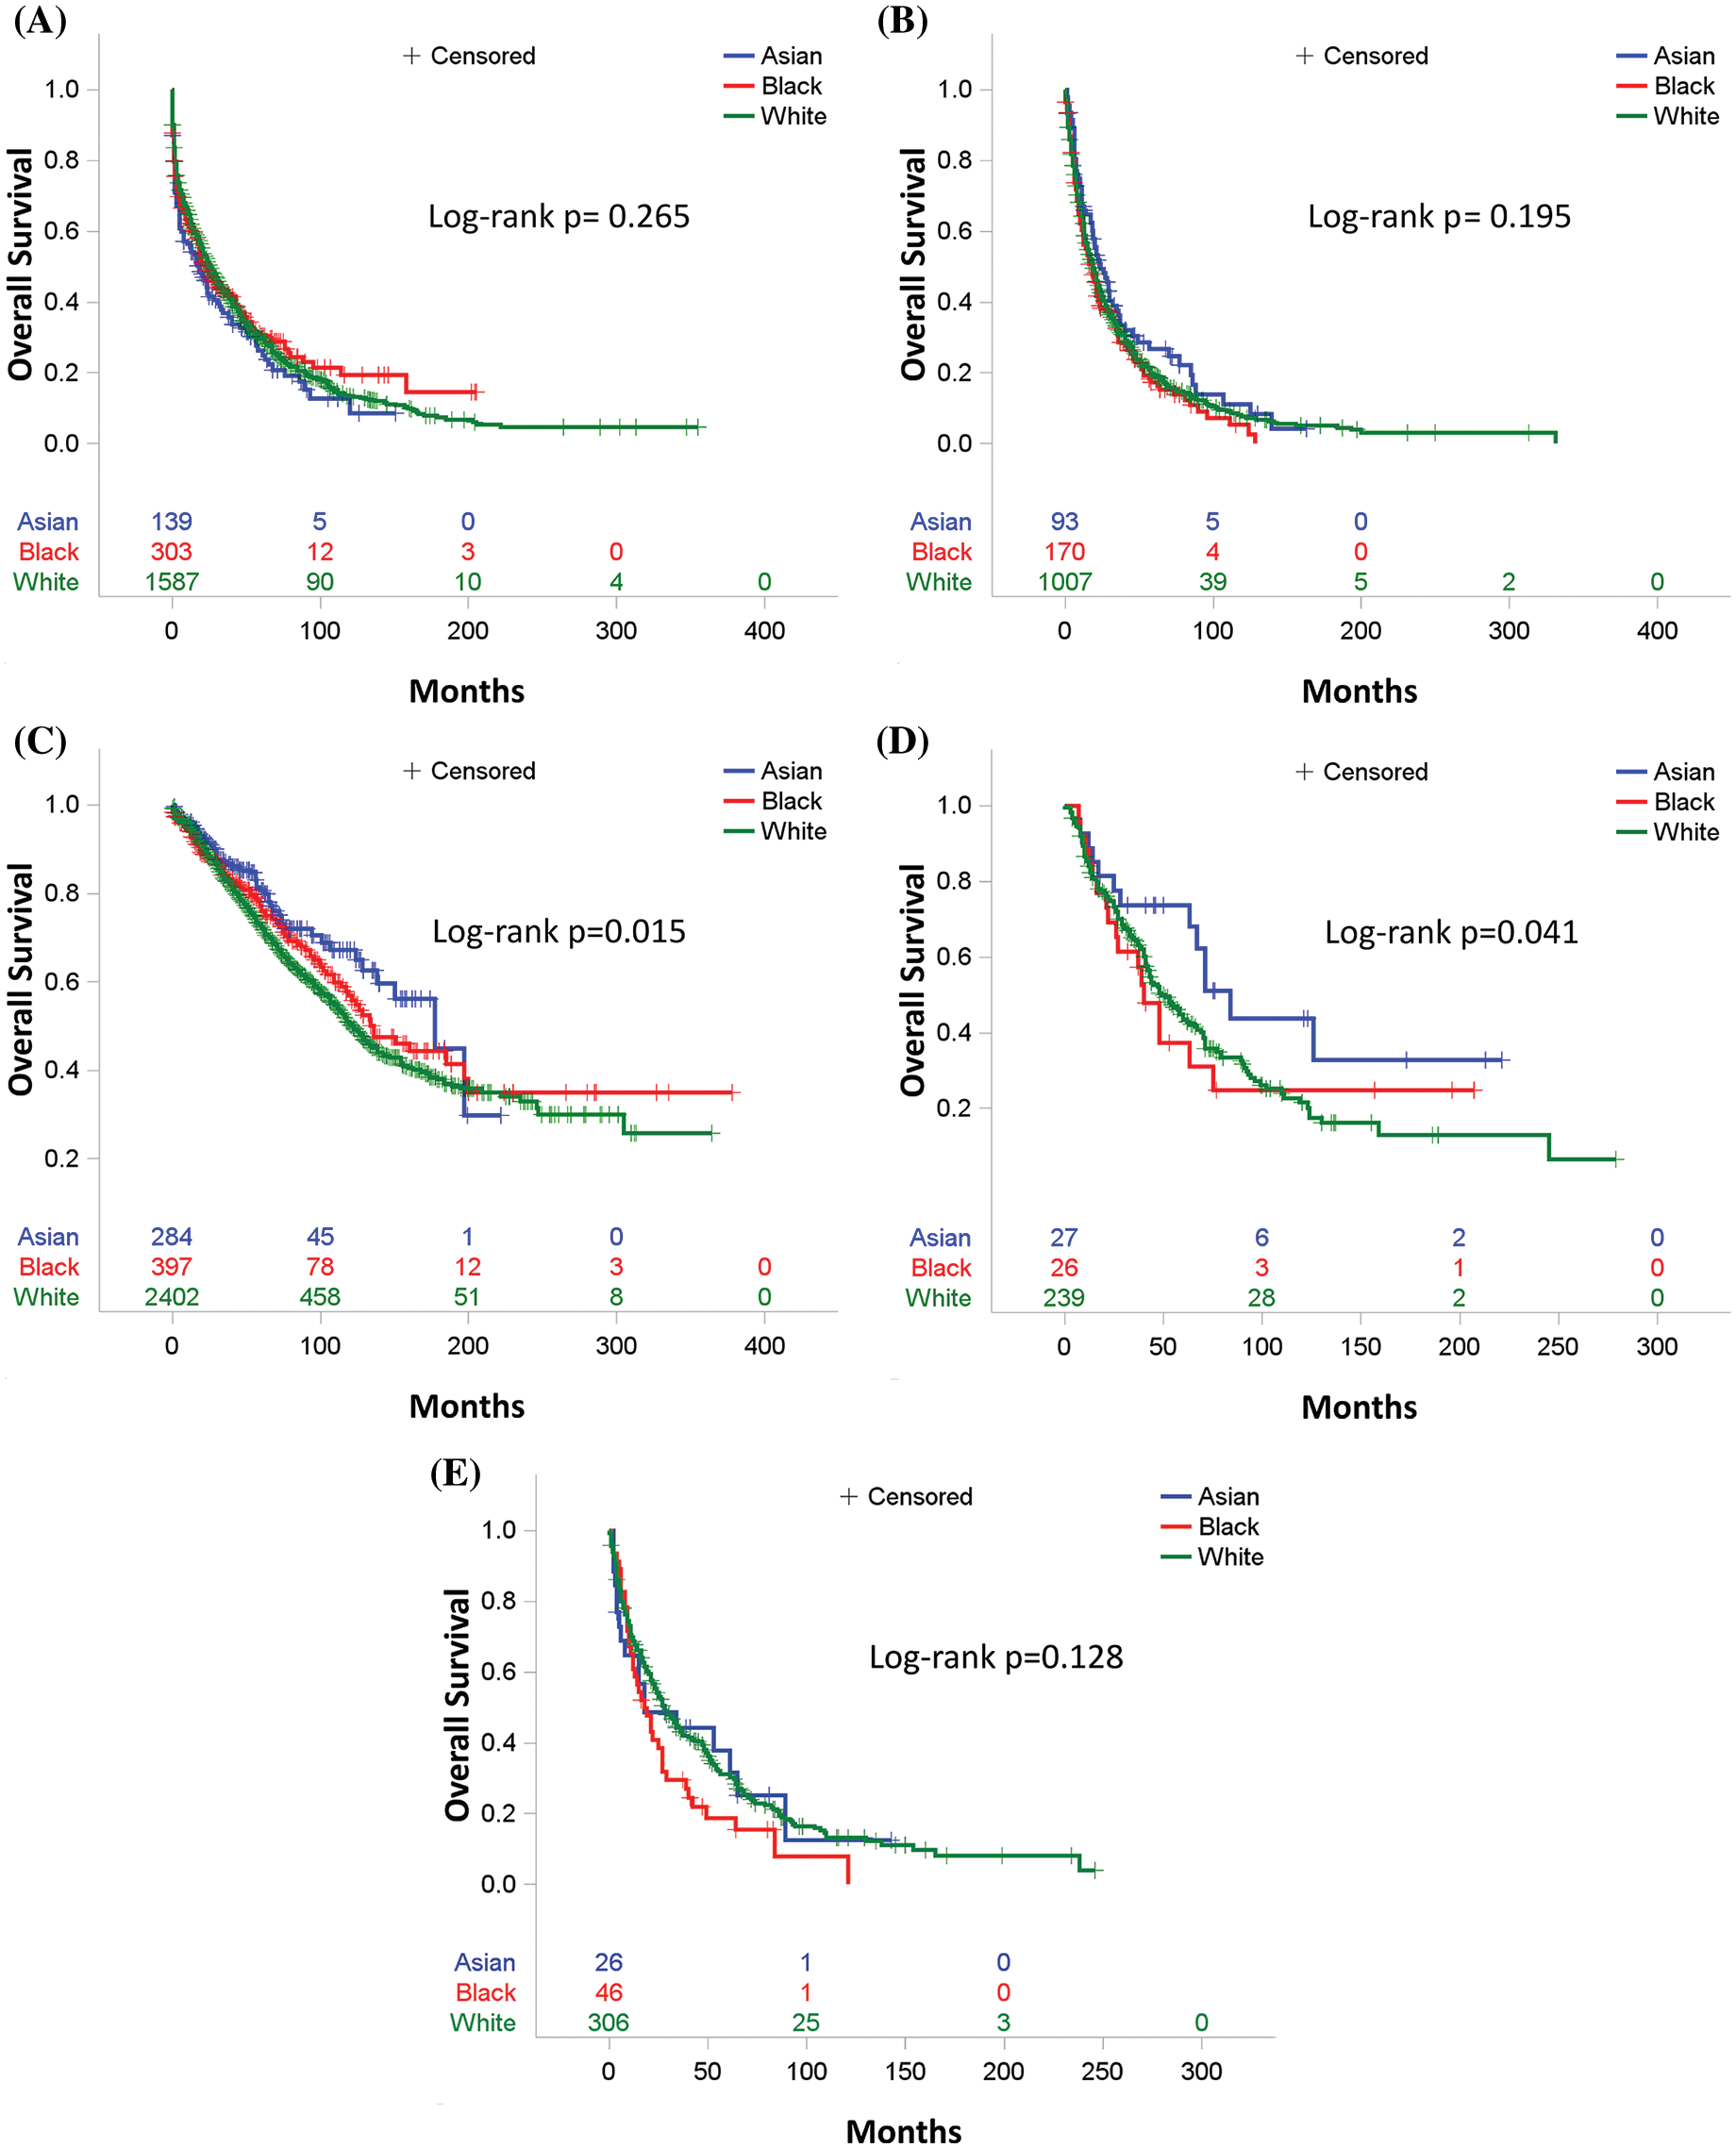
Figure 2: Overall survival by race for (A) Patients who received no therapy or unknown therapy, (B) Patients who received chemotherapy only, (C) Patients who received surgery, (D) Patients who received both surgery and chemotherapy, (E) Patients who received radiation therapy
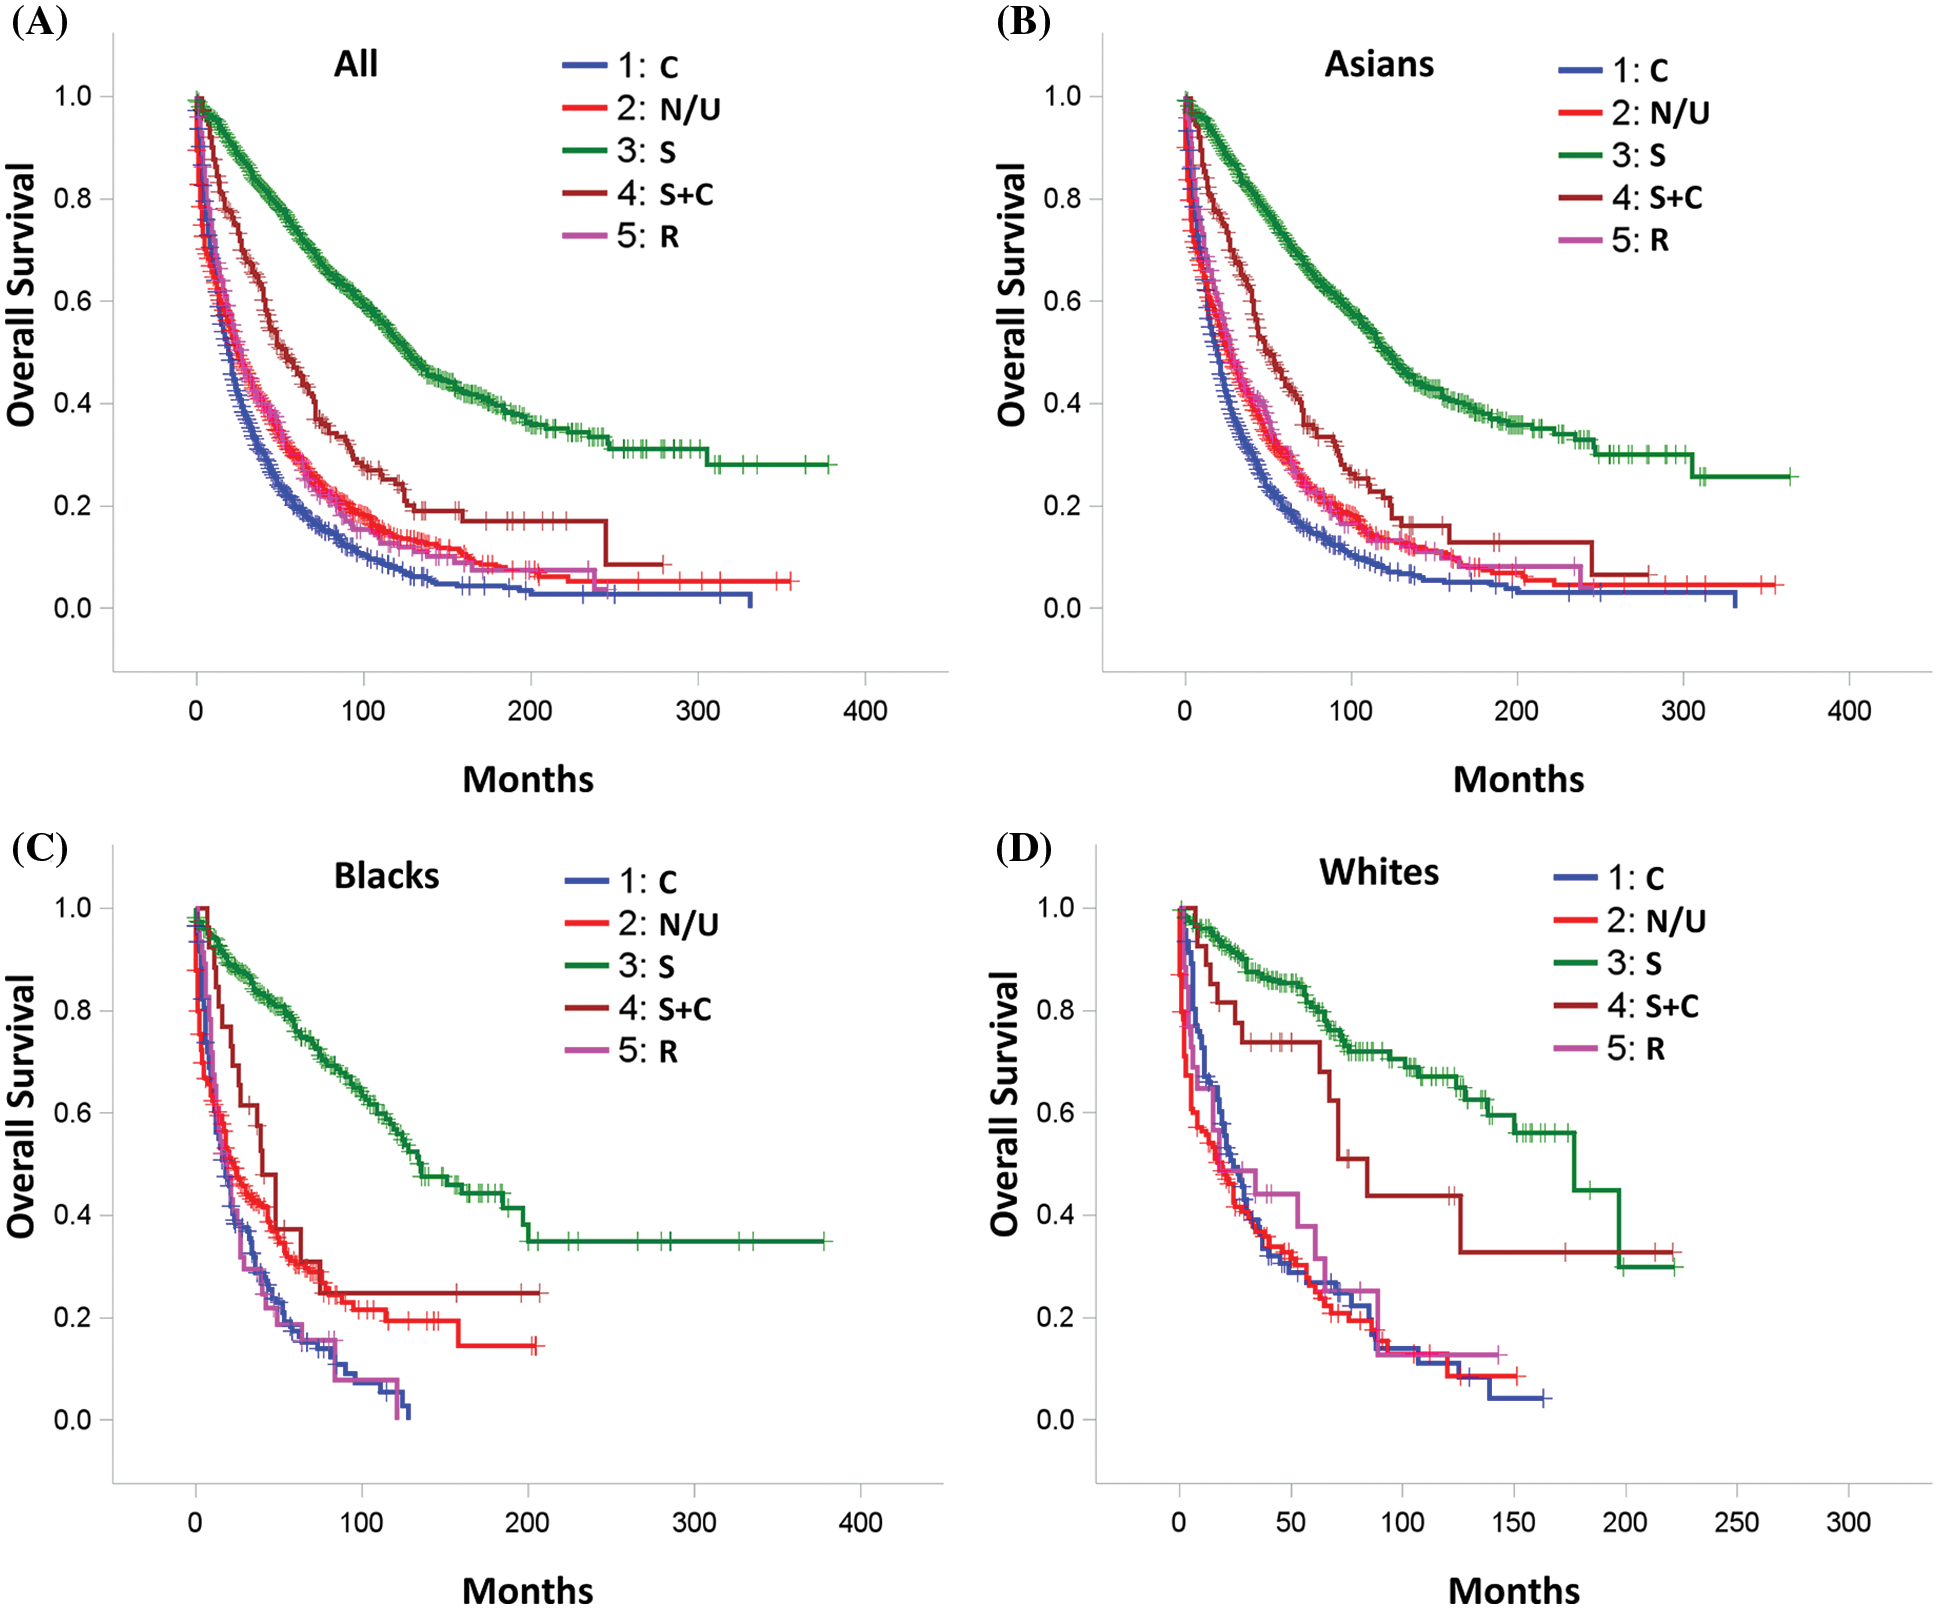
Figure 3: Overall Survival by treatment for (A) All study patients; (B) Asian patients; (C) Black patients; (D) White patients. C: Chemotherapy, S: Surgery, R: Radiation therapy and N/U: No therapy/unknown therapy
3.6 The Association of Race with Overall Survival in the Sub-Age Groups
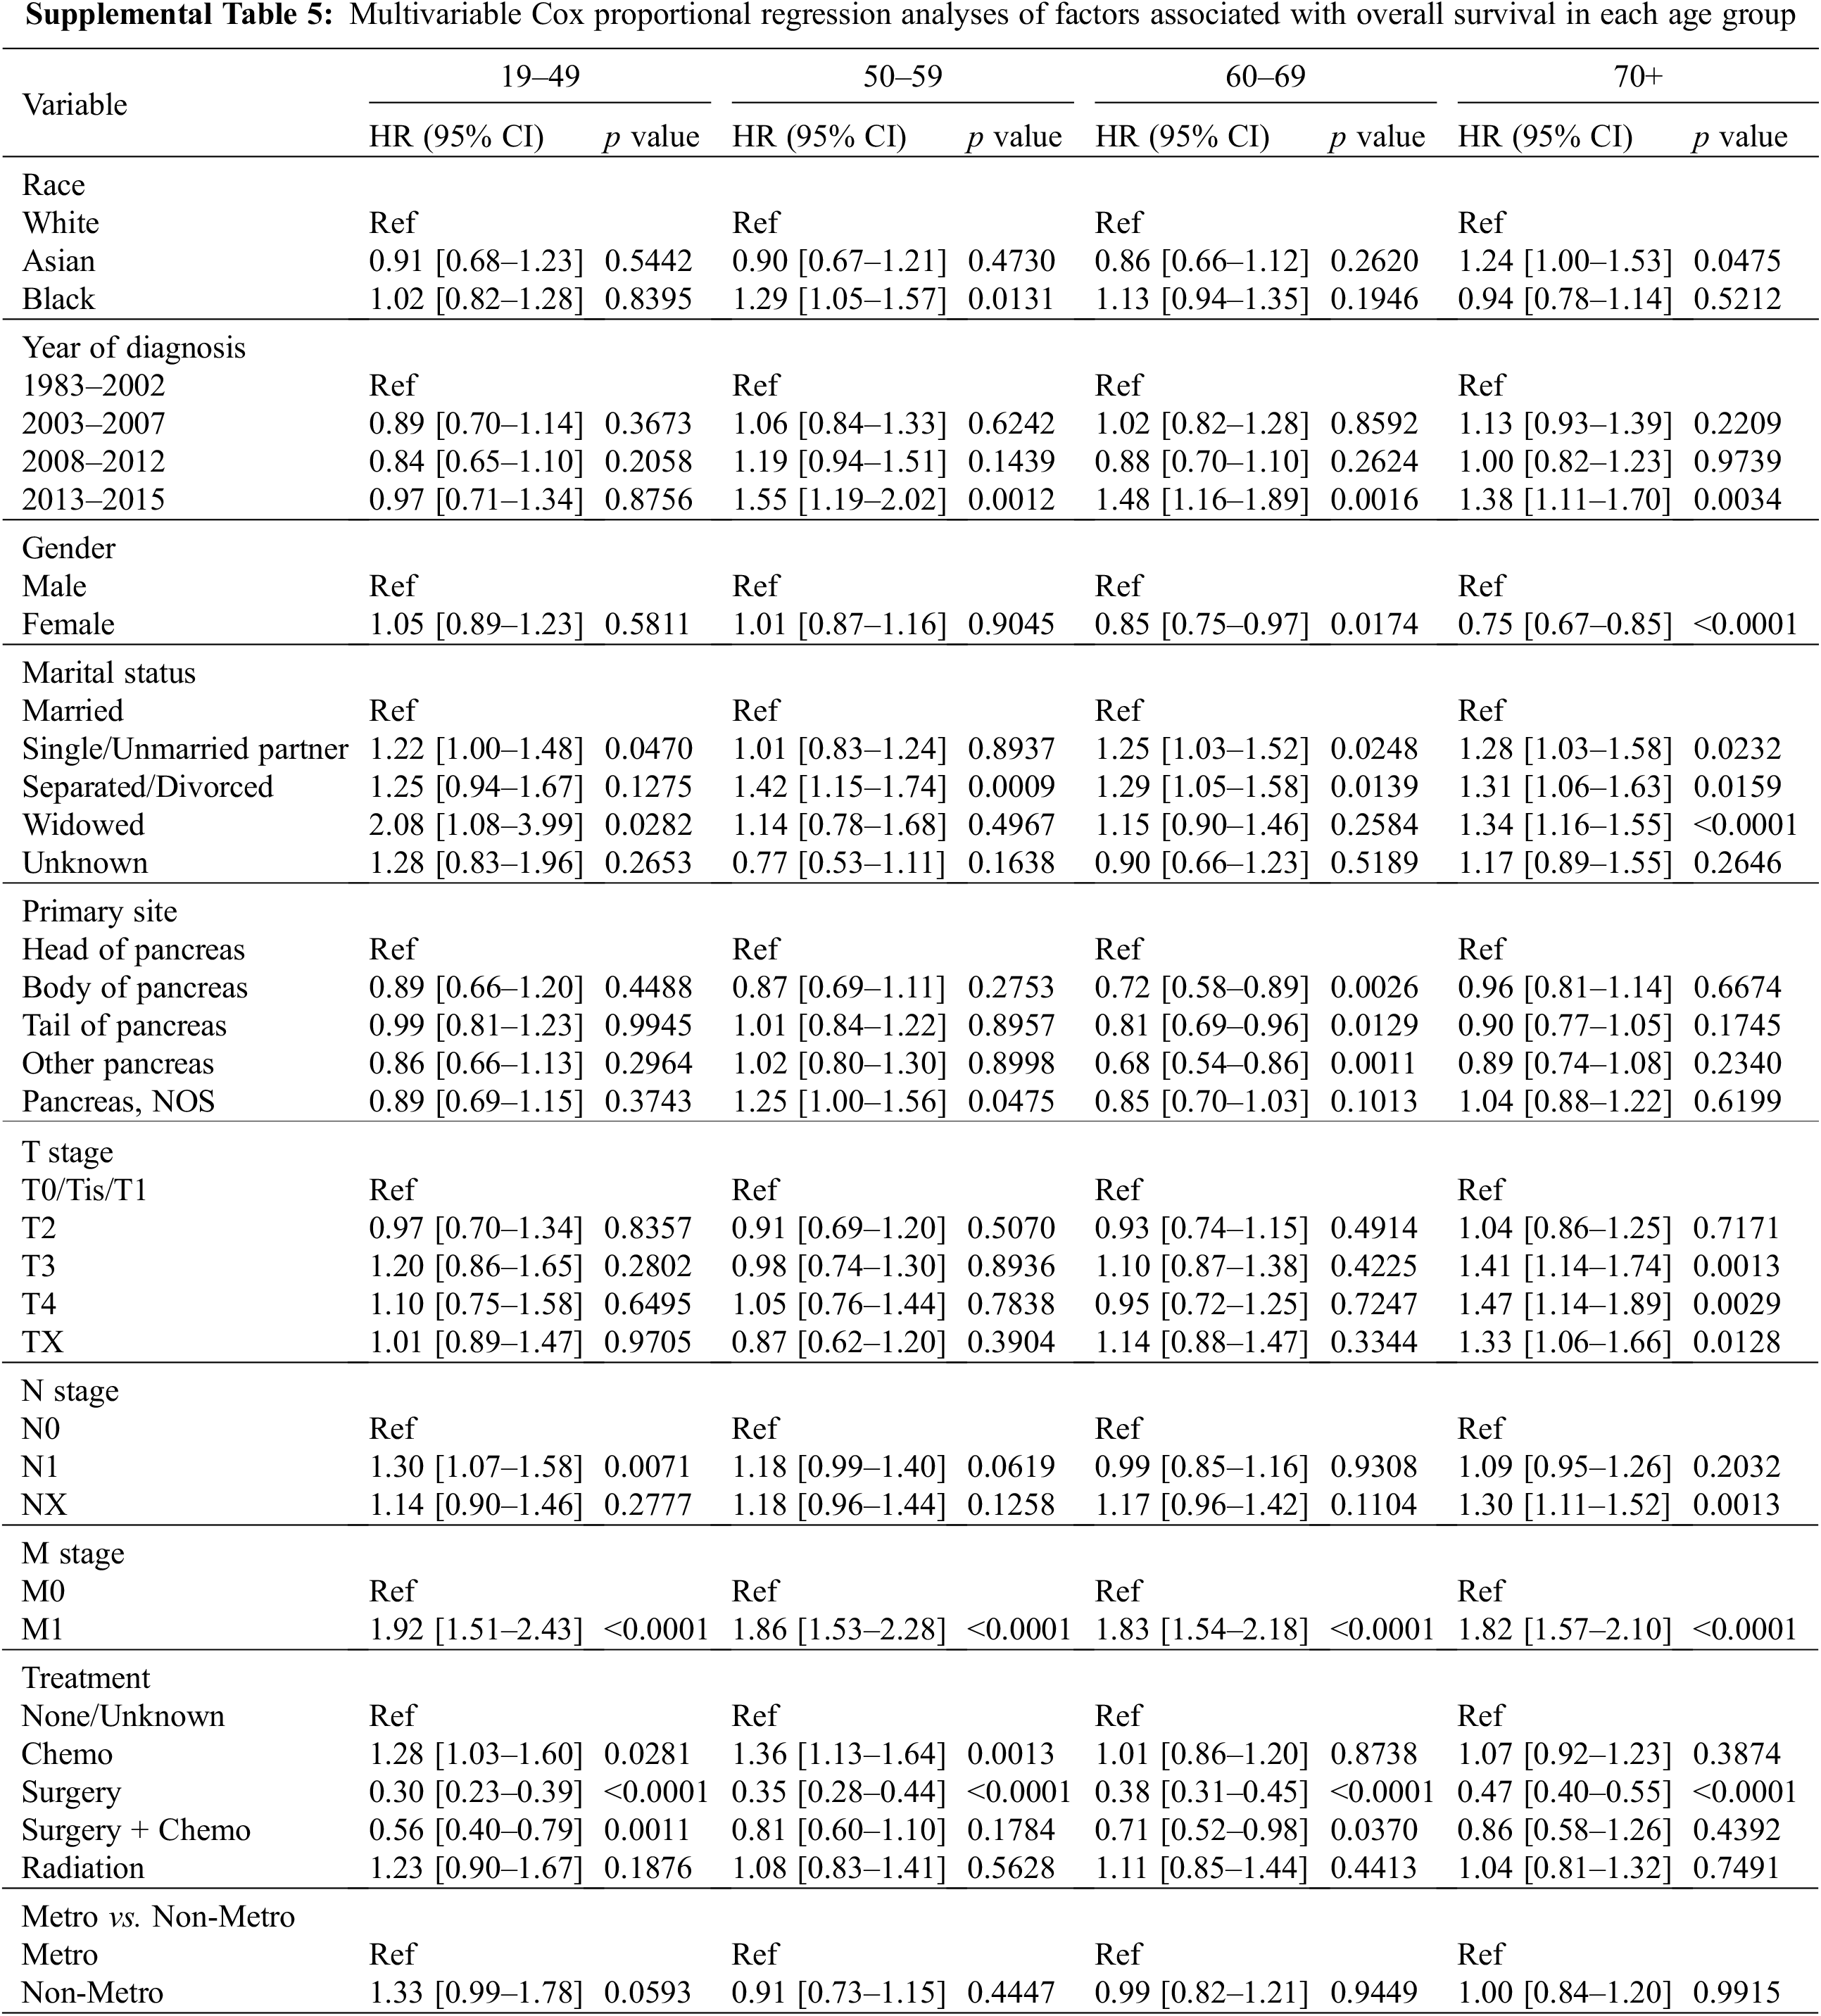
After adjusting for all other covariates, Black patients were associated with a worse OS than White and Asian patients in the 50–59 age group (Fig. 3A, Supplemental Table 5). Black patients with age between 50 to 59 years old had a 29% increased risk of death than that of White patients (HR1.29, 95% CI 1.05–1.57, p = 0.013) and a 43% increased risk of death than that of Asian patients (HR1.43 95% CI 1.02–2.00, p < 0.01) (Supplemental Table 5). Interestingly, Asian patients older than 70 years old had a worse outcome than Whites and Blacks (Fig. 3A). The risk of death among Asian patients in the dataset was 1.24 times higher than White patients (HR1.24, 95% CI 1.0–1.53, p = 0.0475) and 1.32 times higher than Black patients (HR1.32, 95% CI 1.00–1.74, p < 0.01) in patients over 70 years old (Supplemental Table 5).
3.7 The Association of Race with Overall Survival in the Subgroups by Year of Diagnosis
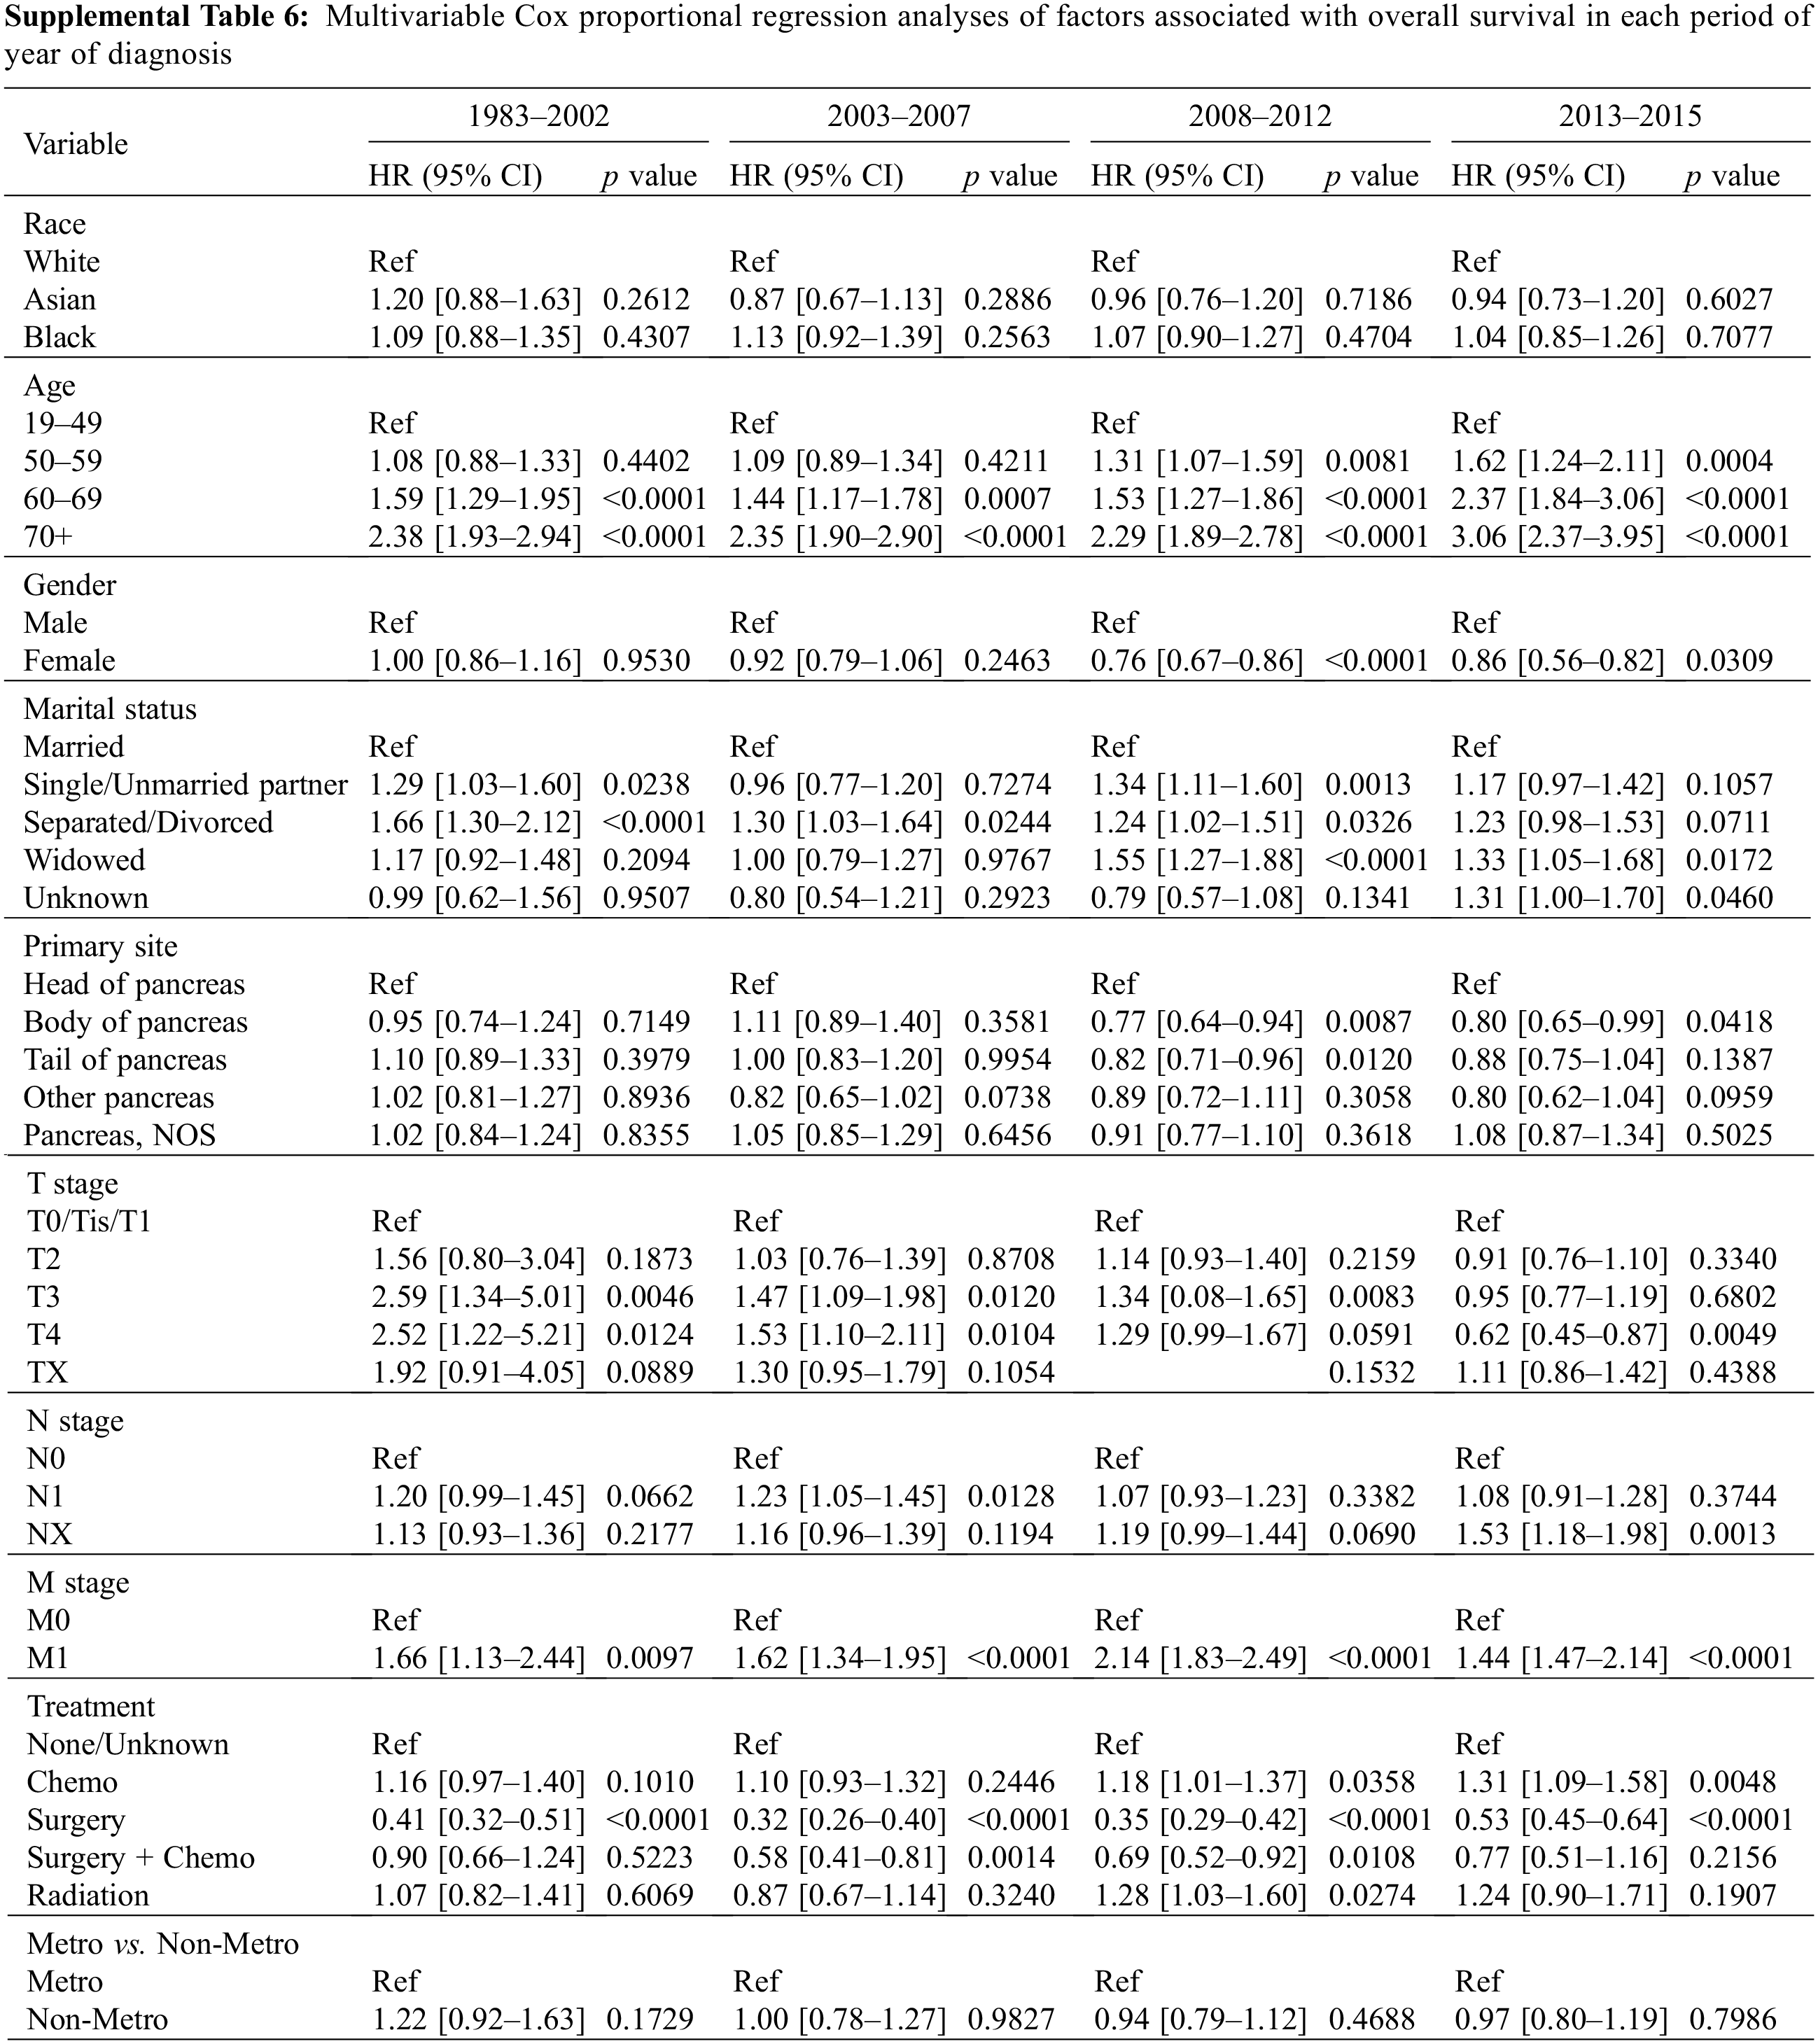
In subgroups stratified by year of diagnosis, there was no association between the survival of patients in each stratified subgroup in the MVA. Asian, Black, and White patients had a very close outcome in all diagnosis time periods from 1983 to 2015 (Fig. 3B and Supplemental Table 6).
In summary, after adjusting for prognostic factors, the three racial groups had an equal risk of death before or after PS-matching. However, in the subgroup analysis stratified by treatment, Asian patients who received surgery or surgery plus chemotherapy had a better survival outcome than Black and White patients. In the analysis of five age subgroups, Black patients had the highest risk of death in the 50–59 age group, while all three races were equally associated with poor OS in the population over 70 years old.
3.8 The Prognostic Factors Associated with Overall Survival in Each Racial Group
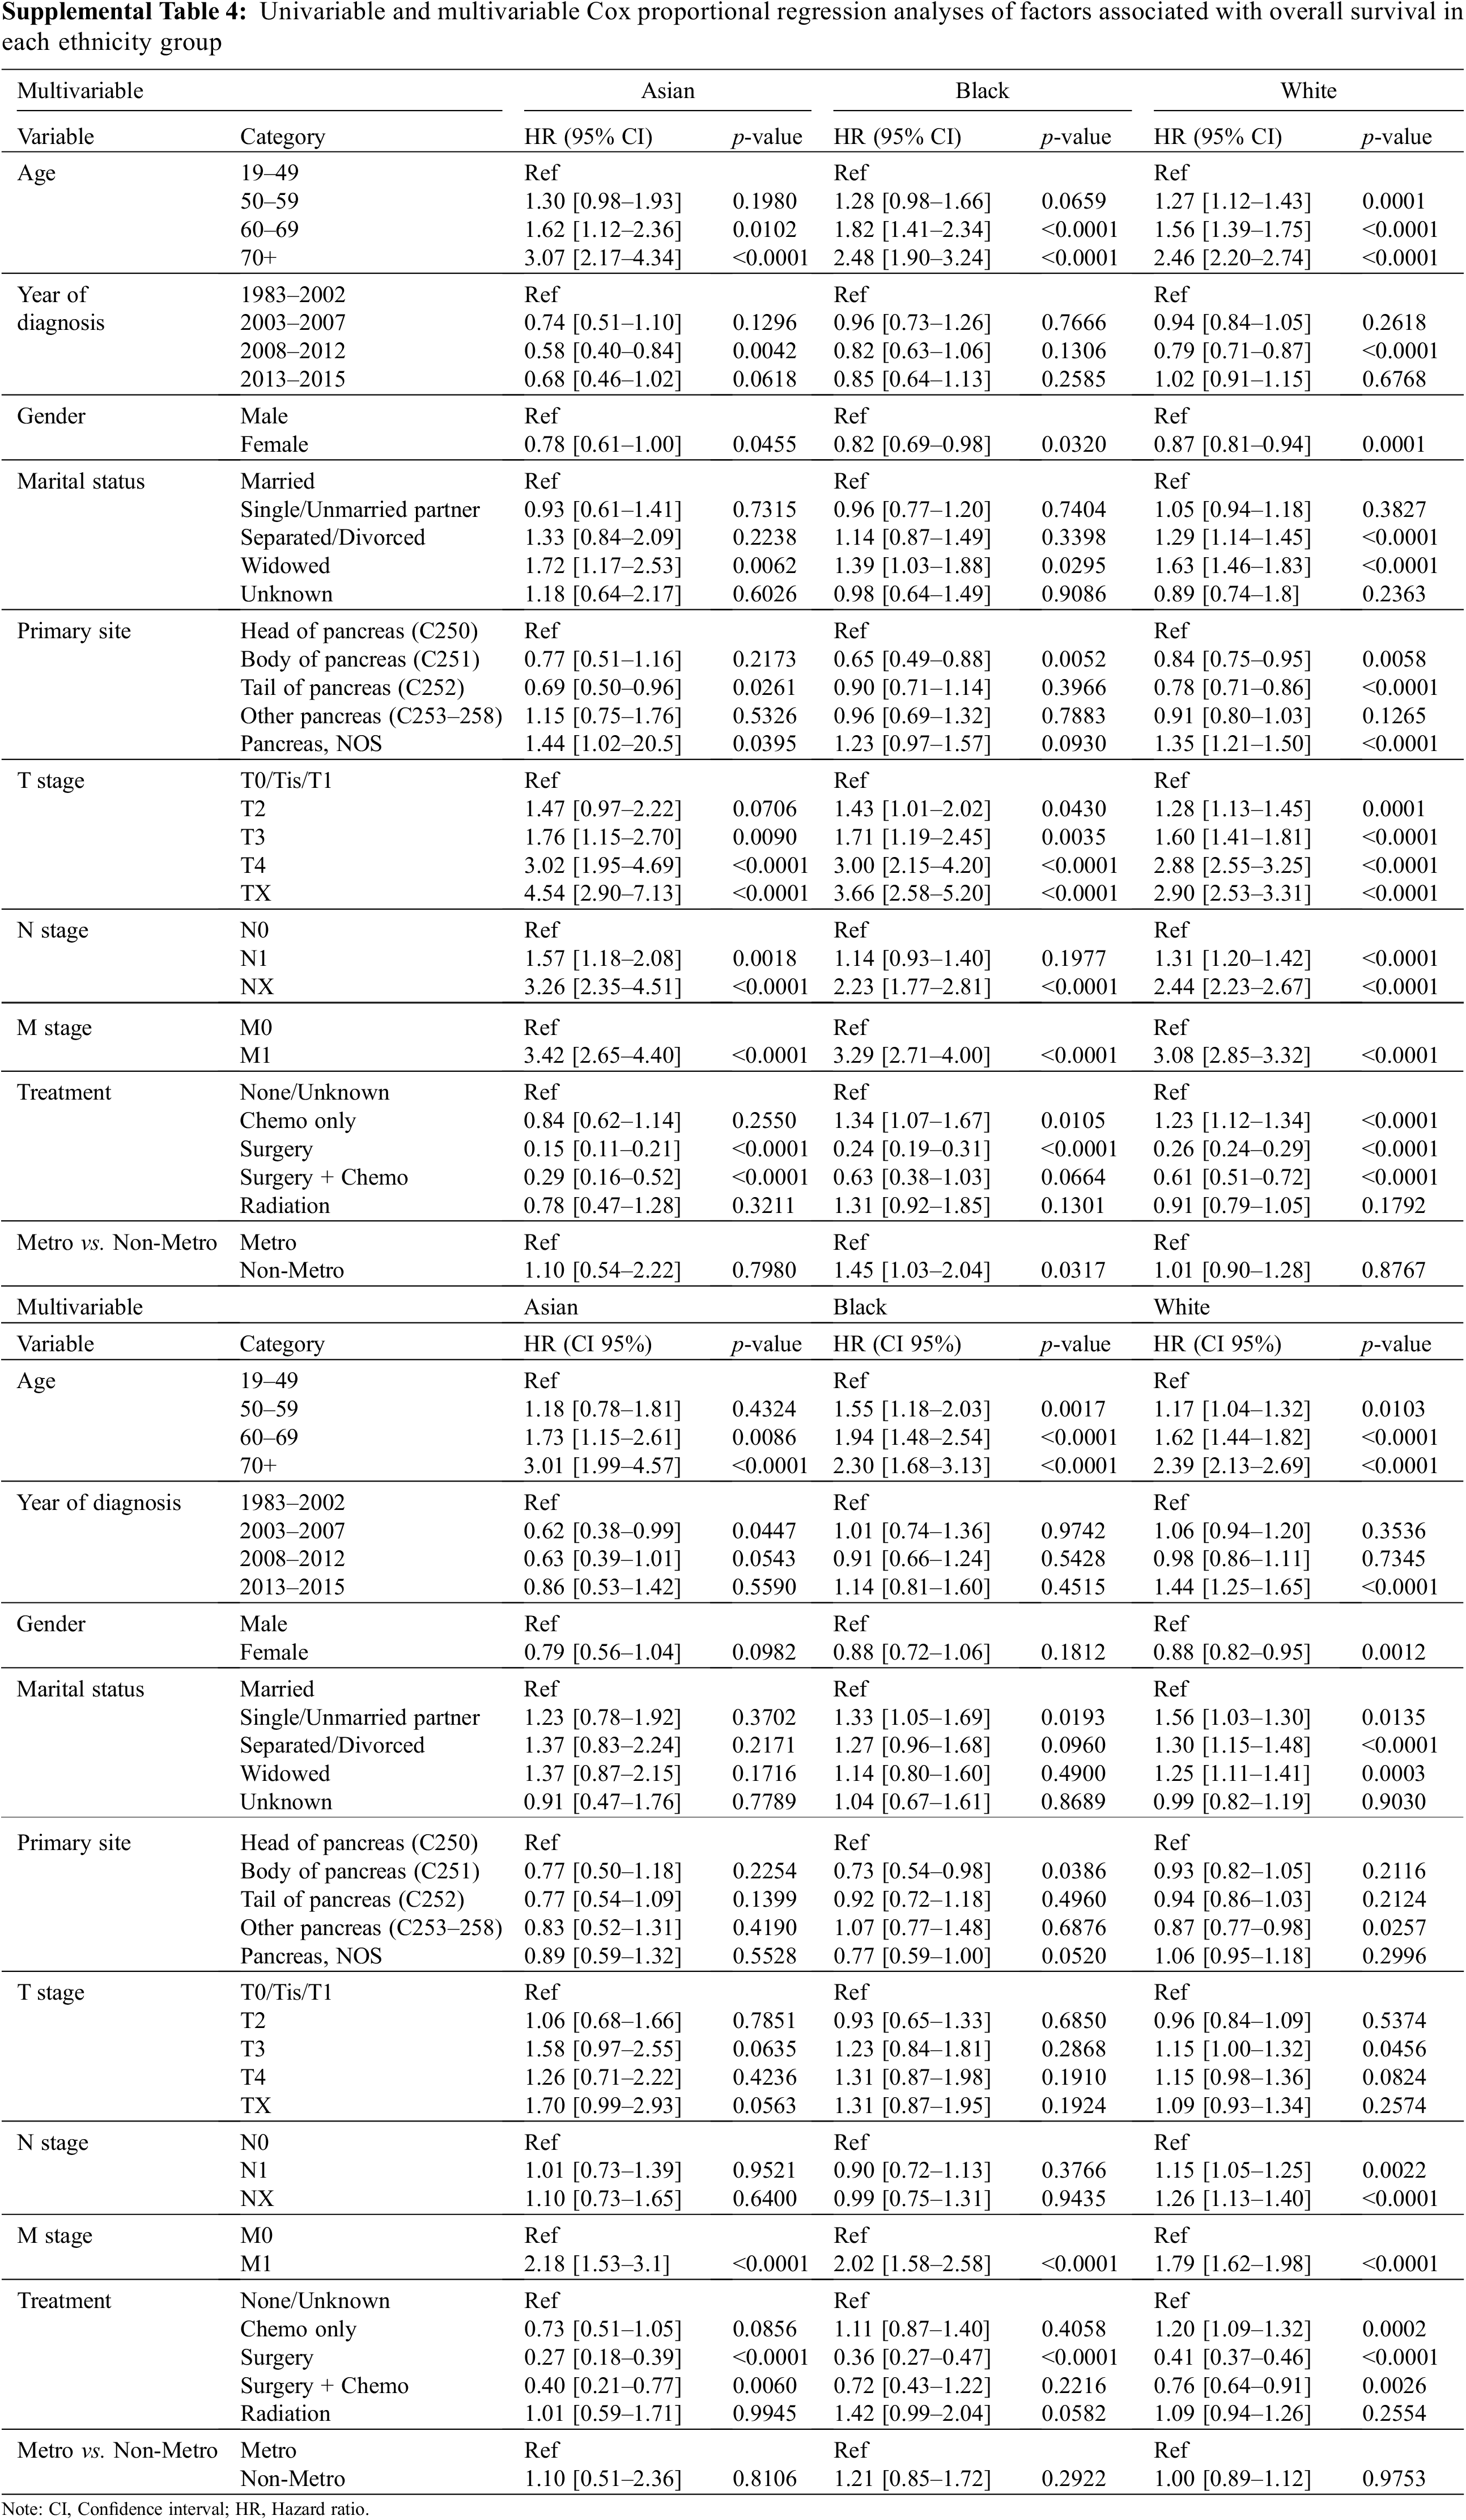
We next performed univariable and multivariable Cox proportional hazard analyses in the three races to explore the predictor variables for OS in each racial group. In the univariable analysis, we found that younger age, female sex, early TNM stage, and surgery were associated with significantly improved OS of patients in all three races (Supplemental Table 4). When adjusted for covariates, multivariable Cox models showed that patients who were younger than 50 at the M0 stage and only received surgery treatment had better survival outcomes than others in all three races (p < 0.001) (Supplemental Table 4).
The treatment group is one of the most significant prognostic factors for all three racial groups. As displayed in Supplemental Figs. 1A–1D, patients in all three race groups had the best OS in the surgery group, followed by patients in surgery plus chemotherapy. MVA confirmed that surgery is the most significant positive predictor for survival in Asian, Black, and White patients (p < 0.001, Supplemental Fig. 2B, Supplemental Table 4). Surgery plus chemo treatment was also an independent prognostic factor in Asian and White patients but not in Black patients (Supplemental Table 4). Patients in chemo, radiation and none/unknown groups had a similar worse outcome than patients in surgery (Supplemental Fig. 2B, Supplemental Table 4).
Age was another key prognostic factor. The risk of death increased as the age of patients increased in every race (Supplemental Fig. 2A). For Asian patients, the risk of death increased by 73% in patients in the 60–69 years age group (HR 1.73, 95% CI 1.15–2.61, p = 0.009) and further accelerated over 200% in patients above 70 years old (HR 3.01, 95% CI 1.99–4.57, p < 0.0001) when compared to patients in the 19–49 age period (Supplemental Fig. 2A, Supplemental Table 4). The significant rise in death risk for Black patients was observed as early as 50 years old. The risk of death increased by 55% in the 50–59 age group (HR 1.55, 95% CI 1.18–2.03, p = 0.002), 94% in 60–69 age group (HR 1.94, 95% CI 1.48–2.54, p < 0.0001), and 130% in age over 70 (HR 2.30, 95% CI 1.68–3.13, p < 0.0001) when compared to patients in the 19–49 age group (Supplemental Fig. 2A, Supplemental Table 4). For White patients, age was also a significant prognostic factor. The risk of death among White patients increased by 17% in the 50–59 age group (HR 1.17, 95% CI 1.04–1.32, p = 0.01), 62% in the 60–69 age group (HR 1.62, 95% CI 1.44–1.82, p < 0.0001), and 139% in age over 70 (HR 2.39, 95% CI 2.13–2.69, p < 0.0001) than patients younger than 49 years old (Supplemental Fig. 2A, Supplemental Table 4).
Presenting with N0 stage at diagnosis was associated with an improved OS in White patients but not in Asian or Black patients (Supplemental Table 4). The M0 stage at diagnosis was associated with an improved OS in every race (Supplemental Table 4).
Married patients had a better OS than single or unmarried partner patients (HR 1.33, 95% CI 1.05–1.69, p = 0.02), but not better than patients in separated/divorced and widowed groups in Black patients. In White patients, being married was correlated with a better OS than all other categories. Interestingly, marriage status in Asian patients had no impact on survival (Supplemental Table 4). Additionally, Black patients with the primary tumor site at the body of the pancreas had a lower death risk than those at the head of the pancreas (Supplemental Table 4). Unlike Asian and Black patients, in those that were White, females had a 12% lower death risk than males (HR 0.88, 95% CI 0.82–0.95, p = 0.0012).
Overall, younger age, M0 stage, and surgical treatment were positive prognostic factors for patients of all three races. Female, married status, T0-1 and N0 stage were positively correlated with OS in White patients. In addition, the survival outcome of Black patients was also related to marital status.
Pancreatic neuroendocrine tumors are a rare and heterogeneous group of neoplasms with strong racial and geographic affiliations, leading to many challenging clinical decisions. In this study, we analyzed over 7,000 patients with pNETs diagnosed between 1983 and 2015 in the United States, characterized the clinical features by racial and ethnic groups, demonstrated the relationship between race and clinical outcomes, and revealed the distinctive prognostic factors for patients with different racial backgrounds in the contemporary treatment era. To our knowledge, this is the first systemic study in a large cohort of US patients on comparing clinical features and outcomes of pNET patients among Asians, Whites and Blacks.
First, we characterized and compared the clinical features among Non-Hispanic White, Asian, and Black patients with pNETs. To date, only two studies have been published that compare outcomes between racial groups. A study comparing 493 Black and 3,357 non-Black patients with pNETs from 2004 to 2013 in the US showed that Black patients were more likely to be diagnosed at a more advanced stage and had a worse OS than non-Black patients [13]. In the current study, we used SEER data from a more recent period. We confirmed that Black patients with pNETs were more likely to be diagnosed at a later stage when compared to Asian and White patients in this updated timeframe, which is consistent with the results from the above-mentioned published study. Another published study, including 527 Chinese and 444 US patients with pNETs, demonstrated a similar OS between Chinese and US patients even though Chinese patients were younger at diagnosis [14]. In our study, when we compared Asian patients to either White or Black, we found that Asians were much younger at diagnosis, with a higher frequency of being married and, most importantly, had a much earlier TNM cancer stage. Furthermore, our study is the first study to demonstrate that the most common primary site of pNETs for Asian patients is the head, followed by tail of the pancreas, which matches that of Black patients, while the tail of the pancreas is the most common primary site followed by the head of the pancreas for White patients. Treatment strategy is another important covariate when studying the relationship between race and OS. A difference on the distribution of treatments among three races was observed in UVA, but not in MVA after adjusting for the covariates such as age, year of diagnosis, gender, marital status, primary site, TNM stage, treatment, and metro-rural residence (Table 1). To further avoid the bias of treatment preference, we performed the MVA to evaluate the association between race and OS in both unmatched and matched cohort after adjusting for treatment strategies and all other covariates (Table 2 and Supplemental Table 3). Our study demonstrates that the median survival (71 months) of Asian patients is significantly higher than White (50 months) and Black patients (53 months) (p < 0.05) in the unadjusted survival analysis. However, after adjusting for all the significant prognostic factors, Asian as a race was no longer associated with an improved OS when compared to either White or Black.
Second, as surgical resection is the only curative treatment for pNET patients and represents the treatment of choice for all localized pNETs and resectable metastases, we conducted a subset analysis on patients who received surgical treatment. Our study found that Asian patients had the best OS within this group, which could be a consequence of the fact that Asian patients are more likely to be younger with an earlier TNM stage at diagnosis, the M stage in particular. We also compared the outcomes among different treatments for each racial group. Our finding showed that pNET patients in the surgery group had the best OS in all three racial groups, followed by the surgery plus chemotherapy group after matching all confounding covariates.
Third, by performing Cox proportional regression analysis, our results revealed a few critical prognostic factors for patients receiving surgery. The first one is the M0 stage (no distant metastasis) at diagnosis, but not the T stage and N stage. Studies have shown that neuroendocrine tumor metastasis leads to a significant decrease in 5-year survival by up to 30% and a high recurrent rate even after metastasis-directed surgery [15,16]. Our study showed that the risk of death in the M1 stage increased by 118% in Asian, 102% in Black, and 79% in White patients compared to those in M0. Patients with distant metastasis have a 56% higher death risk than no metastasis patients even after surgery. What draws our attention is that Asians with pNETs were about 30% more likely to be M0 than those of White and Black patients at diagnosis, which ultimately contributed to a better outcome in Asian patients after surgery. Age at diagnosis is another key prognostic factor. Our results showed that the risk of death increased by 50% in the 60–69 age group (vs. 19–49 age group), with an outstandingly higher risk of over 5 times in senior patients over 70 years old (vs. 19–49 age group) in patients with surgery. Asian patients are more likely to be diagnosed before age 50 than White and Black patients, which may contribute to better outcomes for Asian patients. Although it is presumptive to speculate which factors may have contributed to the differences that appear for the M stage between different ages of pNET patients at diagnosis, some points may be worth discussing. First, Black patients may be genetically less susceptible to pNETs than Asian and White, thus presenting at an older age. Second, Black patients may have less access to health care which may affect the implementation of effective screening, leading to delayed diagnosis of disease.
Last but not least, we explored several other factors contributing to racial disparity. Marital status was an independent prognostic factor for Blacks and Whites, but not for Asians. In a study exploring the relationship between marital status and survival in cancer patients, researchers found that married cancer patients not only had a smaller risk of metastasis, but also a greater chance to get definitive therapy and a much lower death rate from cancer. They also showed that the positive impact of marriage was more significant in males than in females [17]. Another study that focused on the influence of marital status in patients with pNETs demonstrated that marital status is an independent prognostic factor for survival in pNETs, with a 10% improvement in 5-year OS in married patients over unmarried patients [18]. In our study, we divided the marital status into five groups, including married, single/unmarried partner, separated/divorced, widowed, and unknown, to better study the impact of marital status on survival in each race group. We found that only patients with separated/divorced and widowed status had a higher risk of death than married patients in the overall population. As we conducted subgroup analysis in pNETs with the three racial backgrounds and adjusted for all other covariates, marital status was not an independent prognostic for Asians but still contributed to Blacks and Whites’ survival outcomes. The single/unmarried partner, separated/divorced, and widowed statuses were all significantly correlated with a much worse outcome than married patients in Whites. The results implied that the harm associated with unmarried status was remarkably greater in White patients than in Asian and Black patients. Besides marital status, gender was another unique prognostic factor for survival in White patients with pNET. Some studies showed that NETs are slightly more common in women than men, but no difference was observed between males and females in OS or response to therapy [19]. Our study showed that White patients had a similar gender distribution to Asian patients but were 34% more likely to be female than Black patients. After adjusting for age, year of diagnosis, marital status, primary site, TNM stage, treatment, and residency region, female was an independent prognostic factor of survival in White patients but not in Asians and Blacks. The death risk increased by 12% in White males compared to White female patients.
Our study has limitations inherent to any secondary analysis of an extensive database. SEER data only provides information on radiotherapy and chemotherapy as part of the first course of treatment. With a lack of information regarding socioeconomic status, income, lifestyle, medical history, and comorbidities, for example, we were not able to include all relevant risk factors in the analysis, which may have had a significant impact on patients’ survival. Other limitations were the lack of data on the cause of death, chemotherapy regimens, radiation dose and fractionation, otherwise incomplete data, and patients’ decision-making in treatment choices.
In conclusion, Asian patients were more likely to be younger and have lower tumor stages at diagnosis. In the entire study population, there was no association between race and overall survival. However, among patients who received surgical resection, Asians had the most favorable overall survival, followed by White and Black patients. Age, M stage, and surgical treatment are the most important independent prognostic factors for survival in all three racial groups. Meanwhile, being female, married, and having N0 stage are unique positive prognostic factors for survival only in White patients.
Author Contributions: All authors had full access to all of the data in the study and take responsibility for the integrity of the data and the accuracy of the data analysis. Concept and design: Jiang, Lin, Wang. Acquisition, analysis, or interpretation of data: All authors. Drafting of the manuscript: Wang. Critical revision of the manuscript for important intellectual content: All authors. Statistical analysis: Ma, Wang. Administrative, technical, or material support: Wang, Ma, Zhao. Supervision: Jiang, Lin.
Availability of Data and Materials: SEER collects cancer incidence data from population-based cancer registries covering approximately 35% of the U.S. population. The data we used is based on the August 2019 submission. The data that support the findings of this study are available from SEER database but restrictions apply to the availability of these data, which were used under license for the current study, and so are not publicly available. Data are however available upon reasonable request and with the SEER Research Data Agreement.
Ethics Approval and Informed Consent Statement: Not applicable.
Funding Statement: The authors received no specific funding for this study.
Conflicts of Interest: The authors declare that they have no conflicts of interest to report regarding the present study.
References
1. Muscogiuri, G., Barrea, L., Feola, T., Gallo, M., Messina, E. et al. (2020). Pancreatic neuroendocrine neoplasms: Does sex matter? Trends in Endocrinology and Metabolism, 31(9), 631–641. DOI 10.1016/j.tem.2020.02.010. [Google Scholar] [CrossRef]
2. Mpilla, G. B., Philip, P. A., El-Rayes, B., Azmi, A. S. (2020). Pancreatic neuroendocrine tumors: Therapeutic challenges and research limitations. World Journal of Gastroenterology, 26(28), 4036–4054. DOI 10.3748/wjg.v26.i28.4036. [Google Scholar] [CrossRef]
3. Hallet, J., Law, C. H., Cukier, M., Saskin, R., Liu, N. et al. (2015). Exploring the rising incidence of neuroendocrine tumors: A population-based analysis of epidemiology, metastatic presentation, and outcomes. Cancer, 121(4), 589–597. DOI 10.1002/cncr.29099. [Google Scholar] [CrossRef]
4. Zhang, M., Zhao, P., Shi, X., Zhao, A., Zhang, L. et al. (2017). Clinicopathological features and prognosis of gastroenteropancreatic neuroendocrine neoplasms in a Chinese population: A large, retrospective single-centre study. BMC Endocrine Disorders, 17(1), 39. DOI 10.1186/s12902-017-0190-6. [Google Scholar] [CrossRef]
5. Fan, J. H., Zhang, Y. Q., Shi, S. S., Chen, Y. J., Yuan, X. H. et al. (2017). A nation-wide retrospective epidemiological study of gastroenteropancreatic neuroendocrine neoplasms in China. Oncotarget, 8(42), 71699–71708. DOI 10.18632/oncotarget.17599. [Google Scholar] [CrossRef]
6. Ito, T., Sasano, H., Tanaka, M., Osamura, R. Y., Sasaki, I. et al. (2010). Epidemiological study of gastroenteropancreatic neuroendocrine tumors in Japan. Journal of Gastroenterol, 45(2), 234–243. DOI 10.1007/s00535-009-0194-8. [Google Scholar] [CrossRef]
7. Ito, T., Lee, L., Hijioka, M., Kawabe, K., Kato, M. et al. (2015). The up-to-date review of epidemiological pancreatic neuroendocrine tumors in Japan. Journal of Hepato-Biliary-Pancreatic Sciences, 22(8), 574–577. DOI 10.1002/jhbp.225. [Google Scholar] [CrossRef]
8. Hain, E., Sindayigaya, R., Fawaz, J., Gharios, J., Bouteloup, G. et al. (2019). Surgical management of pancreatic neuroendocrine tumors: An introduction. Expert Review of Anticancer Therapy, 19(12), 1089–1100. DOI 10.1080/14737140.2019.1703677. [Google Scholar] [CrossRef]
9. Parbhu, S. K., Adler, D. G. (2016). Pancreatic neuroendocrine tumors: Contemporary diagnosis and management. Hospital Practice, 44(3), 109–119. DOI 10.1080/21548331.2016.1210474. [Google Scholar] [CrossRef]
10. Bartolini, I., Bencini, L., Risaliti, M., Ringressi, M. N., Moraldi, L. et al. (2018). Current management of pancreatic neuroendocrine tumors: From demolitive surgery to observation. Gastroenterology Research and Practice, 2018, 9647247. DOI 10.1155/2018/9647247. [Google Scholar] [CrossRef]
11. Lee, L., Ito, T., Jensen, R. T. (2019). Prognostic and predictive factors on overall survival and surgical outcomes in pancreatic neuroendocrine tumors: Recent advances and controversies. Expert Review of Anticancer Therapy, 19(12), 1029–1050. DOI 10.1080/14737140.2019.1693893. [Google Scholar] [CrossRef]
12. Stuart, E. A. (2010). Matching methods for causal inference: A review and a look forward. Statistics Science, 25(1), 1–21. DOI 10.1214/09-STS313. [Google Scholar] [CrossRef]
13. Zhou, H., Zhang, Y., Wei, X., Yang, K., Tan, W. et al. (2017). Racial disparities in pancreatic neuroendocrine tumors survival: A SEER study. Cancer Medicine, 6(11), 2745–2756. DOI 10.1002/cam4.1220. [Google Scholar] [CrossRef]
14. Zhu, L. M., Tang, L., Qiao, X. W., Wolin, E., Nissen, N. N. et al. (2016). Differences and similarities in the clinicopathological features of pancreatic neuroendocrine tumors in China and the United States: A multicenter study. Medicine, 95(7), e2836. DOI 10.1097/MD.0000000000002836. [Google Scholar] [CrossRef]
15. Mayo, S. C., de Jong, M. C., Pulitano, C., Clary, B. M., Reddy, S. K. et al. (2010). Surgical management of hepatic neuroendocrine tumor metastasis: Results from an international multi-institutional analysis. Annals of Surgical Oncology, 17(12), 3129–3136. DOI 10.1245/s10434-010-1154-5. [Google Scholar] [CrossRef]
16. Chen, H., Hardacre, J. M., Uzar, A., Cameron, J. L., Choti, M. A. (1998). Isolated liver metastases from neuroendocrine tumors: Does resection prolong survival? Journal of the American College of Surgeons, 187(1), 88–92. DOI 10.1016/S1072-7515(98)00099-4. [Google Scholar] [CrossRef]
17. Aizer, A. A., Chen, M. H., McCarthy, E. P., Mendu, M. L., Koo, S. et al. (2013). Marital status and survival in patients with cancer. Journal of Clinical Oncology, 31(31), 3869–3876. DOI 10.1200/JCO.2013.49.6489. [Google Scholar] [CrossRef]
18. Zhou, H., Zhang, Y., Song, Y., Tan, W., Qiu, Z. et al. (2017). Marital status is an independent prognostic factor for pancreatic neuroendocrine tumors patients: An analysis of the surveillance, epidemiology, and end results (SEER) database. Clinics and Research in Hepatology and Gastroenterology, 41(4), 476–486. DOI 10.1016/j.clinre.2017.02.008. [Google Scholar] [CrossRef]
19. Mogl, M. T., Dobrindt, E. M., Buschermöhle, J., Bures, C., Pratschke, J. et al. (2020). Influence of gender on therapy and outcome of neuroendocrine tumors of gastroenteropancreatic origin: A single-center analysis. Visceral Medicine, 36(1), 20–27. DOI 10.1159/000505500. [Google Scholar] [CrossRef]
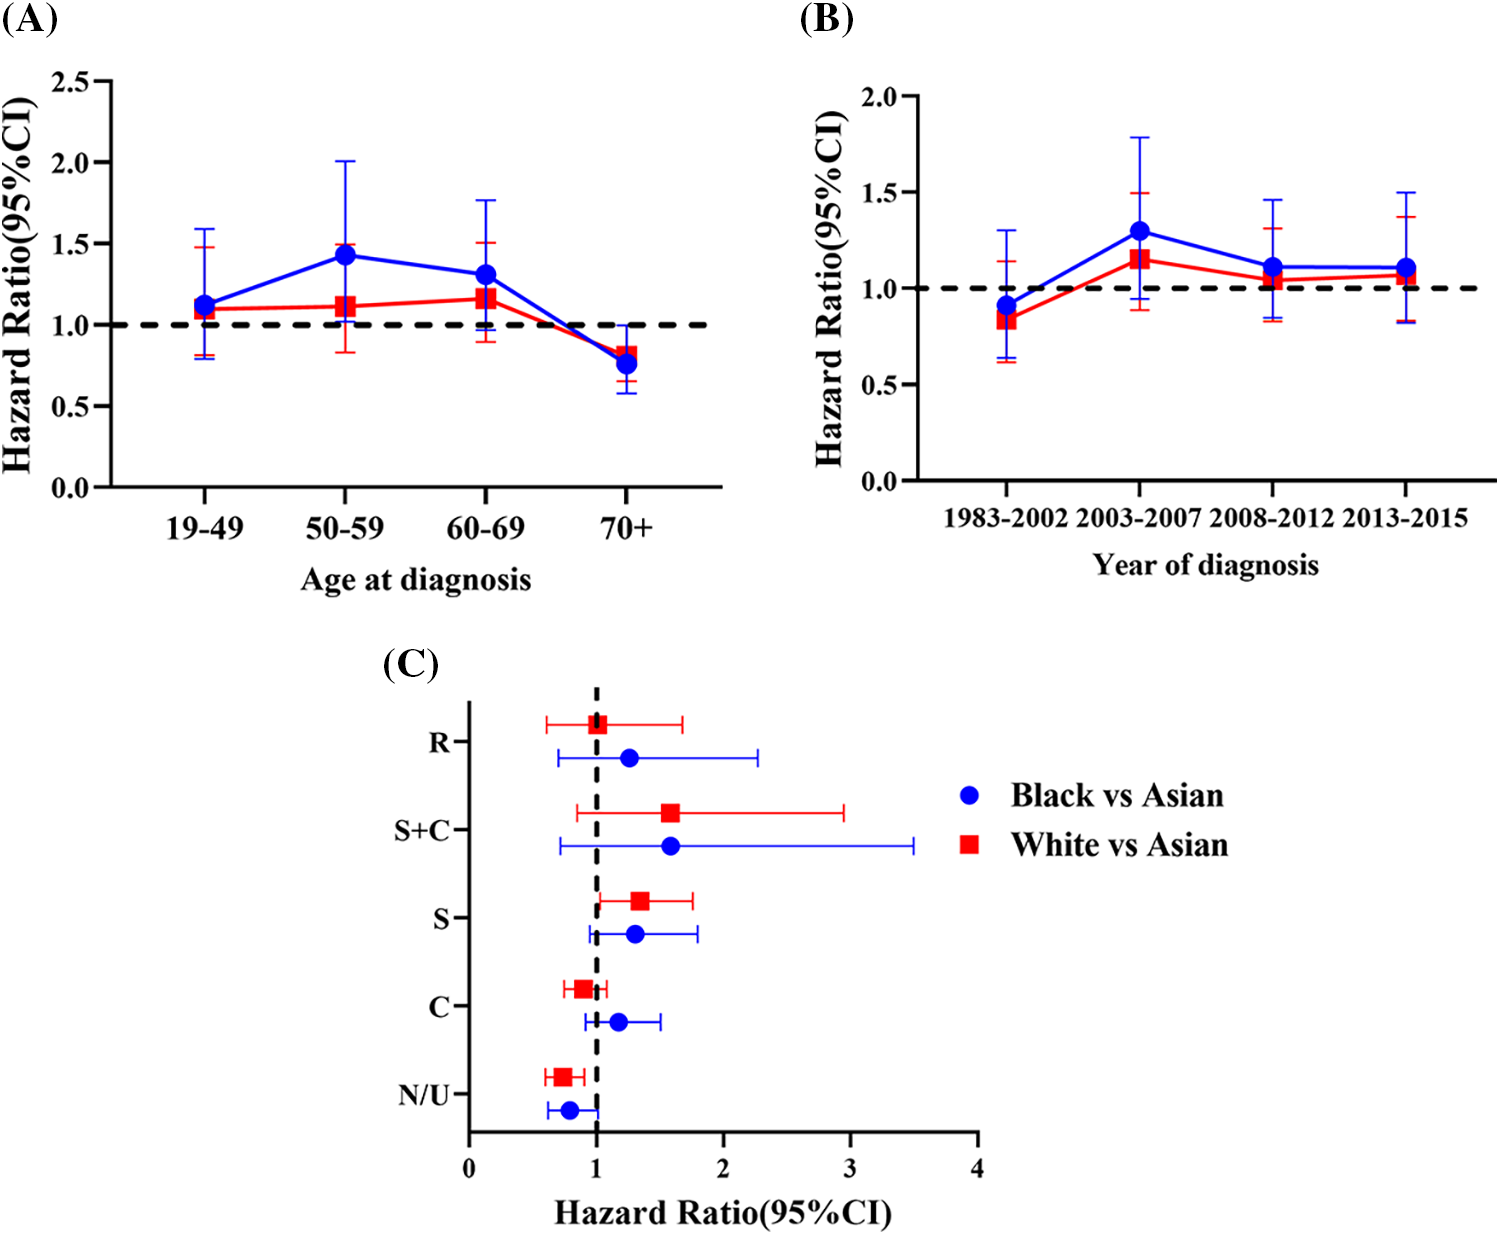
Supplemental Figure 1: Hazard ratios (HRs) [Black vs. Asian (Blue) and White vs. Asian (Red)] and 95% confidence interval (CI) as a function of (A) Age at diagnosis. (B) Year of diagnosis. (C) Type of treatment (R: Radiation, S: Surgery, C: Chemotherapy, N/U: No therapy/unknown therapy)
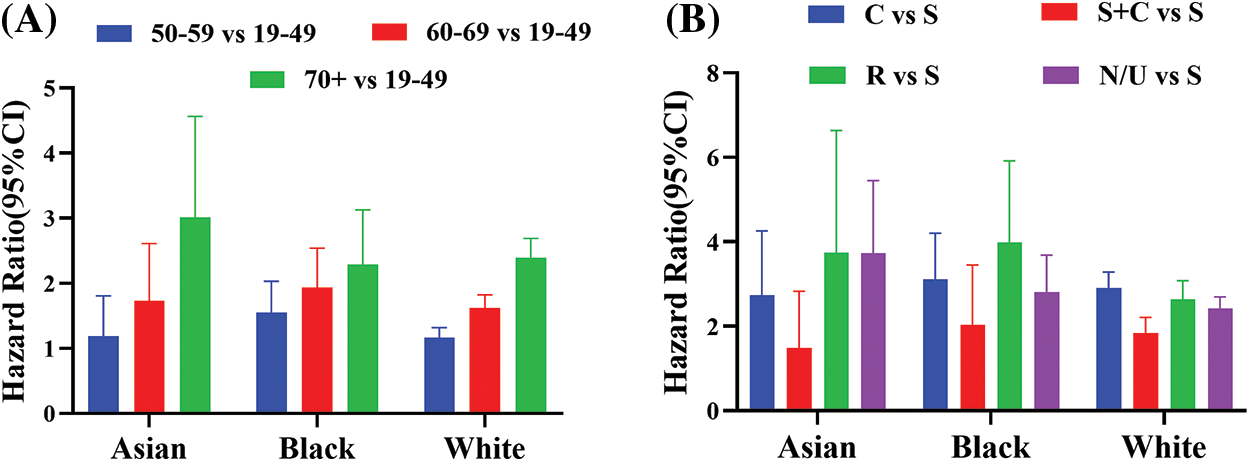
Supplemental Figure 2: Hazard ratios (HRs) and 95% confidence interval (CI) as a function of race. (A) HR [age 50–59 vs. 19–49] (Blue), HR [age 60–69 vs. 19–49] (Red), and HR [age 50–59 vs. 19-49] (Green). (B) HR [C vs. S] (Blue), HR [S + C vs. S] (Red), HR [R vs. S] (Green), and HR [N/U vs. S] (Purple). C: Chemotherapy, S: Surgery, R: Radiation therapy and N/U: No therapy/unknown therapy
Cite This Article
 Copyright © 2022 The Author(s). Published by Tech Science Press.
This work is licensed under a Creative Commons Attribution 4.0 International License , which permits unrestricted use, distribution, and reproduction in any medium, provided the original work is properly cited.
 Downloads
 Citation Tools