
 Submit a Paper
 Propose a Special lssue
 Open Access
ARTICLE

The Effect of Organ Temperature on Total Yield of Transplanted and Direct-Seeded Rice (Oryza sativa L.)
1 Jiangsu Key Laboratory of Crop Genetics and Physiology/Jiangsu Key Laboratory of Crop Cultivation and Physiology, Agricultural College of Yangzhou University, Yangzhou, 225009, China
2 Jiangsu Co-Innovation Center for Modern Production Technology of Grain Crops, Yangzhou University, Yangzhou, 225009, China
* Corresponding Author: Min Jiang. Email:
(This article belongs to the Special Issue: New Approaches to Mitigate Abiotic and Biotic Stresses for Improving Crop Productivity and Quality)
Phyton-International Journal of Experimental Botany 2023, 92(11), 2999-3019. https://doi.org/10.32604/phyton.2023.030627
Received 15 April 2023; Accepted 10 August 2023; Issue published 24 October 2023
 View Full Text
 Download PDF
Abstract
The canopy temperature of rice is an important index that directly reflects the growth and physiological state of rice, and affects the yield of rice plants to a great extent. The correlation between the temperatures of different rice organs and canopy in different growth stages and the grain yield is complex. The stability and universality of these correlations must be verified. We conducted a pot experiment using two rice varieties and two temperature treatments (high temperature treatment was carried out at the beginning of heading stage for 10 days). We measured rice organ temperature during seven stages of growth using a high-precision infrared thermal imager. Results showed that the optimal observation period for the rice canopy temperature was 13:00. Although the rice variety did not significantly impact the canopy or organ temperature (p > 0.05), the different organs and canopy exhibited significantly different temperatures (p < 0.05). The correlations between the leaf, stem, panicle, canopy–air temperature differences and seed setting rate, theoretical and actual yields were the strongest during the milk stage. Among them, the correlation coefficient between ΔTs and theoretical and actual yields was the highest, the relationship between theoretical yield (Y) and ΔTs (X) was Y = −5.6965X + 27.778, R2 = 0.9155. Compared with ΔTl, ΔTp and ΔTc, ΔTs was closely related to the main traits of plants. ΔTs could better reflect the growth characteristics of rice than ΔTc, such as dry matter accumulation (r = −0.931), SPAD (r = 0.699), N concentration (r = 0.714), transpiration rate (r = −0.722). In conclusion, stem temperature was more important indicator than canopy temperature. Stem temperature is a better screening index for rice breeding and cultivation management in the future.Keywords
Nomenclature
| ΔTl | Leaf–air temperature differences |
| ΔTs | Stem–air temperature differences |
| ΔTp | Panicle–air temperature differences |
| ΔTc | Canopy–air temperature differences |
The canopy temperature of rice refers to the average surface temperature of the stems, leaves, and panicles, which is closely related to canopy function [1]. The canopy temperature of rice is also an important index that directly reflects the growth and physiological state of rice. It is of great significance to explore the biological basis and effect of canopy temperature formation for improving canopy function and promoting high-quality and high-yield cultivation. Canopy temperature provides a feasible and reliable method for the timely assessment of crop growth on land [2,3]. Canopy temperature is mainly composed of its thermal characteristics and physiological response to the environment. First, the energy transfer between plants and the surrounding environment is carried out through conduction, radiation, convection and latent heat evapotranspiration. For example, factors such as water in the environment [4,5], atmospheric temperature and nitrogen fertilizer [6] affect canopy temperature [7–9]. Second, heat transfer within tissues, such as leaf temperature, affects enzyme activity and leaf metabolism [10]. Among these environmental factors, air temperature has been the most synergistically reflected in plant body temperature, and air and plant temperatures have shown the same change rule. The difference between canopy and atmospheric temperature could produce heat convection and conduction [11]. Obviously, the magnitude of thermal convection and heat conduction is related to the temperature differences between the leaves, as well as to the thermal conductivity of the boundary layer of the heat exchange between the blade and environment.
Canopy temperature is difficult to measure directly, but can be measured indirectly by infrared thermal imaging [12,13]. In 1963, Tanner used an infrared thermometer to determine crop temperature [14]. With the development of agricultural thermal imaging technology, infrared thermal imaging system can quickly acquire the characteristics of crop temperature distribution, and can distinguish the temperature of different organs of crops through images. Therefore, infrared thermal imaging has also become the main tool for measuring plant temperature at present [15,16]. The infrared thermal imager could measure the temperature of crop organs and canopy accurately and quickly, and monitor the change of crop growth in real time, which provided an effective measurement method and technical basis in this study.
Canopy temperature is the result of the comprehensive reaction of growth environment and rice plant self-regulation. The external environment affects the growth and grain yield of rice by affecting canopy temperature [17–20]. The research on the relationship between rice canopy temperature and yield began in the 1990s. Garrity et al. reported that rice canopy temperature at flowering stage was significantly negatively correlated with rice seed setting rate and yield [21]. Melandri et al. found that canopy temperature was negatively correlated with grain yield within 2 weeks of drought stress at flowering stage. When the grain yield of rice was relatively high, the leaf temperature was relatively low. Moreover, canopy temperature was associated with significant genotypic differences and had a significant positive correlation with grain yield, which could be used as a reference index for breeding high-yield varieties. It shows that canopy temperature may be closely related to the internal metabolism of rice plants, which may directly affect the yield of plants to a large extent. In addition, it has been reported that the temperature of rice organs changes [22]. The canopy temperature of rice are not only depending on air temperature, air humidity, radiation and cultivation methods, but also influenced by the organ position, size, shape and surface area [17,23,24]. Zhang et al.’s results showed that heat stress of 40°C significantly decreased the spikelet fertility, while the photosynthesis in flag leaves had no significant effect, and the panicle temperature was about 4°C higher than flag leaves [25]. This indicated that the damage degree of rice organs varies with the change of organ temperature. Therefore, the correlation between the temperatures of different rice organs and canopy in different growth stages and the grain yield is complex. The stability and universality of these correlations must be verified.
Transplanting and direct seeding are two common rice sowing methods [26]. In transplanting, seedlings are usually raised in seedling tray for 2–3 weeks and then manually or mechanically transplanted into fields. In direct seeding, seeds can be sown directly on the soil surface under rainfed, deep water and irrigated conditions [27]. It has been reported that direct-seeded rice can be used to maintain food security and crop resilience under adverse climatic conditions [10]. Direct-seeded rice significantly improves rice productivity and stress resistance. Compared to mechanical transplanting systems, the sowing time of the subsequent crop cycle is advanced by 15 days. The effects of direct-seeded and transplanting systems on the grain yield greatly vary in different regions and under different climatic conditions. In general, grain yields associated with single-cropping [28,29] and double-cropping [30] of transplanted rice are higher than that of direct-seeded rice. The results of previous studies also showed that, compared with traditional transplanted rice, yield loss could not be observed for direct-seeded rice [31–33]. Direct seeding can even lead to higher grain yields than transplanting [34]. Several researchers reported that the grain yield of wet direct-seeded rice is 10.8% higher than that of transplanted rice; the grain yields of dry direct-seeded rice and transplanted rice are similar [35]. Different planting measures can construct different population characteristics of rice [36], and appropriate planting measures can affect leaf area index, biomass, and regulate plant nitrogen, phosphorus, and potassium concentrations, thereby achieving higher grain yield [37].
The objectives were to (1) analyze the effects of different planting methods on canopy and organ temperatures during the whole growth period of rice, and to compare the difference between canopy temperature and organ temperature, (2) compare the relationship between canopy and organ temperatures and grain yield, (3) determine the growth factors affecting canopy and organ temperatures (such as dry matter accumulation, SPAD [soil plant analysis developme], N concentration, P concentration, K concentration, transpiration and photosynthesis).
Experiments were carried out in the experimental field (119.42° east longitude, 32.39° north latitude) of the Agricultural College of Yangzhou University and in the artificial climate chamber of Yangzhou University in the Hanjiang District, Yangzhou City, China, in 2019, which has a subtropical monsoon climate. The late-maturing mid-japonica rice cultivar Nanjing 9108 (NJ-9108) and mid-maturing late japonica cultivar Nanjing 46 (NJ-46) bred at the Institute of Food Crops, Jiangsu Academy of Agricultural Sciences, China, were used as materials. The growth period of the two varieties differed by 15 d: the whole growth period of NJ-9108 was 150 d, while that of NJ-46 was 165 d. A potting soil culture (pot height 27 cm, inner diameter 31 cm, capacity 14 L) was utilized for the experiments. Artificial live seeding was carried out on June 15. The rice under the transplanting treatment was sown on May 28 and transplanted artificially on June 21. Three holes were inserted in each pot, and three seedlings were placed in each hole. Before transplanting, 2 g of urea and 0.5 g of potassium dihydrogen phosphate (KH2PO4) were applied as base fertilizer per pot. After 7 d of transplanting, 0.5 g of urea was applied to each pot. At panicle initiation, 0.6 g of urea was applied to each pot. Transplanting was performed until the effective tillering stage was reached, and the potted plants were maintained with shallow water irrigation. The potted soil used was sandy loam, and the soil’s physical and chemical property indexes were 24.5 g kg−1 organic matter, 112.6 mg kg−1 total N, 58.0 mg kg−1 available P and 66.8 mg kg−1 available K. During the growth period of rice, diseases and insect pests were controlled. Bird nets were installed during the maturity period to avoid yield loss. Other management measures were uniformly implemented in accordance with conventional cultivation requirements [38,39].
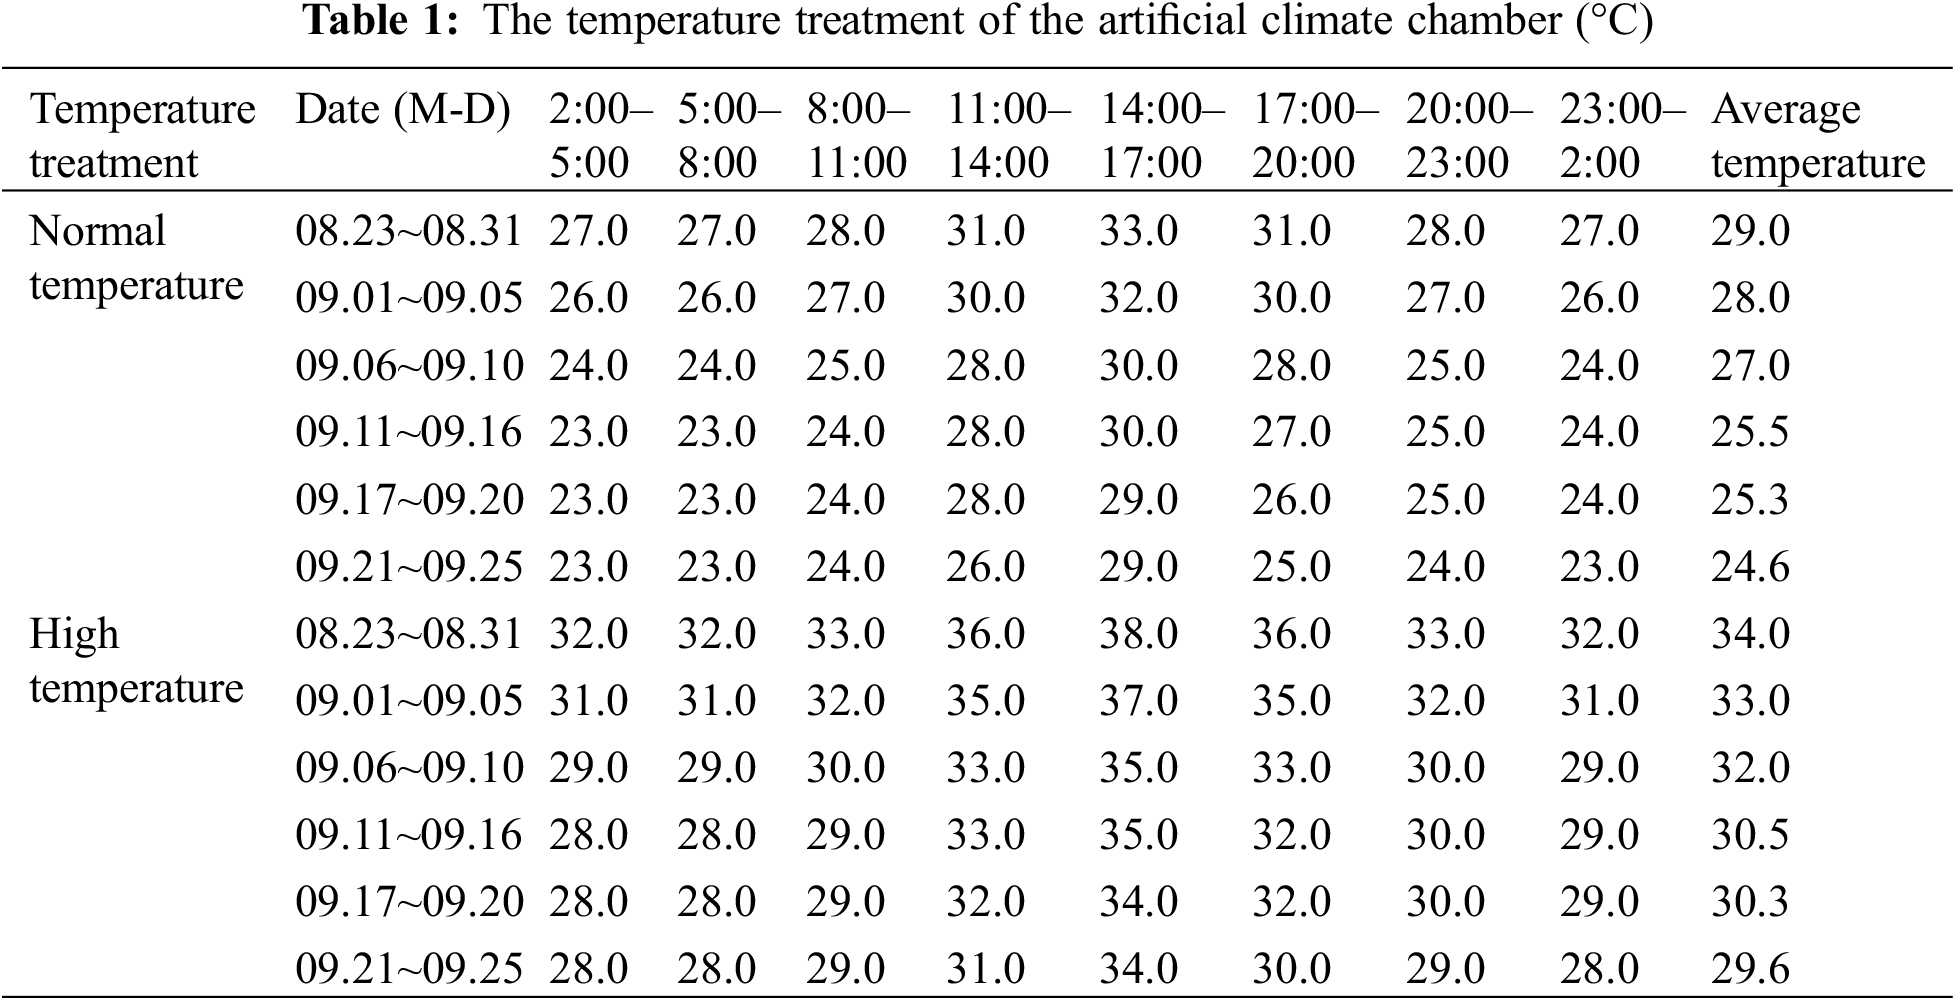
We moved the rice plants that had been grown outdoors into the artificial climate room at Yangzhou University. The artificial climate room included two rooms with high and normal temperatures, each climate-controlled room contained direct-seeded and transplanted rice. The average daily temperature, high temperature, and minimum temperature for the normal temperature treatment were set with reference to the average temperature of the same day published by the Meteorological Bureau over the previous 10 years. There were 15 repetitions for each treatment and the heat stress treatment was 5°C higher than the normal temperature setting (Table 1) [40–42]. Because the growth period of NJ-9108 and NJ-46 differed by 15 d, the time for high temperature treatment at the heading stage also differed. The temperature accuracy was ±0.5°C, the constant humidity was 70%, the CO2 concentration and illumination were consistent with those outside, and the wind speed was 0.5 m/s. The treatment time was 14 d in the initial heading stage when 10% of rice ears exhibited the sword leaf sheath. The temperature treatment time for NJ-9108 under transplantation mode was from August 23 to September 05. The temperature processing time for NJ-9108 under direct seeding mode was from August 29 to September 11; the temperature treatment time for NJ-46 under transplantation mode was from September 05 to September 18; the temperature processing time for NJ-46 under live broadcast mode was from September 11 to September 24. The plants were then moved outdoors at the end of the treatment period.
2.3 Air Temperature and Thermal Imaging of Rice Organs
Using a FLIR E4 (FLIR Systems, USA) thermal imaging camera, thermal infrared and RGB (red, green, and blue) images were taken simultaneously. This thermal imaging camera could detect a temperature difference of <0.15°C, with a FOL 7 mm lens, and an infrared resolution of 320 × 240 pixels. Moreover, the depression angle was set at 25°, and the emissivity was set to 0.95 [43]. A black cloth was used to minimize interference from other substances when recording the organ temperature. The thermal infrared image used to measure the plant and air temperature was taken at the original location. However, movement of the black cloth caused changes in the background temperature. To account for this, seven measurements were conducted at the rice tillering stage, jointing stage, booting stage, heading stage, filling stage, waxy stage, and full maturity stage. The potted plants under the high temperature and control treatments were moved outdoors during the thermal infrared measurements. The two rice varieties had different maturity dates, and temperature monitoring was performed at similar stages of plant development. The measurement in the tillering stage was performed from 8:00 to 19:00 and data were collected every 2 h. From the jointing to booting stages, the measurement was conducted from 00:00 for 24 h, and data were collected every hour. After the heading stage, the measurement was performed from 10:30 to 16:30 and data were collected every 3 h. We recorded three values from each panicle, stem, and leaf and used the averages as the final data while avoiding rainy weather during the sampling period. The rice organ temperature was analyzed using Flir® Tools software (version 6.2, FLIR Systems, Inc., USA) [44]. The air temperature was measured using a Testo608-H1 thermal hygrometer, which was maintained at a constant height. The measurement duration was the same as that used for the infrared thermal imager.
Daily average temperature, daily precipitation, and sunshine hour data were collected during the rice-growing season in 2019 at a weather station near Bonsai (Yangzhou, Jiangsu). The average temperature, average maximum temperature, average sunshine hour, and average precipitation were 23.6°C, 32.8°C, 5.5 h/day, and 2.9 mm/day, respectively (Fig. 1).
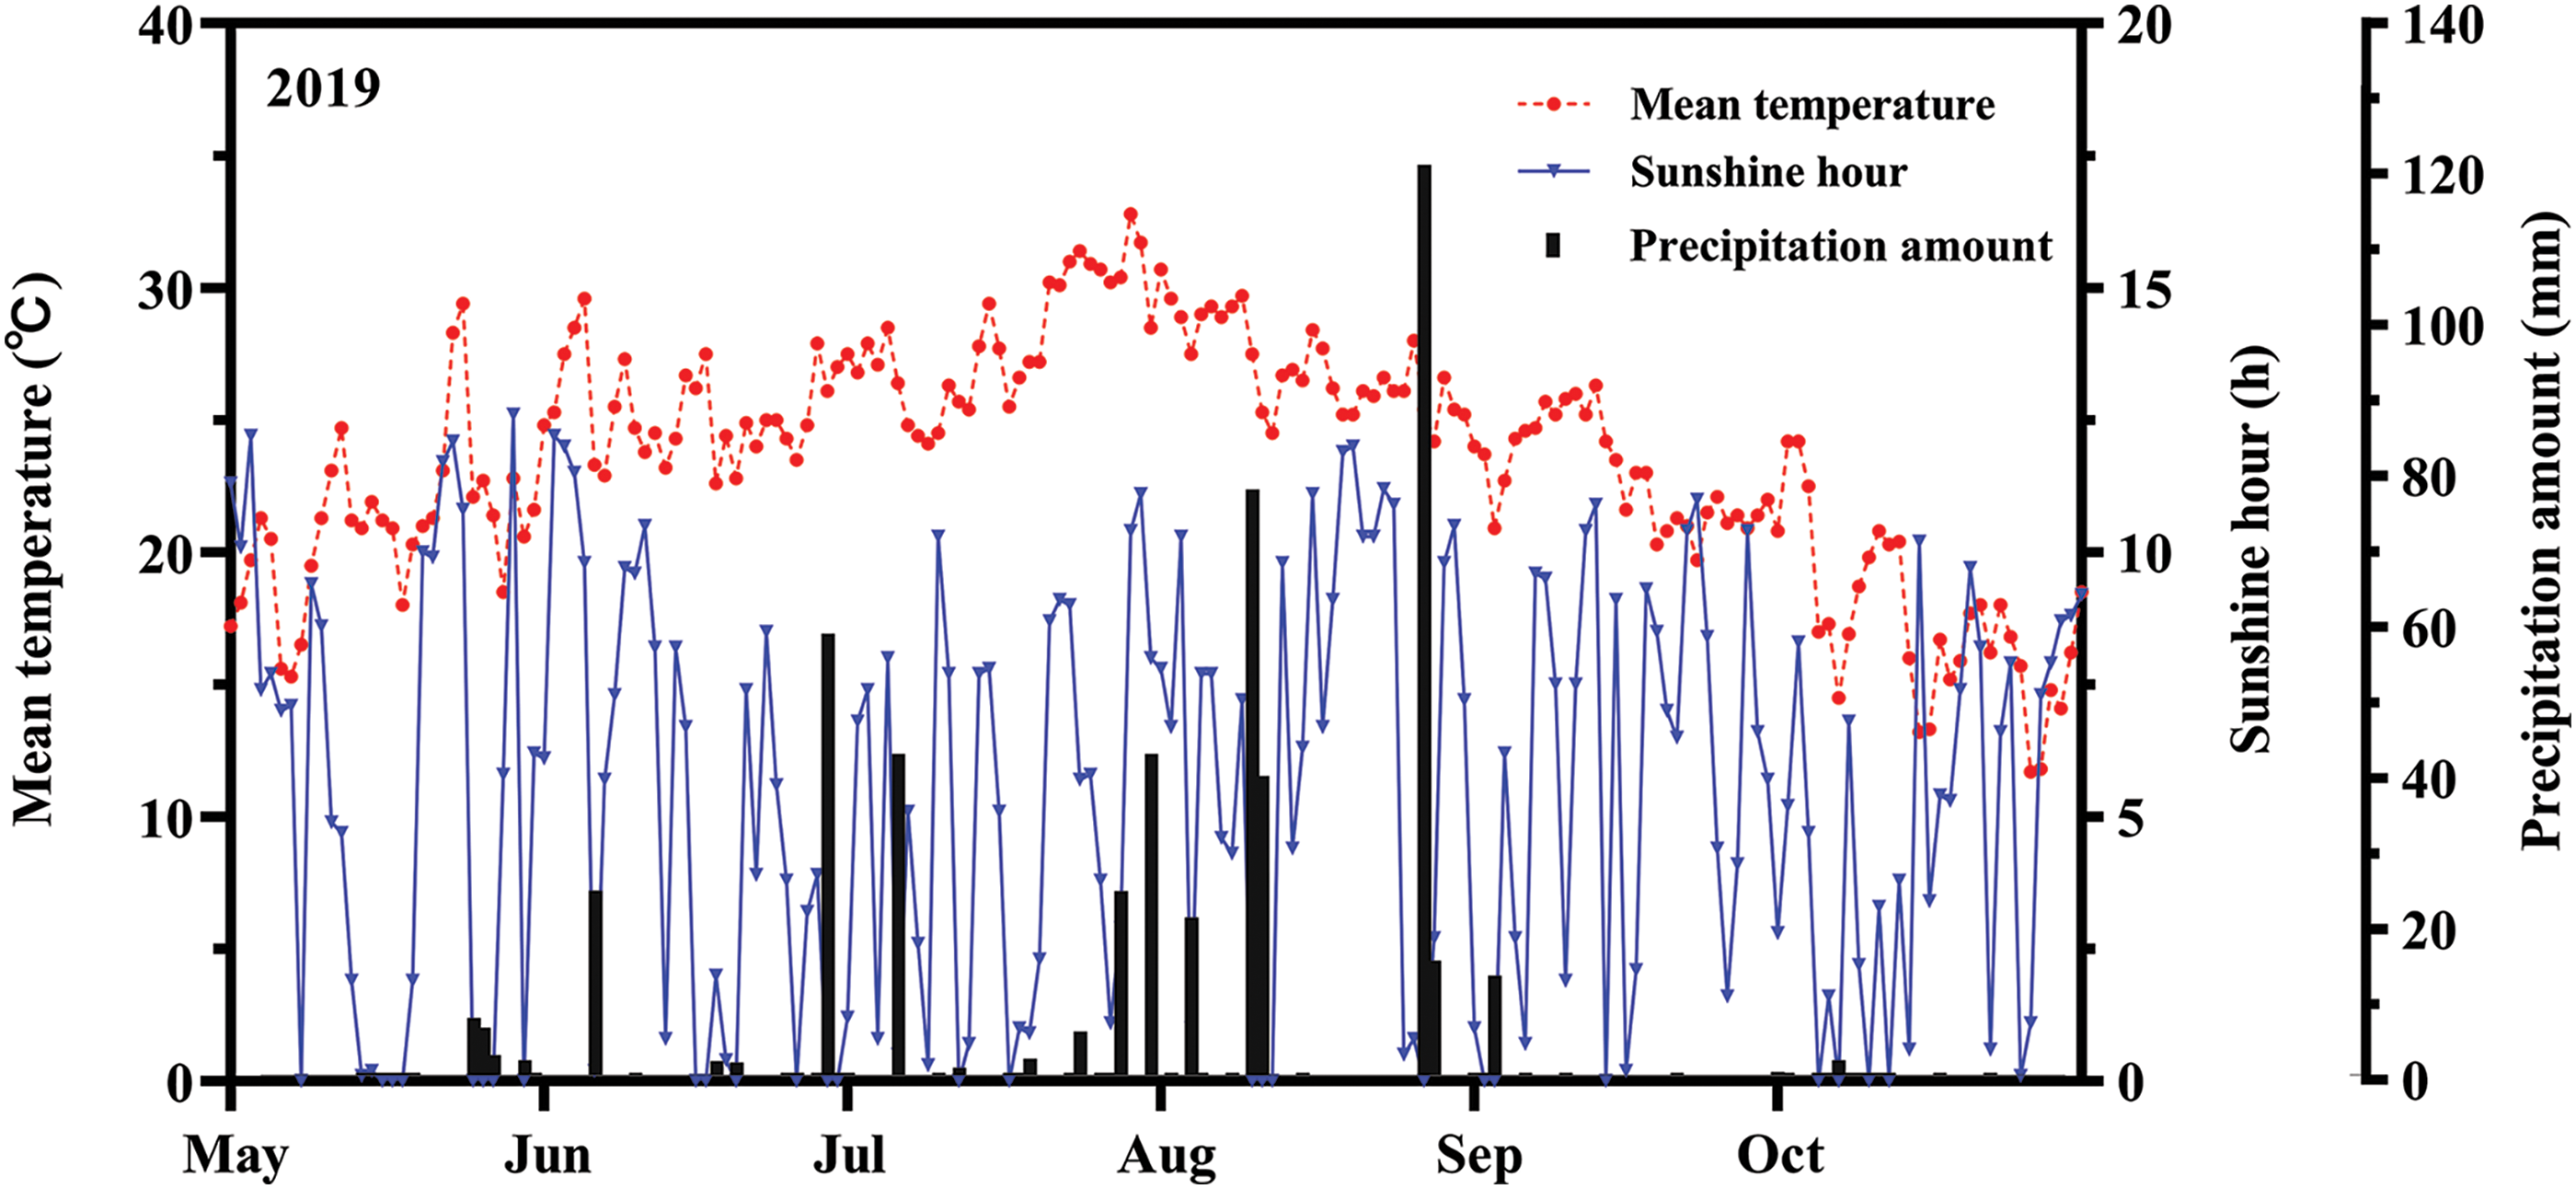
Figure 1: Diurnal variation of meteorological factors during the rice growth period in 2019. The red, blue, and black arrows represented the average temperature, sunshinehour, and precipitation, respectively
Three holes of rice were selected for each treatment, and the above-ground portion of rice was placed in an oven set at 105°C for 30 min and dried at 80°C to constant weight; the dry matter weight of the plants was measured.
In each treatment, ten holes of rice were selected to determine the SPAD value of the flag leaf using SPAD-502 chlorophyll meter produced by Minolta, Japan.
The plant samples, after grinding and drying, were boiled with H2SO4–H2O2. After distillation, the N, P, and K concentrations were determined. The total N concentration was determined with the micro-Kjedahl method; P was quantified by the vanadium–molybdenum yellow colorimetric method; K concentration was determined with a flame photometer.
The net photosynthetic rate, stomatal conductance, intercellular CO2 concentration and transpiration rate were measured using an LI–6400 portable photosynthetic meter (LI-COR Inc. Lincoln, NE, USA). Sunny weather was selected for determination, during which the original state of the flag leaf was selected as far as possible, including position and angle. Each treatment was repeated for six leaves, and each leaf was measured ten times to obtain the average value.
During the maturity stage, three replicate values were measured for each treatment, and each replicate value contained three holes of rice using three holes from multiple pots. After natural air-drying, yield traits were measured including the number of spikelets, grains per panicle, 1000-grain weight, seed setting rate, and theoretical yield.
Data were processed using Microsoft Excel 2010; GraphPad Prism 8 was employed for plotting, and ANOVA was performed using SPSS16.0. We had 2 cultivars × 2 planting methods × 7 growth periods × 4 organs (leaf, spike, stem, canopy) per plant. We used a ONE-WAY analysis of variance to open the two-way significant interactions. The differences between treatments and varieties were compared using Tukey’s least significant difference (LSD) at the 5% probability level. We used ONE-WAY ANOVA when we compared (1) organ temperature with atmospheric temperature, (2) yield and its components, and (3) biological characteristics.
3.1 Effects of Two Planting Methods on the Organ Temperature from the Tillering to Grain-Filling Stages of Rice
The rice crop was found to have an intrinsic temperature. The temperature difference between the rice and surrounding environment was strongly pronounced in the thermal infrared image. Meanwhile, rice plants from the same cultivar and under the same treatment had almost the same crop temperature. Therefore, the canopy temperature of rice under the same treatment and variety was generally consistent (Fig. 2A). The canopy temperatures of “NJ-46” and “NJ-9108” showed a synergistic trend with the air temperature (Fig. 2B). Compared to the air temperature, the change in canopy temperature was relatively small. The canopy temperature was significantly lower than the air temperature during the day (11:00 to 17:00) and significantly higher than the air temperature at night (01:00 to 05:00). The ambient temperature changes in the jointing and booting stages were 28.30°C–37.00°C and 25.30°C–35.30°C, respectively. The canopy temperature changes were 30.23°C–35.67°C and 27.43°C–33.87°C, respectively (Fig. 2B). The order of the CV of the air and canopy temperatures was air temperature > transplanted rice, direct-seeded rice. At 13:00, the air and canopy temperatures reached the maxima. The best time to measure the canopy temperature was found to be 1 pm.
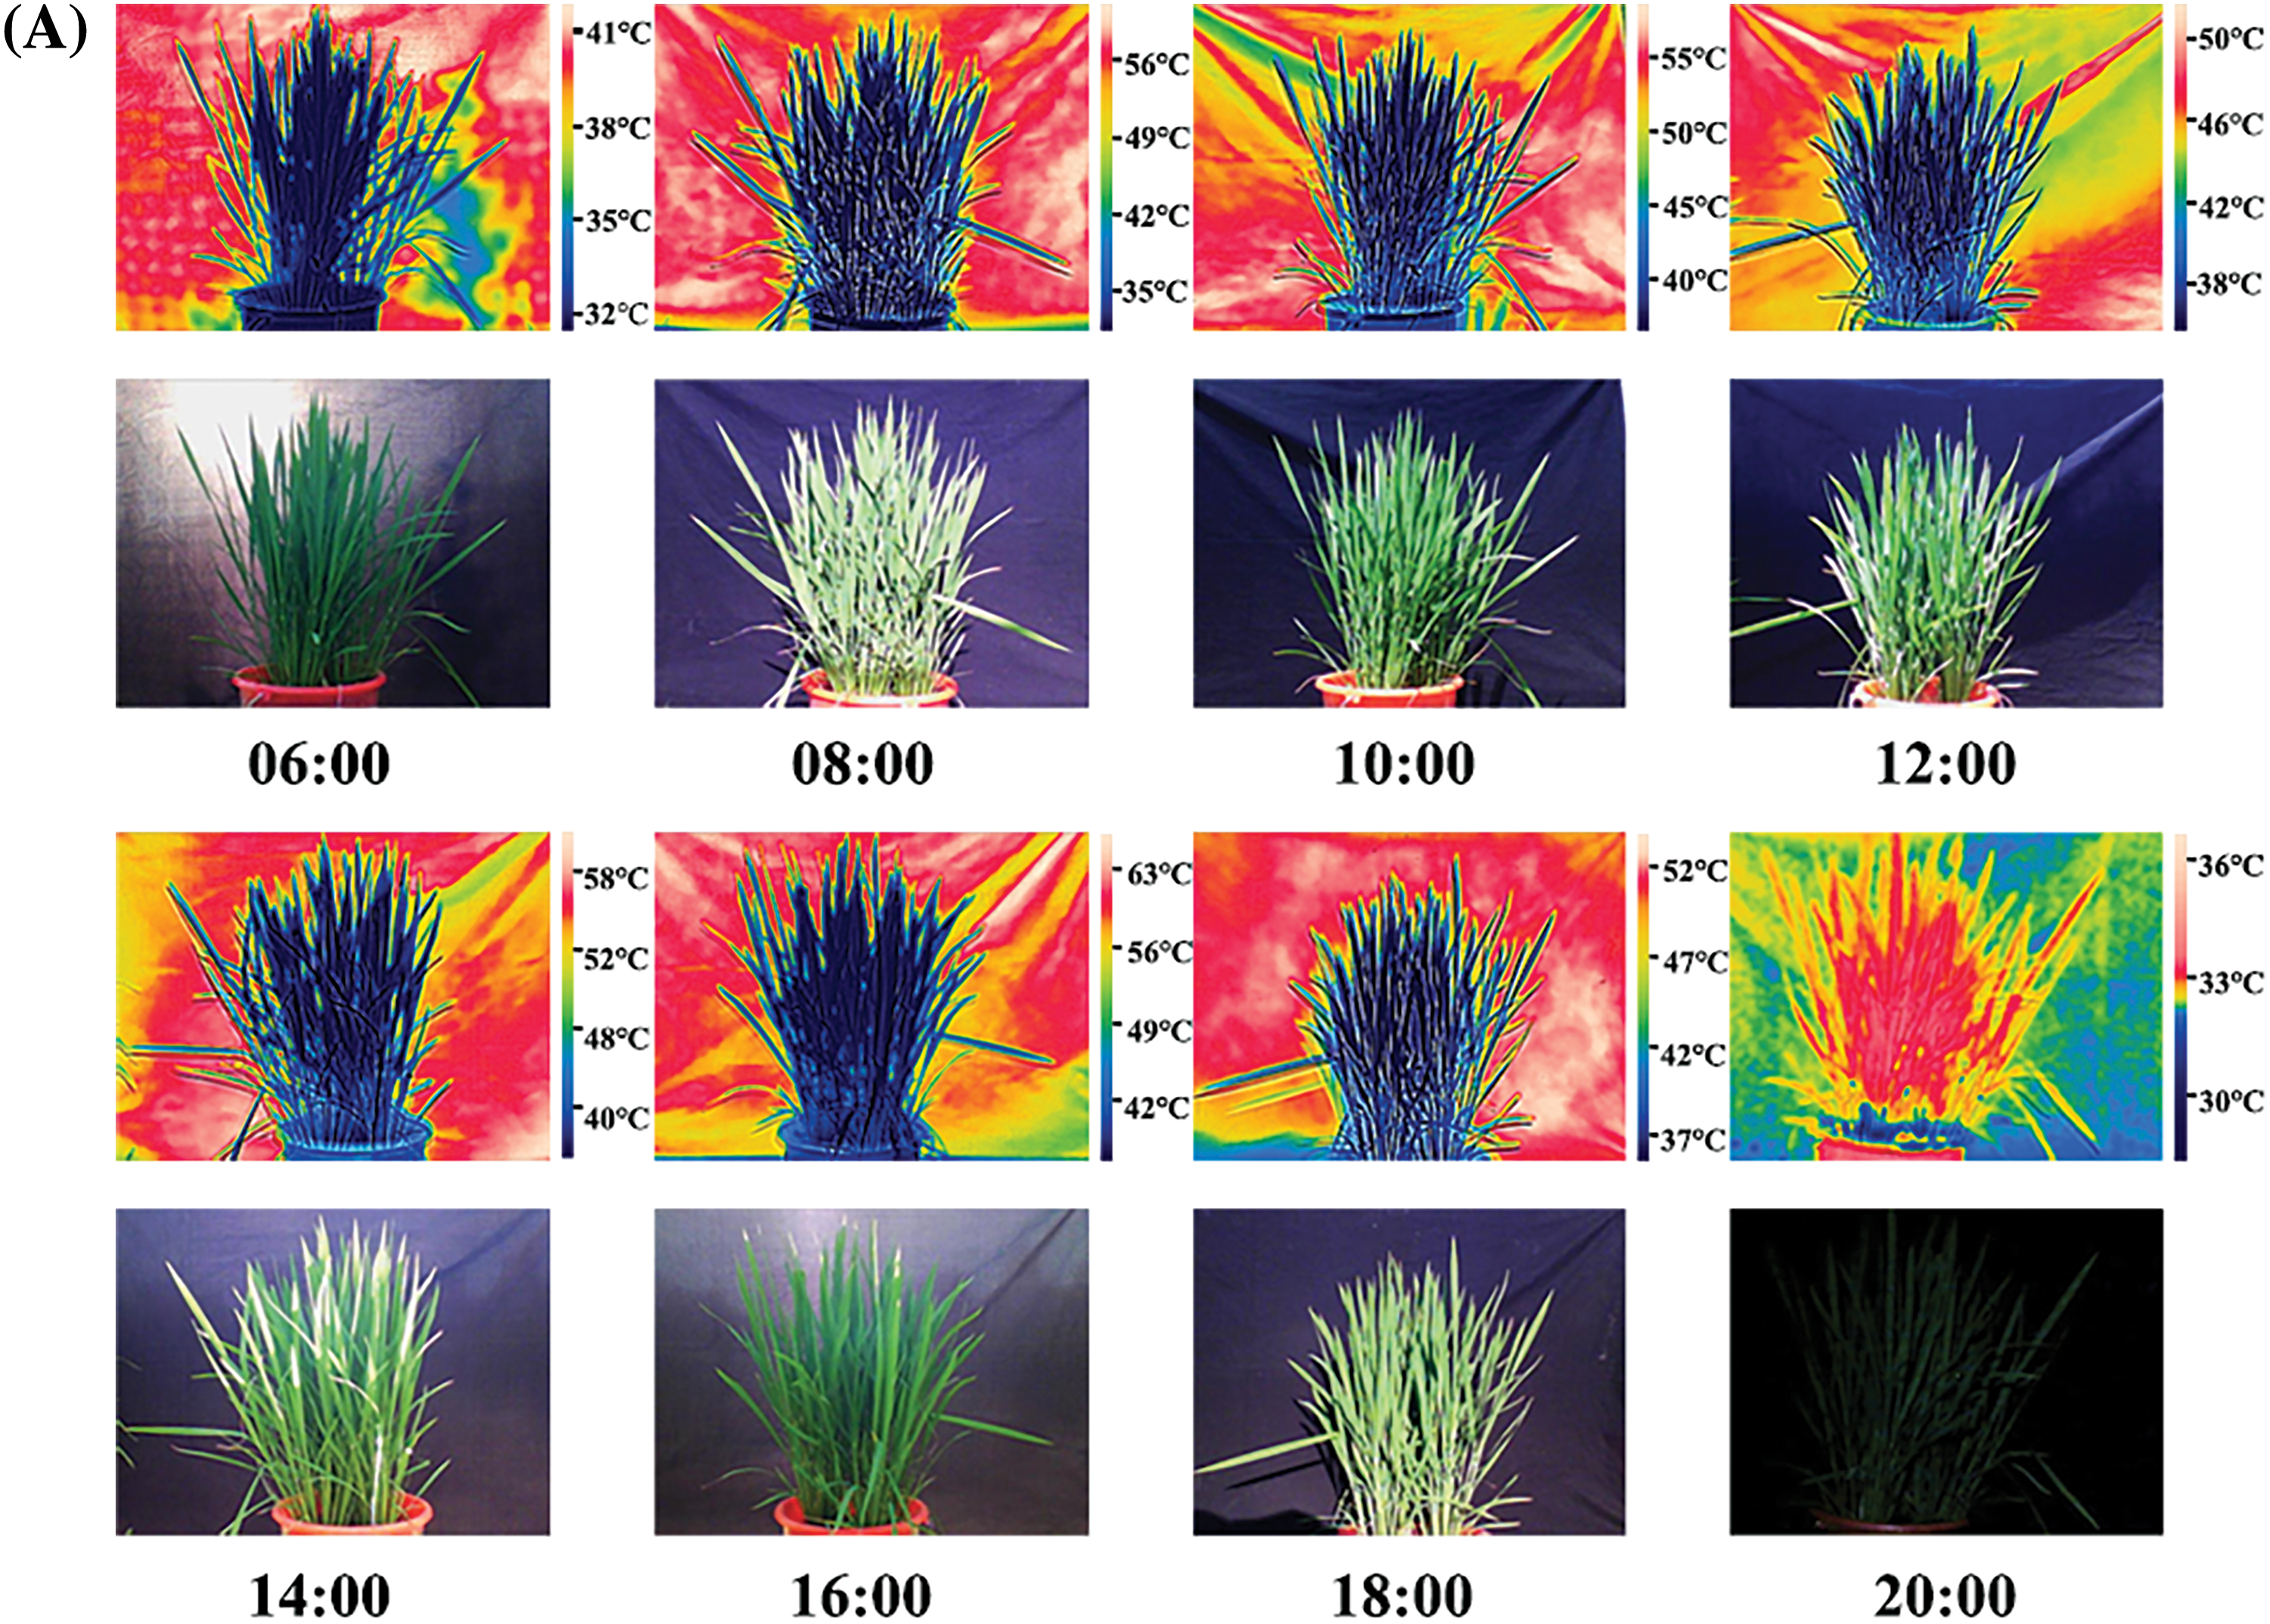
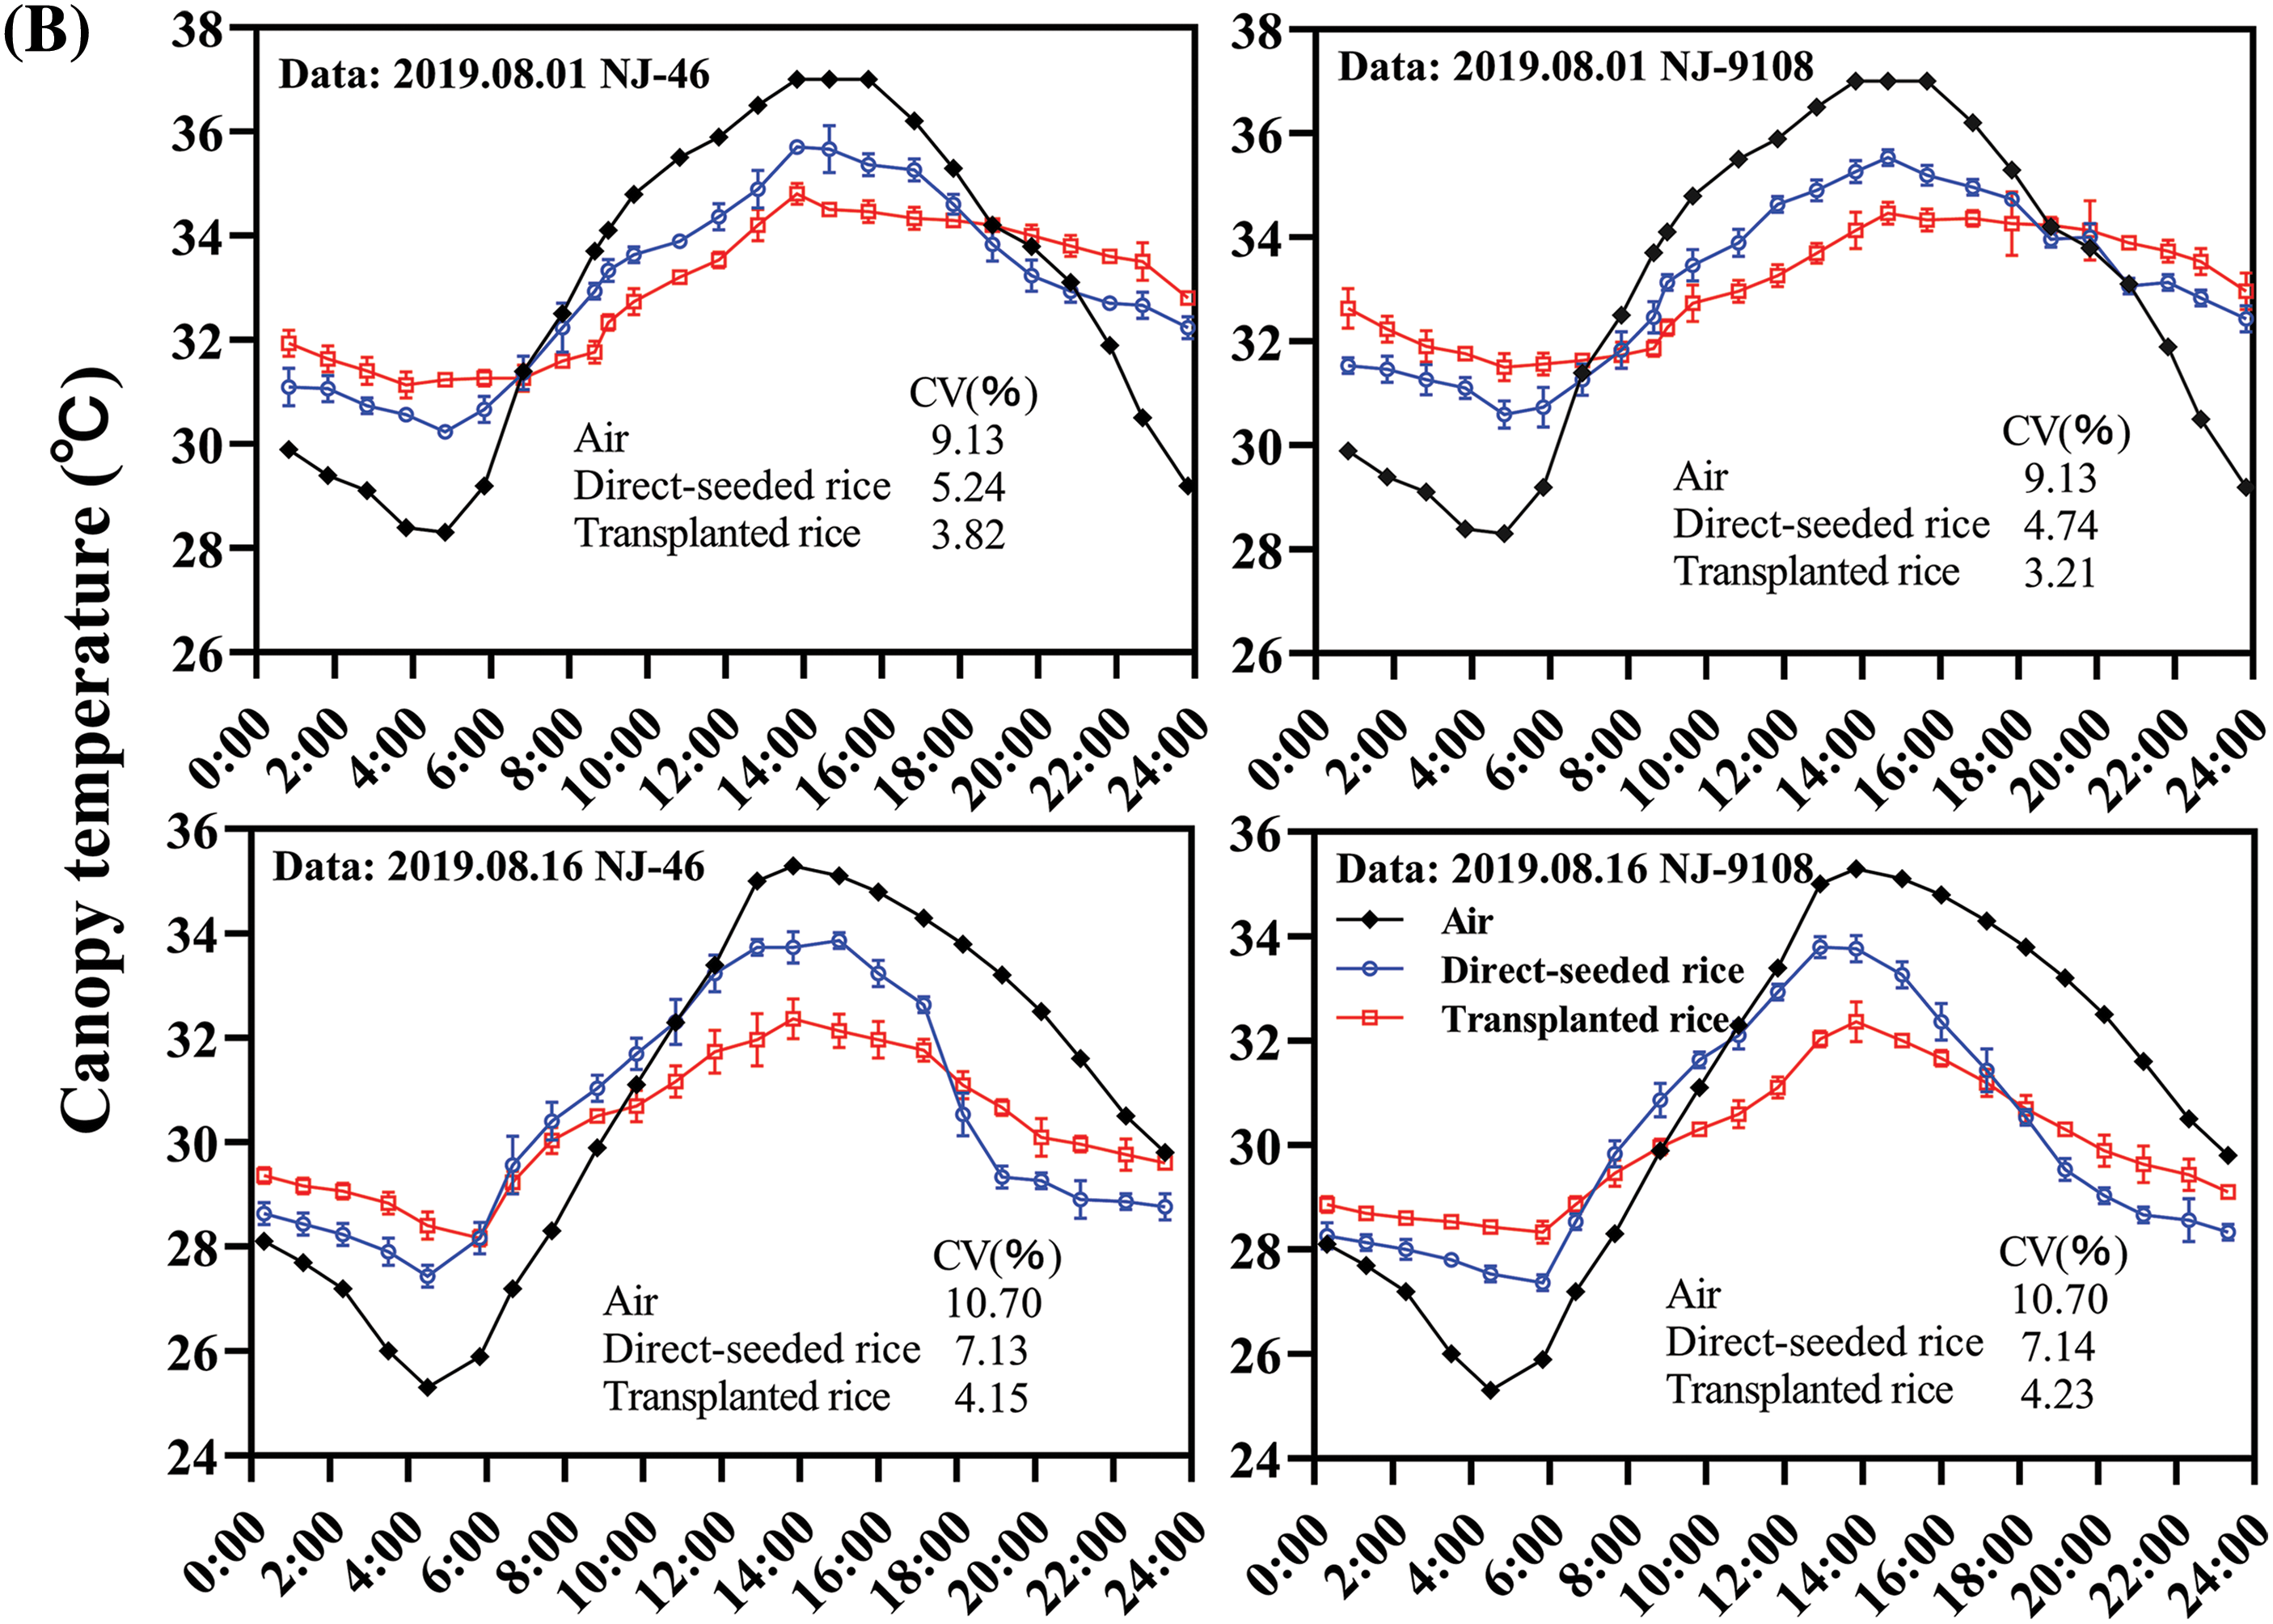
Figure 2: Diurnal variation in the rice canopy temperature. (A) Temperature change in rice variety “NJ-19108” throughout the day under transplanting mode (Date: 08/11/2019). The scale on the right of the thermal infrared image showed the environment temperature range and that of the plant. (B) Diurnal variations in the canopy temperatures of “NJ-46” and “NJ-9108” measured at ambient temperature, where CV represented the coefficient of variation (%)
In the seven key growth stages, the canopy temperature trends of the two varieties under different planting methods were consistent (Fig. 3). When the air temperature increased, the canopy temperature of “NJ-46” and “NJ-9108” also increased. When the air temperature decreased, the canopy temperature of “NJ-46” and “NJ-9108” also decreased. The coefficient of variation of air temperature was significantly higher than that of canopy temperature of direct-seeded and transplanted rice (p < 0.05). The variation trend of canopy temperature was similar to that of air temperature, and the coefficient of variation of air temperature was significantly greater than that of direct-seeded and transplanted rice during one day or seven key growth stages (p < 0.05). This indicated that canopy temperature was affected by air temperature.
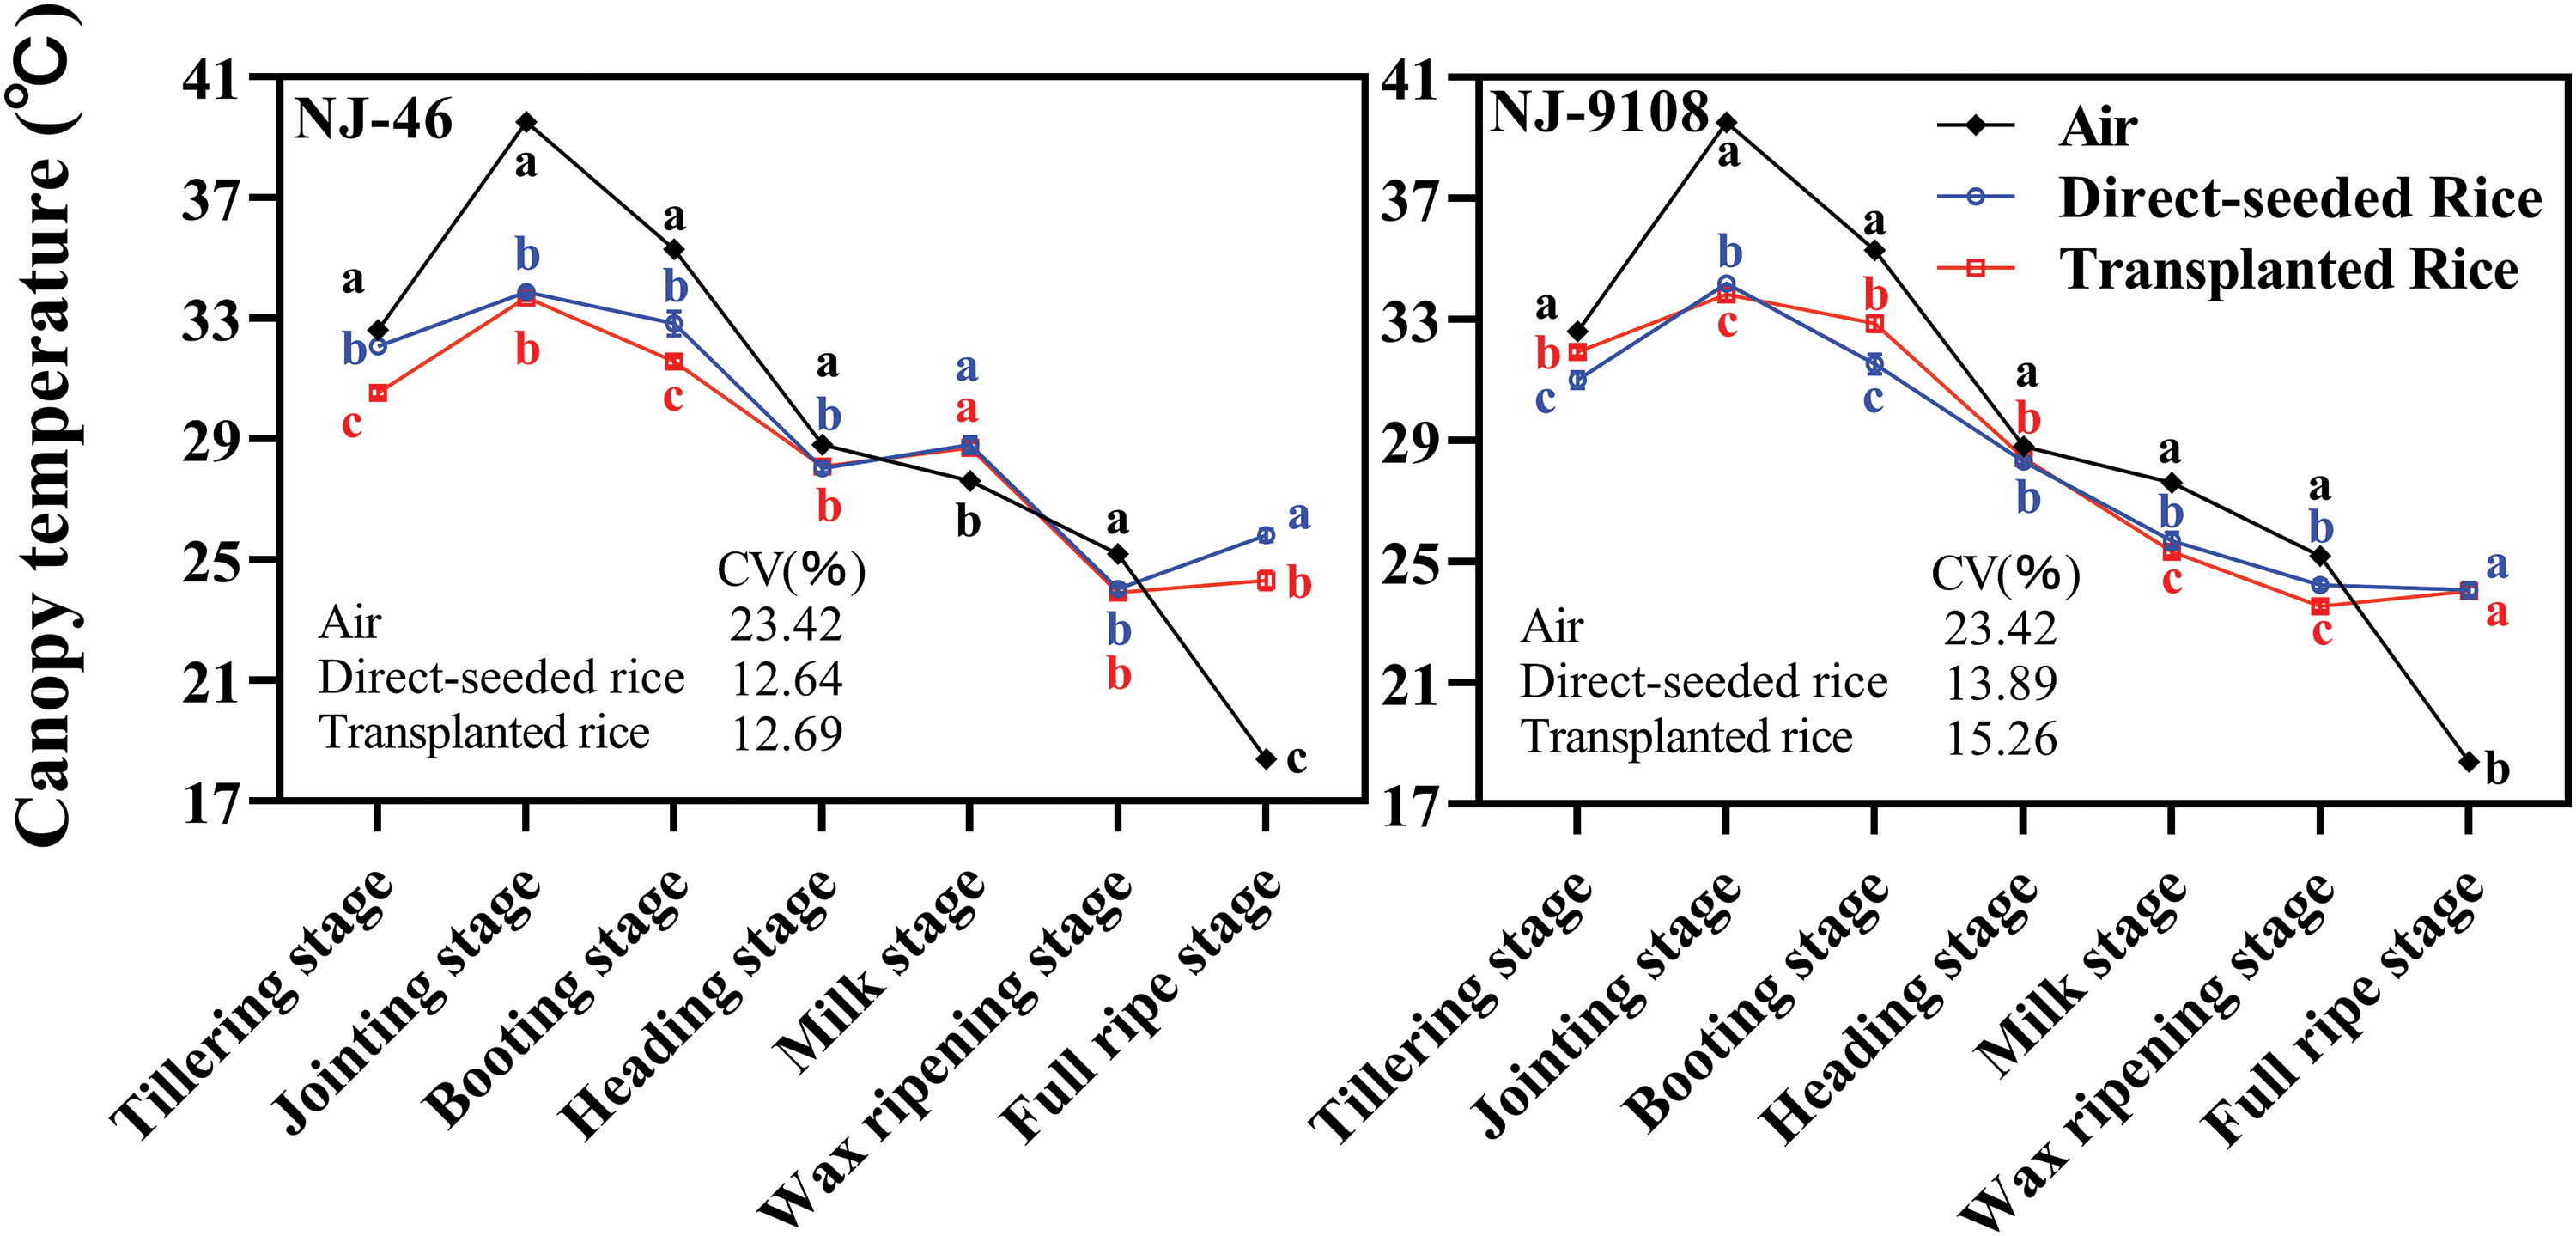
Figure 3: Based on the changes of air and canopy temperatures from tillering stage to full ripe stage of rice under two planting methods. Changes in the canopy temperature (13:00) of “NJ-46” and “NJ-9108” under natural conditions. Different lowercase letters close to each symbol compare canopy temperatures within each phenological stage. Each symbol is the mean of n = 3
In this experiment, the organ and canopy temperature was measured in the seven main rice growth periods. The analysis of variance (Tables 2 and 3) showed that the effects of atmospheric temperature and treatment on the temperature of rice organs and canopy were significant (p > 0.05). Different rice varieties had no significant effect on the temperature of canopy and organs (p > 0.05), but the temperature difference between different organs and canopy reached a significant level (p < 0.05). The interaction of atmospheric temperature, treatment, variety and different organs were observed to have a significant effect on the temperature of rice (p < 0.05).
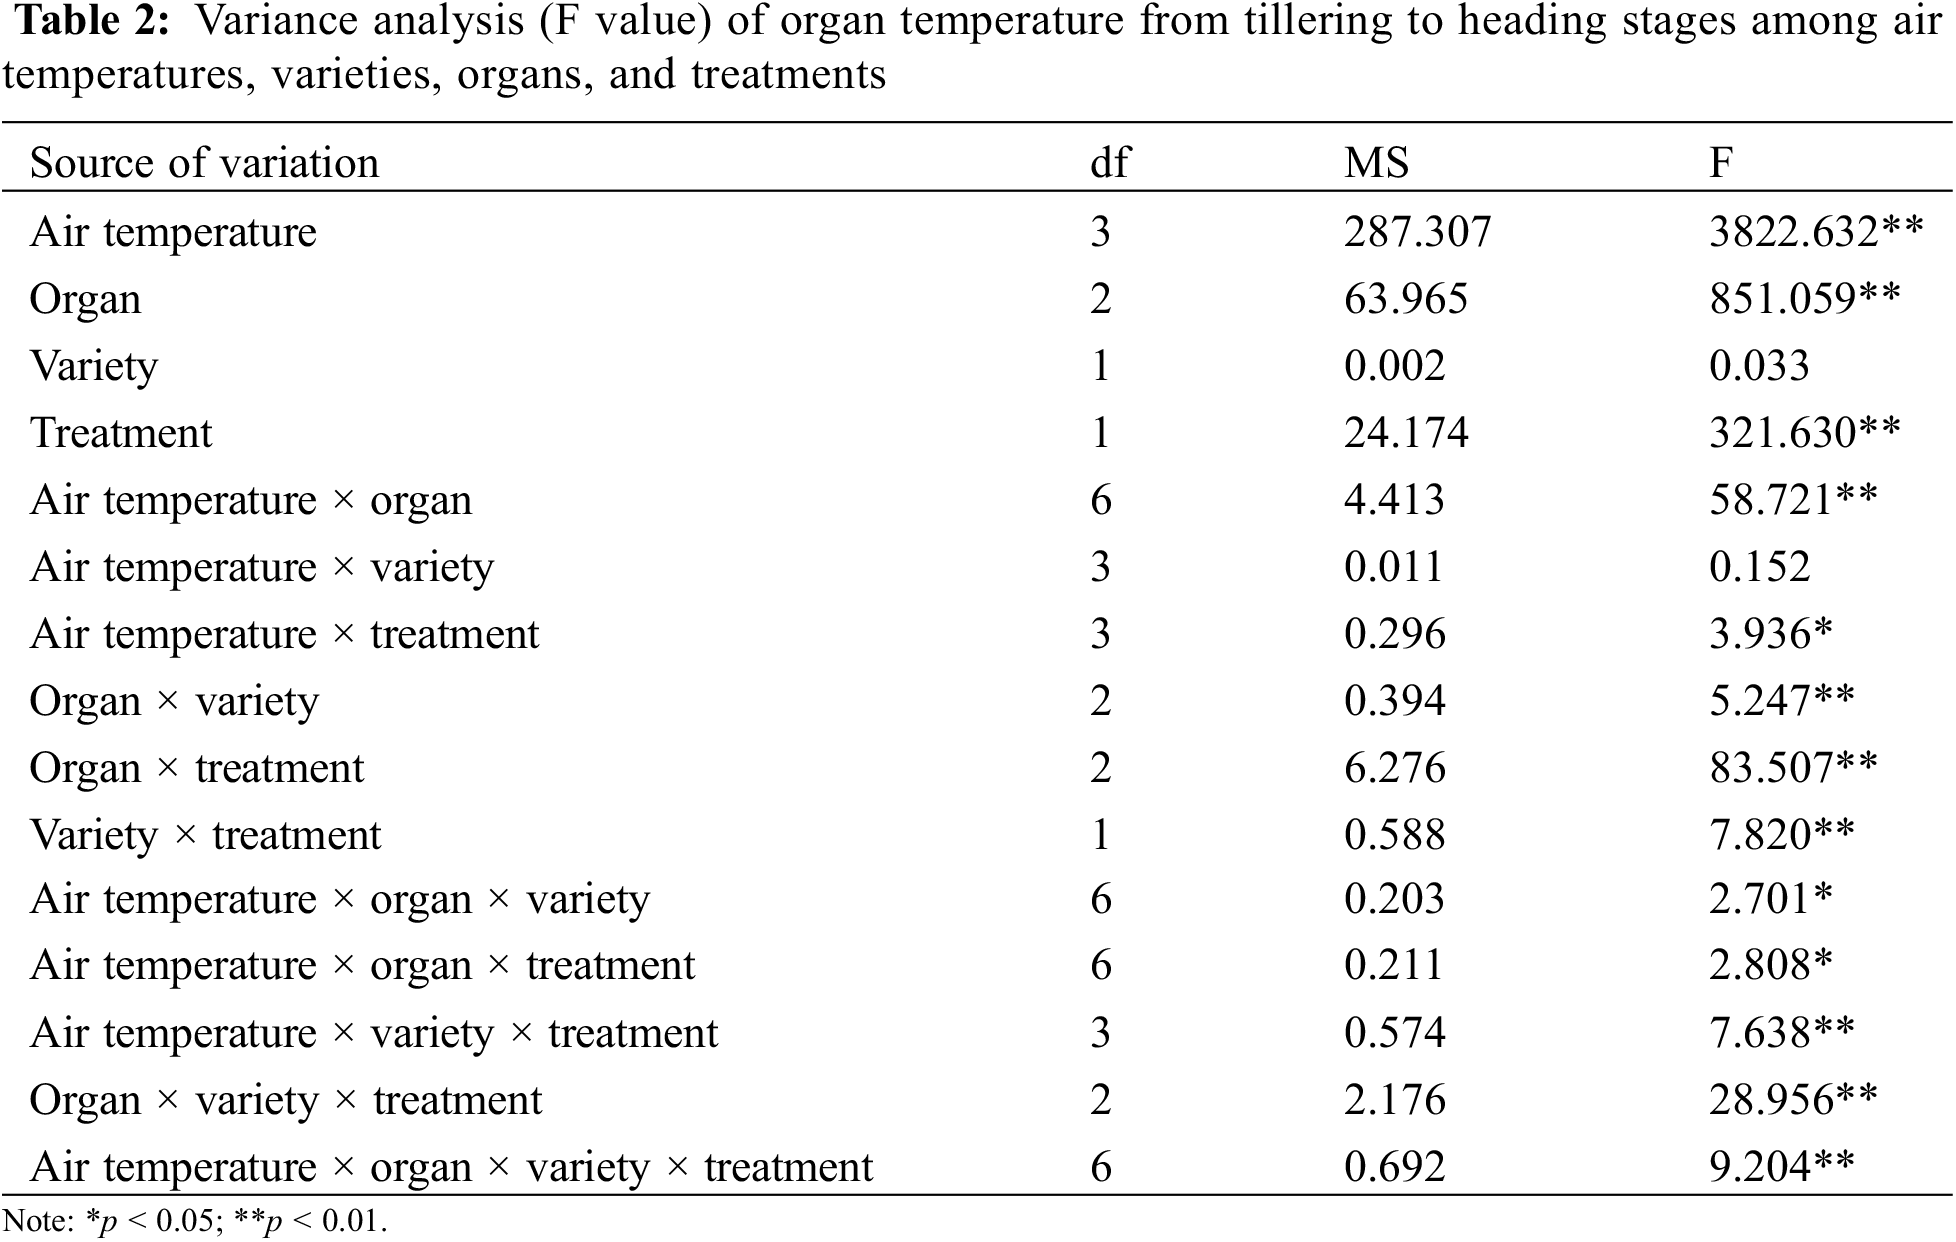
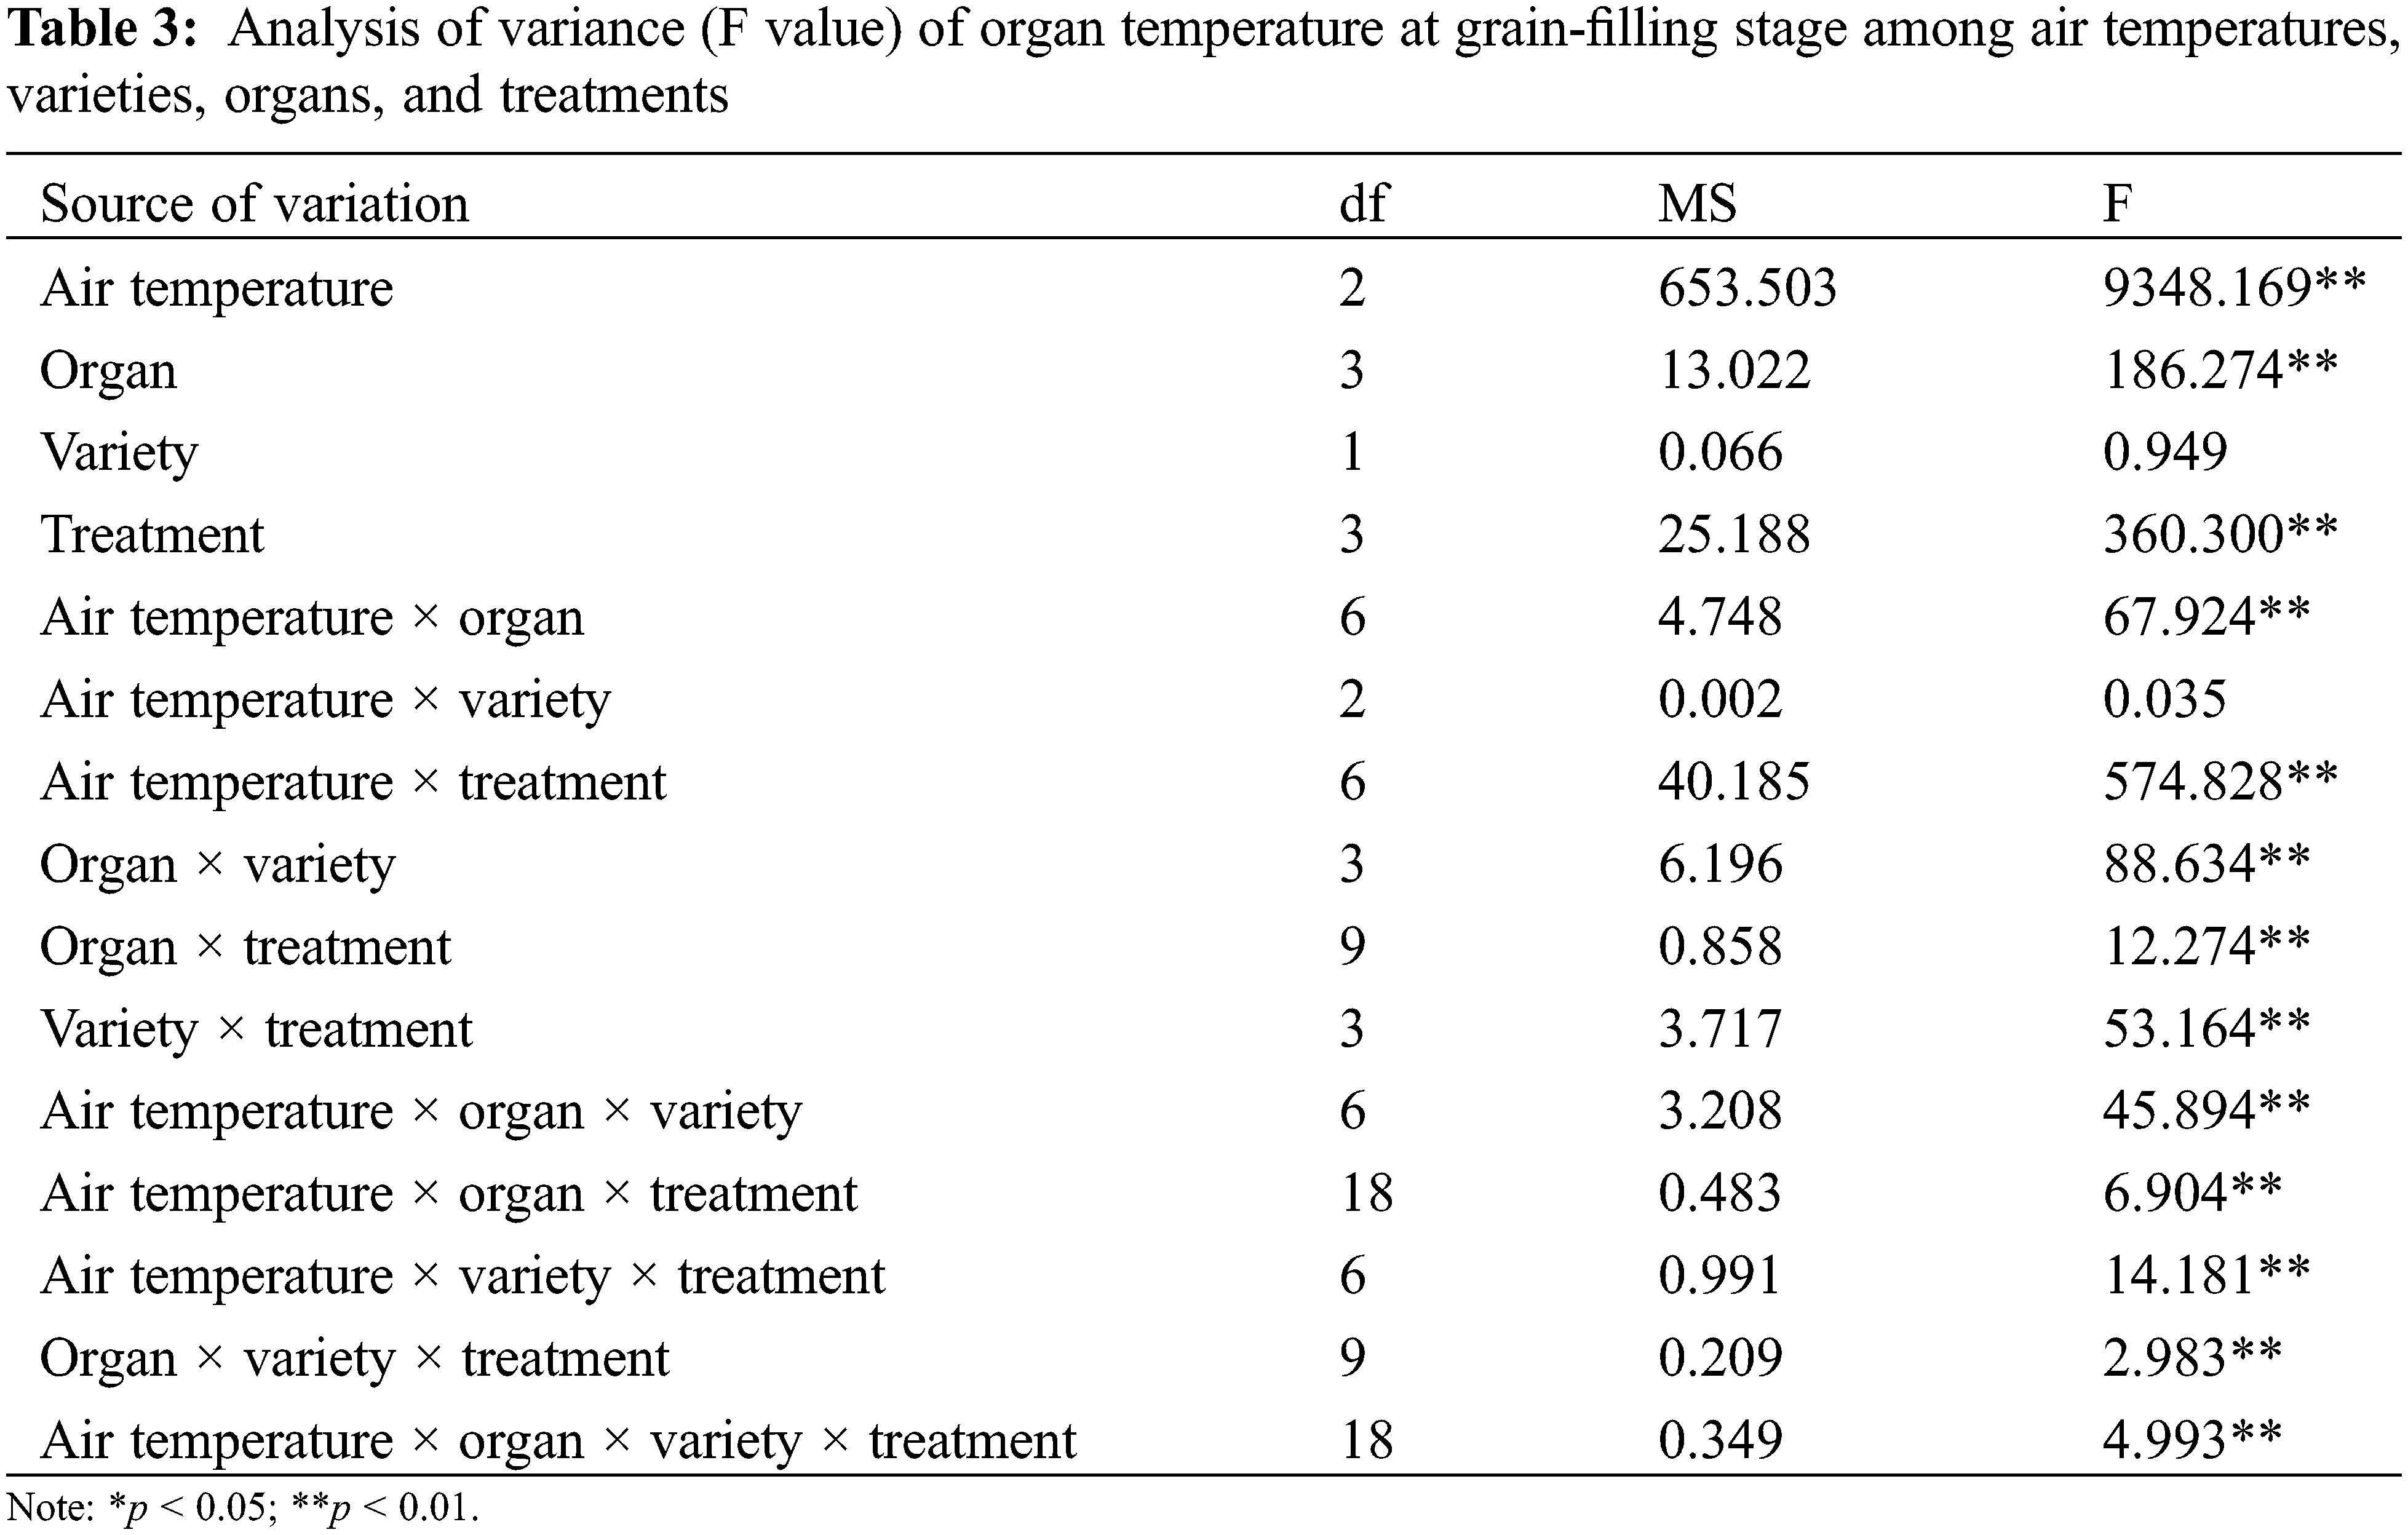
In the interaction effect of air temperature × organ, the effect caused by air temperature (p < 0.05) was higher than that caused by organ (p < 0.05). In the interaction effect of air temperature × treatment, the effect caused by air temperature (p < 0.05) was higher than that caused by treatment (p > 0.05). Among the interaction effects of organ × variety, the effect caused by organ (p < 0.05) was higher than that caused by variety (p > 0.05). Among the interaction effects of organ × treatment, the effect caused by organ (p < 0.05) was higher than that caused by treatment (p > 0.05). Among the interaction effects of variety × treatment, the effect caused by treatment (p > 0.05) was higher than that by variety (p > 0.05) (Table 2). In the interaction effect of air temperature × organ, the effect caused by air temperature (p < 0.05) was higher than that caused by organ (p > 0.05). In the interaction effect of air temperature × treatment, the effect caused by air temperature (p < 0.05) was higher than that caused by treatment (p < 0.05). Among the interaction effects of organ × variety, the effect caused by organ (p > 0.05) was higher than that caused by variety (p > 0.05). Among the interaction effects of organ × treatment, the effect caused by treatment (p < 0.05) was higher than that caused by organ (p > 0.05). Among the interaction effects of variety × treatment, the effect caused by treatment (p < 0.05) was higher than that caused by variety (p > 0.05) (Table 3).
Because air temperature had a significant effect on organ and canopy temperatures, we used ΔTl, ΔTs, ΔTp, and ΔTc to reduce the influence of air temperature factors. The effects of the direct-seeded and transplanting methods on the organ–air temperature differences varied in different growth stages. Under ambient temperature conditions, the ΔTl of direct-seeded rice was significantly higher than that of transplanted rice during the seven key growth periods (p < 0.05). The ΔTs of direct-seeded rice was higher than that of transplanted rice during the seven key growth periods, and the difference reached a significant level from the tillering stage to the milking stage (p < 0.05). The ΔTp of direct-seeded rice was significantly higher than that of transplanted rice during milk to wax ripening (p < 0.05). During the period from milk to wax ripening, the ΔTc of direct-seeded rice was higher than that of transplanting rice, but the difference was not significant (Figs. 4A–4D) (p > 0.05). In the same growth period, the ΔTl, ΔTs, ΔTp, and ΔTc of direct-seeded rice were smaller following high temperature treatment of “NJ-46” and “NJ-9108” than that of transplanted rice, with the difference reaching a significant level (p < 0.05) (Figs. 4E and 4F). After treatment at ambient temperature, the organ–air temperature differences of the direct-seeded rice were larger than that of transplanted rice, as shown in the Fig. 5, the ΔTl, ΔTp, and ΔTs increased by 0.57°C–1.63°C (p < 0.05), 0.03°C–1.23°C, and 0.03°C–1.67°C, respectively.
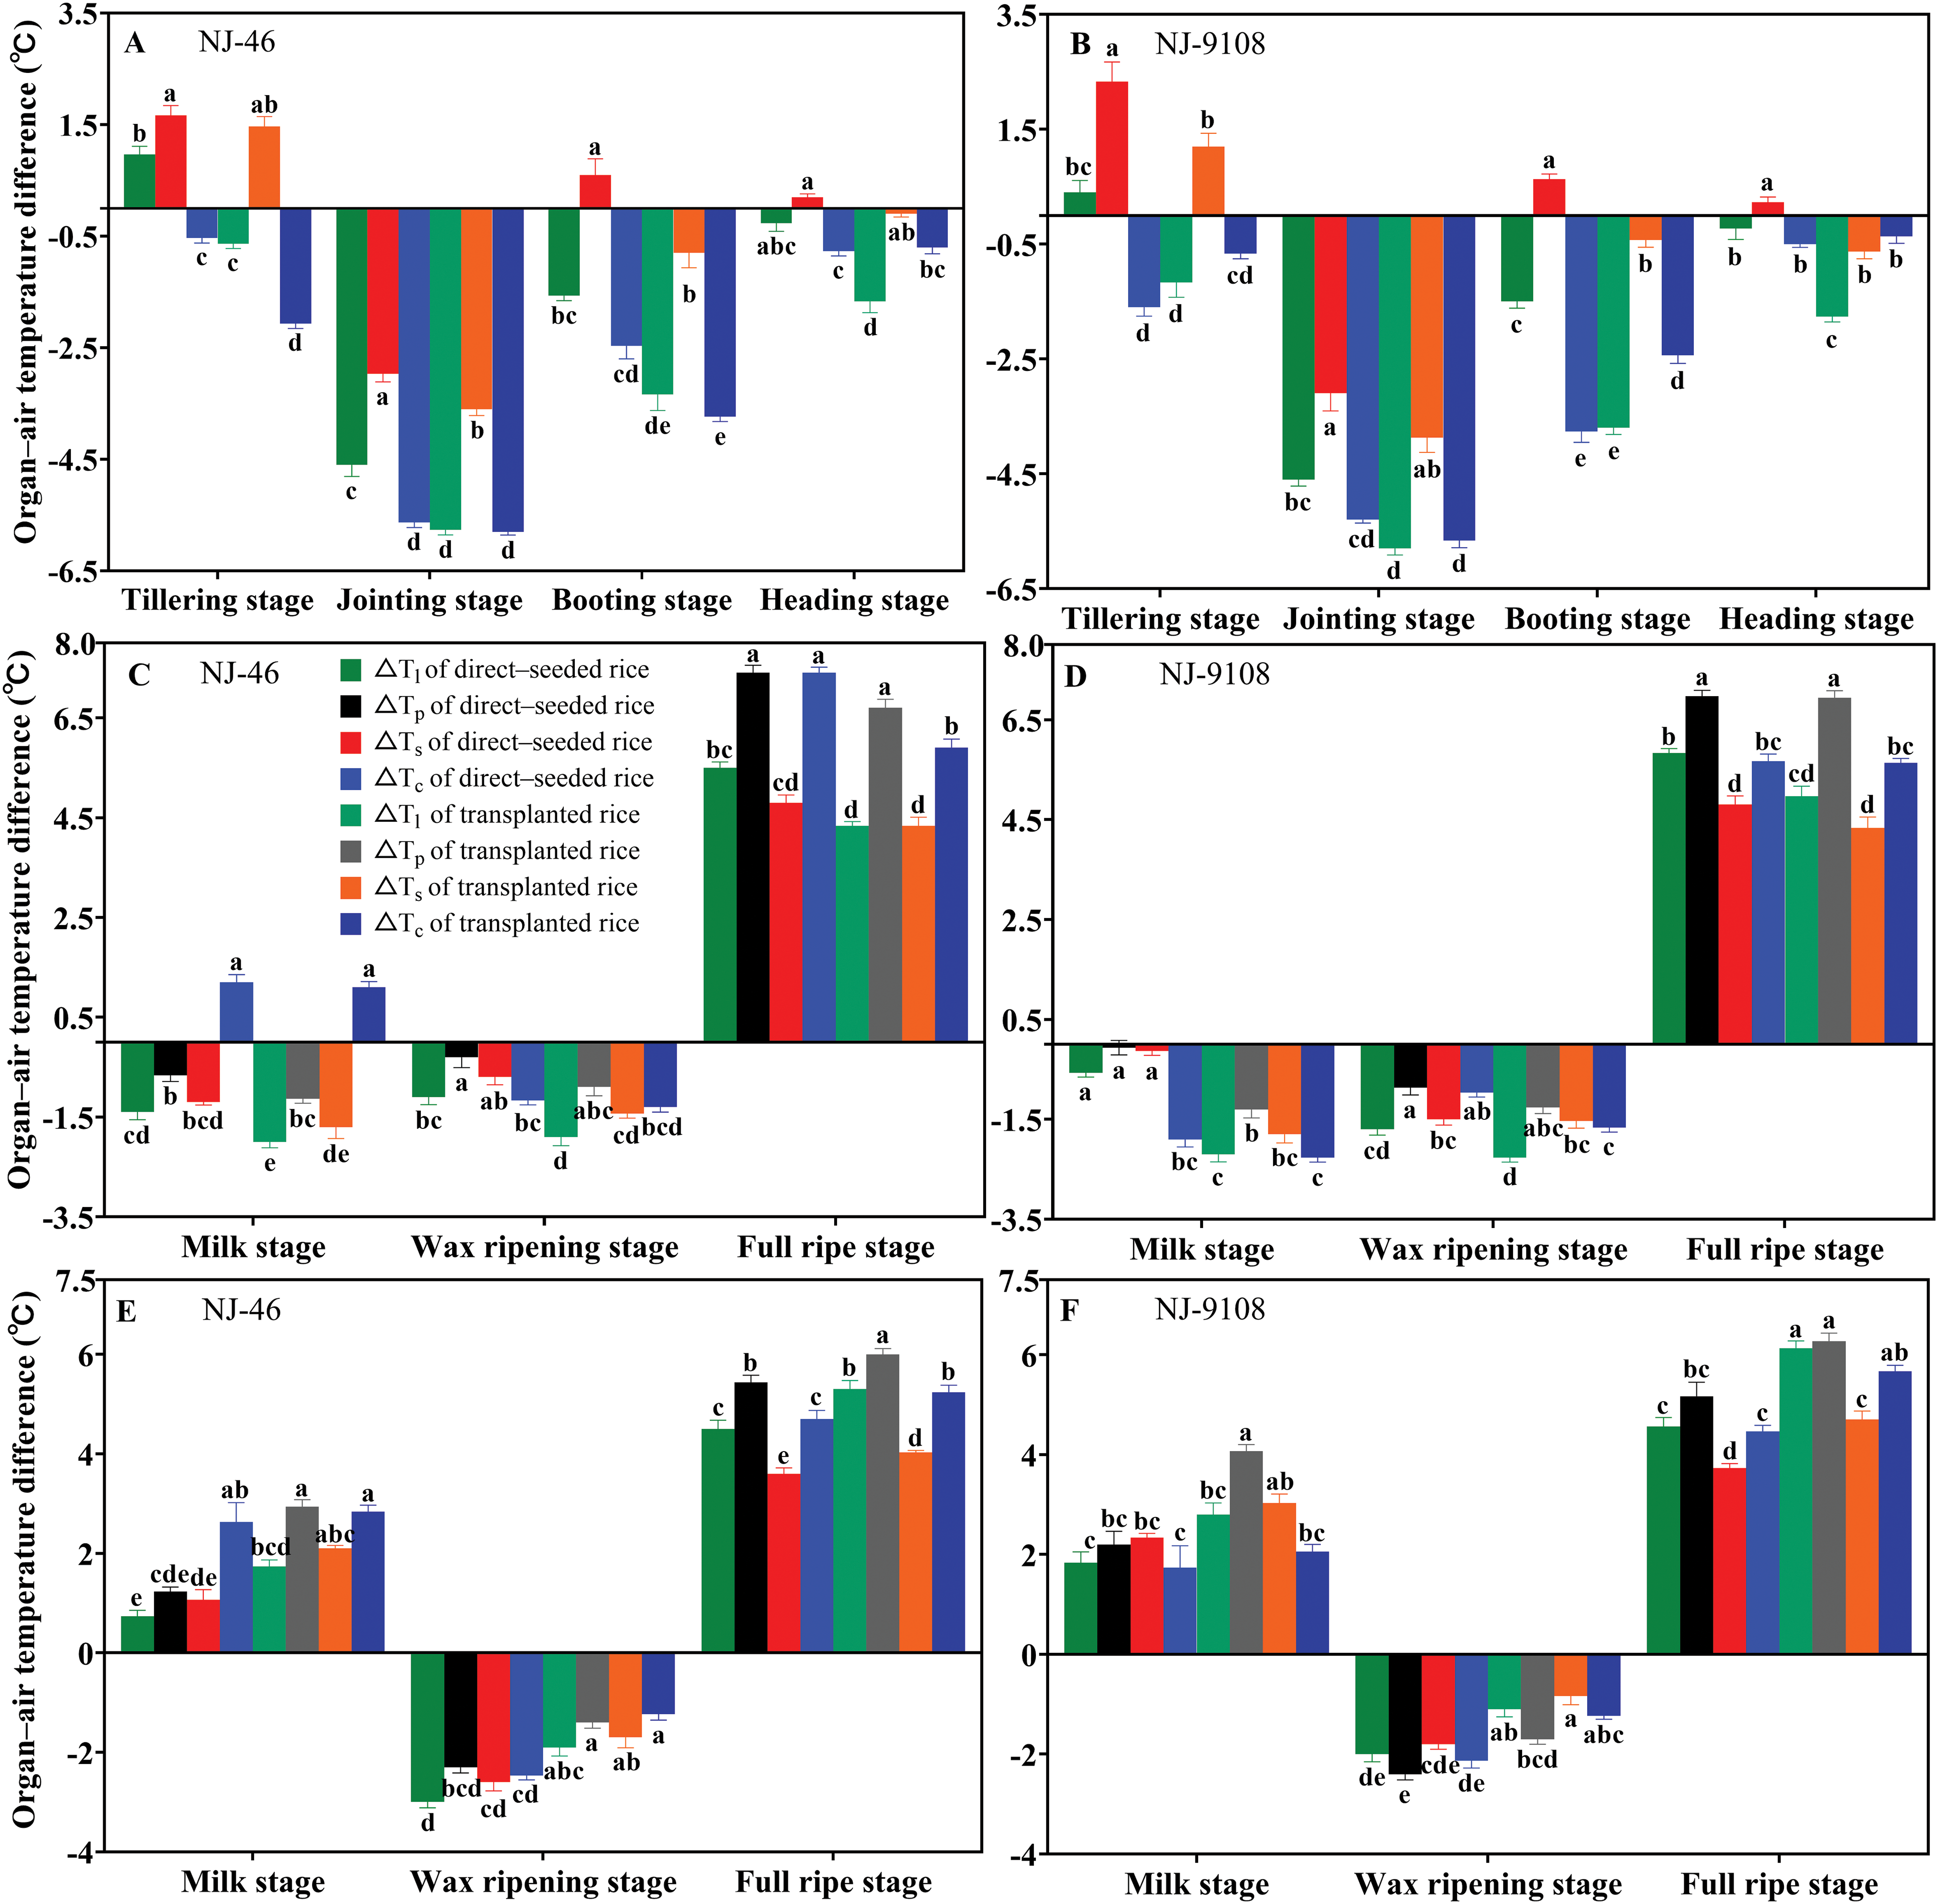
Figure 4: Based on the changes of organ–air temperature differences from the tillering stage to the full ripe stage of rice under two planting methods. Changes in the organ–air temperature differences (1 pm) of “NJ-46” and “NJ-9108” under natural conditions (A, B, C, D) and under high temperature conditions (E, F). Different letters indicated significant differences among treatments within each phenological stage for the same variety (p < 0.05)
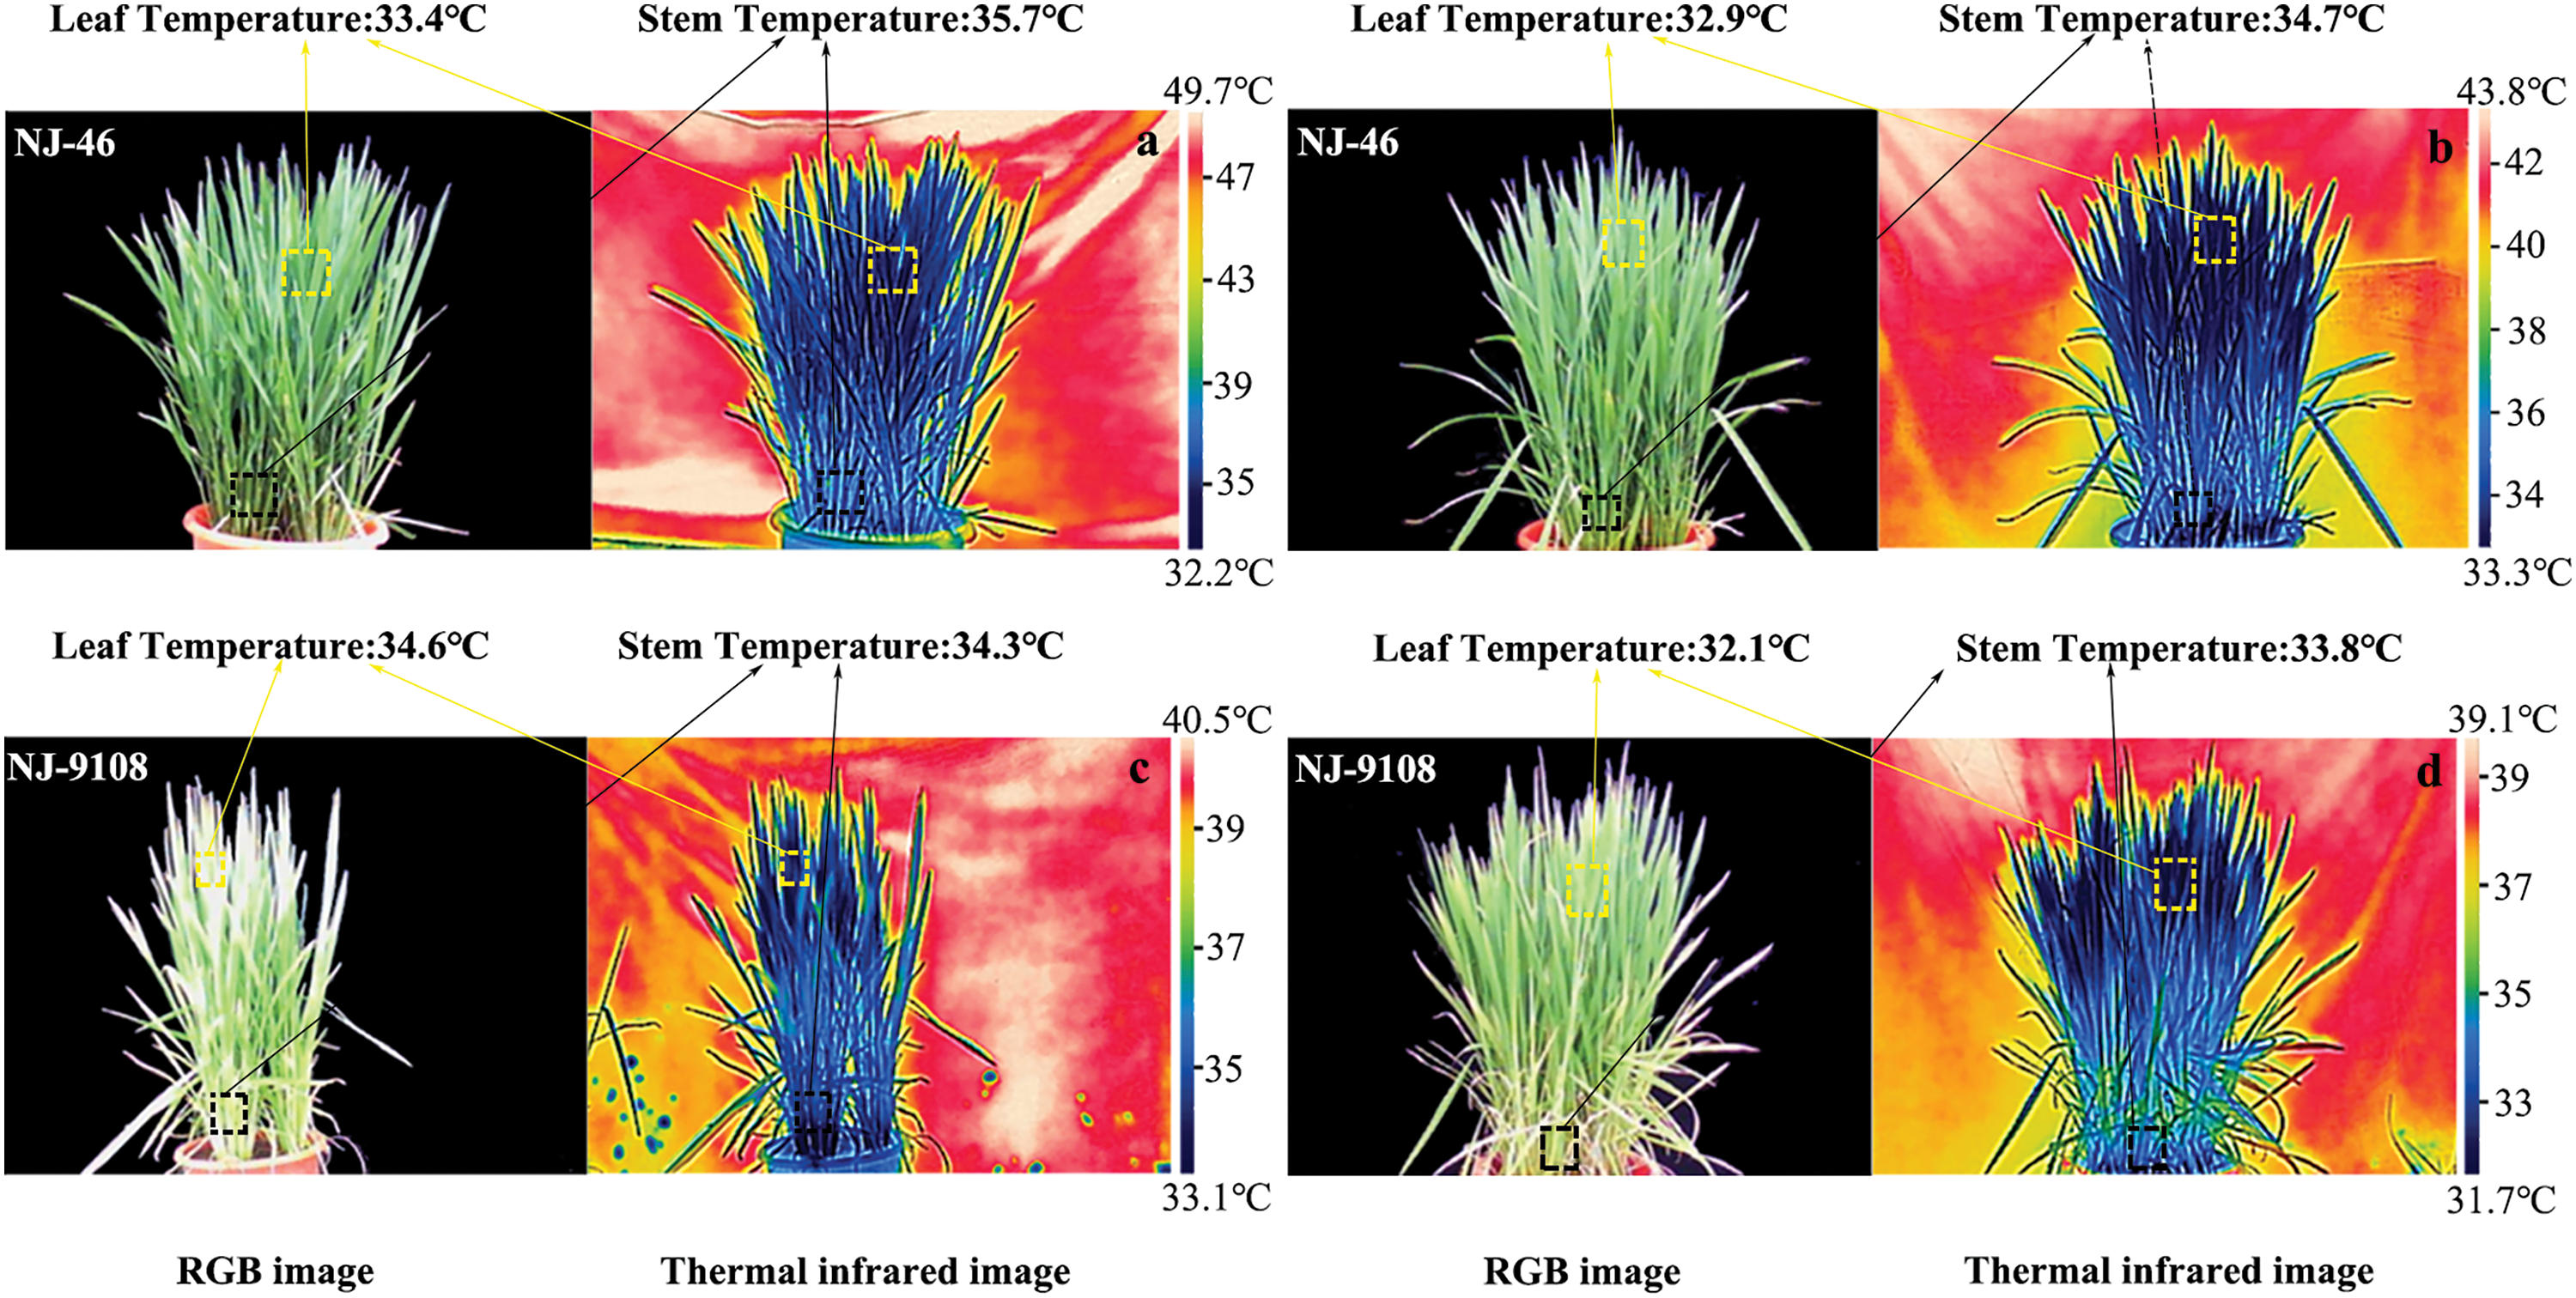
Figure 5: Thermal infrared images of rice based on two planting methods. The thermal and visible images were captured under natural sunlight at 00:30–13:30 in the booting stage. (a, c) Direct-seeded rice and (b, d) Transplanted rice
3.2 Correlation between Organ Temperature Differences and Rice Yield
Under the same planting method, the yields of “NJ-46” and “NJ-9108” decreased under heat stress (Table 4). After the treatment at ambient temperature, the theoretical and actual yields of “NJ-46” under the transplanting mode significantly increased by 20.01% and 16.03% compared with that based on the direct-seeded mode. The theoretical and actual yields of “NJ-9108” significantly increased by 25.02% and 19.33%, respectively. However, after heat stress, the theoretical yield of transplanted rice “NJ-46” and “NJ-9108” significantly decreased by 55.55% and 46.61%, and the actual yield decreased by 29.45% and 33.24%, respectively compared with direct-seeded rice.
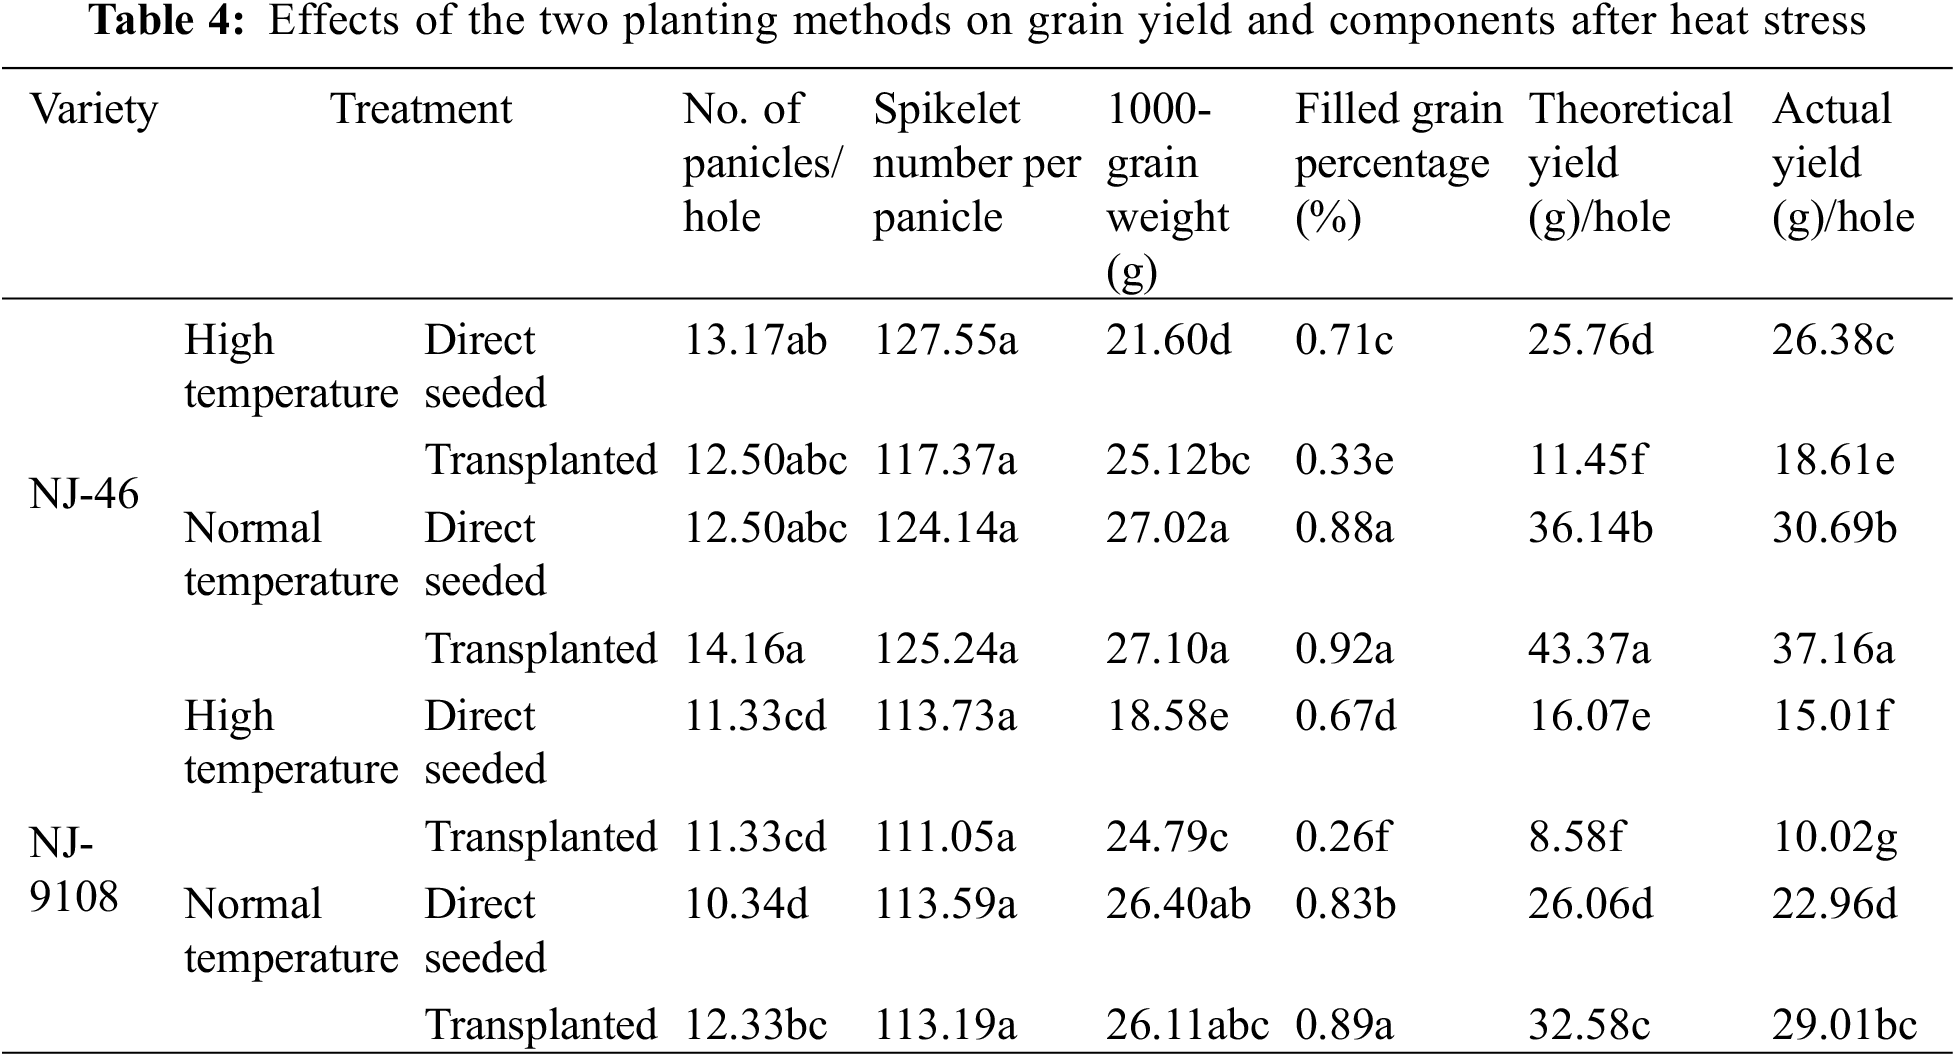
After treatment at ambient temperature, there was no significant difference in seed setting rates between “NJ-46” and “NJ-9108” transplanted and direct-seeded rice (p > 0.05). After heat stress, the seed setting rate of transplanted rice was 53.52% and 61.19% significantly lower than that of direct-seeded rice, respectively (p < 0.05). After treatment at ambient temperature, the 1000-grain weight between transplanted and direct-seeded rice in “NJ-46” and “NJ-9108” insignificantly differed (p > 0.05). After heat stress, the 1000-grain weight of transplanted rice was 16.30% and 33.42% significantly higher than that of direct-seeded rice, respectively (p < 0.05). High temperature stress led to a significantly lower seed setting rate and 1000-grain weight of transplanted rice than direct-seeded rice (p < 0.05).
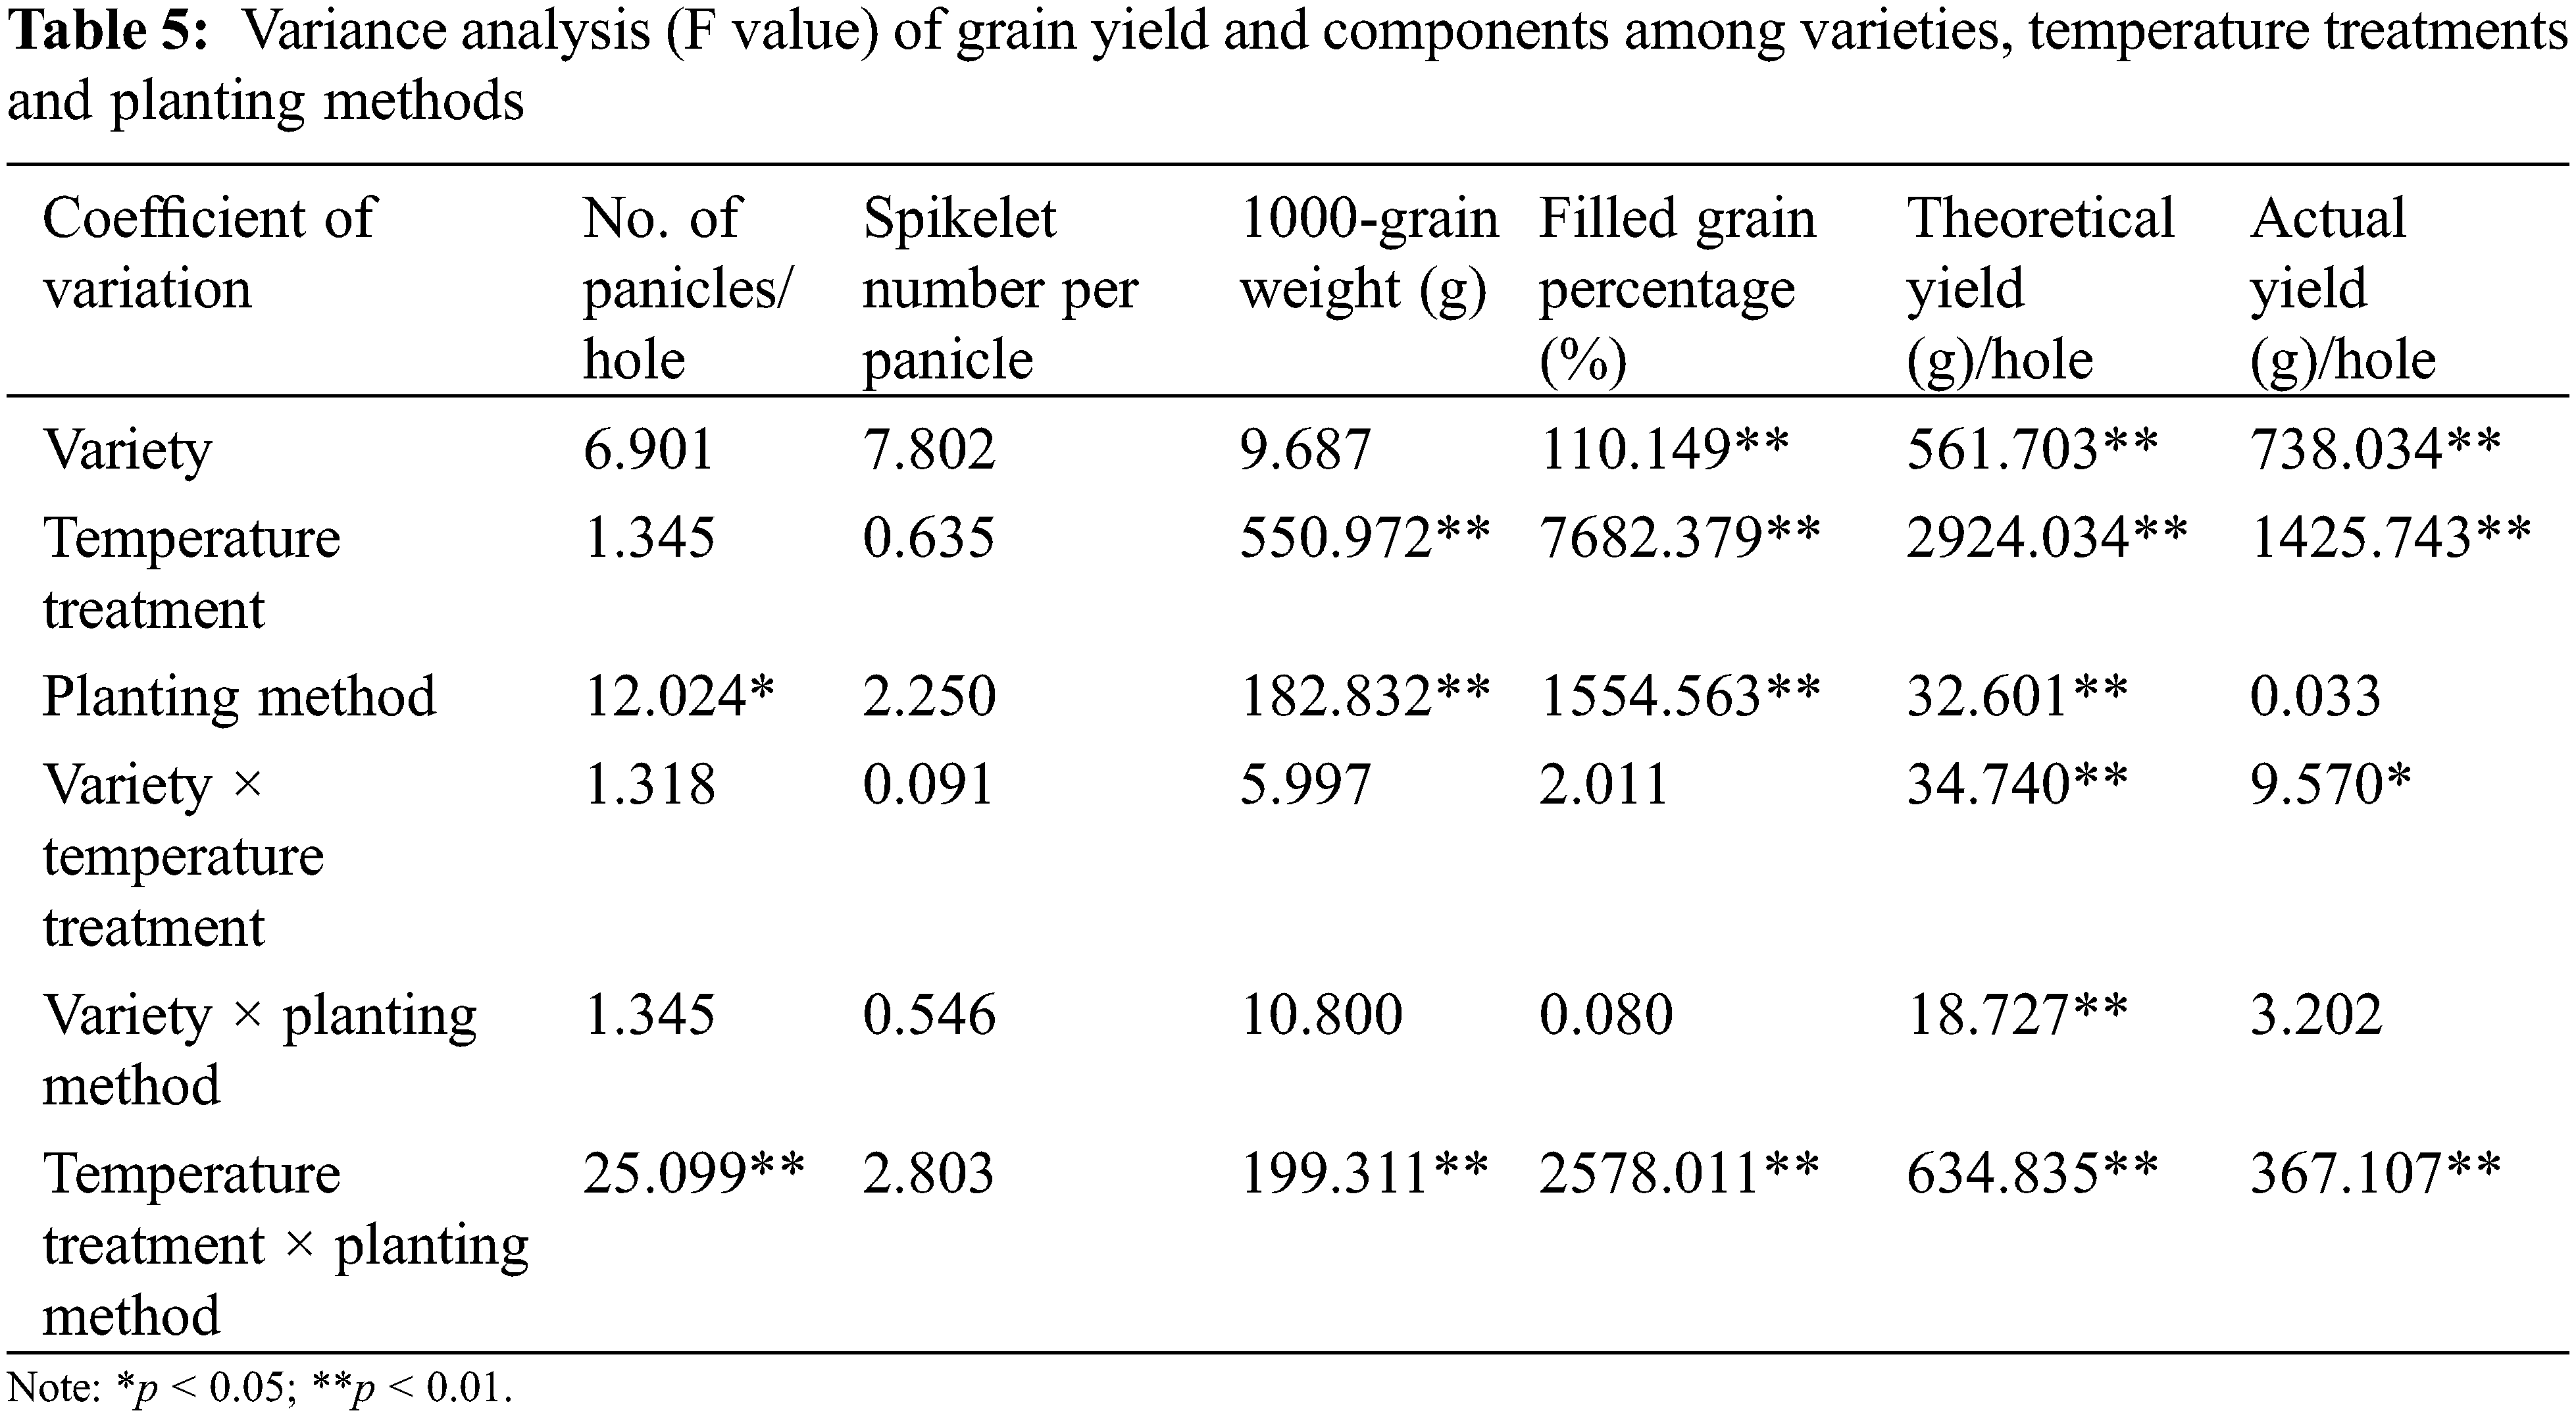
Analysis of variance (Table 5) showed that variety × temperature treatment had significant effects on theoretical yield and actual yield (p < 0.05). In the interaction effect of variety × temperature treatment, the effect caused by temperature treatment (p < 0.05) was higher than that caused by variety (p < 0.05). The variety × planting method had significant effects on theoretical yield (p < 0.05). The effect of variety on theoretical yield was higher than that of planting method (p < 0.01). The temperature treatment × planting method had significant effects on no. of panicles, 1000-grain weight, filled grain percentage, theoretical yield and actual yield (p < 0.01). The effect of planting method on no. of panicles was higher than that of temperature treatment (p < 0.01), and the effect of temperature treatment on 1000-grain weight, filled grain percentage, theoretical yield and actual yield was higher than that of planting method (p < 0.01).
In the seven main growth stages, a significant negative correlation was observed between ΔTl and actual yield (p < 0.05), ΔTs was significantly negatively correlated with seed setting rate (p < 0.05), theoretical and actual yields, ΔTs and ΔTp were less correlated with seed setting rate, theoretical and actual yields (p > 0.05). A significant negative correlation was observed between ΔTl, ΔTs, ΔTp, ΔTc and 1000-grain weight, seed setting rate, theoretical and actual yields, respectively, at milk ripening stage (p < 0.05). Therefore, the milk stage was found to be the best stage to observe the rice organ and canopy temperatures, where the correlation coefficient between organ and canopy temperatures, yield and its components was found to be the highest (Table 6).
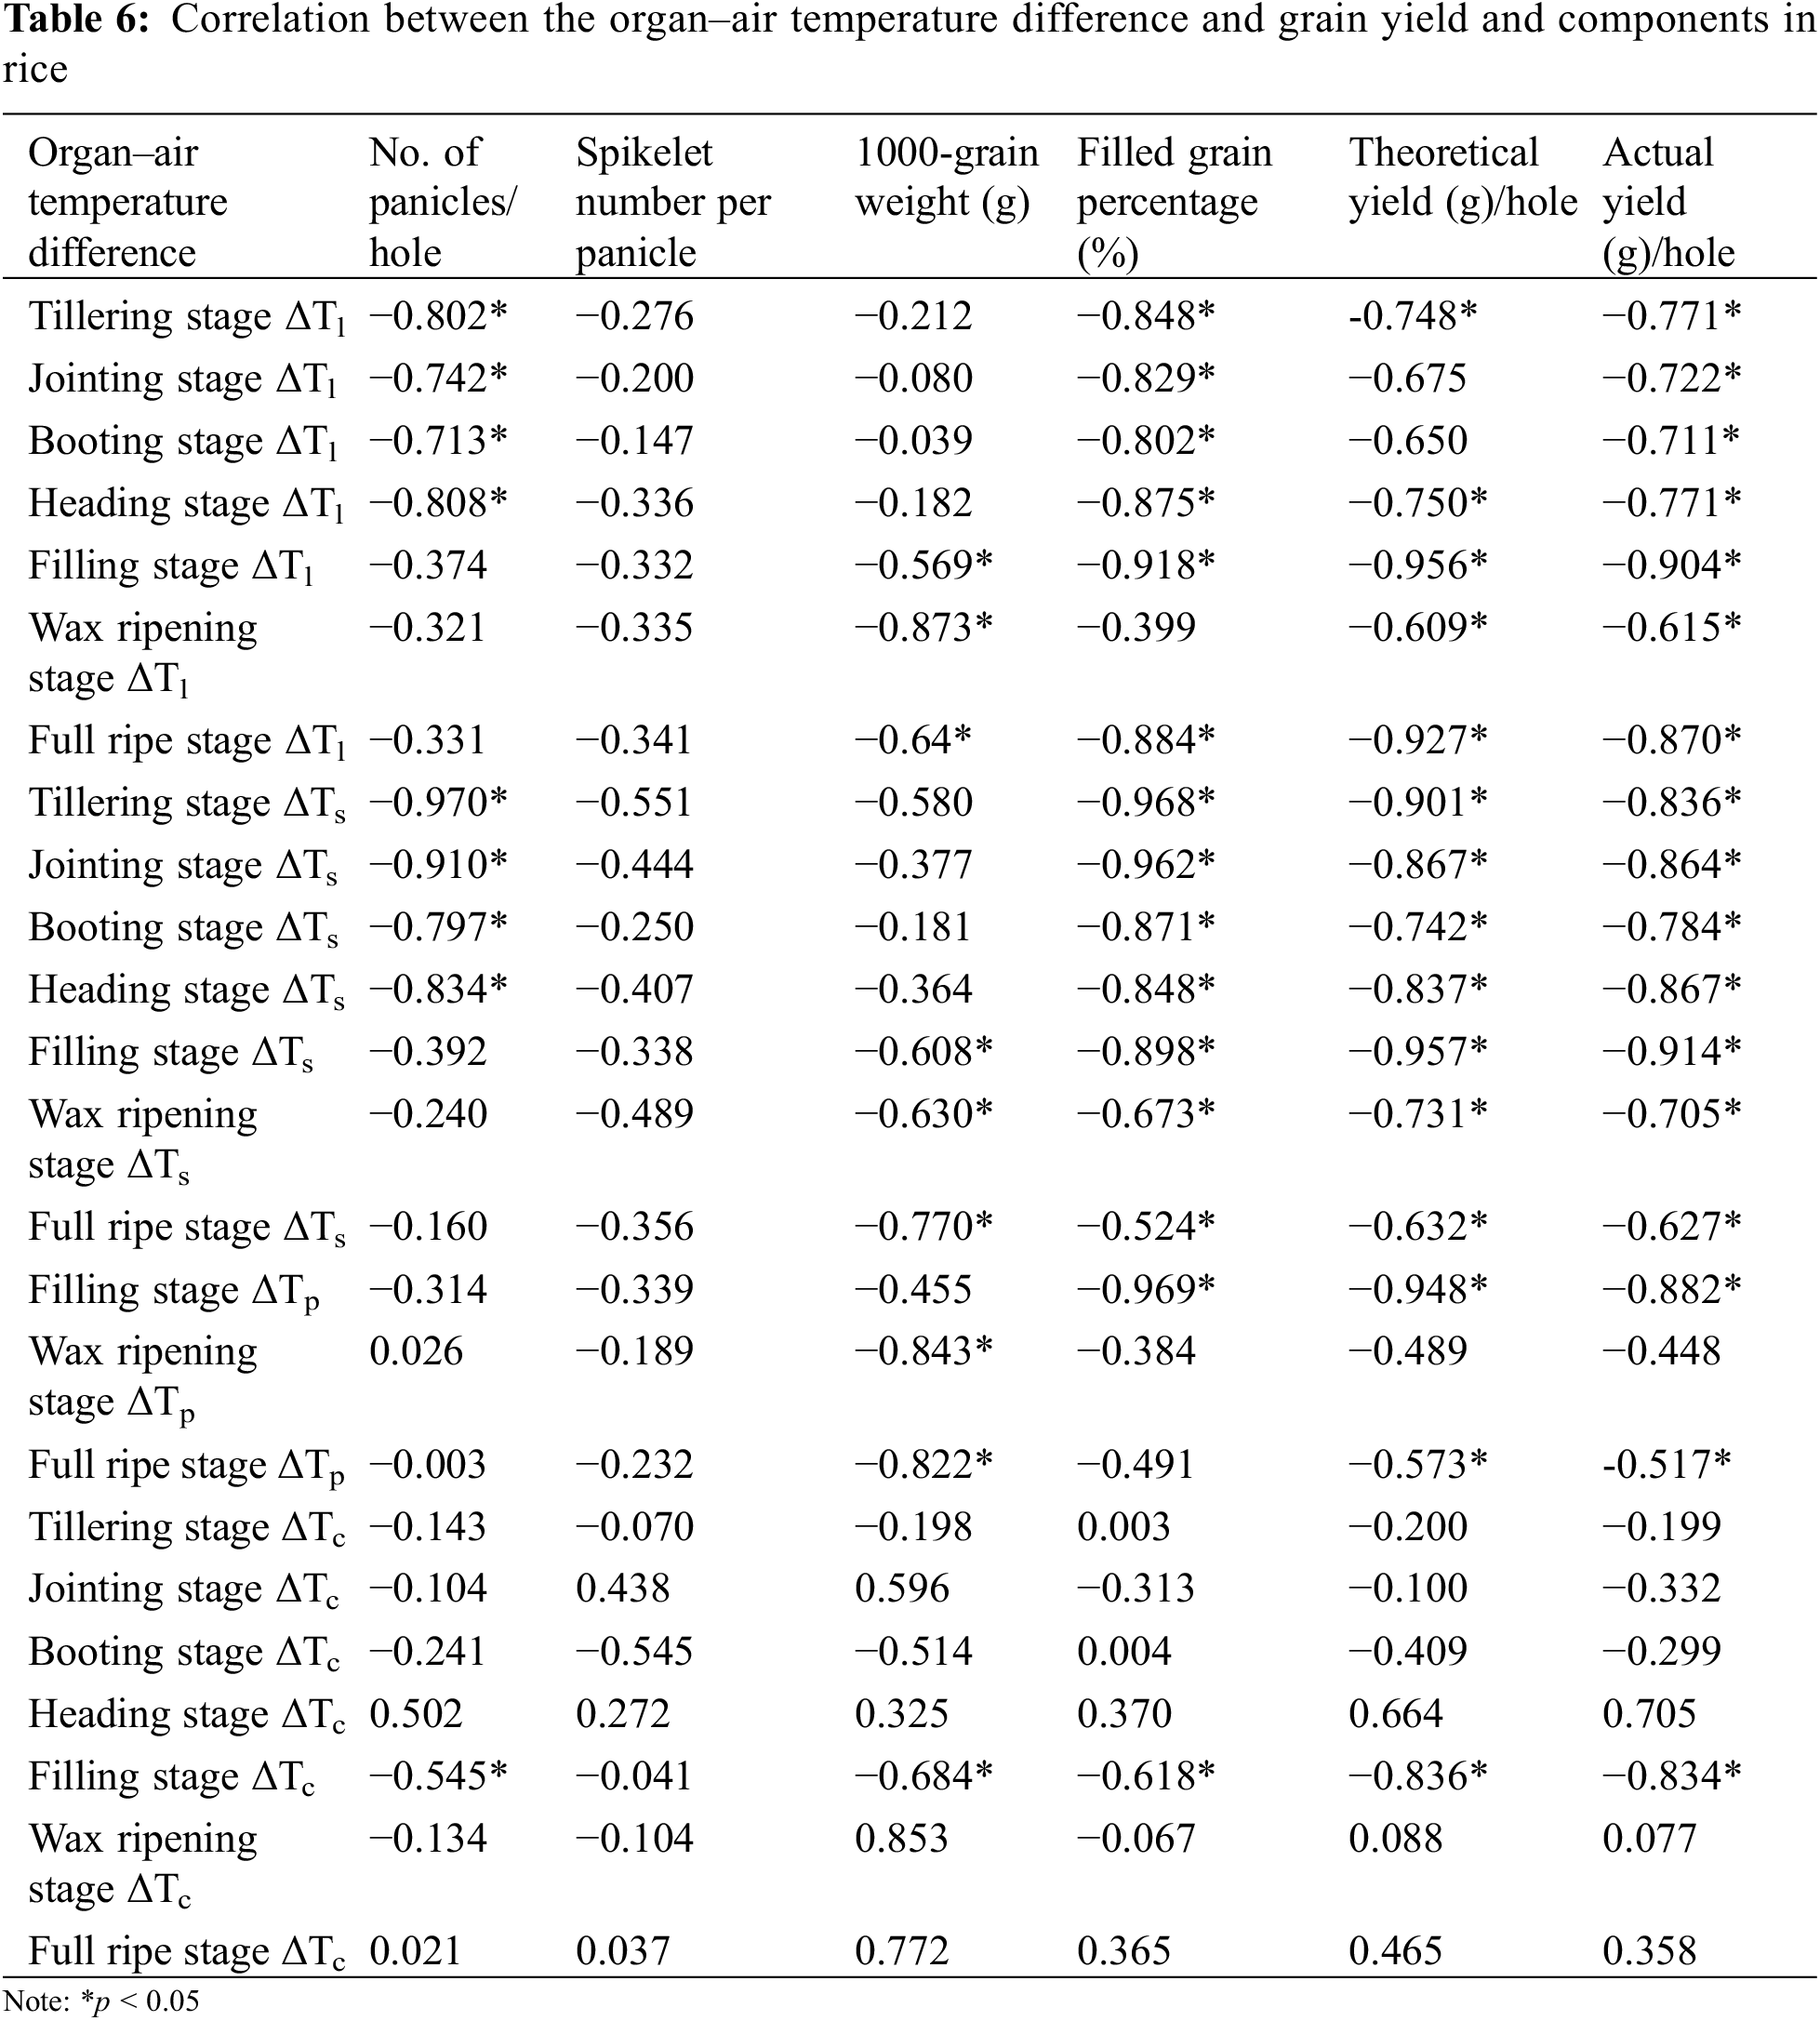
Among them, the correlation coefficient between ΔTs and theoretical and actual yields were the highest, the relationship between theoretical yield (Y) and ΔTs (X) was Y = −5.6965X + 27.778, R2 = 0.9155, the relationship between actual yield (Y) and ΔTs (X) was Y = −3.935X + 25.647, R2 = 0.8357, both of them showed a significant negative correlation (Fig. 6). The correlation coefficient between ΔTc and theoretical and actual yields was the lowest (R2 = 0.6986 and 0.6963, respectively).
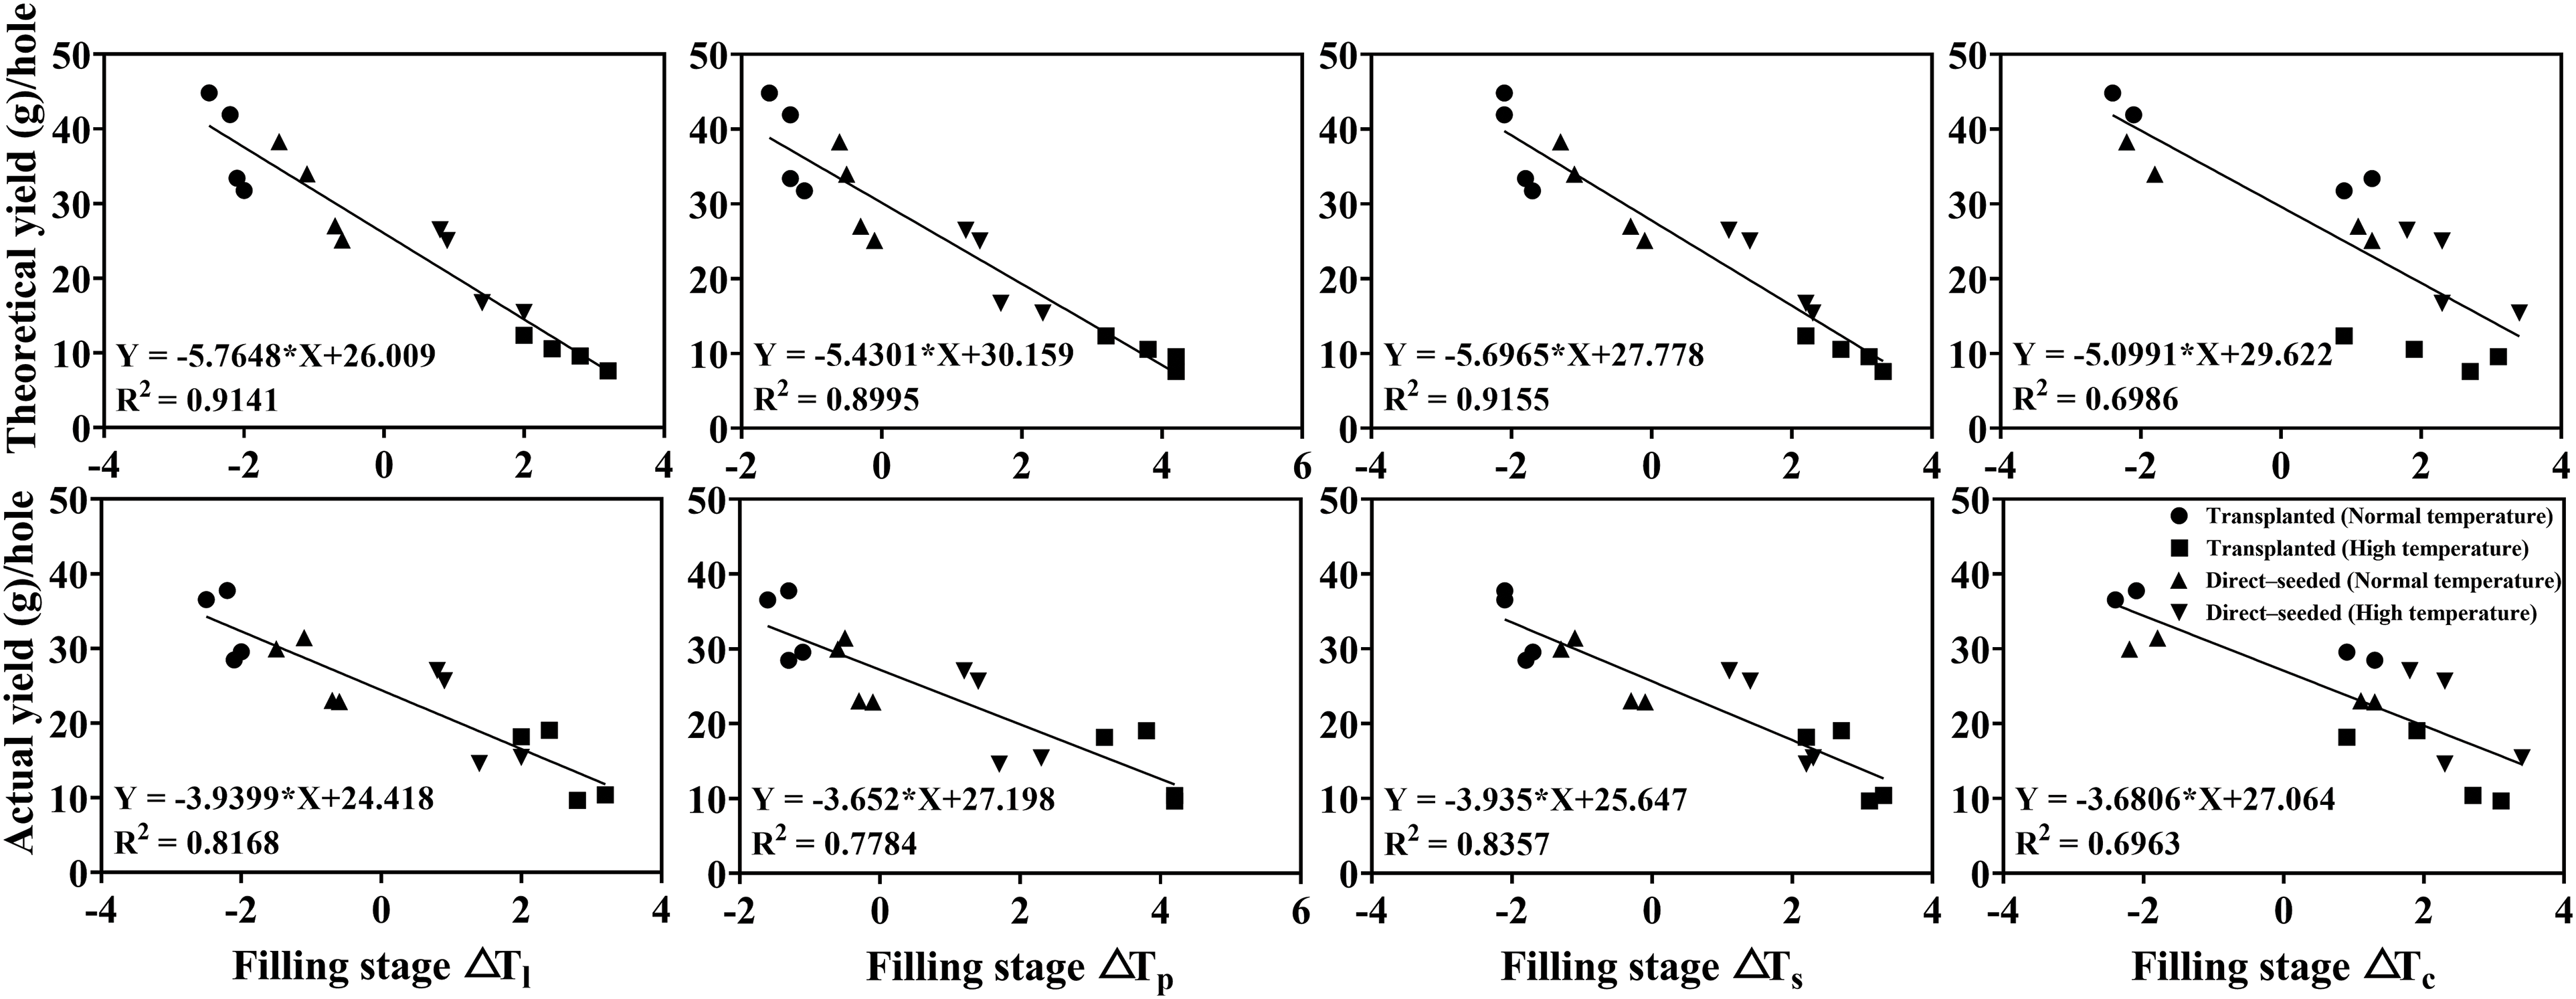
Figure 6: Correlation between yield, its constituent factors and rice organ–air temperature differences at the milk stage
3.3 Correlation between the Organ Temperature and Biological Characters in Rice during the Milk Stage
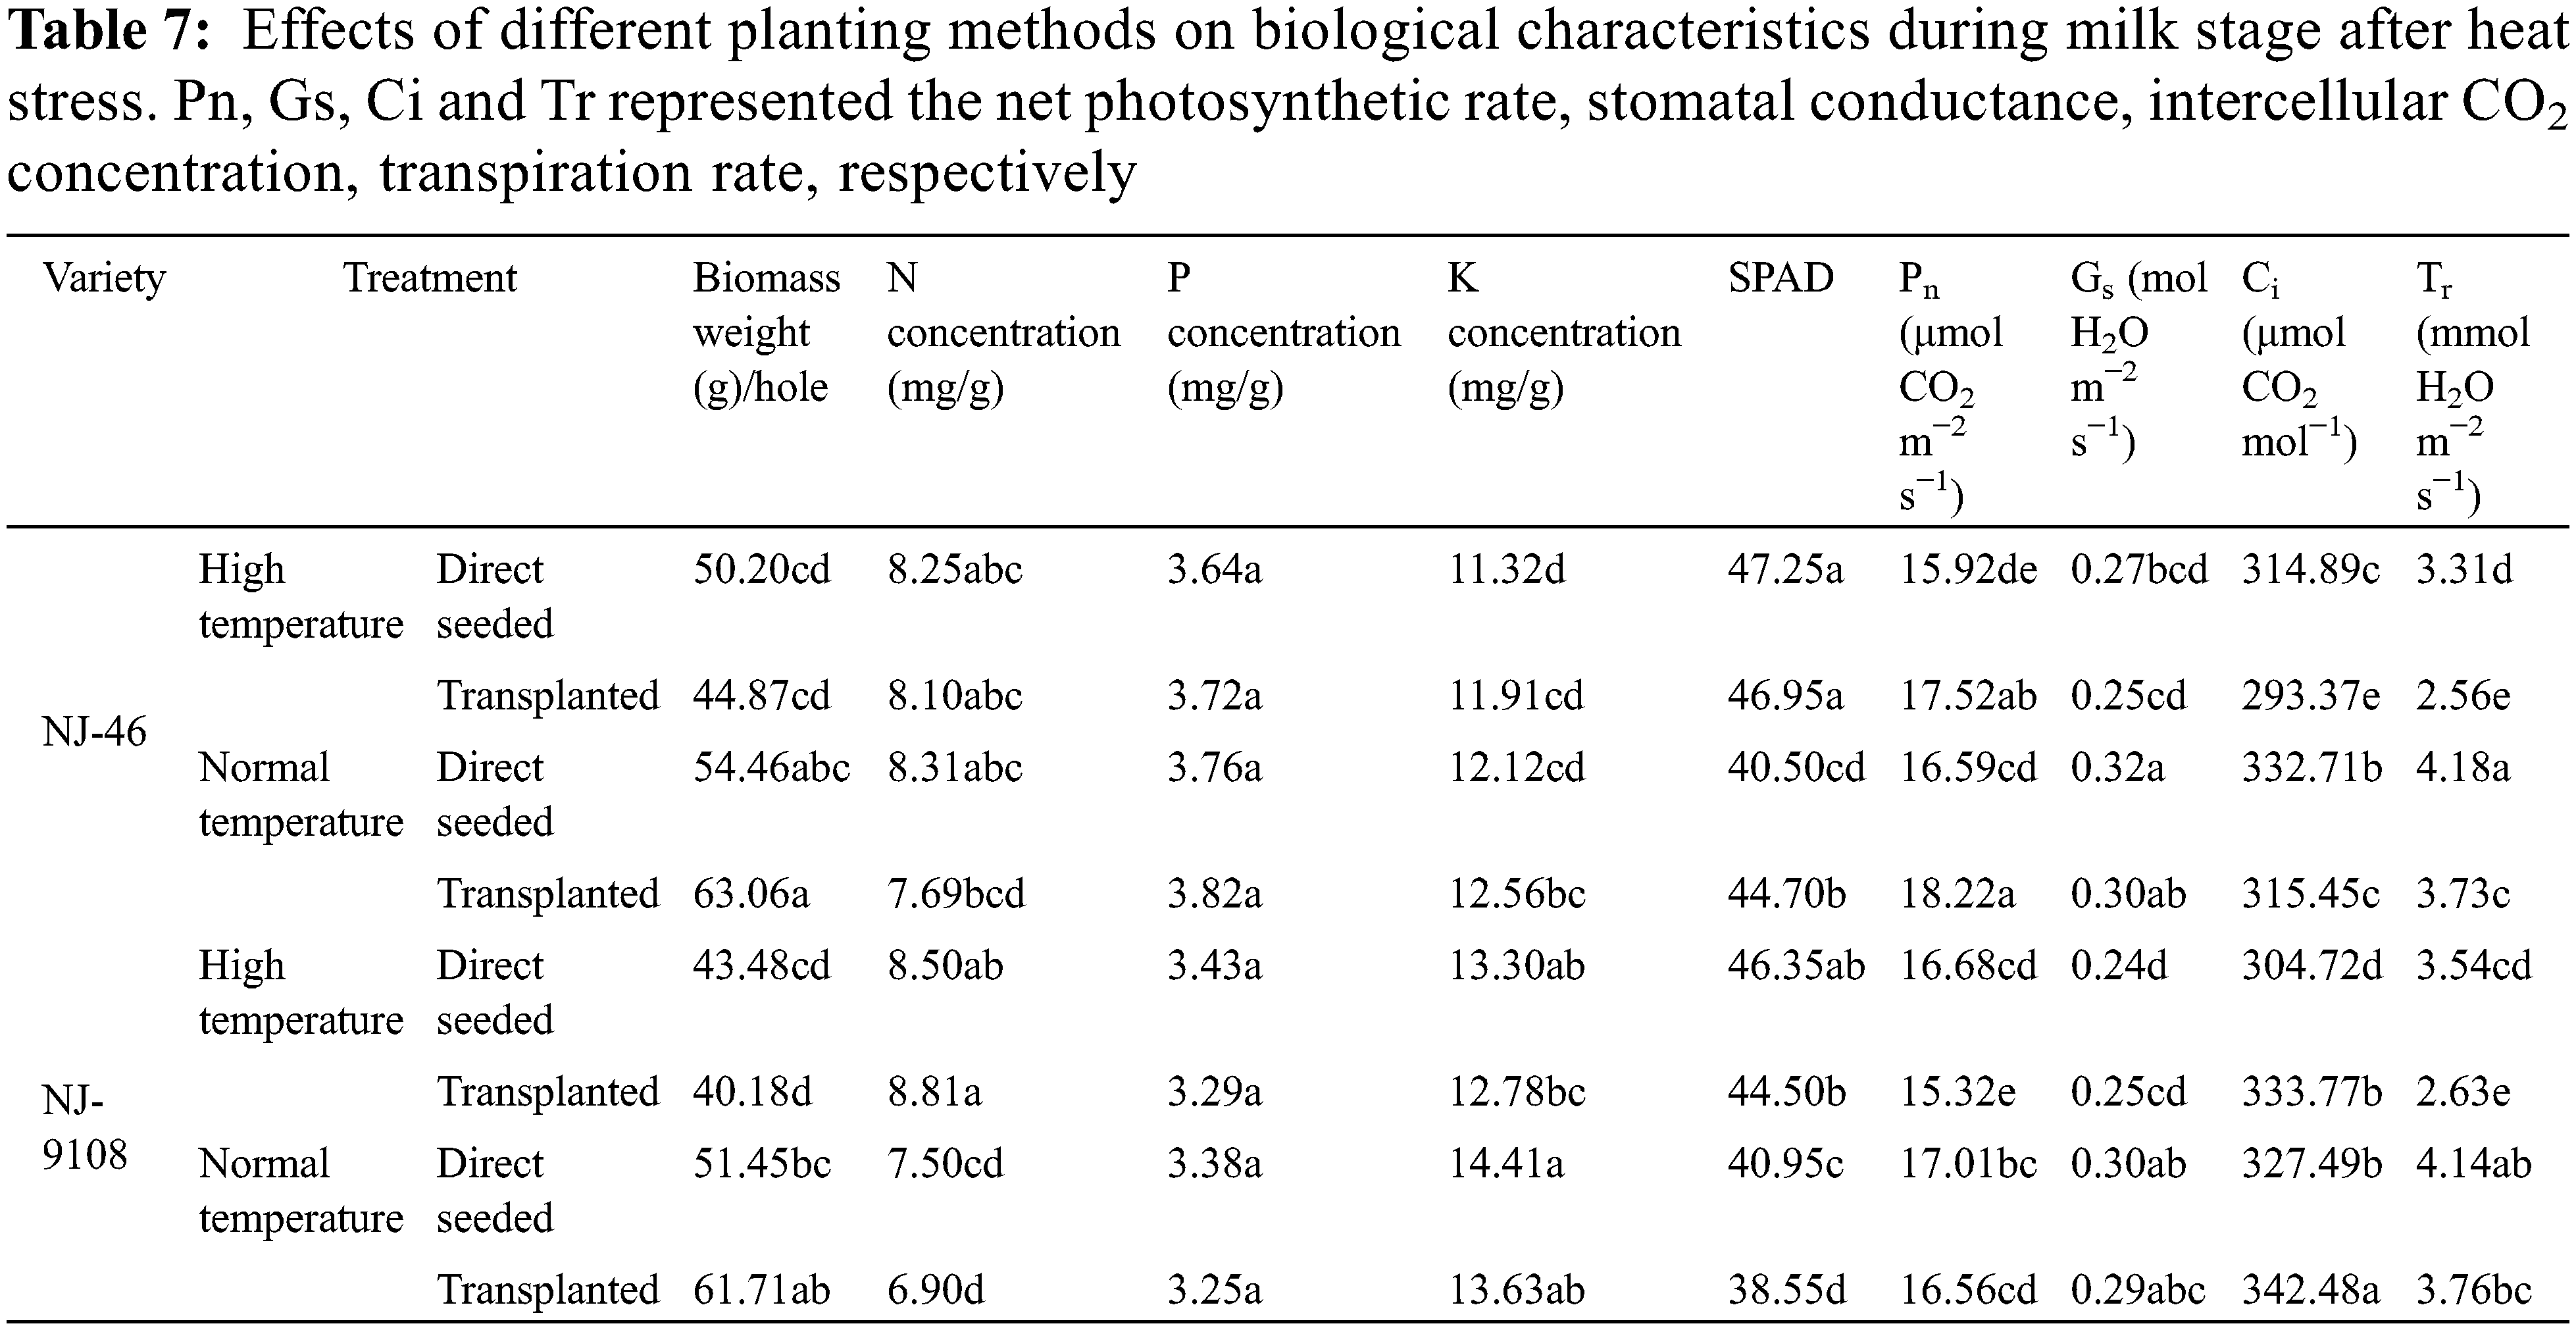
Under different planting methods, there were significant differences in the above−ground dry matter weight, N concentration, K concentration, SPAD, Pn, Gs, Ci and Tr of rice during milk stage (p < 0.05). Different planting methods had no significant effect on P concentration (p > 0.05) (Table 7).
Among the biological indicators of rice, ΔTl, ΔTs, ΔTp and ΔTc were significantly negatively correlated with above−ground dry matter weight (p < 0.05). The coefficient of ΔTs was the largest, which was −0.931, and the coefficient of ΔTc was the smallest, which was −0.668. ΔTl, ΔTs, ΔTp and ΔTc were positively correlated with N concentration and SPAD, respectively. The correlation coefficient of ΔTs reached the highest (0.714 and 0.699), respectively, and the correlation coefficient of ΔTc reached the lowest (0.299 and 0.512), respectively. The correlation coefficients between organ and canopy temperature and P and K concentration were not found to be significant (p > 0.05). In addition, SPAD and N concentration were significantly positively correlated (p < 0.05). ΔTs could better reflect the growth characteristics of rice than ΔTc (Fig. 7).
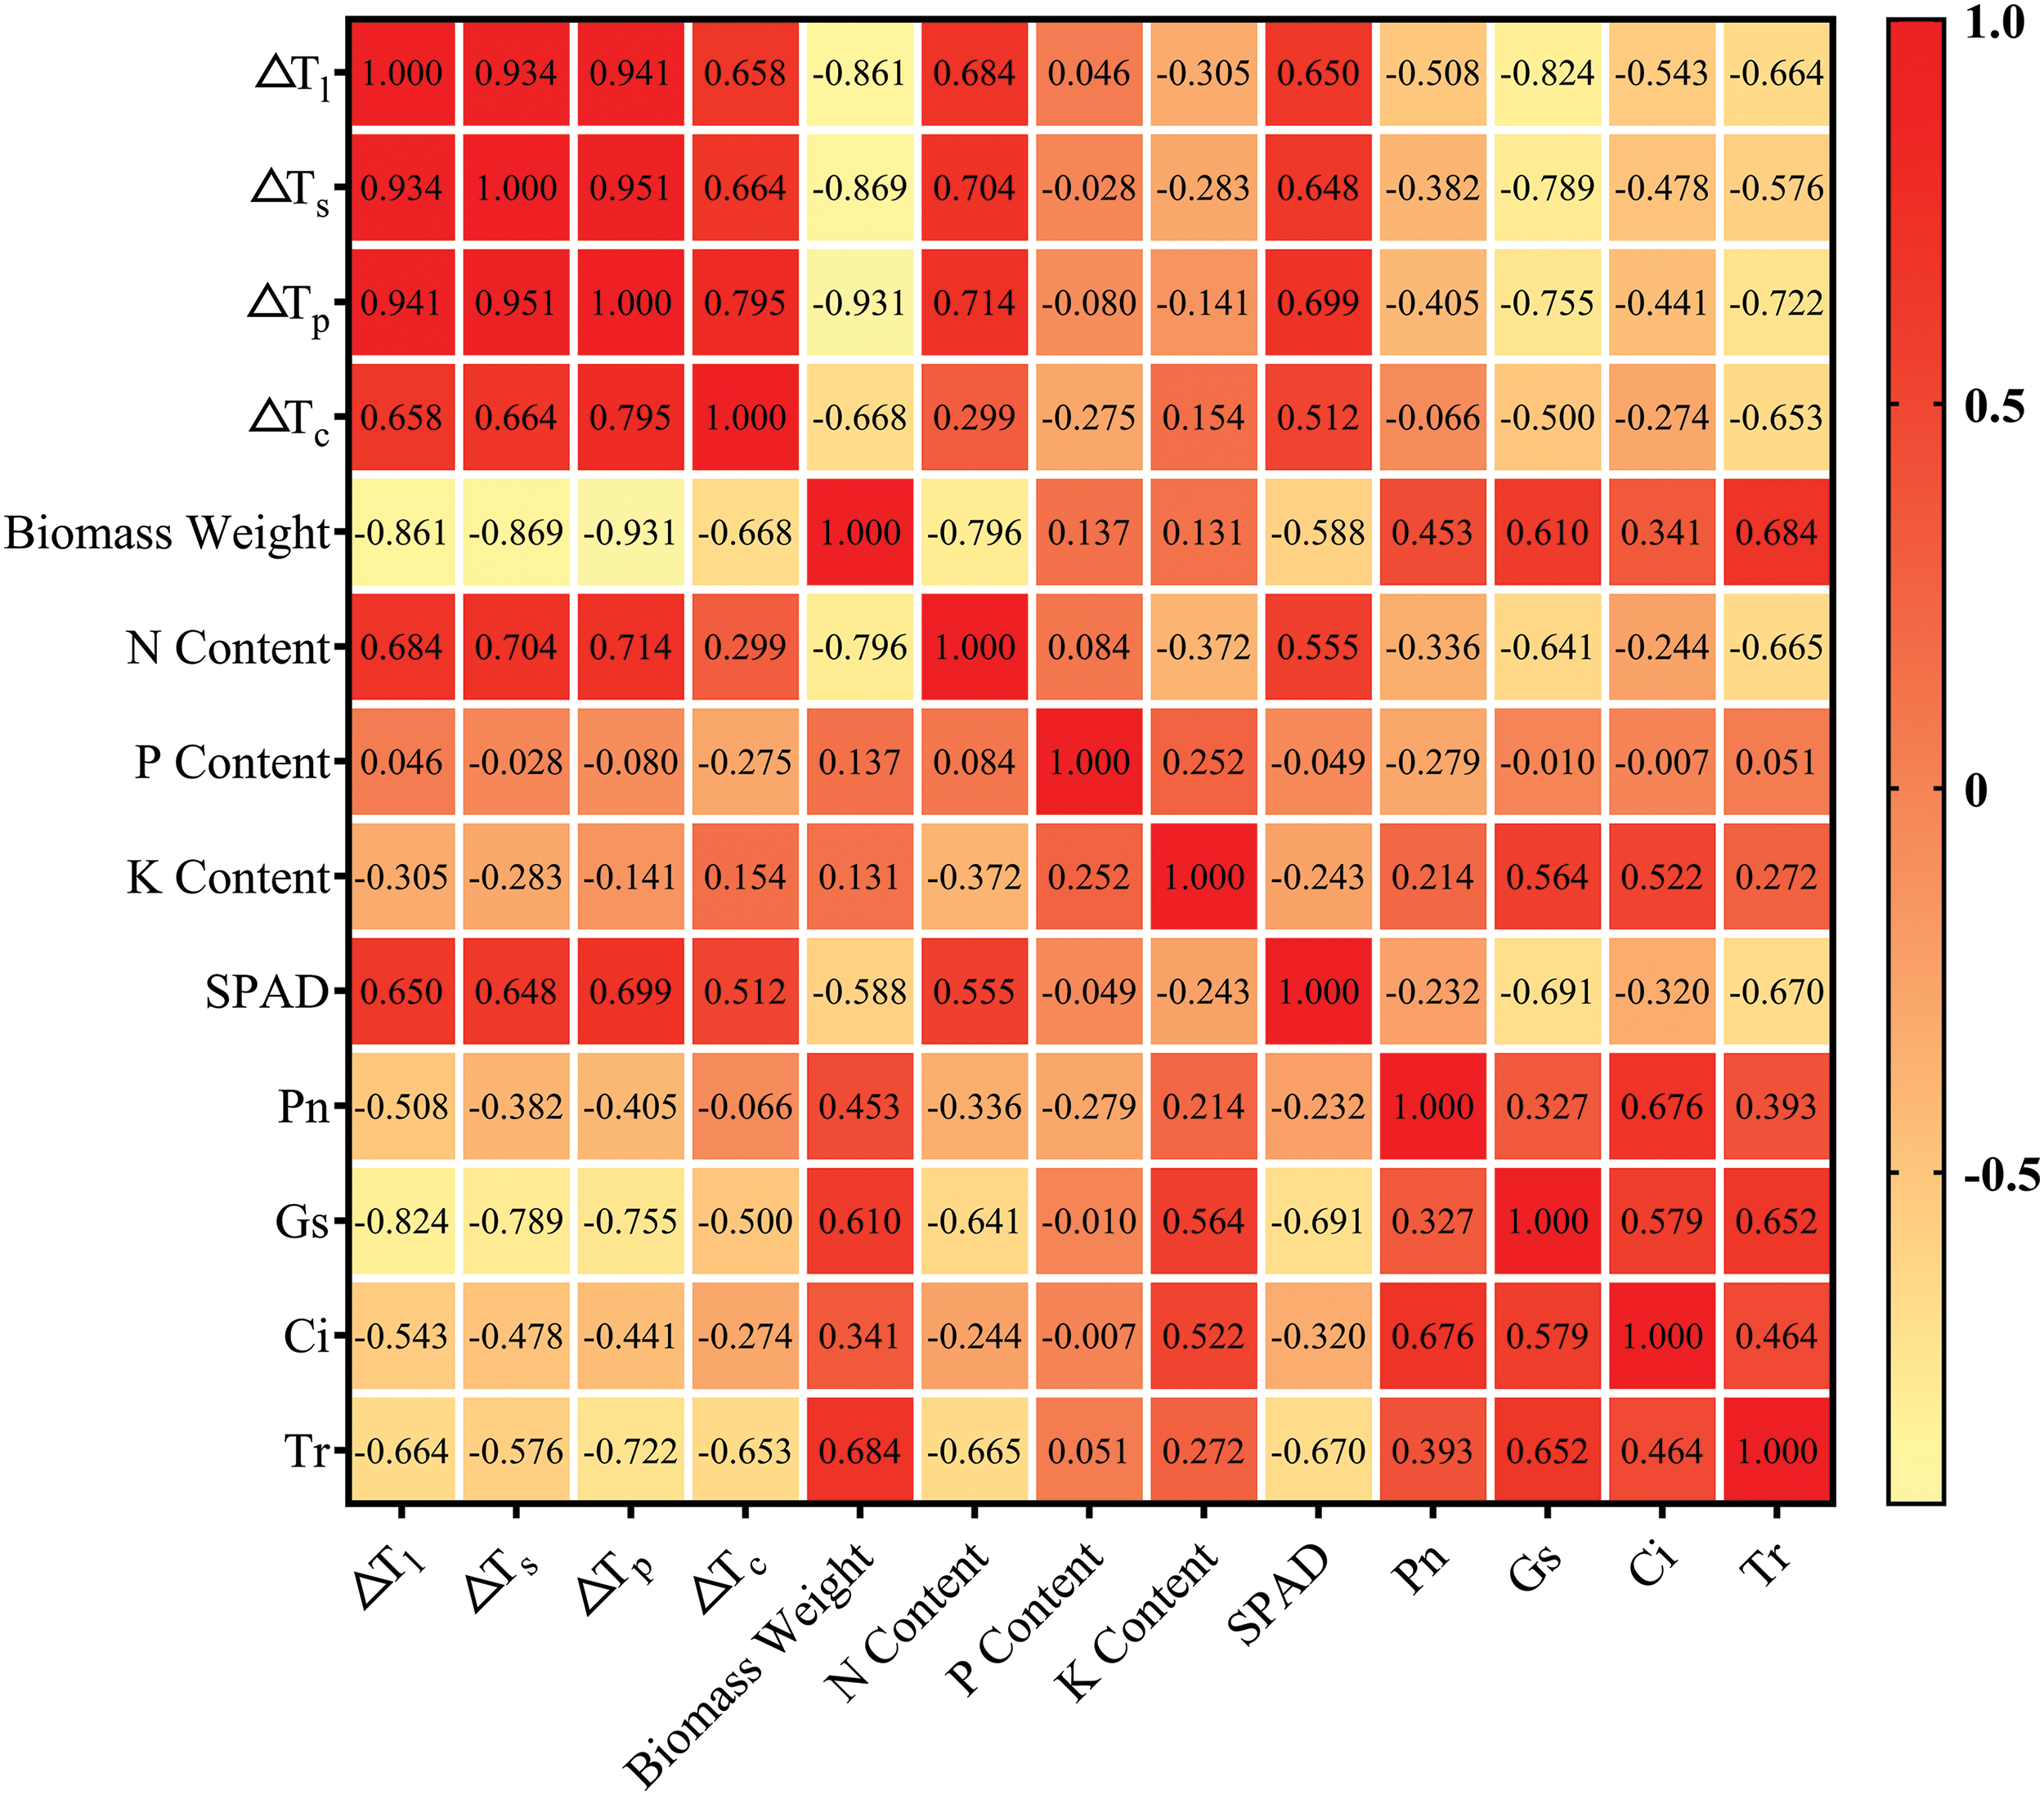
Figure 7: Correlation heat map between biological characters and rice organ–air temperature differences during the milk stage
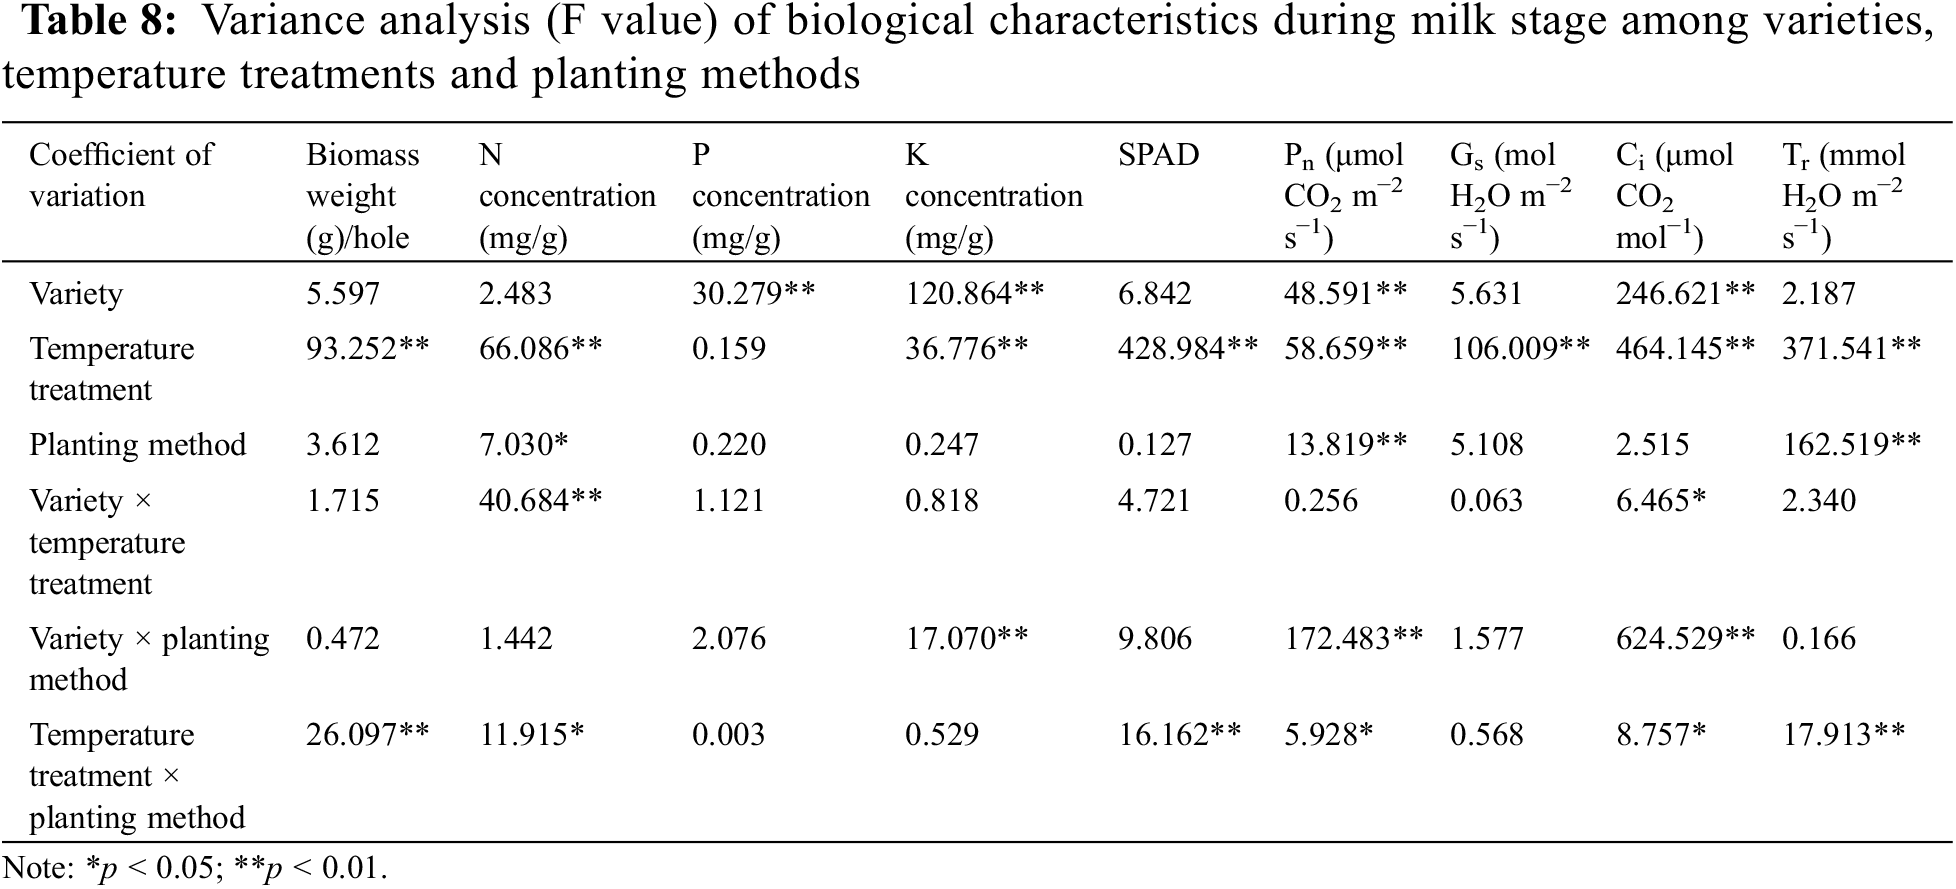
Analysis of variance (Table 8) showed that variety × temperature treatment had significant effects on N concentration and Ci (p < 0.05). In the interaction effect of variety × temperature treatment, the effect caused by temperature treatment (p < 0.05) was higher than that caused by variety (p < 0.05). The variety × planting method had significant effects on K concentration, Pn and Ci (p < 0.01). The effect of variety on K concentration, Pn and Ci was higher than that of planting method (p < 0.01). The temperature treatment × planting method had significant effects on biomass weight, N concentration, SPAD, Pn, Ci and Tr (p < 0.05). The effect of temperature treatment on biomass weight, N concentration, SPAD, Pn, Ci and Tr was higher than that of planting method (p < 0.05).
Among the physiological indexes, Pn, Gs, Ci and Tr were negatively correlated with organ and canopy temperatures (p < 0.05), and ΔTl showed the highest correlation coefficient with Pn, Gs and Ci (p < 0.05), which were −0.508, −0.824 and −0.543, respectively. The correlation coefficient between ΔTs and Tr was the highest, which was −0.722. The correlation coefficients between ΔTc and Pn, Gs, Ci and Tr were the lowest, which were −0.066, −0.500, −0.274 and −0.653, respectively. In addition, the correlation coefficients of ΔTl and ΔTs, ΔTp and ΔTc were 0.934, 0.941 and 0.658, respectively, showing significant positive correlation (p < 0.05) (Fig. 7). Compared with ΔTc, ΔTl and ΔTs could reflect the physiological characteristics of rice better.
4.1 Effects of Different Planting Methods on Rice Organ and Canopy Temperature
The results of continuous 24 h thermal infrared monitoring showed that the canopy temperature differences was the most significant at 13:00, which was the best observation time. The environment of rice, such as temperature, light, water and wind speed, has affected its surface temperature [17]. Several researchers reported diurnal variations of the canopy and ambient temperatures of rice variety NJ-9108 under sunny conditions, the canopy temperature of rice variety NJ-9108 was lower and higher than the ambient temperature in the daytime and at night, respectively [44]. Zheng et al. continuously observed the diurnal variation of the canopy temperature and reported that the canopy temperature of rice was close to the maximum at 1 pm and thus the time period from 11 am to 3 pm was ideal for the identification of a potential water deficit of rice with the thermal imager [18]. Gao et al. suggested that the best period to analyze the effect of water stress on rice based on the canopy temperature was 1–3 pm [45]. The results of this study were similar to those of previous studies. At the highest temperature time of the day, the light intensity and air temperature were high. At this time, the physiological and biochemical reactions of the rice population were strong [46].
Rice canopy and organ temperatures is not only determined by ambient factors, but is also reflected by its own characteristic. Researchers have found differences in the temperature of different organs of rice, Fu et al. showed that the temperatures of superior rice spikelets were significantly higher than those of inferior ones regardless of the natural conditions or heat stress [23]. Zhang et al. applied moderate heat stress to N22 and GT937 at 40°C; the panicle temperature was 38°C and the flag leaf temperature was ~34°C [25]. We excluded the effect of the atmospheric temperature on the temperature of the rice organs and obtained the following conclusions. Under the same planting method, there were significant temperature differences between the rice canopy and various organs, and different planting methods could affect the growth of rice and cause changes in the temperature of the rice canopy and organs.
4.2 Correlation between the Rice Canopy and Organ Temperatures and Grain Yield
The Pearson correlation coefficients between the ΔTl, ΔTs, ΔTp, and ΔTc, and the seed setting rate, theoretical yield, and actual yield were the highest during the milk stage. The seed setting rate, theoretical yield, and actual yield significantly increased with a decrease in the organ–air temperature differences during the milk stage. The correlations between ΔTs and 1000-grain weight, theoretical yield, and actual yield were higher than ΔTl, ΔTp and ΔTc. Compared with ΔTc and ΔTs could be used as a more convenient and accurate index to reflect rice growth and predict rice yield. Several researchers also reported that an elevated canopy temperature has adverse effects on the grain yield. For example, Fu et al. subjected two rice plants to different heat tolerances to heat stress at 40°C at anthesis. The results showed that the fertility and kernel weight of superior and inferior spikelets decreased as the number of panicles per plant decreased under heat stress, accompanied by significantly increasing canopy temperatures [23]. Yan et al. conducted water stress treatments for seven days after the heading stage of rice. Under severe water stress, the canopy temperature of rice significantly increased, whereas the 1000-grain weight, seed setting rate, and yield decreased [22]. Based on the results of the above–mentioned studies and the data obtained in this study, the grain yield decreased with the increasing canopy and organ temperatures. However, the influence of different planting methods on the canopy and organs of rice was comprehensive, and it was necessary to further isolate the main factors affecting the temperature difference of rice stems.
4.3 Effect of Rice Biological Characteristics on Organ and Canopy Temperature
Rice canopy and organ temperatures are closely related to plant morphological structure, physiological and metabolic characteristics and organ structural characteristics [1,47]. Therefore, we further studied the external characters such as above-ground dry matter accumulation, SPAD, N, K and P concentrations, and the internal mechanism of photosynthesis and transpiration of flag leaves during milk stage. In this study, it was found that canopy and organ temperatures were significantly negatively correlated with dry matter accumulation, and canopy and organ temperatures were positively correlated with SPAD and N concentration, respectively. The correlation between ΔTs and dry matter accumulation, SPAD and N concentration was higher than that of ΔTl, ΔTp and ΔTc. This indicated that canopy temperature had a great influence on nitrogen fertilizer [46] and rice dry matter accumulation [18,48], and the stem temperature differences could better reflect the growth characteristics of rice among different organ temperatures. The growth and development of rice population affected canopy and organ temperature. Appropriate planting density [49] can effectively improve the ventilation and light transmittance of paddy fields and maintain a relatively stable canopy microclimate [50].
This is because plant surface temperature changes are affected by environmental temperature changes [51]. It was found that Pn, Gs, Ci and Tr were negatively correlated with canopy and organ temperature, respectively. Compared with ΔTs, ΔTp and ΔTc, ΔTl had higher correlation coefficient with Pn, Gs and Ci, respectively. The correlation coefficient between ΔTs and Tr was higher than ΔTl, ΔTp and ΔTc, respectively. Canopy temperature affects the physiological and biochemical processes in rice plants. Plant surface temperature also affects leaf function, chlorophyll content, transpiration rate, photosynthetic capacity [52]. When the ambient temperature increased, the temperature of rice leaves increased, as well as stomatal conductance on rice leaves, thus accelerating the transpiration rate and inhibiting the increase in leaf temperature. Under extreme high temperature stress conditions, water rapidly passed through the leaf vessels, and the canopy temperature of rice was regulated by stomatal transpiration [53]. However, rapid transpiration led to the rapid loss of water in the plant. Simultaneously, stomatal conductance and net photosynthetic rate of rice flag leaves decreased, and the leaf temperature increased [54]. Since ΔTl and ΔTs were significantly positively correlated, when the leaf photosynthetic rate decreased, ΔTs also decreased. In conclusion, stem temperature was more important indicator than canopy temperature. Stem temperature is a better screening index for rice breeding and cultivation management in the future.
This study emphasized the difference of canopy and organ temperatures and the relationship between canopy temperature and growth characteristics of rice under different planting methods. The results showed that the best observation time of the rice canopy temperature was 13:00. There were significant temperature differences between the rice canopy and various organs under the same planting method (p < 0.05). Compared with canopy temperature, the correlation between stem temperature and 1000-grain weight, actual yield, and theoretical yields during the milk stage were superior. Since the growth characteristics of rice were affected by canopy and organ temperatures, we also found that canopy and organ temperatures were significantly negatively correlated with dry matter accumulation during the milk stage (p < 0.05), and significantly positively correlated with nitrogen and SPAD (p < 0.05). The correlation between stem temperature and rice growth characteristics was higher than canopy, leaf and panicle temperature. Leaf internal physiological traits were closely related to leaf and stem temperature, while leaf and stem temperature were significantly positively correlated (p < 0.05). In conclusion, stem temperature was more important indicator than canopy temperature. Stem temperature is a better screening index for rice breeding and cultivation management in the future.
Acknowledgement: We would like to thank Editage (www.editage.cn) for English language editing.
Funding Statement: This study was supported by the National Natural Science Foundation of China (31801310), Category A of the Major Projects of Natural Science Research in Universities of Jiangsu Province (21KJA210001), a project funded by the Priority Academic Program Development of Jiangsu Higher Education Institutions (PAPD).
Author Contributions: The authors confirm contribution to the paper as follows: study conception and design: Ziwei Li, Zhongyang Huo; data collection: Lifen Huang; analysis and interpretation of results: Ziwei Li; draft manuscript preparation: Ziwei Li; funding acquisition: Min Jiang, Zhongyang Huo. All authors have reviewed the results and approved the final version of the manuscript for submission.
Availability of Data and Materials: All relevant data are within the paper.
Conflicts of Interest: The authors declare that they have no conflicts of interest to report regarding the present study.
References
1. Jiang, M., Guo, K., Wang, J., Wu, Y., Shen, X. et al. (2022). Current status and prospects of rice canopy temperature research. Food and Energy Security, 12(2), 1–14. https://doi.org/10.1002/fes3.424 [Google Scholar] [CrossRef]
2. Eyshi Rezaei, E., Webber, H., Gaiser, T., Naab, J., Ewert, F. et al. (2015). Heat stress in cereals: Mechanisms and modelling. European Journal of Agronomy, 64(11), 98–113. https://doi.org/10.1016/j.eja.2014.10.003 [Google Scholar] [CrossRef]
3. Webber, H., Ewert, F., Kimball, B. A., Siebert, S., White, J. W. et al. (2016). Simulating canopy temperature for modelling heat stress in cereals. Environmental Modelling and Software, 77(1), 143–155. https://doi.org/10.1016/j.envsoft.2015.12.003 [Google Scholar] [CrossRef]
4. Melandri, G., Prashar, A., McCouch, S. R., van der Linden, G., Jones, H. G. et al. (2019). Association mapping and genetic dissection of drought-induced canopy temperature differences in rice. Journal of Experimental Botany, 71(4), 1614–1627. https://doi.org/10.1093/jxb/erz527 [Google Scholar] [PubMed] [CrossRef]
5. Tsujimoto, Y., Fuseini, A., Inusah, B. I. Y., Dogbe, W., Yoshimoto, M. et al. (2021). Different effects of water-saving management on canopy microclimate, spikelet sterility, and rice yield in the dry and wet seasons of the sub-humid tropics in Northern Ghana. Field Crops Research, 260(1), 107978. https://doi.org/10.1016/j.fcr.2020.107978 [Google Scholar] [CrossRef]
6. Yang, G., Wang, X., Peng, Y., Rasul, F., Zou, T. et al. (2018). Different micro-climate response of Indica rice population to nitrogen fertilizer. Plant, Soil and Environment, 64(9), 407–412. https://doi.org/10.17221/422/2018-PSE [Google Scholar] [CrossRef]
7. Mon, J., Bronson, K. F., Hunsaker, D. J., Thorp, K. R., White, J. W. et al. (2016). Interactive effects of nitrogen fertilization and irrigation on grain yield, canopy temperature, and nitrogen use efficiency in overhead sprinkler-irrigated durum wheat. Field Crops Research, 191(1), 54–65. https://doi.org/10.1016/j.fcr.2016.02.011 [Google Scholar] [CrossRef]
8. Cai, C., Yin, X., He, S., Jiang, W., Si, C. et al. (2016). Responses of wheat and rice to factorial combinations of ambient and elevated CO2 and temperature in FACE experiments. Global Change Biology, 22(2), 856–874. https://doi.org/10.1111/gcb.13065 [Google Scholar] [PubMed] [CrossRef]
9. Winterhalter, L., Mistele, B., Jampatong, S., Schmidhalter, U. (2011). High throughput phenotyping of canopy water mass and canopy temperature in well-watered and drought stressed tropical maize hybrids in the vegetative stage. European Journal of Agronomy, 35(1), 22–32. https://doi.org/10.1016/j.eja.2011.03.004 [Google Scholar] [CrossRef]
10. Jat, R. K., Meena, V. S., Kumar, M., Jakkula, V. S., Reddy, I. R. et al. (2022). Direct seeded rice : Strategies to improve crop resilience and food security under adverse climatic conditions. Land, 11(3), 382. https://doi.org/10.3390/land11030382 [Google Scholar] [CrossRef]
11. Huband, N. D. S., Monteith, J. L. (1986). Radiative surface temperature and energy balance of a wheat canopy. Boundary-Layer Meteorology, 36(1–2), 107–116. https://doi.org/10.1007/BF00117462 [Google Scholar] [CrossRef]
12. Kim, Y., Still, C. J., Roberts, D. A., Goulden, M. L. (2018). Thermal infrared imaging of conifer leaf temperatures: Comparison to thermocouple measurements and assessment of environmental influences. Agricultural and Forest Meteorology, 248(3), 361–371. https://doi.org/10.1016/j.agrformet.2017.10.010 [Google Scholar] [CrossRef]
13. Still, C., Powell, R., Aubrecht, D., Kim, Y., Helliker, B. et al. (2019). Thermal imaging in plant and ecosystem ecology: Applications and challenges. Ecosphere, 10(6), 1–16. https://doi.org/10.1002/ecs2.2768 [Google Scholar] [CrossRef]
14. Tanner, C. B. (1963). Plant temperatures. Agronomy Journal, 55(2), 210–211. https://doi.org/10.2134/agronj1963.00021962005500020043x [Google Scholar] [CrossRef]
15. Morales, I., Álvaro, J. E., Urrestarazu, M. (2014). Contribution of thermal imaging to fertigation in soilless culture. Journal of Thermal Analysis and Calorimetry, 116(2), 1033–1039. https://doi.org/10.1007/s10973-013-3529-x [Google Scholar] [CrossRef]
16. Takai, T., Yano, M., Yamamoto, T. (2010). Canopy temperature on clear and cloudy days can be used to estimate varietal differences in stomatal conductance in rice. Field Crops Research, 115(2), 165–170. https://doi.org/10.1016/j.fcr.2009.10.019 [Google Scholar] [CrossRef]
17. Yan, C., Ding, Y., Wang, Q., Liu, Z., Li, G. et al. (2010). The impact of relative humidity, genotypes and fertilizer application rates on panicle, leaf temperature, fertility and seed setting of rice. Journal of Agricultural Science, 148(3), 329–339. https://doi.org/10.1017/S0021859610000018 [Google Scholar] [CrossRef]
18. Zheng, E., Zhang, C., Qi, Z., Zhang, Z. (2020). Canopy temperature response to the paddy water content and its relationship with fluorescence parameters and dry biomass. Agricultural Research, 9(4), 599–608. https://doi.org/10.1007/s40003-019-00452-4 [Google Scholar] [CrossRef]
19. Webber, H., Martre, P., Asseng, S., Kimball, B., White, J. et al. (2017). Canopy temperature for simulation of heat stress in irrigated wheat in a semi-arid environment: A multi-model comparison. Field Crops Research, 202, 21–35. https://doi.org/10.1016/j.fcr.2015.10.009 [Google Scholar] [CrossRef]
20. Sathishraj, R., Bheemanahalli, R., Ramachandran, M., Dingkuhn, M., Raveendran, M. et al. (2016). Capturing heat stress induced variability in spikelet sterility using panicle, leaf and air temperature under field conditions. Field Crops Research, 190(11), 10–17. https://doi.org/10.1016/j.fcr.2015.10.012 [Google Scholar] [CrossRef]
21. Garrity, D. P., O’Toole, J. C. (1995). Selection for reproductive stage drought avoidance in rice, using infrared thermometry. Agronomy Journal, 87(4), 773–779. https://doi.org/10.2134/agronj1995.00021962008700040027x [Google Scholar] [CrossRef]
22. Yan, C., Chen, H., Fan, T., Huang, Y., Yu, S. et al. (2012). Rice flag leaf physiology, organ and canopy temperature in response to water stress. Plant Production Science, 15(2), 92–99. https://doi.org/10.1626/pps.15.92 [Google Scholar] [CrossRef]
23. Fu, G., Feng, B., Zhang, C., Yang, Y., Yang, X. et al. (2016). Heat stress is more damaging to superior spikelets than inferiors of rice (Oryza sativa L.) due to their different organ temperatures. Frontiers in Plant Science, 7(16), 1–16. https://doi.org/10.3389/fpls.2016.01637 [Google Scholar] [PubMed] [CrossRef]
24. Sheehy, J. E., Mitchell, P. L., Beerling, D. J., Tsukaguchi, T., Woodward, F. I. (1998). Temperature of rice spikelets: Thermal damage and the concept of a thermal burden. Agronomie, 18(7), 449–460. https://doi.org/10.1051/agro:19980702 [Google Scholar] [CrossRef]
25. Zhang, C. X., Fu, G. F., Yang, X. Q., Yang, Y. J., Zhao, X. et al. (2016). Heat stress effects are stronger on spikelets than on flag leaves in rice due to differences in dissipation capacity. Journal of Agronomy and Crop Science, 202(5), 394–408. https://doi.org/10.1111/jac.12138 [Google Scholar] [CrossRef]
26. Chauhan, B. S., Awan, T. H., Abugho, S. B., Evengelista, G., Sudhir, Y. et al. (2015). Effect of crop establishment methods and weed control treatments on weed management, and rice yield. Field Crops Research, 172, 72–84. https://doi.org/10.1016/j.fcr.2014.12.011 [Google Scholar] [CrossRef]
27. Farooq, M., Siddique, K. H. M., Rehman, H., Aziz, T., Lee, D. J. et al. (2011). Rice direct seeding: Experiences, challenges and opportunities. Soil and Tillage Research, 111(2), 87–98. https://doi.org/10.1016/j.still.2010.10.008 [Google Scholar] [CrossRef]
28. Xu, L., Li, X., Wang, X., Xiong, D., Wang, F. (2019). Comparing the grain yields of direct-seeded and transplanted rice: A meta-analysis. Agronomy, 9(11), 767. https://doi.org/10.3390/agronomy9110767 [Google Scholar] [CrossRef]
29. Hu, L., Du, P., Luo, H. W., Cheng, S. R., Wu, T. Y. et al. (2019). The effect of different cultivation methods on rice growth and development. Applied Ecology and Environmental Research, 17(2), 3867–3875. https://doi.org/10.15666/aeer/1702_38673875 [Google Scholar] [CrossRef]
30. Xu, L., Zhan, X., Yu, T., Nie, L., Huang, J. et al. (2018). Yield performance of direct-seeded, double-season rice using varieties with short growth durations in central China. Field Crops Research, 227, 49–55. https://doi.org/10.1016/j.fcr.2018.08.002 [Google Scholar] [CrossRef]
31. Pathak, H., Sankhyan, S., Dubey, D. S., Bhatia, A., Jain, N. (2013). Dry direct-seeding of rice for mitigating greenhouse gas emission: Field experimentation and simulation. Paddy and Water Environment, 11(1–4), 593–601. https://doi.org/10.1007/s10333-012-0352-0 [Google Scholar] [CrossRef]
32. Liu, S., Zhang, Y., Lin, F., Zhang, L., Zou, J. (2014). Methane and nitrous oxide emissions from direct-seeded and seedling-transplanted rice paddies in Southeast China. Plant and Soil, 374(1–2), 285–297. https://doi.org/10.1007/s11104-013-1878-7 [Google Scholar] [CrossRef]
33. Sengxua, P., Jackson, T., Simali, P., Vial, L. K., Douangboupha, K. et al. (2019). Integrated nutrient-weed management under mechanised dry direct seeding (DDS) is essential for sustained smallholder adoption in rainfed lowland rice (Oryza Sativa L.). Experimental Agriculture, 55(4), 509–525. https://doi.org/10.1017/S0014479718000145 [Google Scholar] [CrossRef]
34. Wang, W., Peng, S., Liu, H., Tao, Y., Huang, J. et al. (2017). The possibility of replacing puddled transplanted flooded rice with dry seeded rice in central China: A review. Field Crops Research, 214, 310–320. https://doi.org/10.1016/j.fcr.2017.09.028 [Google Scholar] [CrossRef]
35. Tao, Y., Chen, Q., Peng, S., Wang, W., Nie, L. (2016). Lower global warming potential and higher yield of wet direct-seeded rice in Central China. Agronomy for Sustainable Development, 36(2), 24. https://doi.org/10.1007/s13593-016-0361-2 [Google Scholar] [CrossRef]
36. Gangwar, K. S., Singh, K. K., Sharma, S. K. (2004). Effect of tillage on growth, yield and nutrient uptake in wheat after rice in the Indo-Gangetic Plains of India. Journal of Agricultural Science, 142(4), 453–459. https://doi.org/10.1017/S0021859604004459 [Google Scholar] [CrossRef]
37. Mai, W., Abliz, B., Xue, X. (2021). Increased number of spikelets per panicle is the main factor in higher yield of transplanted vs. direct-seeded rice. Agronomy, 11(12), 2479. https://doi.org/10.3390/agronomy11122479 [Google Scholar] [CrossRef]
38. Wang, P., Liu, J., Lyu, Y., Huang, Z., Zhang, X. et al. (2022). A review of vector-borne rice viruses. Viruses, 14(10), 2258. https://doi.org/10.3390/v14102258 [Google Scholar] [PubMed] [CrossRef]
39. Wang, H. Q., Dai, W. M., Zhang, Z. X., Li, M. S., Meng, L. C. et al. (2023). Occurrence pattern and morphological polymorphism of Chinese weedy rice. Journal of Integrative Agriculture, 22(1), 149–169. https://doi.org/10.1016/j.jia.2022.08.001 [Google Scholar] [CrossRef]
40. Jagadish, S. V. K., Craufurd, P. Q., Wheeler, T. R. (2007). High temperature stress and spikelet fertility in rice (Oryza sativa L.). Journal of Experimental Botany, 58(7), 1627–1635. https://doi.org/10.1093/jxb/erm003 [Google Scholar] [PubMed] [CrossRef]
41. Shi, P., Zhu, Y., Tang, L., Chen, J., Sun, T. et al. (2016). Differential effects of temperature and duration of heat stress during anthesis and grain filling stages in rice. Environmental and Experimental Botany, 132, 28–41. https://doi.org/10.1016/j.envexpbot.2016.08.006 [Google Scholar] [CrossRef]
42. Shi, P., Tang, L., Lin, C., Liu, L., Wang, H. et al. (2015). Modeling the effects of post-anthesis heat stress on rice phenology. Field Crops Research, 177, 26–36. https://doi.org/10.1016/j.fcr.2015.02.023 [Google Scholar] [CrossRef]
43. Jones, H. G., Serraj, R., Loveys, B. R., Xiong, L., Wheaton, A. et al. (2009). Thermal infrared imaging of crop canopies for the remote diagnosis and quantification of plant responses to water stress in the field. Functional Plant Biology, 36(11), 978–989. https://doi.org/10.1071/FP09123 [Google Scholar] [PubMed] [CrossRef]
44. Liu, T., Li, R., Zhong, X., Jiang, M., Jin, X. et al. (2018). Estimates of rice lodging using indices derived from UAV visible and thermal infrared images. Agricultural and Forest Meteorology, 252, 144–154. https://doi.org/10.1016/j.agrformet.2018.01.021 [Google Scholar] [CrossRef]
45. Gao, M., Li, Q., Gao, J., Li, J., Zhang, W. et al. (2017). A research on monitoring the canopy temperature variation of rice based on the infrared thermal imaging technique. IOP Conference Series: Earth and Environmental Science, 61(1), 01207. https://doi.org/10.1088/1755-1315/61/1/012077 [Google Scholar] [CrossRef]
46. Jiang, M., Chen, Z., Li, Y., Huang, X. M., Huang, L. F. et al. (2023). Rice canopy temperature as affected by nitrogen fertilizer. Journal of Integrative Agriculture, 2095–3119. https://doi.org/10.1016/j.jia.2023.05.005 [Google Scholar] [CrossRef]
47. Sikma, M., Ikawa, H., Heusinkveld, B. G., Yoshimoto, M., Hasegawa, T. et al. (2020). Quantifying the feedback between rice architecture, physiology, and microclimate under current and future CO2 conditions. Journal of Geophysical Research: Biogeosciences, 125(3), 1–12. https://doi.org/10.1029/2019JG005452 [Google Scholar] [CrossRef]
48. Gautam, A., Sai Prasad, S. V., Jajoo, A., Ambati, D. (2015). Canopy temperature as a selection parameter for grain yield and its components in durum wheat under terminal heat stress in late sown conditions. Agricultural Research, 4(3), 238–244. https://doi.org/10.1007/s40003-015-0174-6 [Google Scholar] [CrossRef]
49. Perdomo, J. A., Capó-Bauçà, S., Carmo-Silva, E., Galmés, J. (2017). Rubisco and rubisco activase play an important role in the biochemical limitations of photosynthesis in rice, wheat, and maize under high temperature and water deficit. Frontiers in Plant Science, 8(1719), 490. https://doi.org/10.3389/fpls.2017.00490 [Google Scholar] [PubMed] [CrossRef]
50. Liu, L., Chen, T., Wang, Z., Zhang, H., Yang, J. et al. (2013). Combination of site-specific nitrogen management and alternate wetting and drying irrigation increases grain yield and nitrogen and water use efficiency in super rice. Field Crops Research, 154, 226–235. https://doi.org/10.1016/j.fcr.2013.08.016 [Google Scholar] [CrossRef]
51. Zhang, Z., Yang, Z., Fahad, S., Zhang, T., Xu, W. et al. (2020). A hot-blast warming facility for simulating global warming in low-stature crop systems and its application case to assess elevated temperature effects on rice in Central China. Plant Methods, 16(1), 57. https://doi.org/10.1186/s13007-020-00598-1 [Google Scholar] [PubMed] [CrossRef]
52. Fukuda, A., Kondo, K., Ikka, T., Takai, T., Tanabata, T. et al. (2018). A novel QTL associated with rice canopy temperature difference affects stomatal conductance and leaf photosynthesis. Breeding Science, 68(3), 305–315. https://doi.org/10.1270/jsbbs.17129 [Google Scholar] [PubMed] [CrossRef]
53. Luan, X., Vico, G. (2021). Canopy temperature and heat stress are increased by compound high air temperature and water stress and reduced by irrigation-a modeling analysis. Hydrology and Earth System Sciences, 25(3), 1411–1423. https://doi.org/10.5194/hess-25-1411-2021 [Google Scholar] [CrossRef]
54. Karwa, S., Bahuguna, R. N., Chaturvedi, A. K., Maurya, S., Arya, S. S. et al. (2020). Phenotyping and characterization of heat stress tolerance at reproductive stage in rice (Oryza sativa L.). Acta Physiologiae Plantarum, 42(2), 29. https://doi.org/10.1007/s11738-020-3016-5 [Google Scholar] [CrossRef]
Cite This Article
 Copyright © 2023 The Author(s). Published by Tech Science Press.
This work is licensed under a Creative Commons Attribution 4.0 International License , which permits unrestricted use, distribution, and reproduction in any medium, provided the original work is properly cited.
 Downloads
 Citation Tools