
 Submit a Paper
 Propose a Special lssue
 Open Access
ARTICLE

Effect of Rural Sewage Irrigation Regime on Water-Nitrogen Utilization and Crop Growth of Paddy Rice in Southern China
1 Zhejiang Institute of Hydraulics and Estuary (Zhejiang Institute of Marine Planning and Design), Hangzhou, 310020, China
2 North China University of Water Resource and Electric Power, Zhengzhou, 450045, China
* Corresponding Author: Menghua Xiao. Email:
Phyton-International Journal of Experimental Botany 2023, 92(4), 1215-1233. https://doi.org/10.32604/phyton.2023.025625
Received 22 July 2022; Accepted 05 September 2022; Issue published 06 January 2023
 View Full Text
 Download PDF
Abstract
Reclaimed water irrigation has become an effective mean to alleviate the contradiction between water availability and its consumption worldwide. In this study, three types of irrigation water sources (rural sewage’s primary treated water R1 and secondary treated water R2, and river water R3) meeting the requirements of water quality for farmland irrigation were selected, and three types of irrigation water levels (low water level W1 of 0–80 mm, medium water level W2 of 0–100 mm, and high water level W3 of 0–150 mm) were adopted to carry out research on the influence mechanismS of different irrigation water sources and water levels on water and nitrogen use and crop growth in paddy field. The water quantity indicators (irrigation times and irrigation volume), soil ammonium nitrogen (NH4+-N) and nitrate nitrogen (NO3−-N), rice yield indicators (thousand-grain weight, the number of grains per spike, and the number of effective spikes), and quality indicators (the amount of protein, amylose, vitamin C, nitrate and nitrite content) of rice were measured. The results showed that, the average irrigation volume under W3 was 2.4 and 1.9 times of that under W1 and W2, respectively. Compared with R3, the peak consumption of rice was lagged behind under R1 and R2, and the nitrogen form in 0–40 cm soil layers under rural sewage irrigation was mainly NH4+-N. The changes of NO3−-N and NH4+-N in the 0–40 cm soil layer showed the trend of declining and then increasing. The water level control only had a significant effect on the change of NO3−-N in the 60–80 cm soil layer. Both irrigation water use efficiency and crop water use efficiency were gradually reduced with the increase of field water level control. The nitrogen utilization efficiency under rural sewage irrigation was significantly higher than that under R3. Compared with the R3, rural sewage irrigation could significantly increase the yield of rice, and as the field water level rose, the effect of yield promotion was more obvious. It was noteworthy that the grain of rice under R1 monitored the low nitrate and nitrite content, but no nitrate and nitrite was discovered under R2 and R3. Therefore, reasonable rural sewage irrigation (R2) and medium water level (W2) were beneficial to improve nitrogen utilization efficiency, crop yield and crop quality promotion.
Keywords
Irrigation and fertilization are the two most important measures to ensure stable and increasing production of global food [1–3]. However, China is facing a severe contradiction between the supply and demand of water resources. Even in the abundant water areas in Southern China, the problem of water quality and water shortage is still prominent. Due to the massive consumption of industrial and urban water, the annual agricultural irrigation water shortage has reached 60 billion m3, and it is increasing year by year. The annual discharge of rural sewage is as high as 8.395 billion tons, and the pollutant discharge is about half of the national pollutant discharge [4]. For example, the annual discharge of rural sewage is 1.378 billion tons in Zhejiang Province of China, and the annual discharge of chemical oxygen demand (COD) to the water environment is about 105,000 tons, and the NH4+-N is about 20,000 tons; therefore the problem of agricultural non-point source pollution is outstanding [5,6]. Compared with conventional clean water for irrigation, rural sewage has high nitrogen (N), phosphorus (P) and organic matter content, and rural sewage irrigation can improve soil fertility and soil environment for microorganism activity [7–9]. Compared with urban sewage, rural sewage generally does not contain toxic substances like heavy metals, pathogenic microorganisms and disinfection by-products, therefore it can be used as a fertilizer resource [10–12]. Simultaneously, most of the rural sewage discharge standards, such as “Discharge Standard of Pollutants for Municipal Wastewater Treatment Plant” (GB18918-2002) [13], etc., implement the level B standard, which meets the water quality standards for agricultural irrigation water. It was found that when nitrogen fertilizer was applied normally, domestic sewage irrigation significantly promoted the growth of roots and plants of rice, and dry matter accumulation was also significantly higher than that of clean water irrigation treatment [14].
At present, developed countries and Northern China have rich experience in urban sewage utilization. Reclaimed water is mainly used for farmland irrigation, miscellaneous urban purpose, industry and landscape, etc., and less in the resource utilization of rural sewage. For reclaimed water, the sources and forms of nutrients are diverse, and the ion environment and the microbial environment are also quite different from conventional clean water irrigation. After evaluating the nitrogen utilization efficiency under reclaimed water irrigation without fertilization, it was found that effluent irrigation in October resulted in 30% less dry matter than in September, and minimal yield benefit was obtained when the effluent was applied at an effluent irrigation rate of higher than 10 ha-cm during the summer months [15]. By studying the variation law of nitrogen utilization efficiency with nitrogen application rate under the condition of reclaimed water irrigation, it was found that using wastewater could increase the yield and nutrients [16]. By studying the 11-year soil change under reclaimed water and groundwater irrigation, it was found that the content of NH4+-N and NO3−-N in the soil was increased under reclaimed water irrigation [17]. By studying the effect of irrigation water quality on soil nitrogen distribution under drip irrigation, it was found that the NH4+-N concentration in the 0–40 cm soil layer was increased under reclaimed water irrigation, but there was no accumulation of NH4+-N in the soil layer below 40 cm, where the NO3−-N concentration showed a trend that it was increasing with soil depth [18]. Moreover, it was found that soil quality was improved by increasing soil nutrient content and soil microbial activity under reclaimed water irrigation, and as the reclaimed water irrigation time increased, the improvement effect of soil quality was more obvious [19]. Most studies have shown that reclaimed water irrigation could promote crop growth and increase yield, meanwhile it does not significantly affect crop quality [20–22]. According to the study results of other researchers, reclaimed water irrigation could increase the yield of fruits and vegetables, namely by 7%–61% on average, compared with clean water irrigation [23], and could improve the dry matter quality and nutrient content of corn, so it could replace part of the fertilizer [24]. It showed that reclaimed water irrigation can save 75% of fresh water, and reclaimed water could bring in a large amount of nitrogen under flooded irrigation, with the replacement efficiency of nitrogen fertilizer of 35.8% [25]. Therefore, rural sewage could be used for agricultural irrigation after being safely treated, where the safely treated rural sewage is an effective way to solve the dilemma of water’s ecological environment and alleviate the contradiction between water supply and demand in Southern China.
The interaction among the components of reclaimed water at different field water levels is complicated, resulting in difference of nitrogen absorption and utilization. Most of the existing researches, from an agronomic viewpoint and by comparing the growth conditions of crops irrigated by the water of different qualities, have indirectly proven and verified the effectiveness of water and nitrogen utilization under reclaimed water irrigation. Therefore, by taking the paddy rice as the research object and the irrigation regulation technology as the research carrier, this study carries out innovative research on the water demand and consumption law of rice under the regime of rural sewage irrigation with different water levels, and the effect on the utilization efficiency of water and nitrogen, as well as crop growth quality. The objective of this research is to provide key theories and technologies, such as rural sewage irrigation and drainage regulation on the recycling efficiency of paddy fields, efficient and safe irrigation, and drainage regulation technique for rice production.
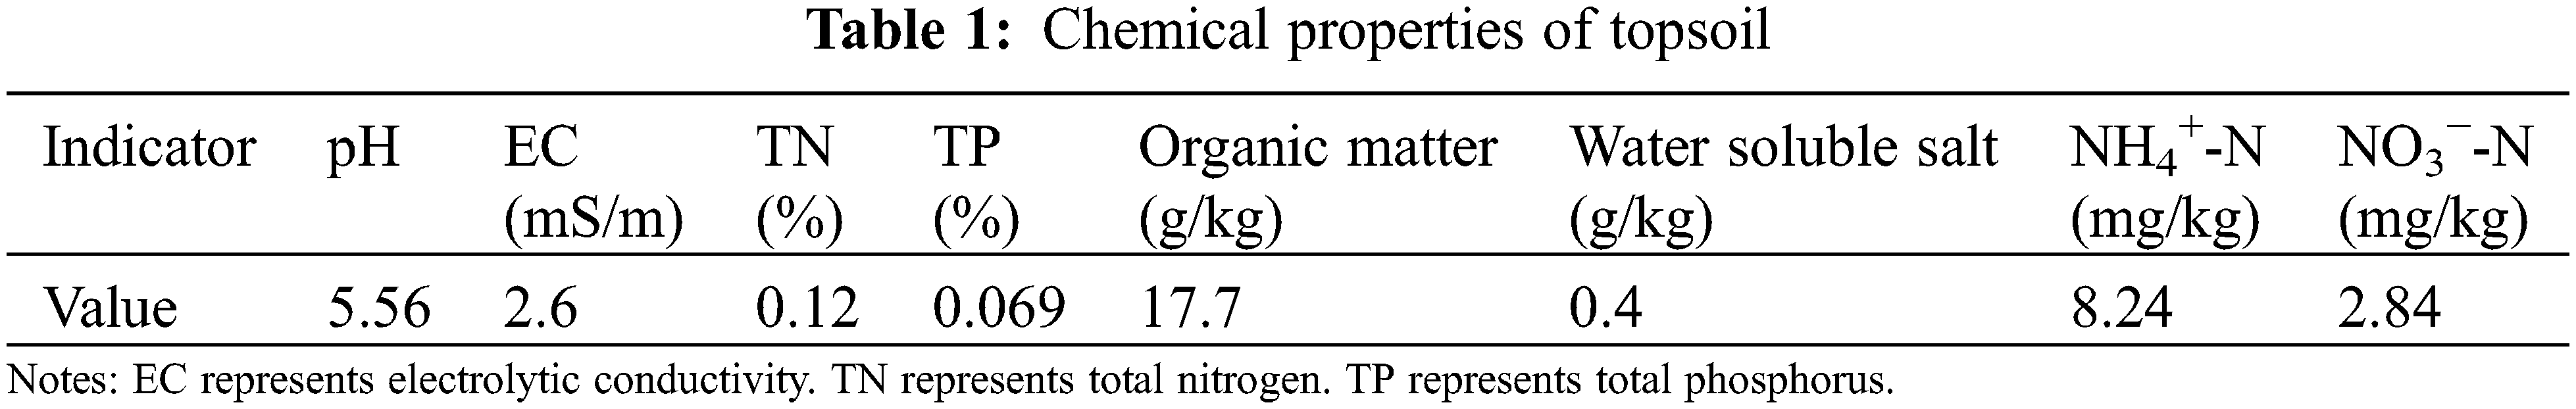
This work was carried out at Zhousan County (N28°48′, E120°10′), Jinhua City, Zhejiang Province of China, covering the period from June to October, 2020 (Fig. 1). The region is located in the area with subtropical monsoon climate, with an average annual precipitation of 1,787 mm, average annual evaporation 930.2 mm, average annual sunshine 1,909 h, average annual temperature 17.7°C, maximum and minimum air temperatures of 39.9°C and −14.5°C, respectively, and there are 245 frost-free days per year, with the average wind speed of 2.8 m/s [26]. The soil type at the experimental site is sandy/sandy clay (for its main properties, see Table 1). In this work, the local rice variety (Jiayou Zhongke 13-1) was used as the test plant, since it was hybrid rice and was suitable for single-season indica-japonica planting in Zhejiang Province.
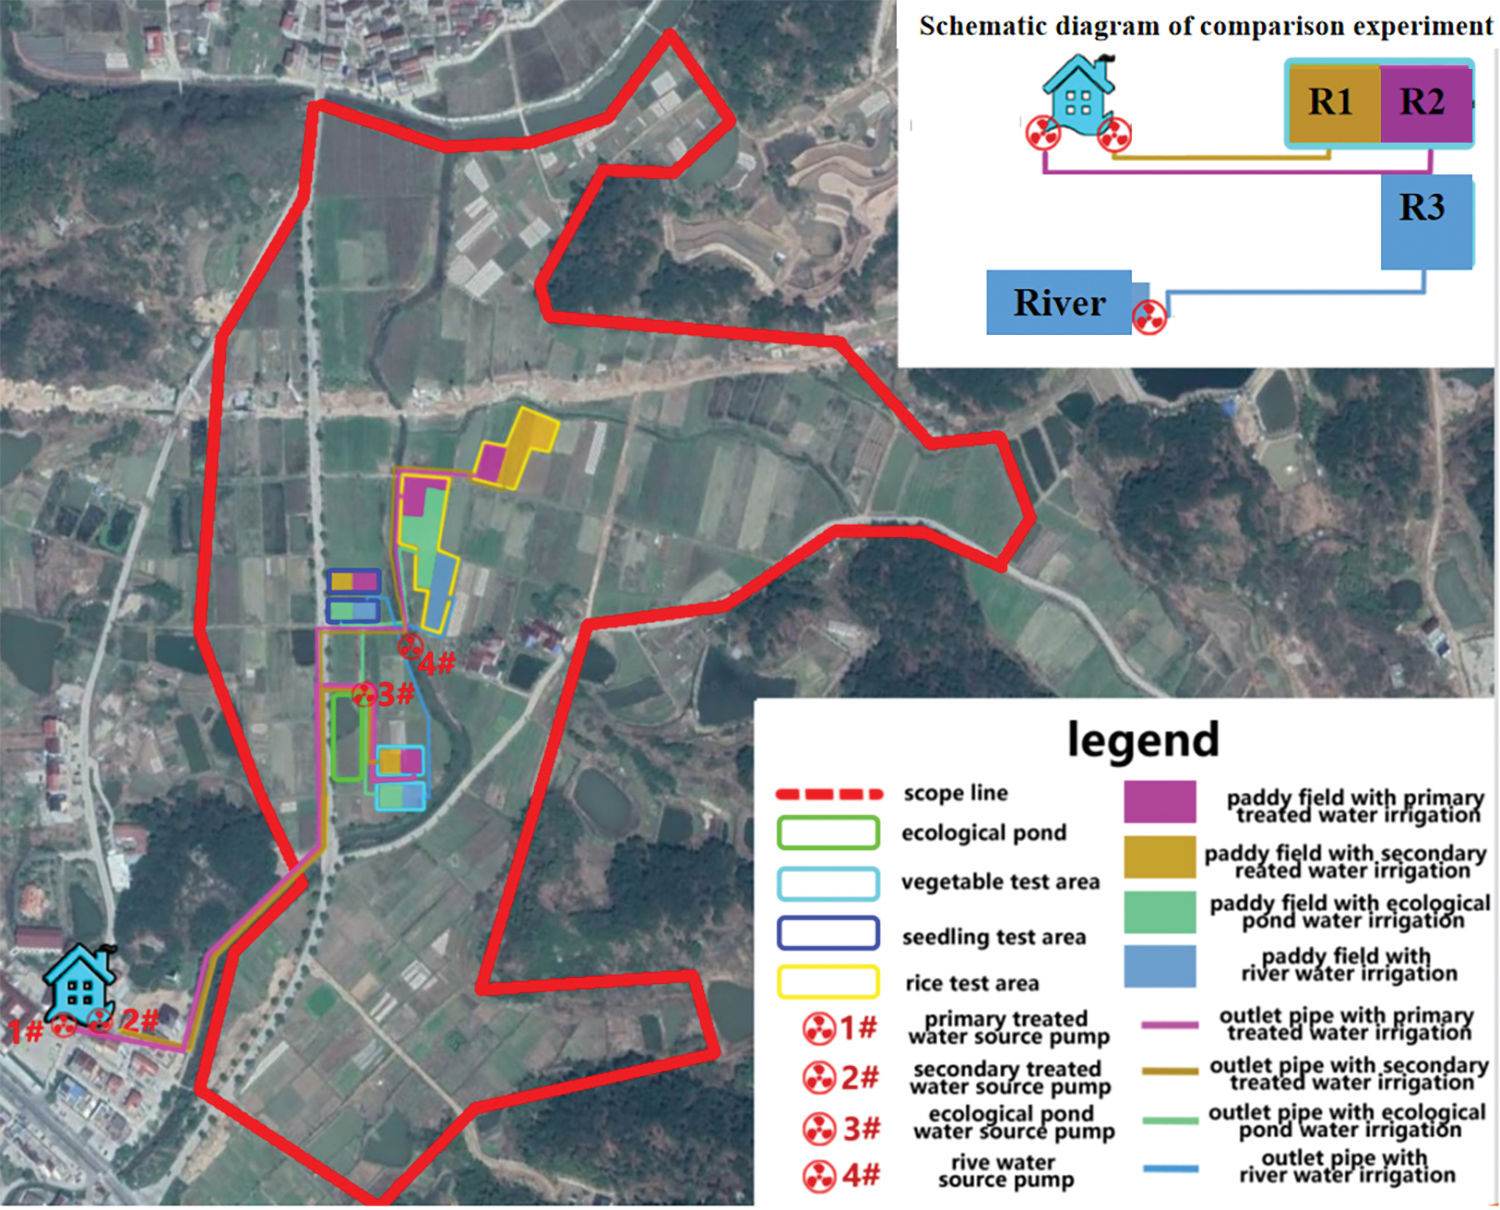
Figure 1: Experimental site location. In the uppermost, right panel is river, not rive
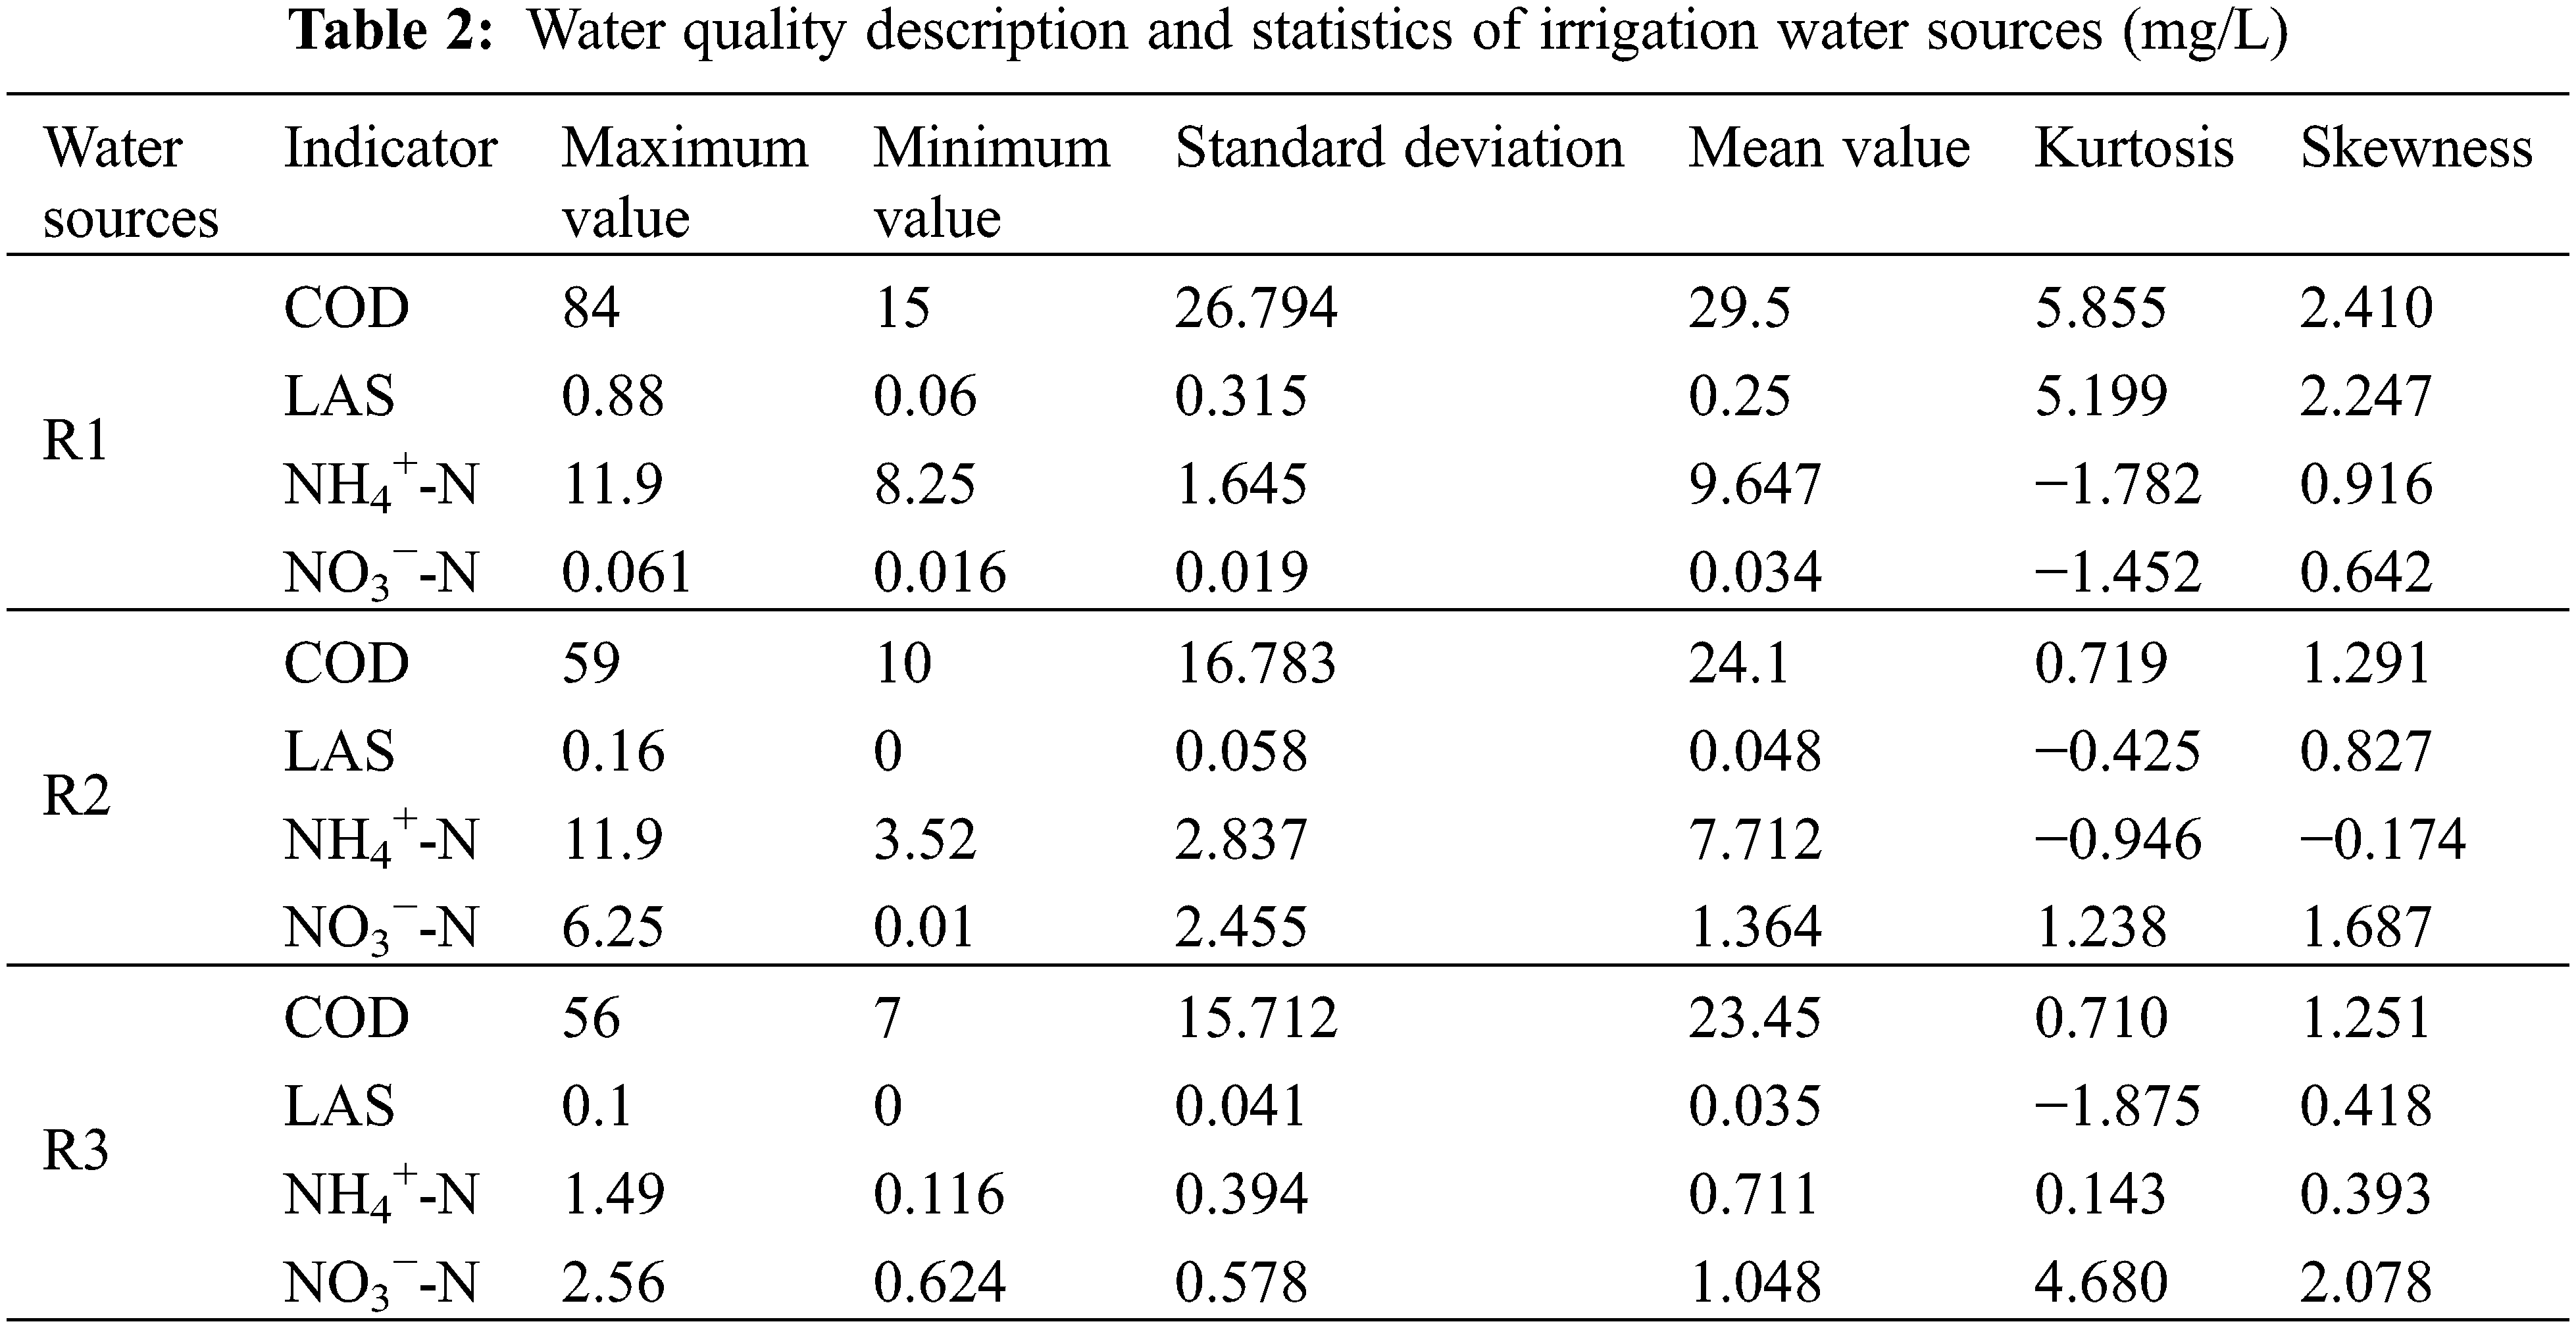
There were three irrigation water sources, i.e., primary reclaimed water (R1), secondary reclaimed water (R2) and river clean water (R3). The reclaimed water was from domestic sewage treatment sources (for its water quality during the experiment period, see Table 2). All the water quality indicators of irrigation water could meet the “Standards for Irrigation Water Quality” (GB5084-2021) [27]. The main indicator for rural sewage is COD. The concentration of NH4+-N in R1 and R2 is much higher than that of NO3−-N, while the concentration of NO3−-N in R3 is slightly higher than that of NH4+-N. The concentration of anionic surfactant (LAS) ranges from 0–0.88 mg/L, and it is higher in R1.
Three water level control regimes were also set with different water sources (W1, W2 and W3) (see Table 3). Field water level condition was strictly controlled during each growth period, and water was replenished when the level dropped to the required lower limit and was drained off when the level (by rainstorm) exceeded the upper limit of rain storage. Each treatment was repeated three times (WR-1, WR-2, WR-3), therefore a total of 27 experimental plots (20 m × 5 m) with automatic irrigation systems were designed and set, and rice seedlings were transplanted on June. 26 and harvested on October 02, 2020, with a rice density of 50 plants/m2. There were two times of fertilization for all treatments during the growth period of paddy rice, i.e., the basal fertilizers of 200 kg/ha compound fertilizer (N:P:K = 18:8:15) and 100 kg/ha urea on June 25, and the dressing fertilizer of 250 kg/ha compound fertilizer on July 12. The experimental layout of paddy field is shown in Fig. 2.
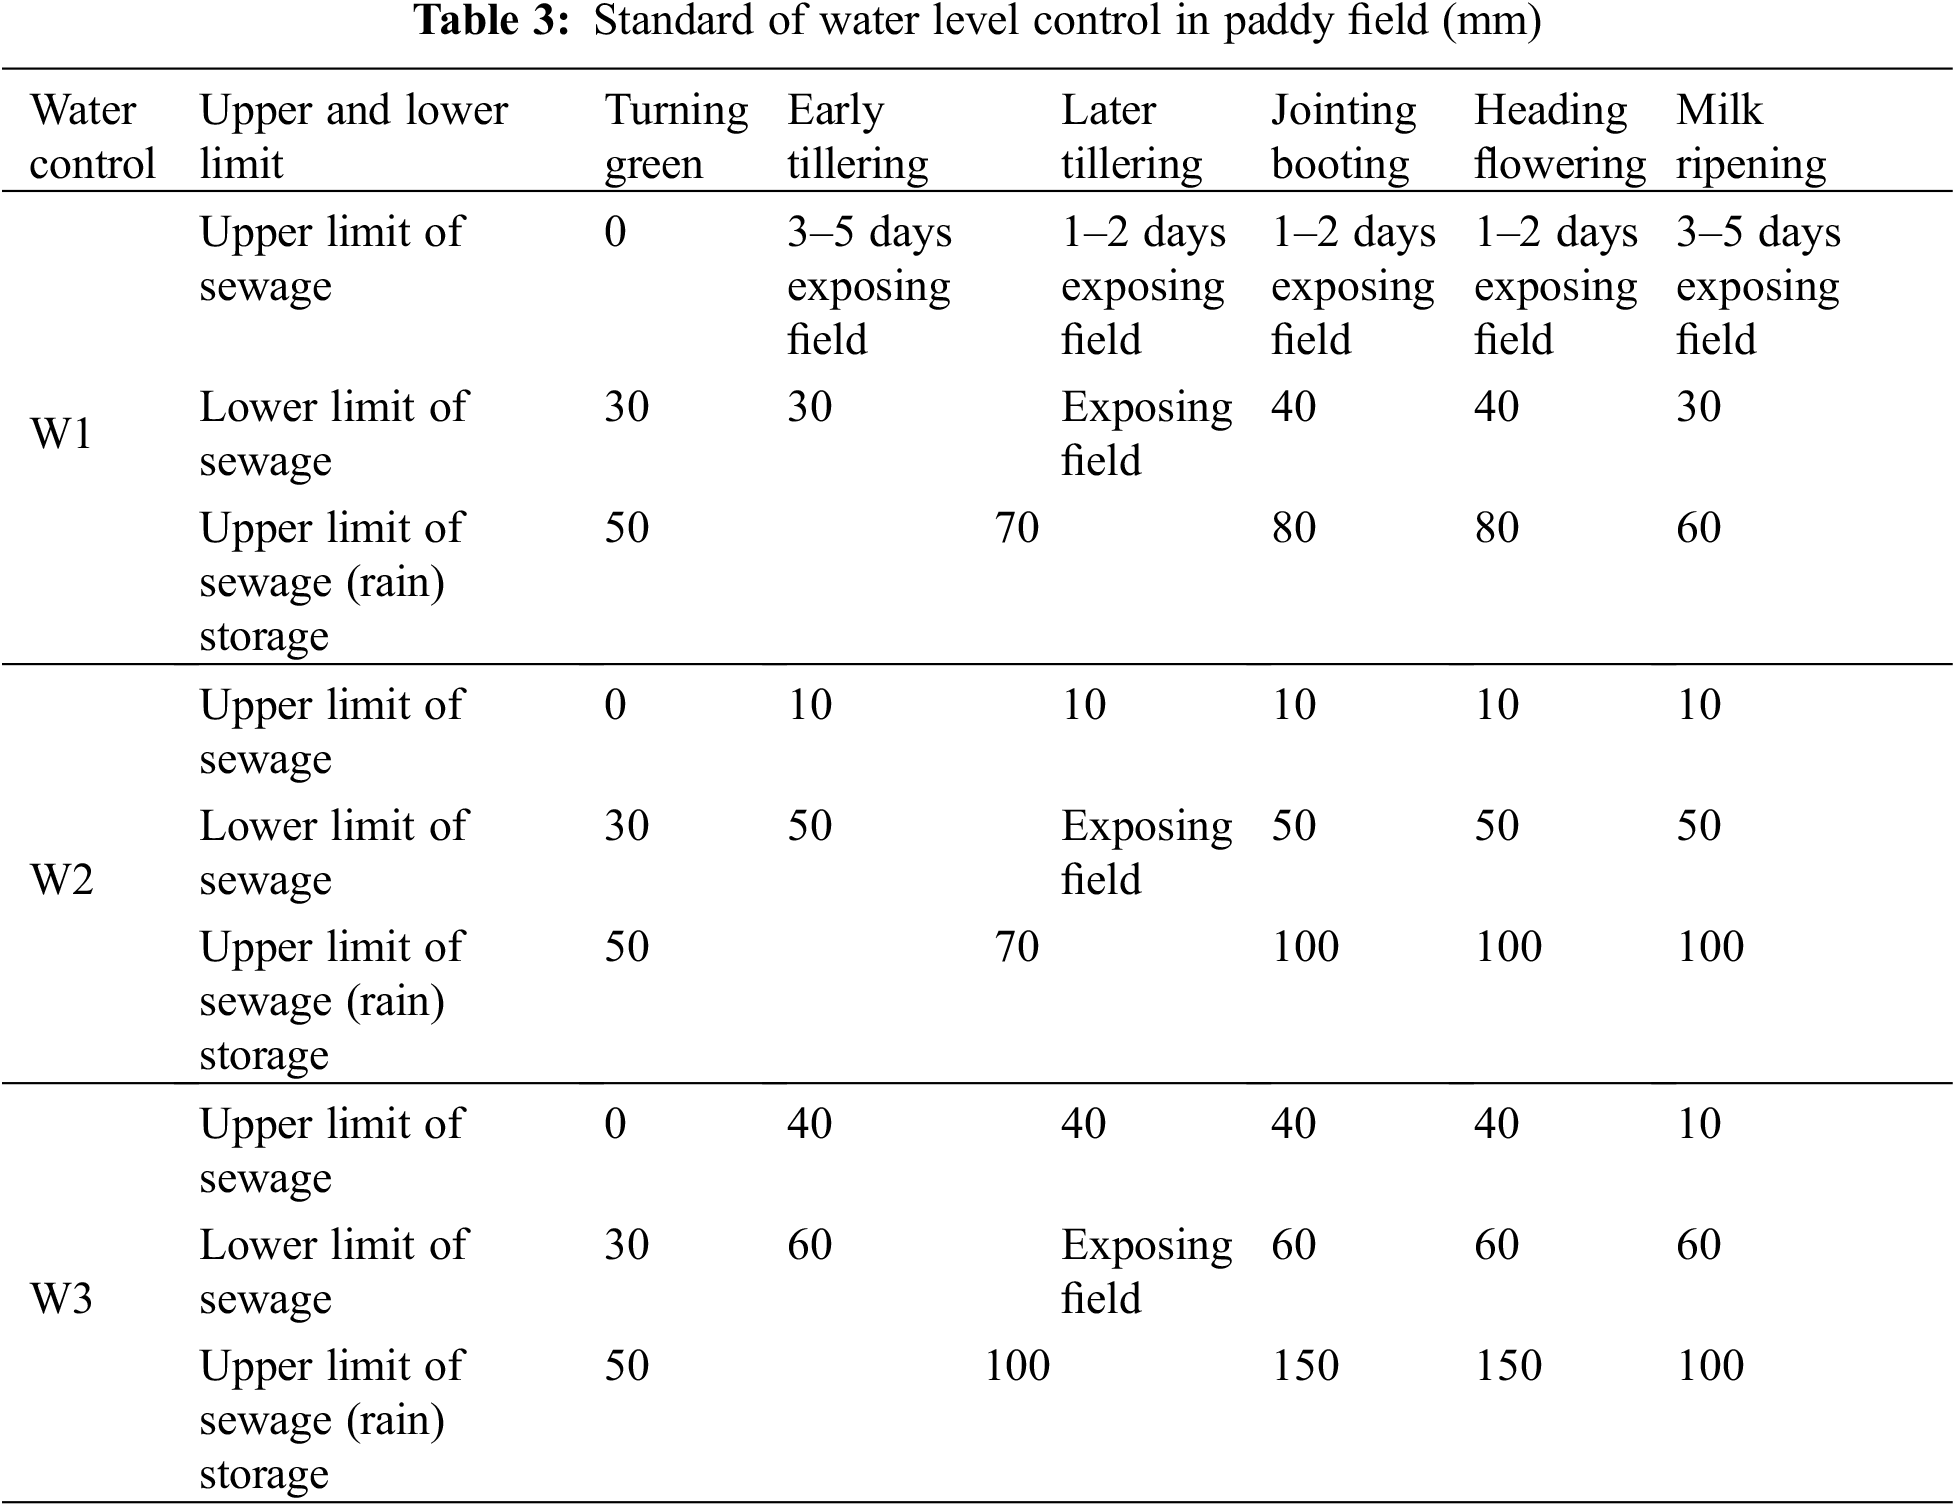
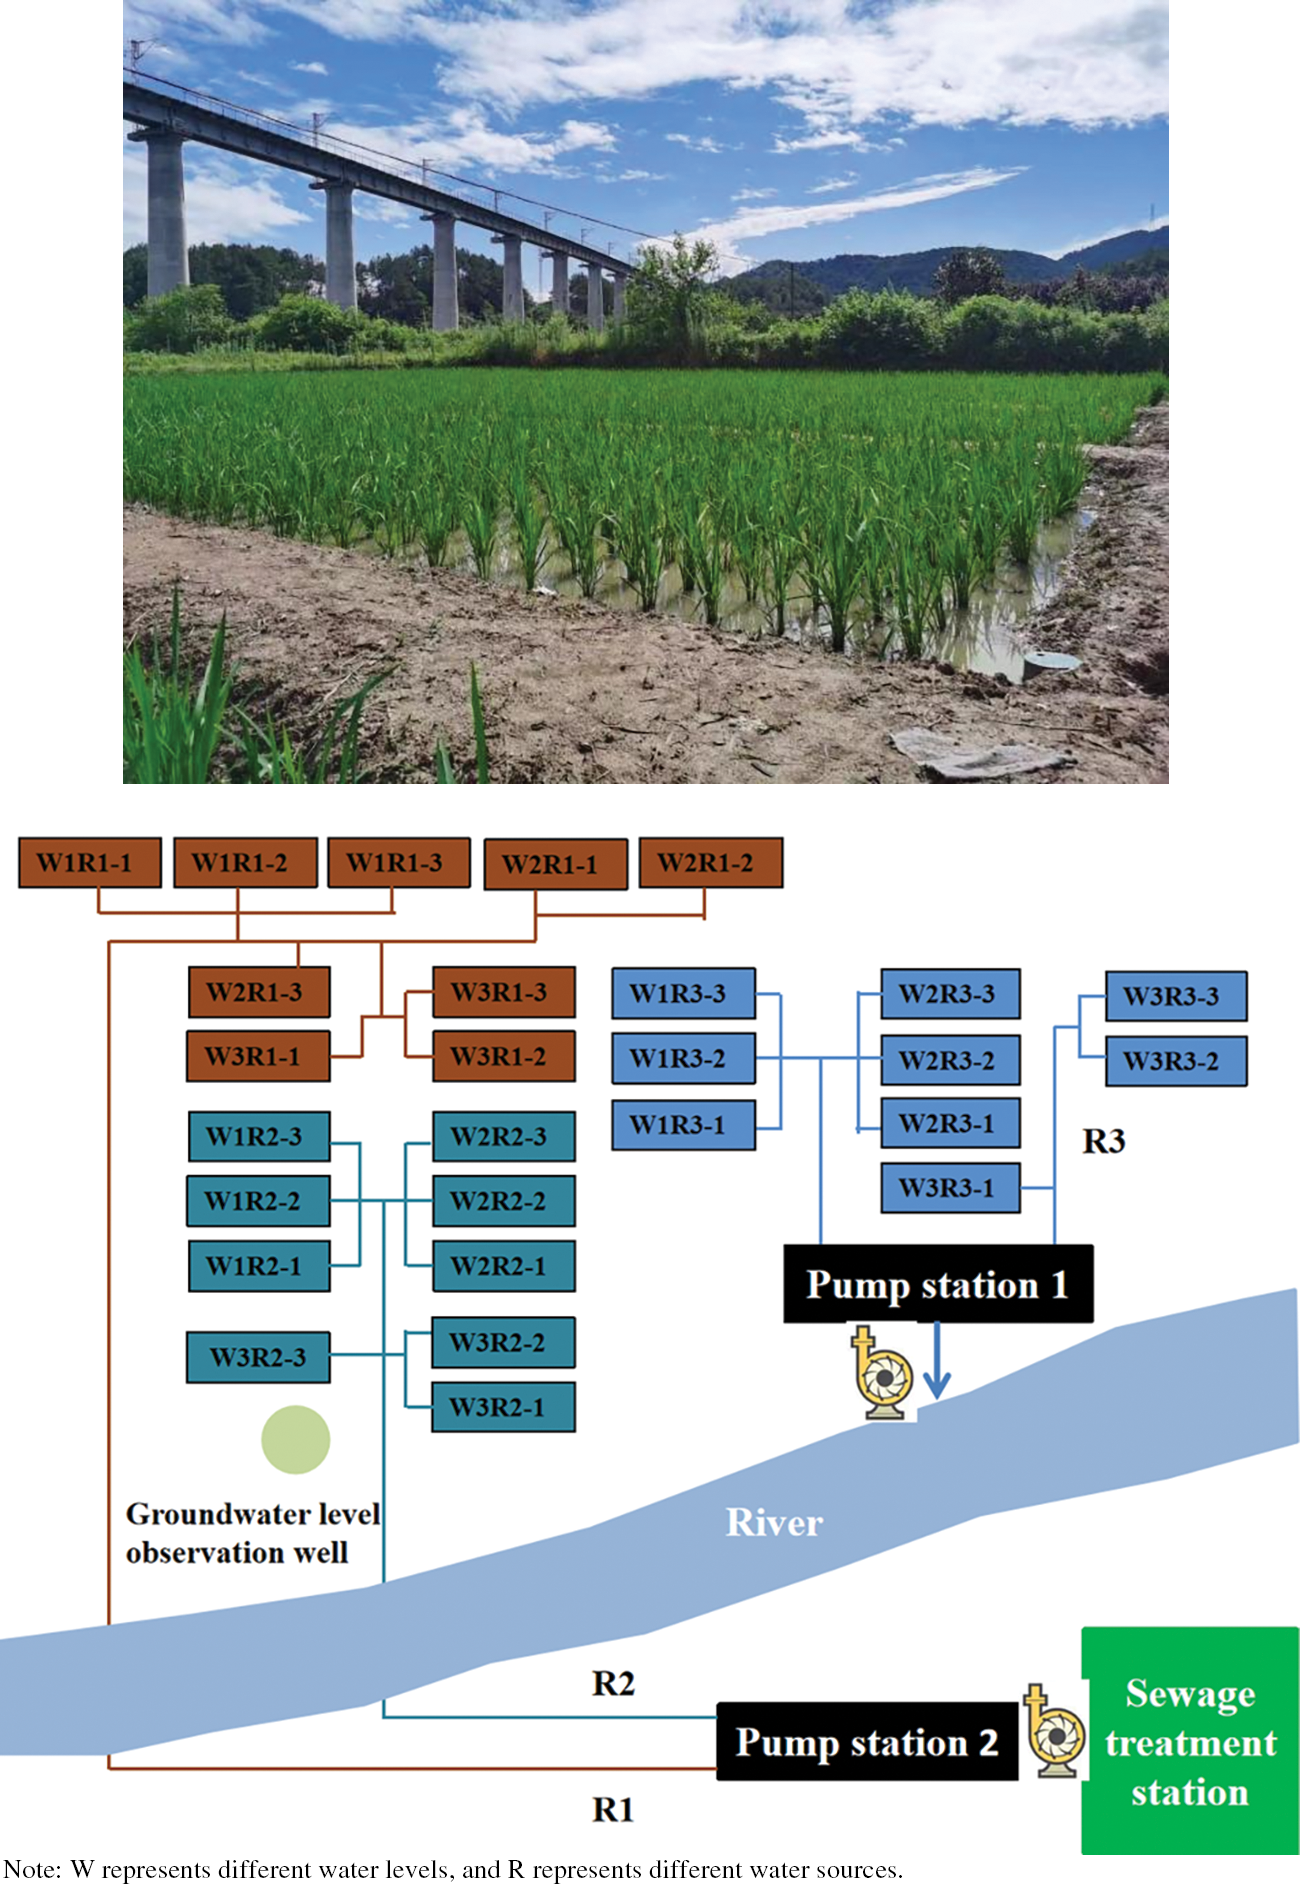
Figure 2: Experimental layout of paddy field
By weighing the barrel evaporator with large tonnage and high-precision quality comparator, the water consumption of rice during a period was obtained by the difference between two adjacent cultivation periods. The bottom of barrel evaporator was equipped with a drainage device. The tap was regularly opened to drain water. The water samples were collected at intervals of the 1st, 3rd, 6th, and 10th days after each fertilizer application and one day before the next fertilization or harvest, and the amount of water leakage during the two sampling periods was weighed. Samples were taken on the 1st day and 5th day after the application of base fertilizer, tillering fertilizer, and jointing-booting fertilizer. The samples were sent to the laboratory for elution and nitrogen concentration determinations. Plants with the required representativeness were sampled once per growth period by using the five-point method [28], which could represent the average growth of rice in the experimental plot. Soil samples were collected before soaking fields and after the off-test also by using the five-point method. Nitrogen concentration in rice plant and field soil were determined by the Kjeldahl method. The leakage amount was obtained by the difference in the depth of the water layer in two consecutive days measured by the leakage meter, and then recorded by the point gauge. When there was a water layer in the field, the point gauge was used to record the depth of the water layer before and after irrigation, and the difference was deemed as the irrigation amount. When there was no water layer in the field, the irrigation amount was recorded directly by a water meter. If the water layer in the plot exceeded the upper limit of the treatment requirements after the rain, and the field drainage was carried out. The depth of the water layer before and after drainage was recorded by a vertical ruler, and their difference was the drainage amount.
Water quality indicators mainly included NH4+-N, NO3−-N, COD and LAS. For field irrigation water sampling, water samples were mainly taken on the field surface during irrigation, where leakage water was sampled from soil solution samplers during fertilization and water level control, and samples of drainage were taken at drainage outlets. In these drainage outlets, COD concentration was determined by the dichromate method [29], NH4+-N concentration by Nessler’s reagent spectrophotometry [30], NO3−-N concentration by ion chromatography [31], and LAS concentration by methylene blue spectrophotometry [32].
At the end of the growth period, five holes were chosen for yield measurement. The yield was calculated by measuring the yield-related factors such as a thousand-grain weight, the number of grains per spike, and the number of effective spikes. The quality indicators mainly included the amount of protein, amylose, vitamin C, nitrate concentration, nitrite concentration, etc. They were tested and measured by the Centre Testing International (Hangzhou) Co., Ltd., (China), a company recognized by CNAS and CMA.
Data calculation and diagramming were completed by EXCEL 2010. Correlation analysis was carried out by SPSS Statistics 19.0. The variance homogeneity of the ANOVA was tested before ANOVA analysis.
3.1 Regular Change Pattern in Water Demand
The regular change pattern of water demand under different irrigation water sources and water levels is shown in Table 4. For the same water level control, the irrigation time was shown as R1 < R2 < R3, which was mainly related to the topographical conditions. For the same irrigation water source, under R1, W3 irrigated 6 times and 5 times more than W1 and W2, respectively, and the irrigation volume for W3 was 1.7 times that for W1 and W2. Under R2, W3 irrigated 12 times more than W1 and W2, and the irrigation volume was 4.2 times and 3.4 times of that for W1 and W2, respectively. Under the condition of R3, W3 irrigated 11 times and 8 times more than W1 and W2, respectively, and the irrigation volume was 2.0 times and 1.4 times more than W1 and W2, respectively. It can be seen that under the same water source condition, the irrigation volume and the irrigation frequency showed a trend of W3 > W2 > W1, and the difference between the water level treatments under R2 was the largest.
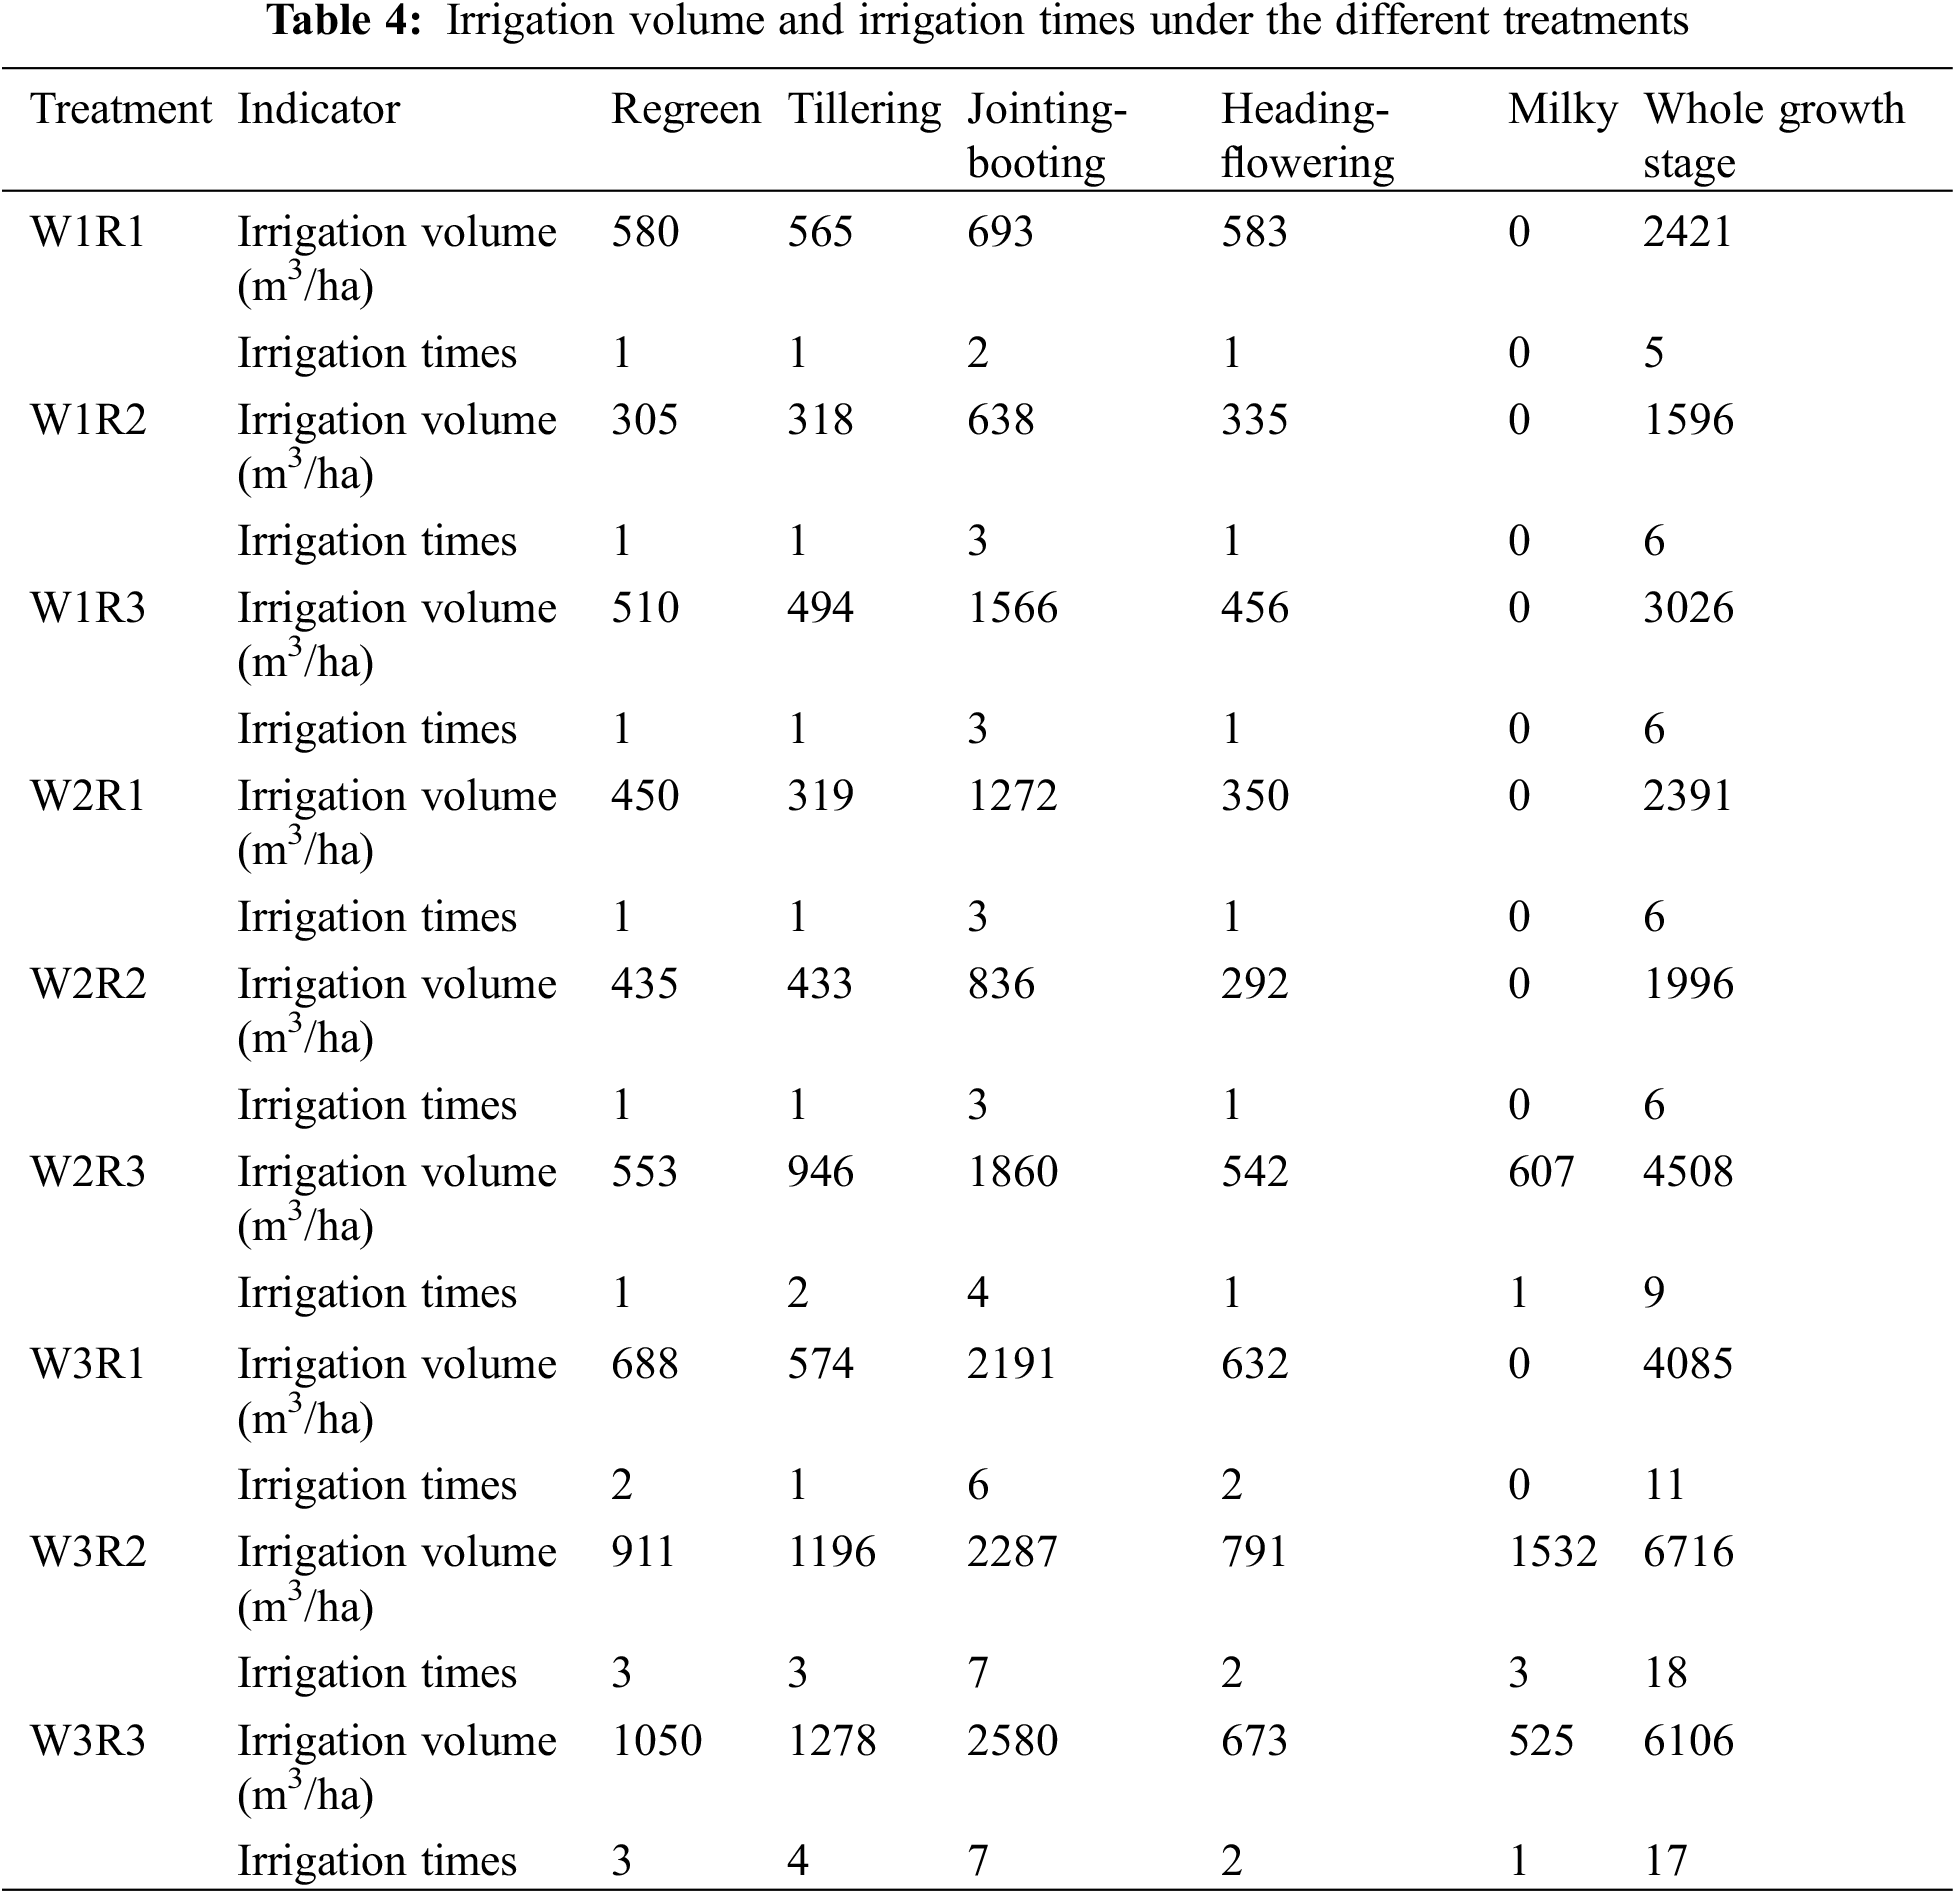
W1 had an average total of 6 irrigation times and an average irrigation volume of 2,348 m3/ha, while the average irrigation times of W2 and W3 were 7 times and 15 times, respectively, with the average irrigation volume for W2 and W3 of 2,965 and 5,636 m3/ha, respectively. Therefore, the number of irrigation times and the volume of irrigation under W3 were significantly higher than that under W1 and W2, whereas W2 was slightly higher than that under W1. The average irrigation volume under W3 was 2.4 times and 1.9 times that under W1 and W2, respectively, and the difference between them mainly happened at the jointing-booting stage of rice due to vigorous growth of rice, where the higher the water consumption was, the higher the irrigation frequency was. During this period, the irrigation frequency under W3 was 4 times more than that under W1 and W2. At the tillering stage, the irrigation times under W3 were both 2 times more than that under W1 and W2, and the irrigation time was 1 time at the heading-flowering stage and the milky stage. Obviously, the irrigation times for W1 and W2 were closed.
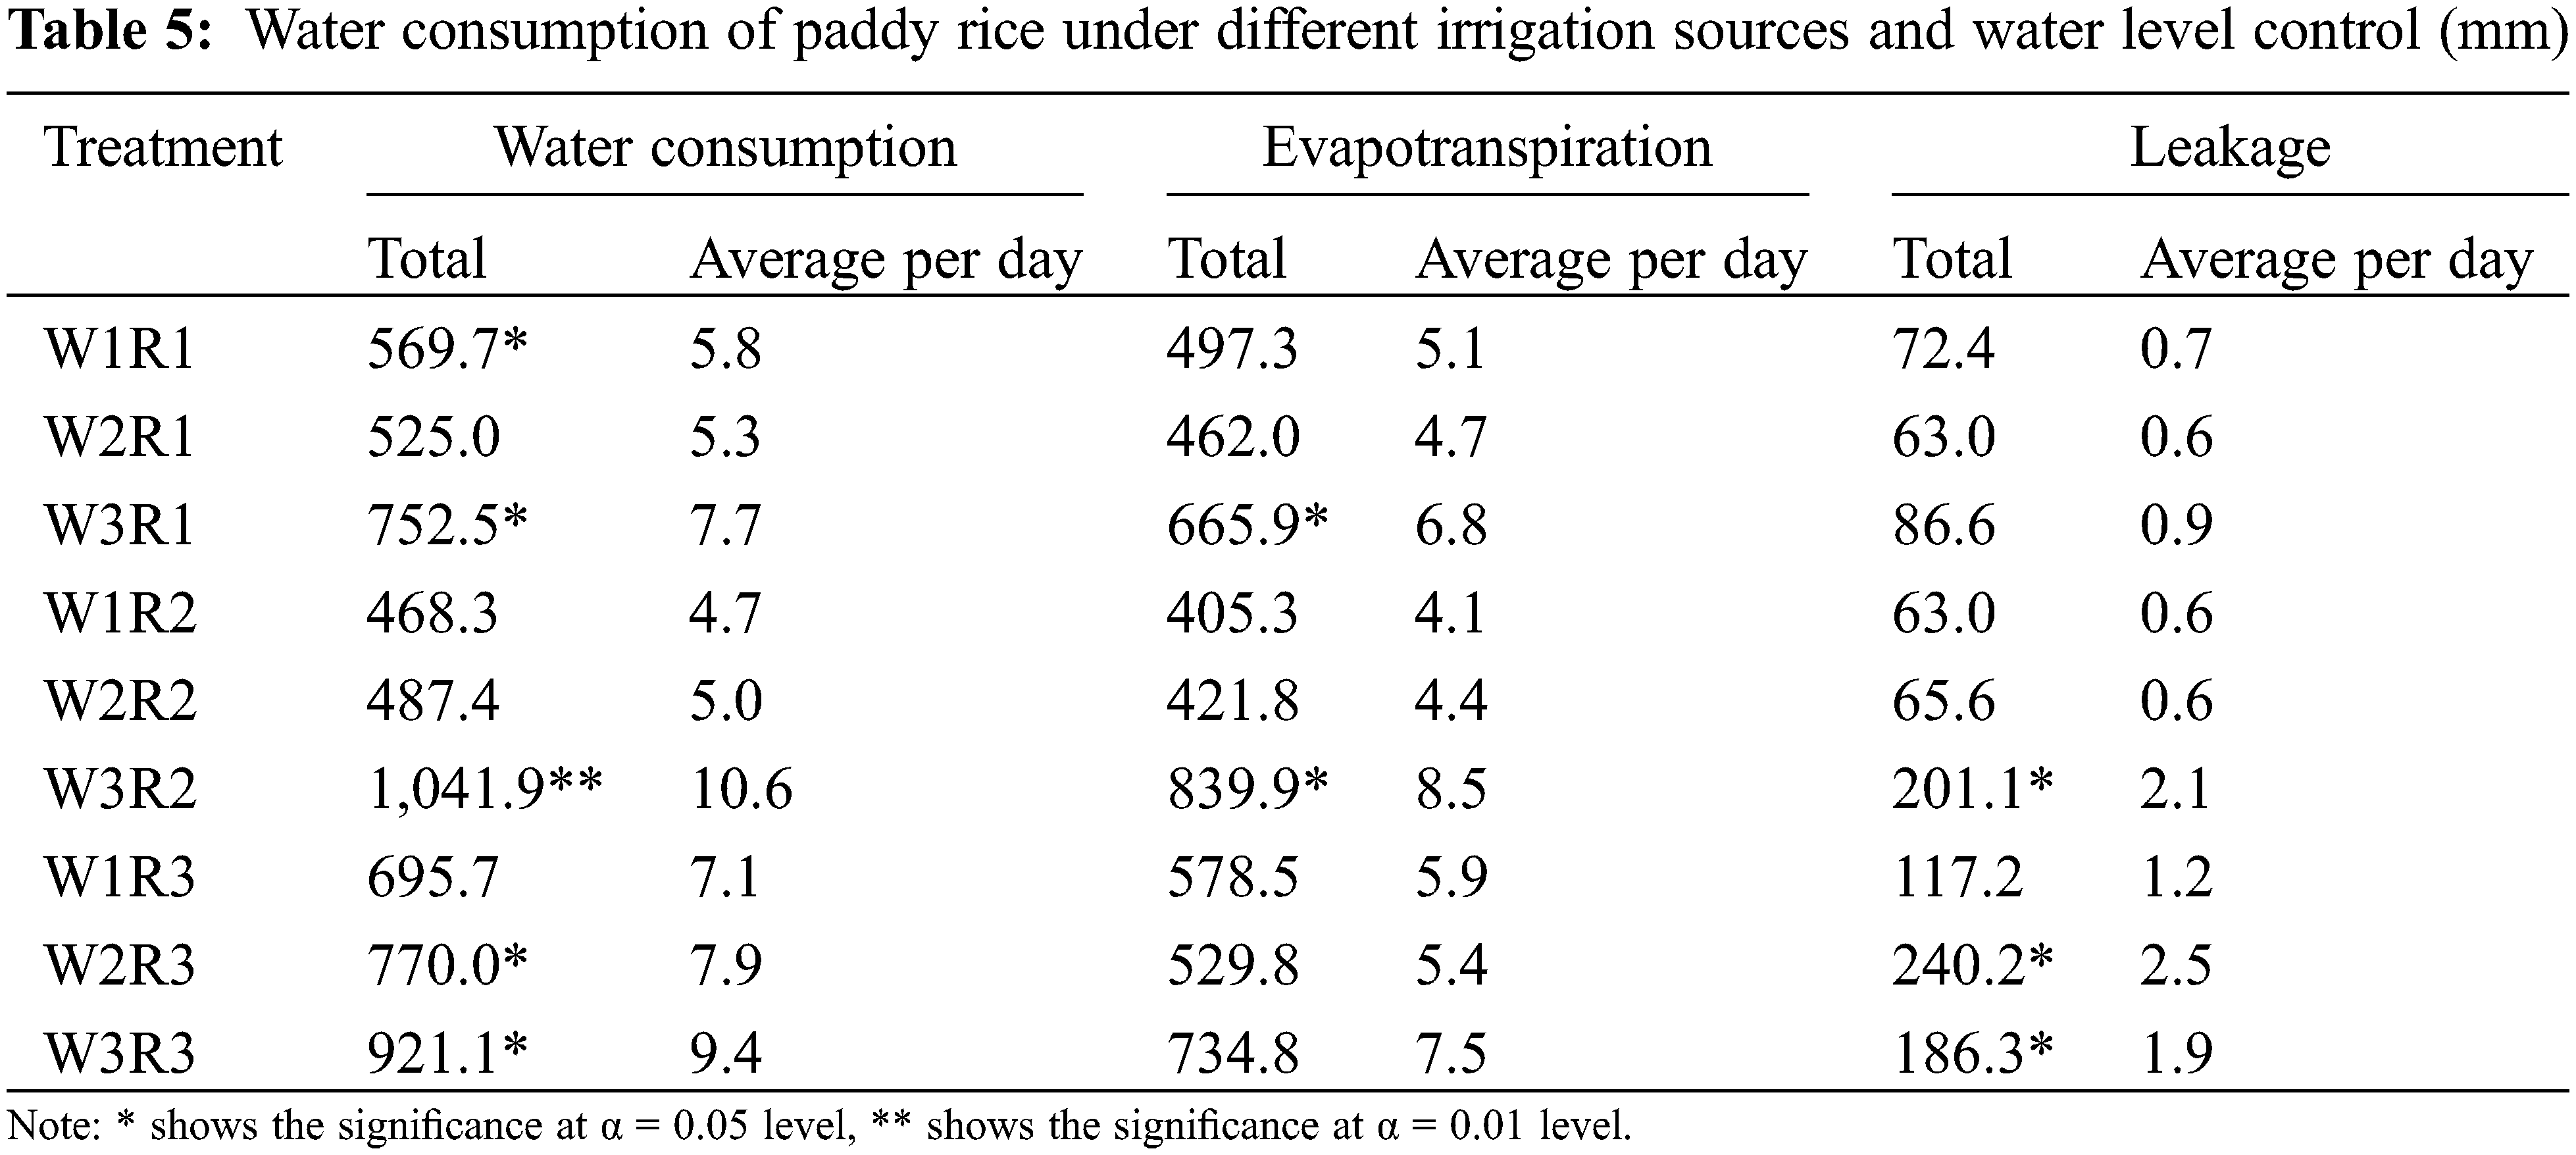
3.2 Regular Change Pattern in Water Consumption
The water consumption change under different irrigation water sources and water level is shown in Table 5. Under R1, water consumption, evapotranspiration and leakage showed the changing trend of W2 < W1 < W3, while water consumption under W1 and W2 were 24.3% and 30.2% lower than that under W3, respectively. Under the water level control of W1, the average daily water consumption and daily evapotranspiration of rice reached the maximum at the heading-flowering stage, followed by the jointing-booting stage, and the smallest at the re-greening stage, while the total water consumption and total evapotranspiration reached the maximum at the jointing-booting stage, followed by the tillering stage, and the smallest at re-greening stage. Under the water level controls of W2 and W3, the average daily water consumption and daily evapotranspiration of rice reached the maximum at the jointing-booting stage, followed by the heading-flowering stage. There was little difference in the amount of leakage water at every growth stage. However, due to more growth days at the jointing-booting stage than that at heading-flowering stage, the total water consumption at the jointing-booting stage was greater. It can be seen that as the control water level in the field rose, the peak of paddy rice water consumption occurred earlier. Under R2, water consumption, evapotranspiration and leakage are showing the changing trend of W1 < W2 < W3, and water consumption under W1 and W2 were 55.1% and 53.2% lower than that under W3, respectively. The daily water consumption and the daily evapotranspiration of W1 reached the maximum at the heading-flowering stage, while both of them reached the maximum at the jointing-booting stage for W2 and W3, and there was not much difference at the heading-flowering and the jointing-booting stages under W3. The total water consumption under W1 reached the maximum at the tillering stage, while it reached the maximum at the jointing-booting stage under W2 and W3. As for R3, the water consumption was highest at the jointing-booting stage under the three water levels, followed by the tillering stage, and the smallest at the re-greening stage. The growth stages with larger daily water consumption were the jointing-booting stage, heading-flowering stage, and milky stage. The average daily water consumption during the whole growth period is expressed as W1 < W2 < W3, with the average daily evapotranspiration as W2 < W1 < W3, and the daily average leakage as W1 < W3 < W2.
3.3 Nitrogen Change in Paddy Field
The changes of NH4+-N and NO3−-N concentrations in the 0–40 cm soil layer during the rice growth period are shown in Fig. 3. It can be seen that the concentration of NO3−-N in the soil was much lower than that of NH4+-N. The changes of NO3−-N and NH4+-N showed an overall trend of declining and increasing. The concentration of NH4+-N in the soil fluctuated greatly during the growth period, and there were two peaks in general, i.e., jointing-booting stage and heading-flowering stage under R1, jointing-booting stage and heading-flowering stage in the 0–20 cm soil layer and jointing-booting stage and milky stage in the 20–40 cm soil layer under R2, and jointing-booting stage and milky stage in the 0–20 cm soil layer and heading-flowering period in the 20–40 cm soil layer under R3. In 0–20 cm soil layer, the peak value of NH4+-N under R1 was 33.6% and 8.3%, higher than that under R2 and R3, respectively, while it was 22% and 3.3% lower than that under R2 and R3, respectively, in 20–40 cm soil layer. It can be seen that the primary reclaimed water irrigation had a significant increase in the NH4+-N concentration on the surface soil. From the tillering stage to the jointing-booting stage, the change of NO3−-N concentration in the soil regulated by W2 under R1 was opposite to that by W1 and W3, and the concentration of NO3−-N for W2 was increased by 1 time and decreased by 65% in the 0–20 cm and 20–40 cm soil layers, respectively. Also,it decreased by 65% and increased by 3.8% for W1, and decreased by 11.9% and increased by 21.4% for W3. Under R2, NO3−-N concentration was not changed in the 0–20 cm soil layer for W2, while it was decreased by 41.4% and increased by 12.5% for W1 and W3, respectively. In the 20–40 cm soil layer, it was decreased by 18.8% for W2, while it was increased by 51.2% and 38% for W1 and W3, respectively. Under R3, NO3−-N concentration for W2 was significantly increased (2.4 times of that at the tillering stage) in the 0–20 cm soil layer, while the change trend of W1 and W3 was opposite to that under R2. Also, the NO3−-N change under the control of all water levels was opposite under R2 in the 20–40 cm soil layer. The trends were opposite to the change trend of this soil layer under R2. At the middle and late jointing-booting stages, the soil’s NO3−-N concentration in the 20–40 cm soil layer under R3 treatment reached the minimum on August 23 (heading-flowering period), but decreased to the lowest on August 16 for all other treatments, while NH4+-N concentration was of relatively high value. At this time, rice grew vigorously, and the conversion of NO3−-N to NH4+-N was accelerated in the soil. After the jointing-booting stage, the soil NO3−-N was always at a rather lower level.
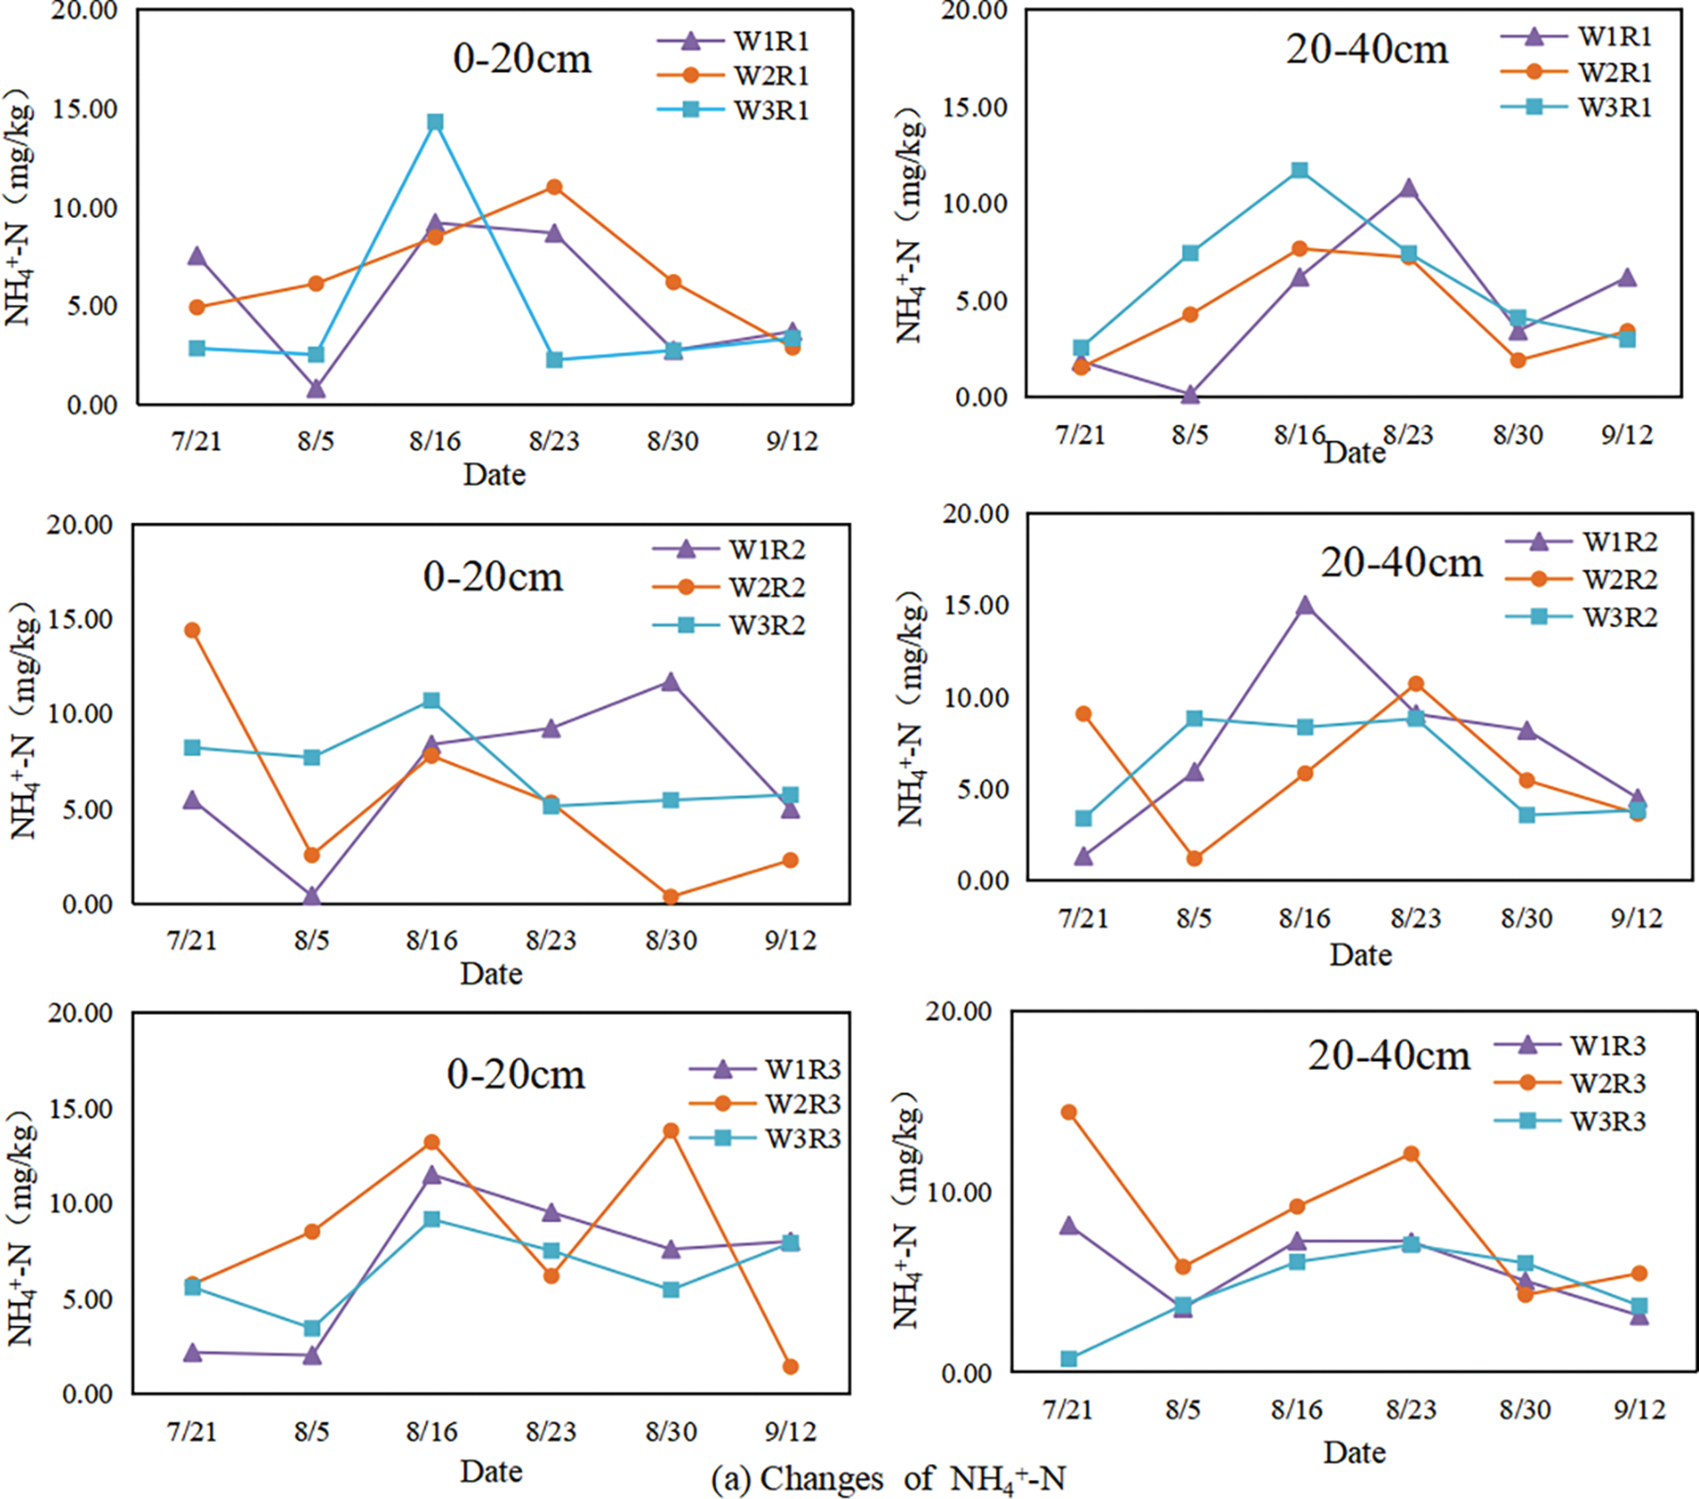
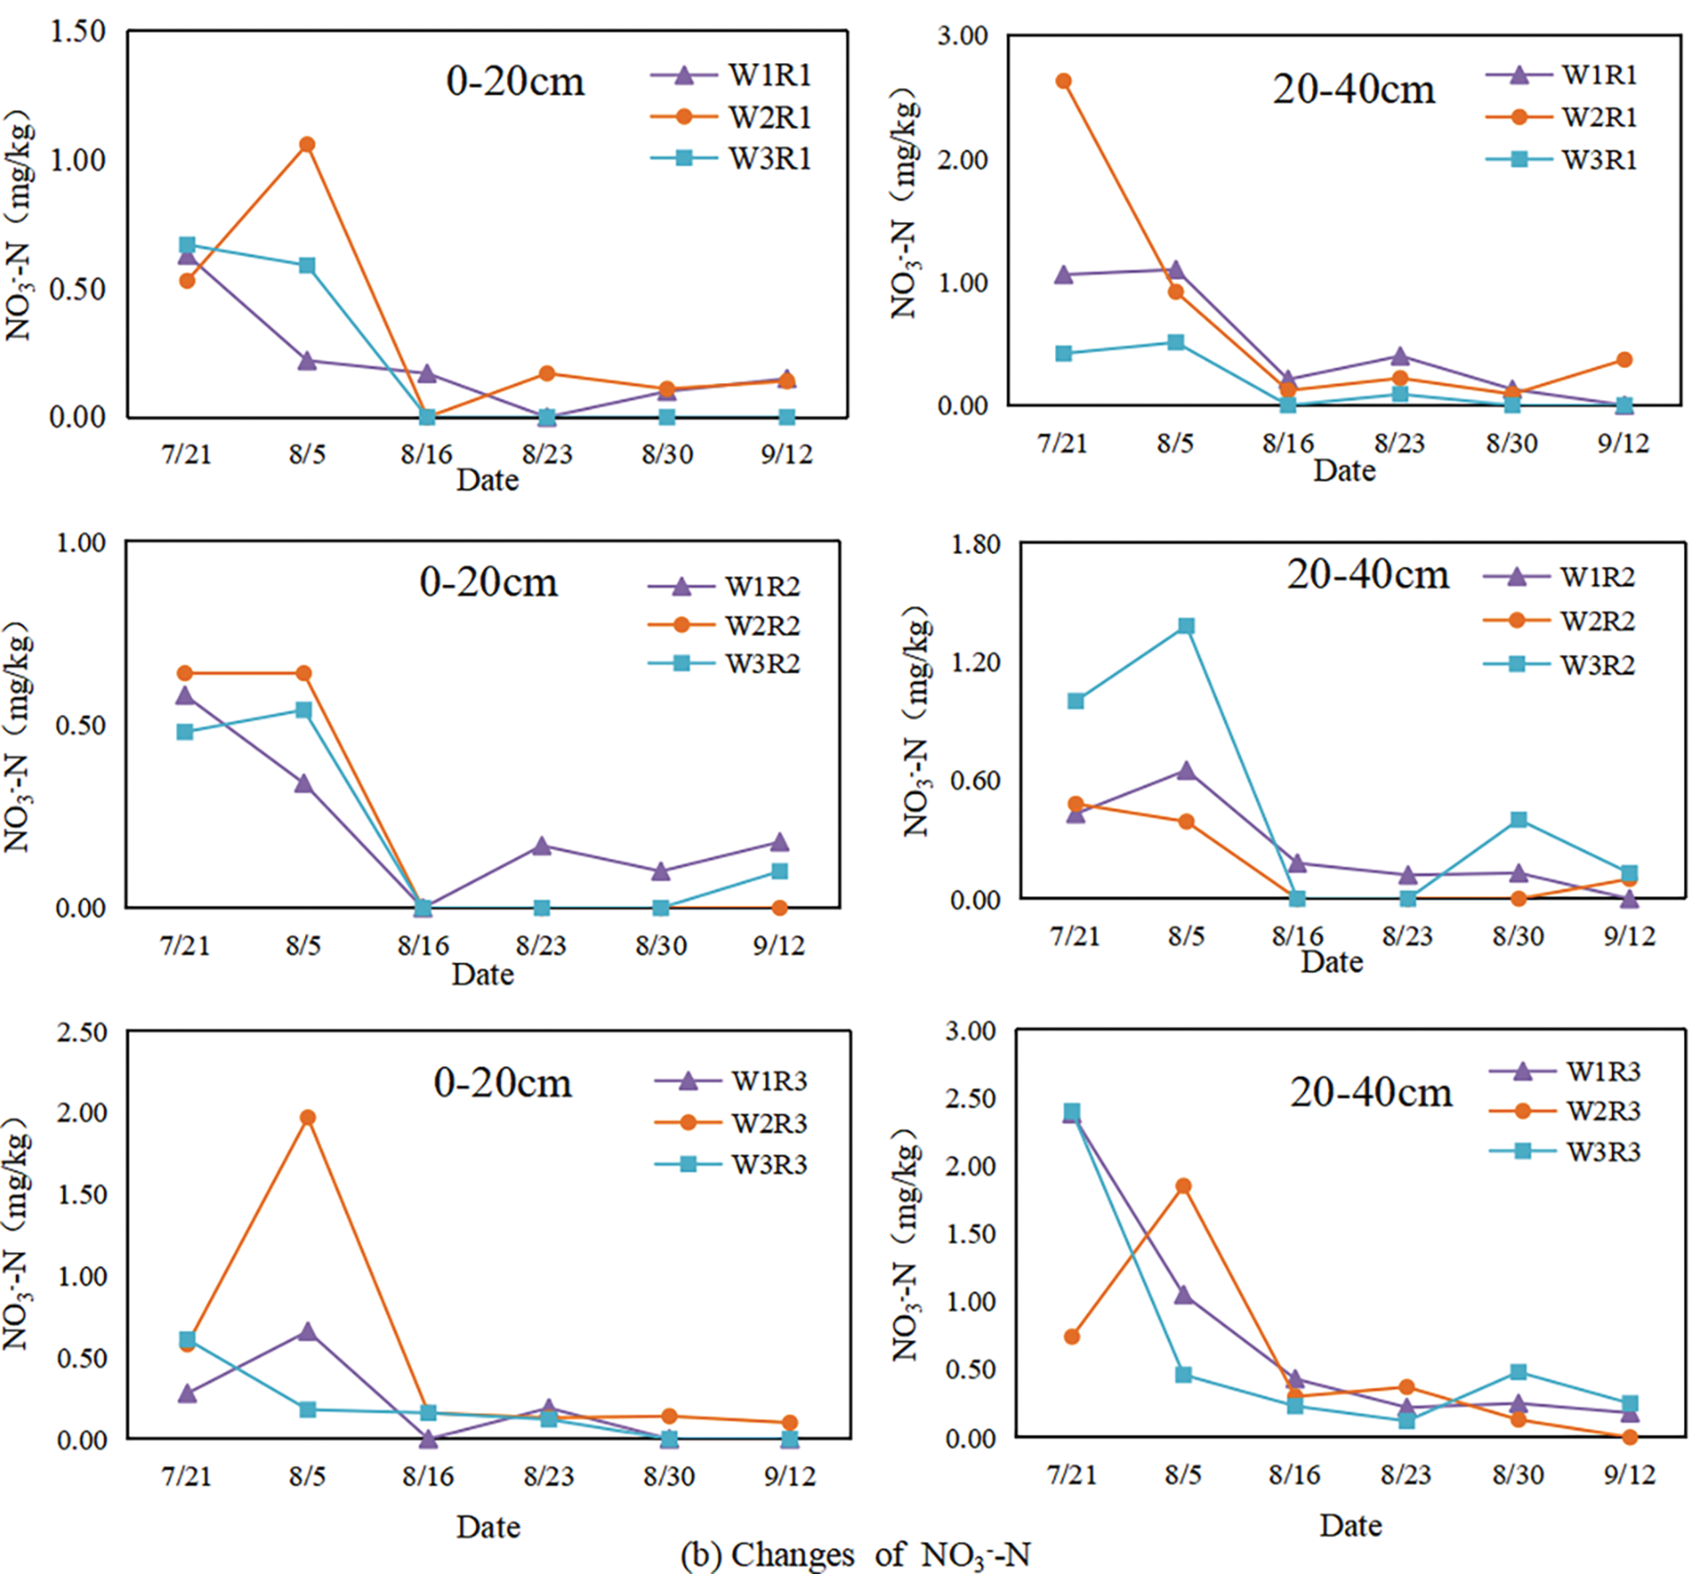
Figure 3: Changes of nitrogen concentration in paddy soils under different irrigation sources and water levels during the whole growth period
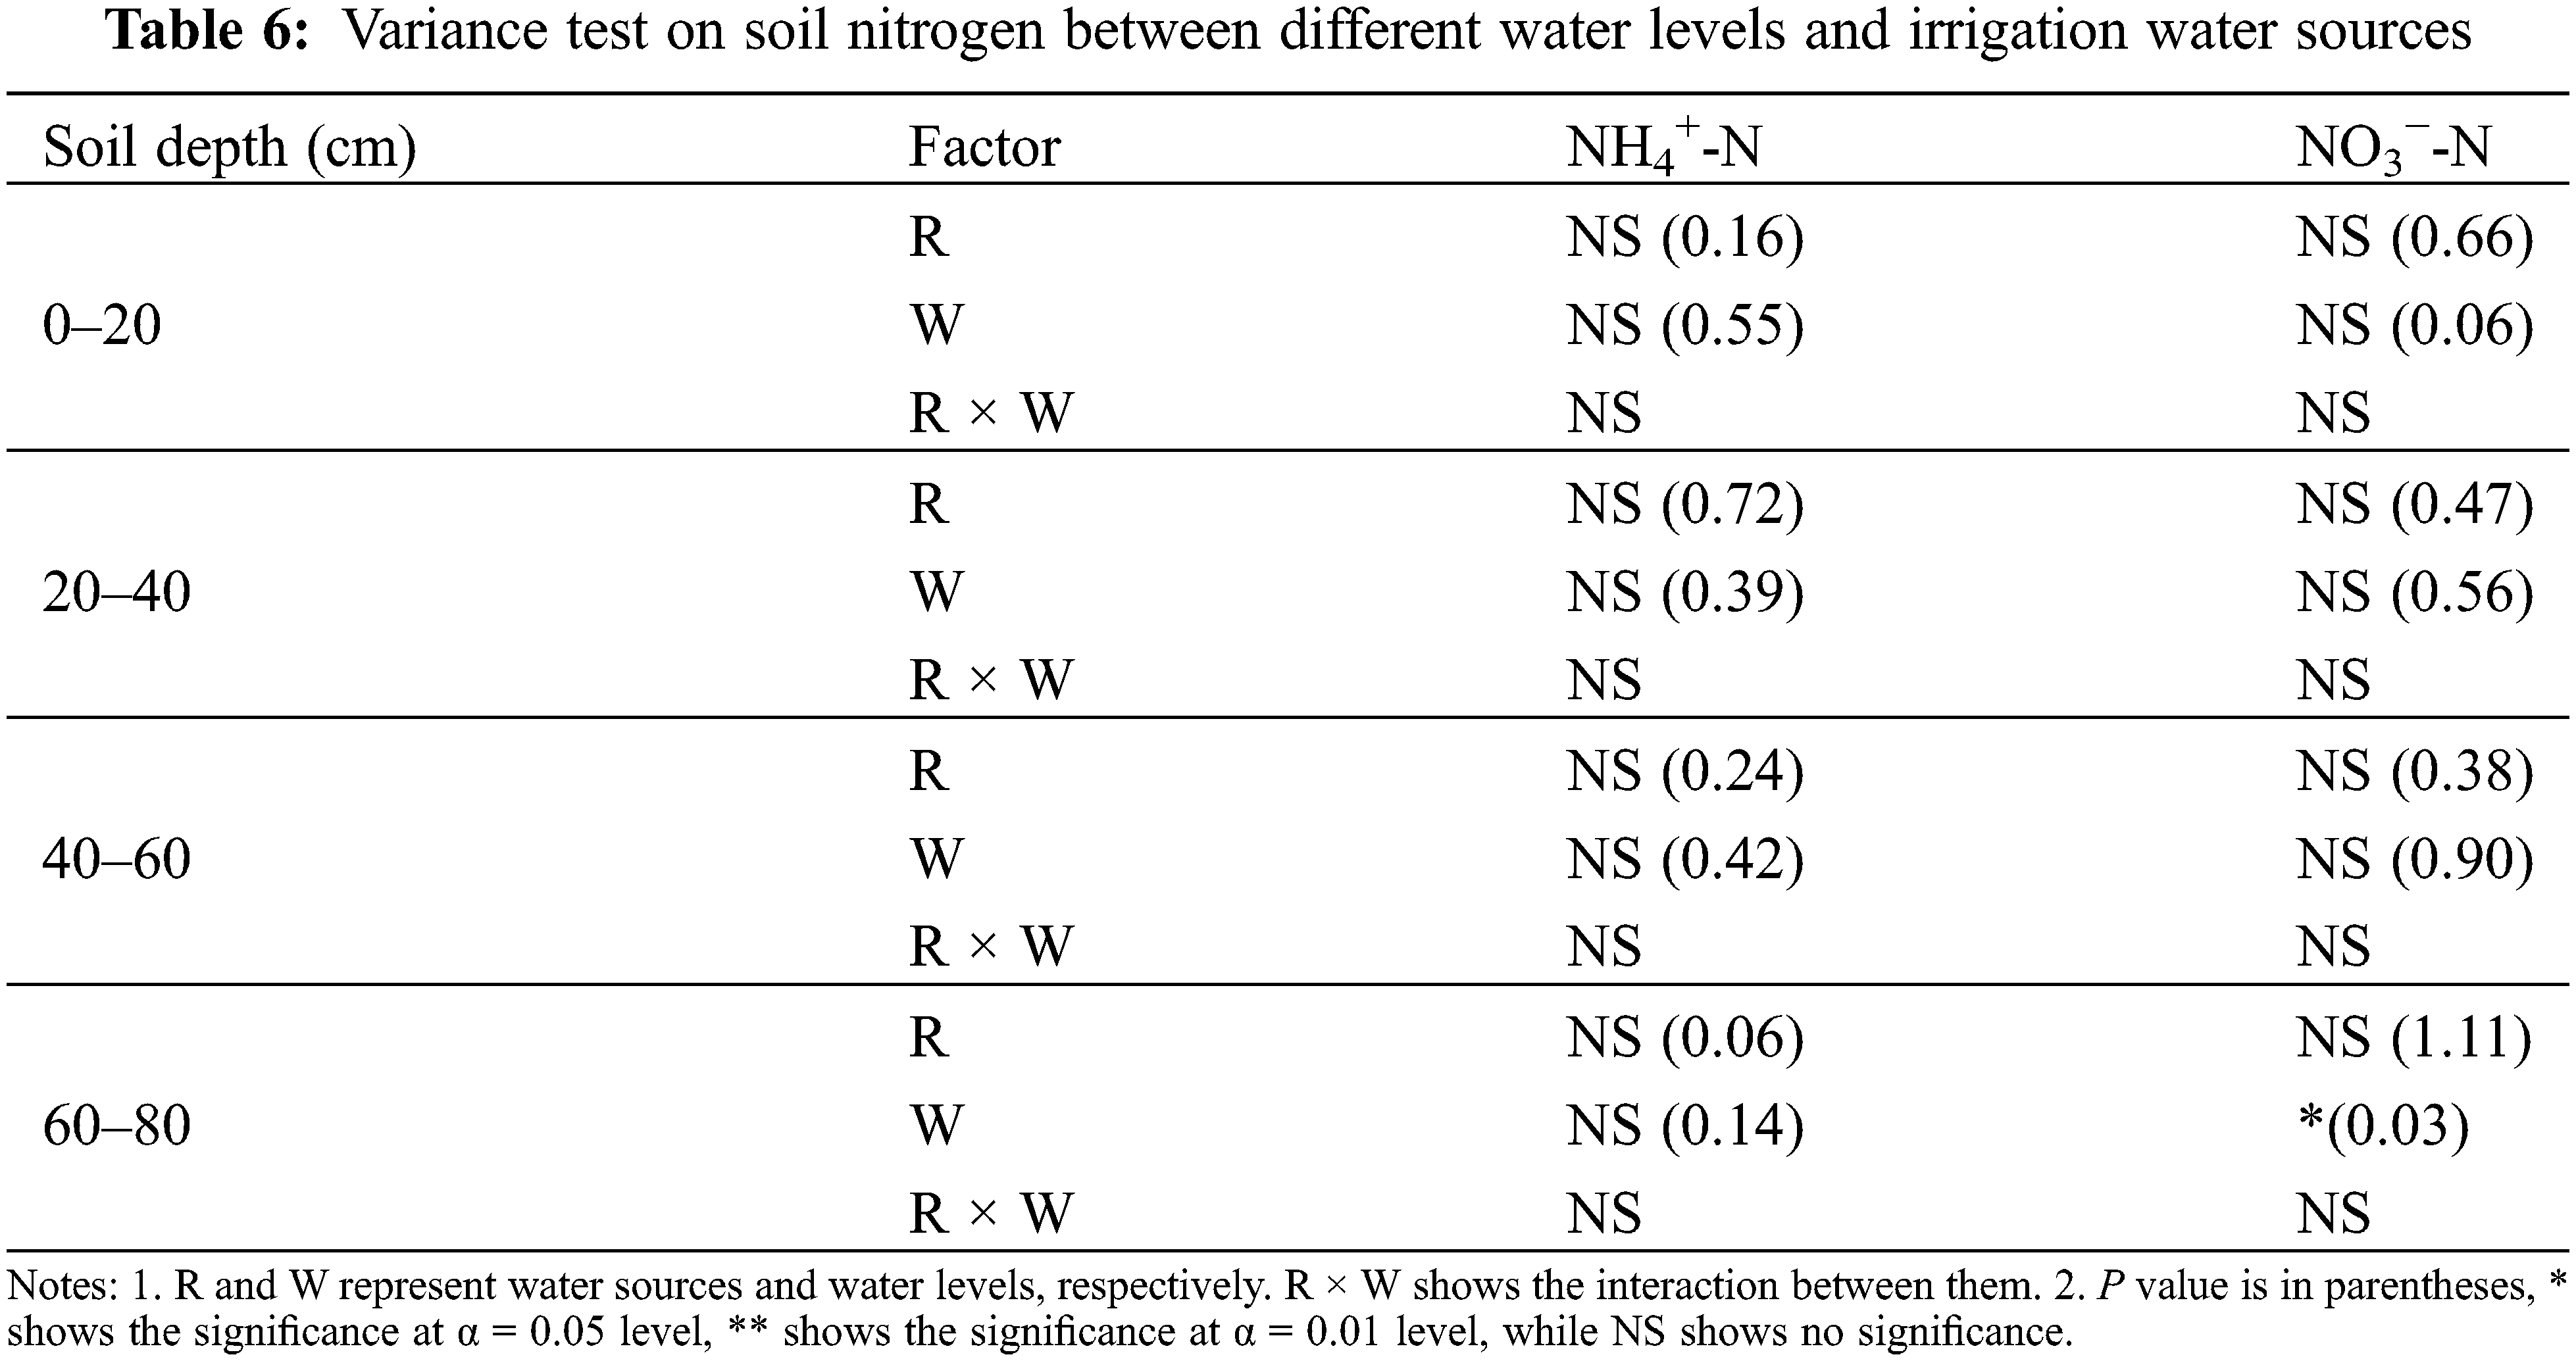
The changes of NH4+-N and NO3−-N concentration in the 0–80 cm soil layer at the beginning and end of the rice growth period are shown in Fig. 4. For the middle and low water levels (W1 and W2) under R1, the NH4+-N concentration increased in the 40–60 cm soil layer while it decreased in the other soil layers. They changed greatly in the 0–20 cm soil layer, namely decreased by 78.2% and 61.3%, respectively, while the NH4+-N concentration increased slightly in every soil layer for W3. The NH4+-N concentration of each soil layer decreased under R2, and changed mostly in the 0–20 cm soil layer for the W1 and W2 water levels, while it decreased mostly in the 60–80 cm soil layer for W3, namely 96.8%. Under R3, the concentration of NH4+-N decreased in the 0–60 cm soil layers while it decreased for W1 and increased for W2 and W3 in the 60–80 cm soil layer. It can be seen that, compared with river water irrigation, the soil’s NH4+-N concentration fluctuated greatly under the reclaimed water irrigation, and the pollutant concentration in the high water level control of R1 was higher. Since it was clear that NH4+-N concentration in R1 was highest according to Table 2, and higher water level also brought in more nitrogen pollutants, which both led to the increase of NH4+-N concentration in the soil layer. Compared with the change of NH4+-N, the concentration of NO3−-N in the soil was lower and the fluctuation was smaller. The concentration of NO3−-N in the 0–20 cm soil layer under R1 gradually increased with the increase of water level, and decreased for W1 and increased obviously for W3, while there was not much difference for W2. In the 20–40 cm soil layer, the NO3−-N concentrations all rose, and it increased gradually with the increase of the water level, which was consistent with that of the 0–20 cm soil layer. The difference of increasing rate was not big in the 40–60 cm soil layer. The NO3−-N concentration in the 60–80 cm soil layer decreased, illustrating that the effect of R1 and water level control on the increase of NO3−-N in the upper soil layer was greater. Under R2, the concentration of NO3−-N in each soil layer for W1 and W2 decreased, while it increased for W3, and it increased greatly in the 40–60 cm soil layer, namely from 0 to 1.34 mg/kg. Under R3, the NO3−-N concentration at the 40–60 cm soil layer changed mostly and all increased, with an average increase of 1.9 mg/kg. This is due to the leaching effect that NO3−-N migrates downward with water, which is easier to lead to the accumulation in the deep layers of soil. The results of variance test (Table 6) showed that different water levels and irrigation water sources had no significant effects on the changes of NH4+-N concentration in each soil layer, and different water levels had significant effect on the changes of NO3−-N in the 60–80 cm soil layer, while water source conditions and water levels had no significant influence on the changes of NO3−-N concentrations at the other soil layers (0–20, 20–40, and 40–60 cm).
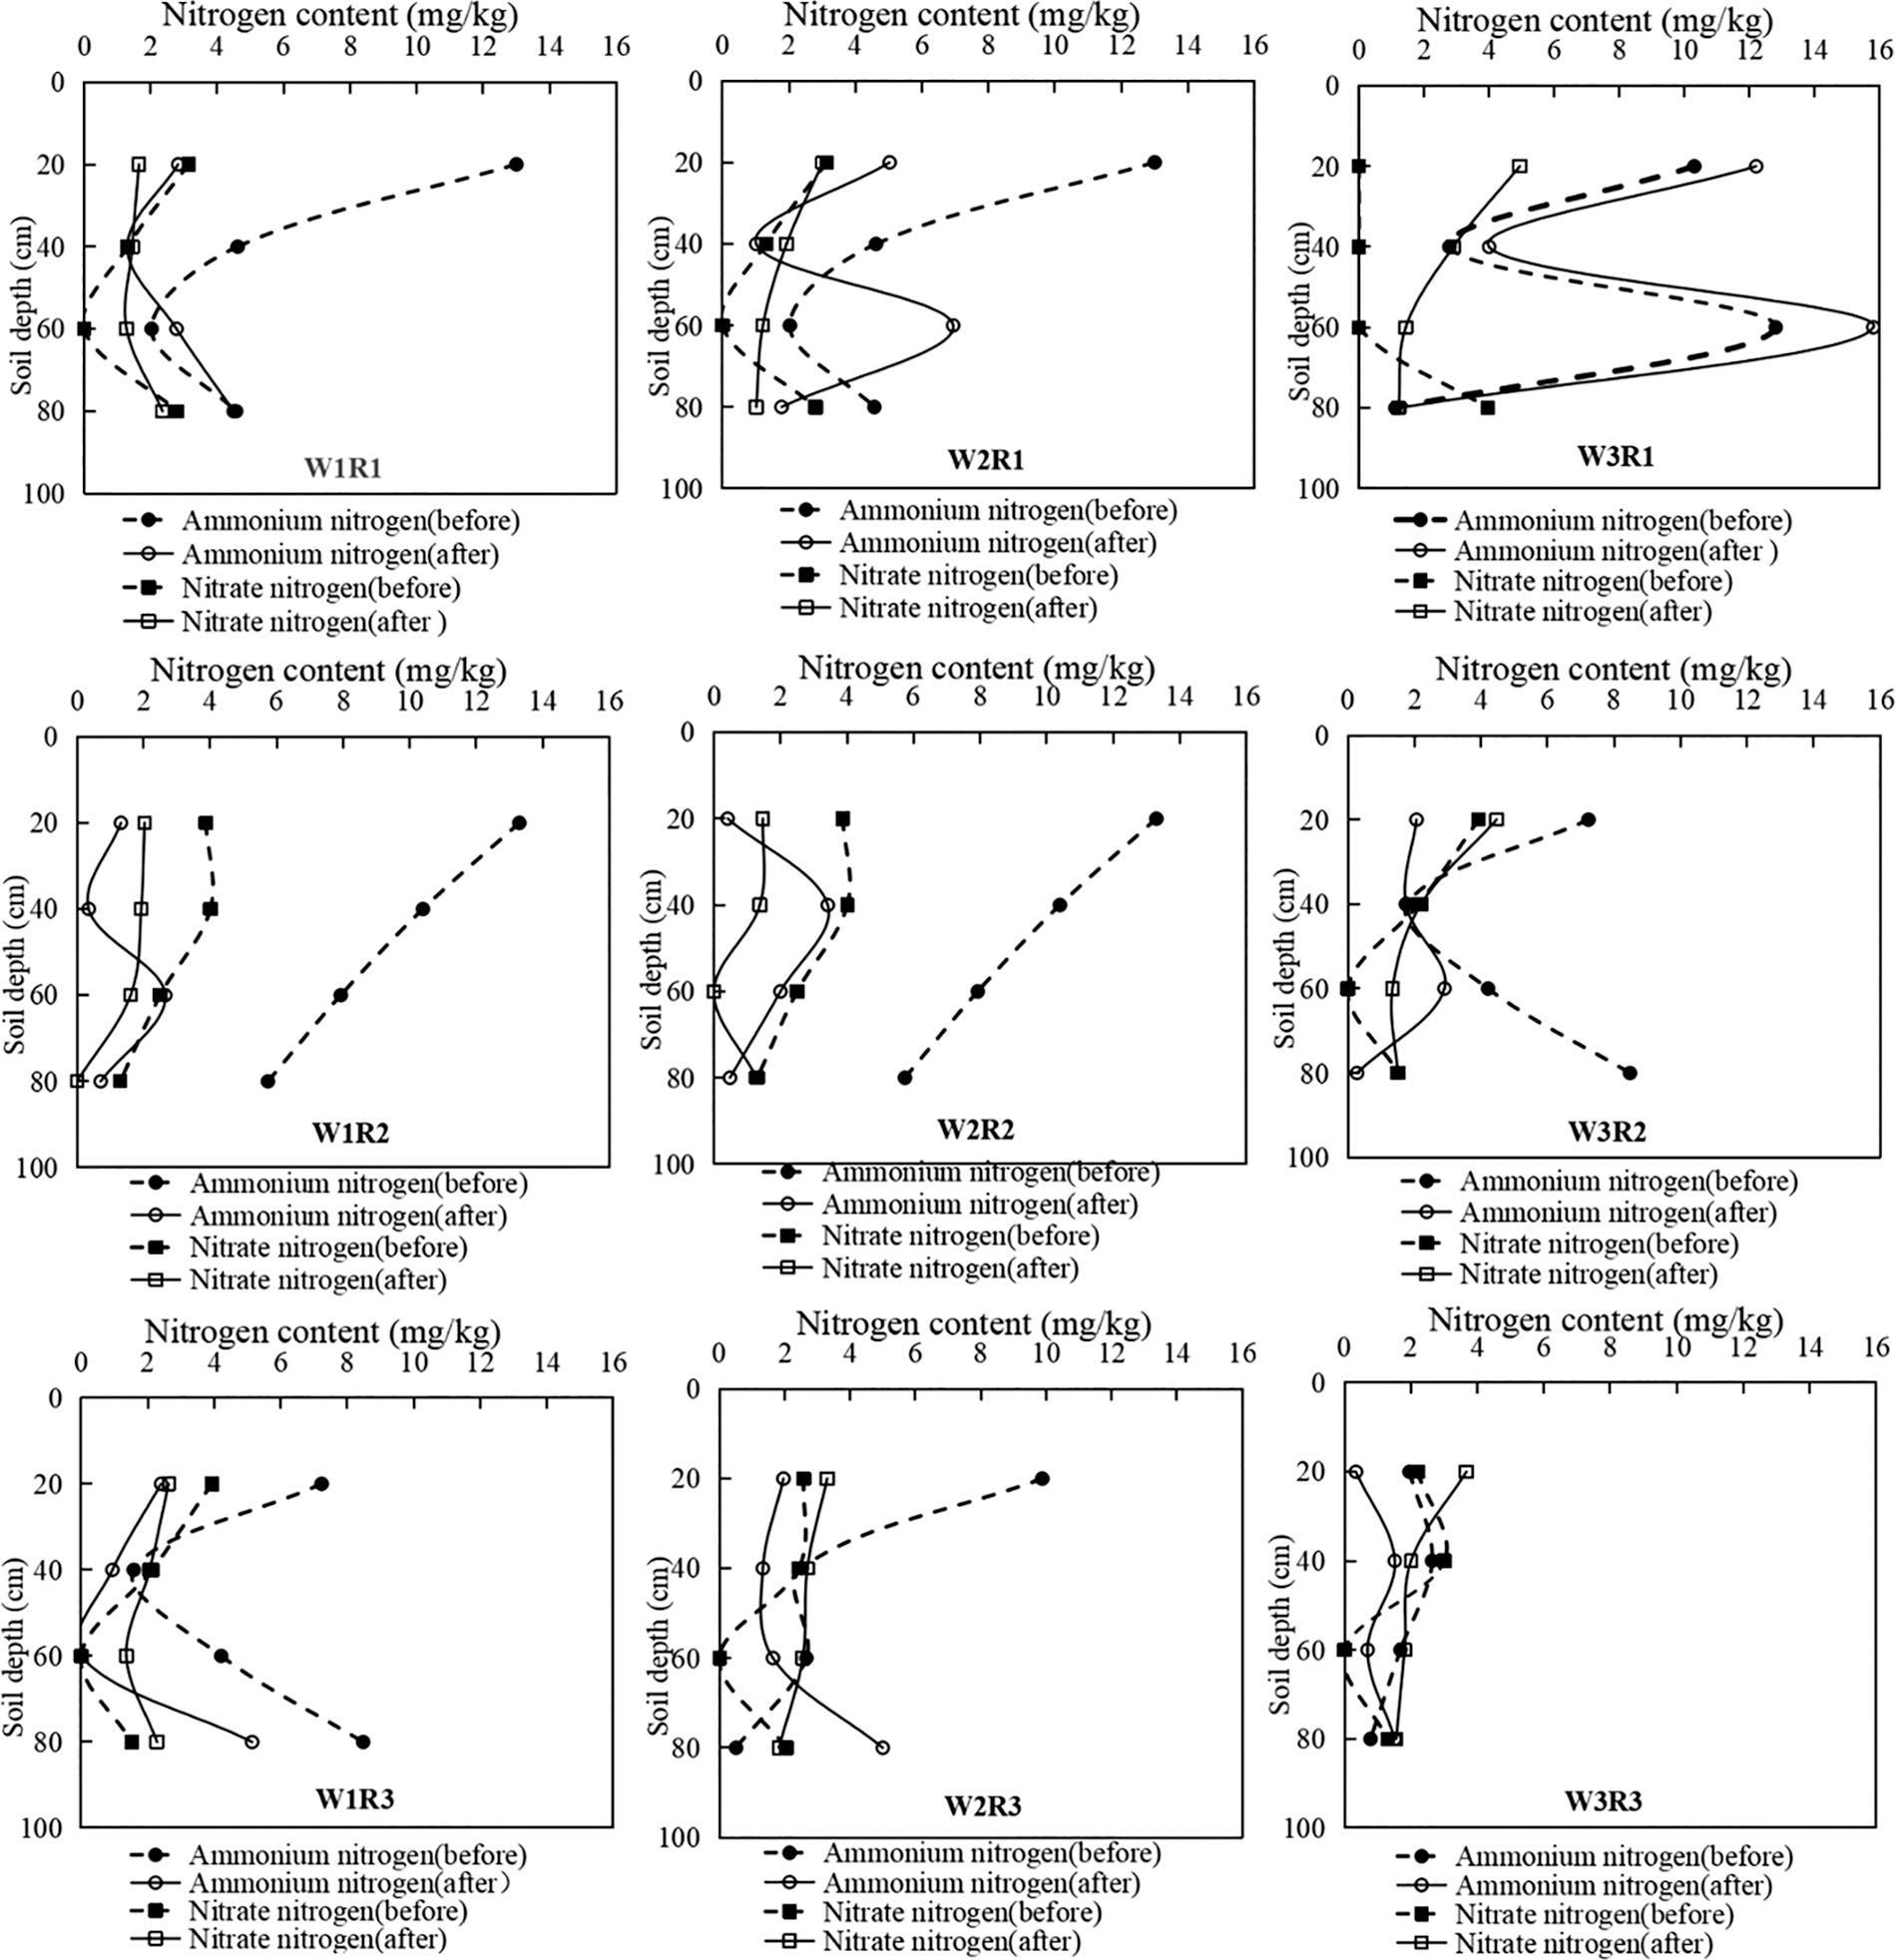
Figure 4: Changes of nitrogen concentration in paddy soils under different irrigation sources and water levels at the beginning and end of the growing period
3.4 Effect on Water Use Efficiency
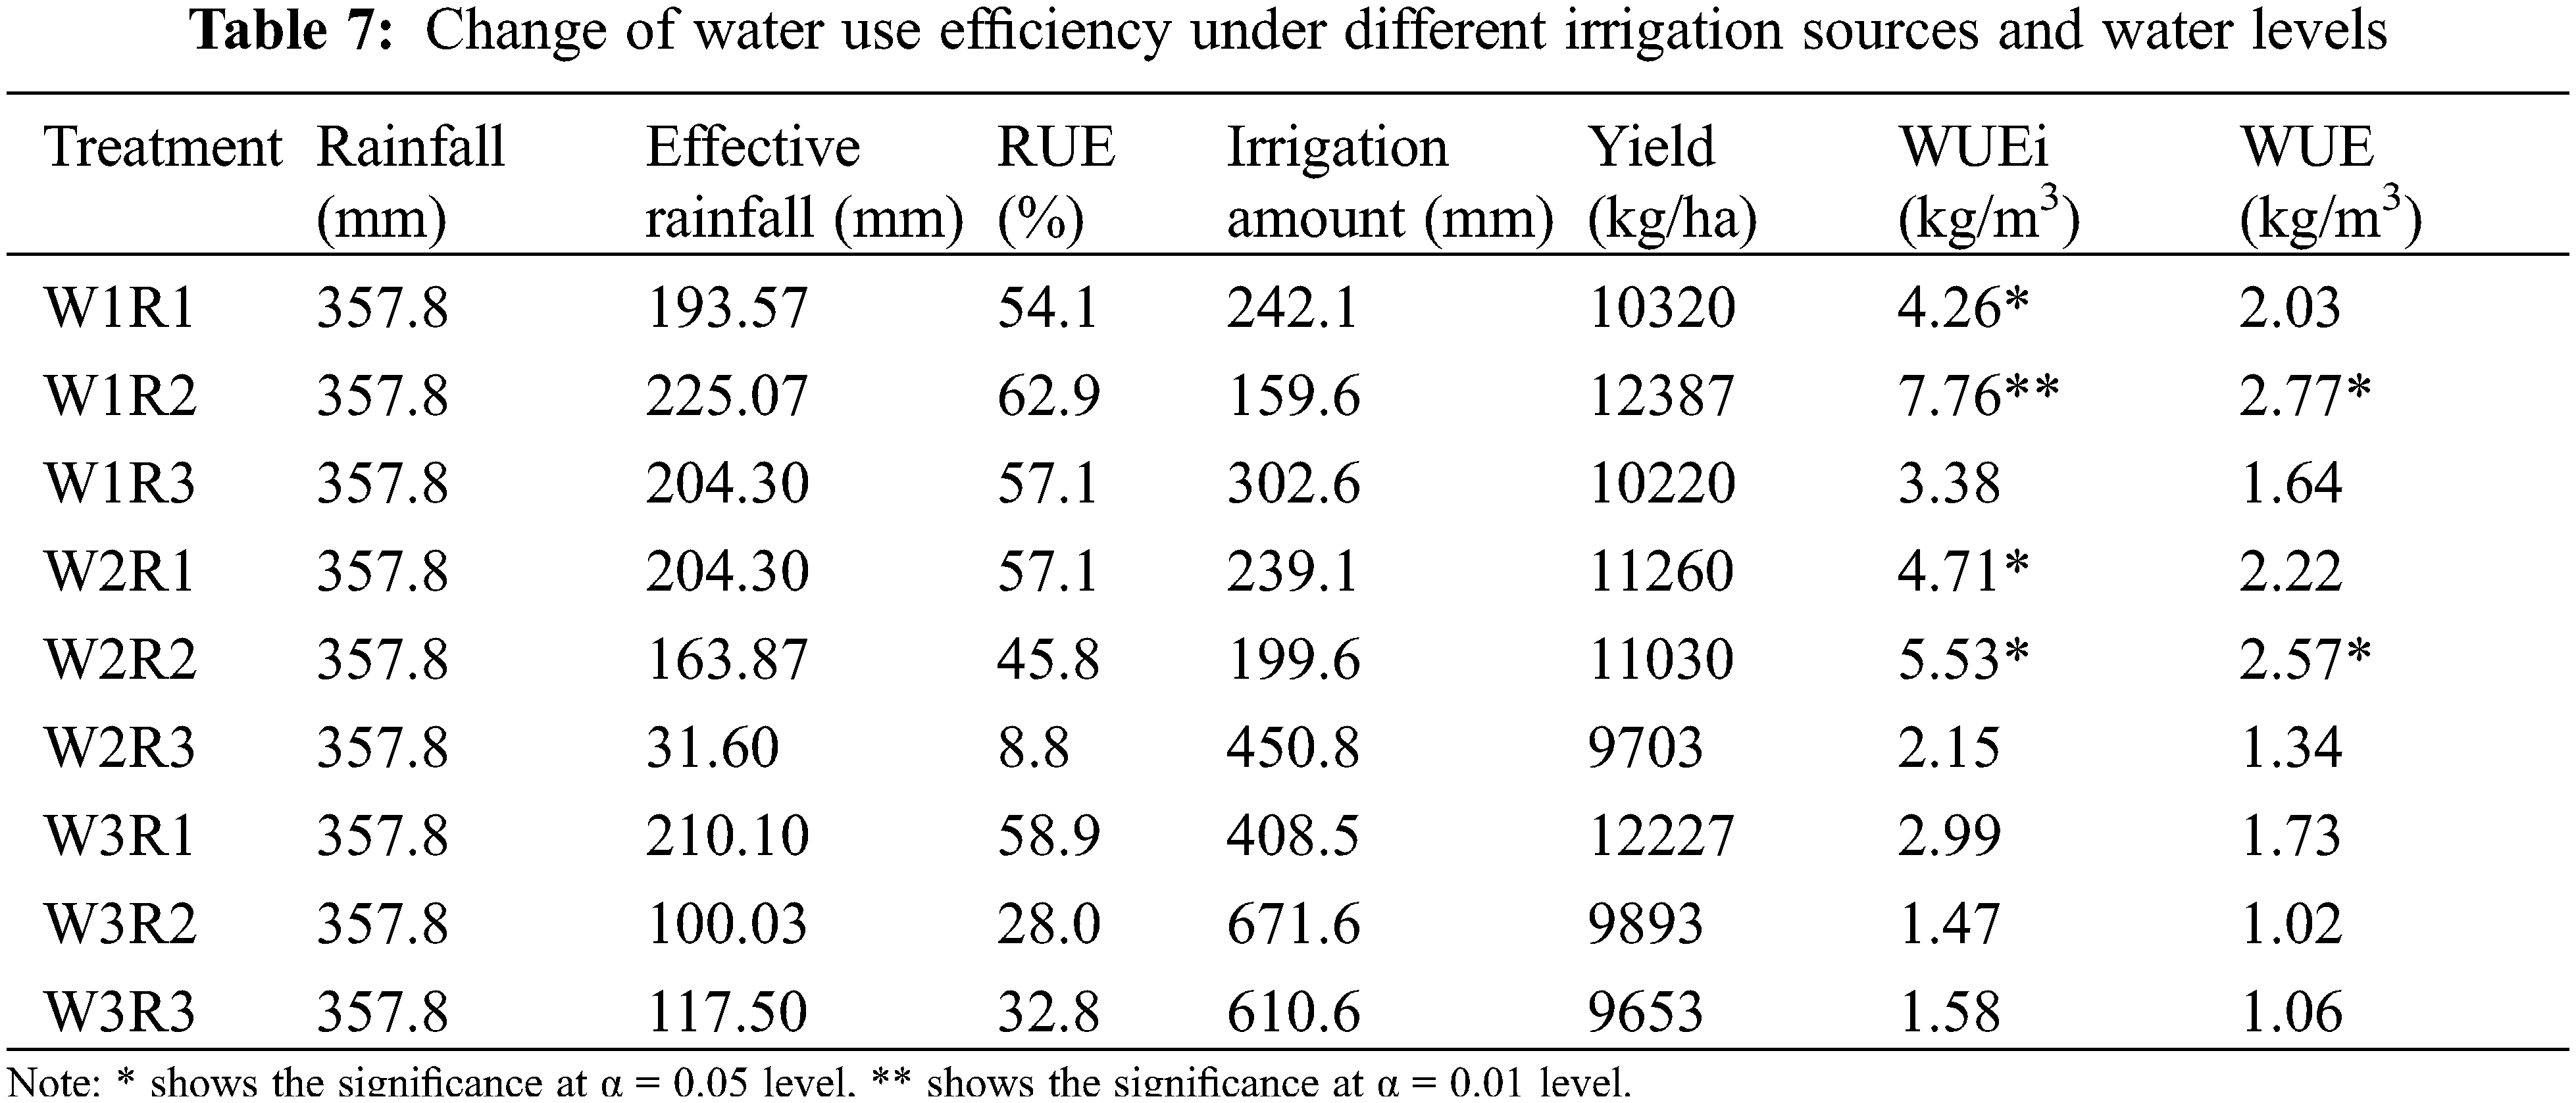
Effective rainfall refers to the rainfall kept in the field and absorbed and used by crops. It is the difference between the total rainfall and the water drainage and leakage. The rainfall’s effective utilization rate (RUE) is the ratio of the effective rainfall and the total rainfall. Irrigation water use efficiency (WUEi) refers to the efficiency generated by the total irrigation water volume, which is the ratio of the actual rice yield and the total irrigation water volume. Crop’s water use efficiency (WUE) refers to the efficiency generated by the total irrigation volume and effective rainfall. The changes of water use efficiency under different irrigation water sources and water levels are shown in Table 7. It can be seen that RUE for W1, W2, and W3 were 58.0%, 37.2%, and 39.9% respectively. Therefore, the RUE under the low water storage level in the paddy field was the largest. WUEi for W1, W2, and W3 were 6.01, 5.12, and 2.23 kg/m3, respectively. It can be seen that as the field water level increased, the WUEi gradually decreased. The high water level is not conducive to the use of reclaimed water. WUEi under R1, R2, R3 conditions were 3.99, 4.92, and 2.37 kg/m3 respectively. WUEi under R1 and R2 were 1.7 times and 2.1 times of that under R3. Therefore, WUEi under R2 increased much more obvious. WUE for W1, W2, and W3 were 2.15, 2.04, and 1.27 kg/m3, respectively. It can be seen that as the field water storage level increased, WUE gradually decreased, which was consistent with the changes of WUEi. WUE under R1, R2, R3 were 1.99, 2.12, and 1.35 kg/m3, respectively, and they were 1.5 times and 1.6 times under the primary and secondary reclaimed water irrigation treatments of that under the clean water treatment.
3.5 Effect on Nitrogen Utilization in Paddy Field
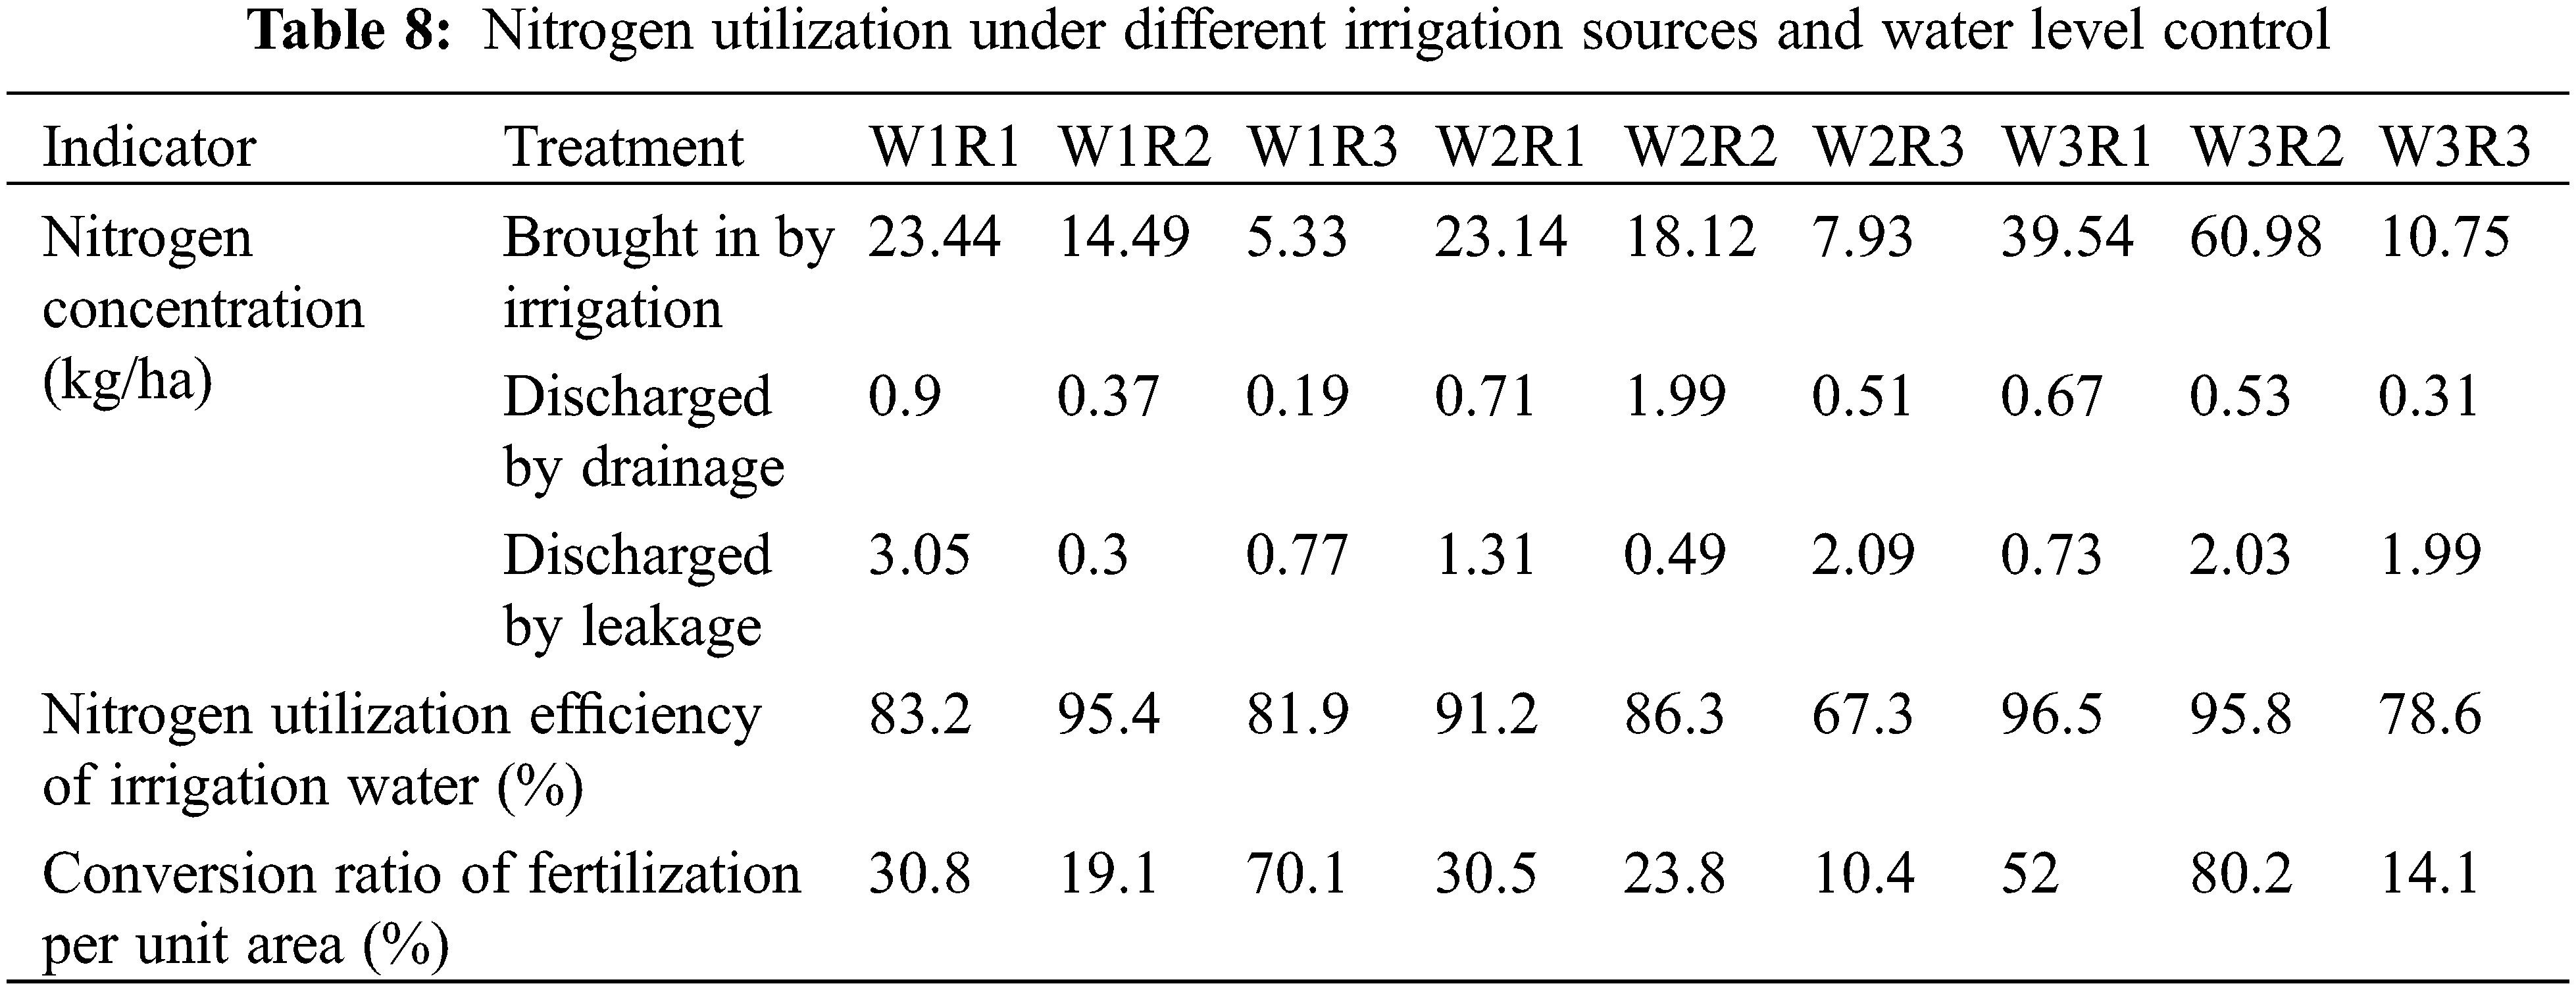
Nitrogen utilization in paddy field under different irrigation water sources and water levels is shown in Table 8. It can be seen that the nitrogen utilization efficiency (NUE) under R1 and R2 was significantly higher than that under R3. For W1, NUE under R1 and R2 was 1.6% and 16.5% higher than that under R3, respectively. For W2, NUE under R1 and R2 was 35.5% and 28.2% higher than that under R3, respectively. For W3, NUE under R1 and R2 was 22.3% and 21.9% higher than that under R3, respectively. Therefore, NUE was higher under R2 with low water level control, while for medium and high water levels (W2 and W3), it was higher under R1. For the same water source irrigation, NUE increases as the water level rises under R1, while NUE of middle and lower water levels (W1 and W2) was lower under R2 and R3. Since the irrigation water contains a certain amount of nitrogen, especially for reclaimed water, it can replace fertilizers applied to the paddy field to a certain extent. By converting the nitrogen concentration in the irrigation water to the amount of fertilizer per unit area, the R1, R2, and R3 can reduce the fertilizer application amount by 37.8%, 41.1%, and 10.5%, respectively. Therefore, the result of saving fertilizer to a certain extent can be achieved.
The effects of different irrigation water sources and water levels on rice’s yield factors and quality are shown in Table 9. It can be seen that the number of productive spikes increased as the water level rose under R1 and R2, while it had little correlation with R3. Under the same water level control, the thousand-grain weight of rice under all water source conditions is expressed as R1 < R2 < R3. Therefore, the thousand-grain weight of rice under the reclaimed water irrigation was significantly reduced, and it decreases as the concentration of pollutants in the water increased. Compared with R3, the thousand-grain weight under R1 and R2 was reduced by 9.2% and 11.1% for W1, by 5.9% and 3.8% for W2, and by 17.8% and 5.9% for W3, respectively.
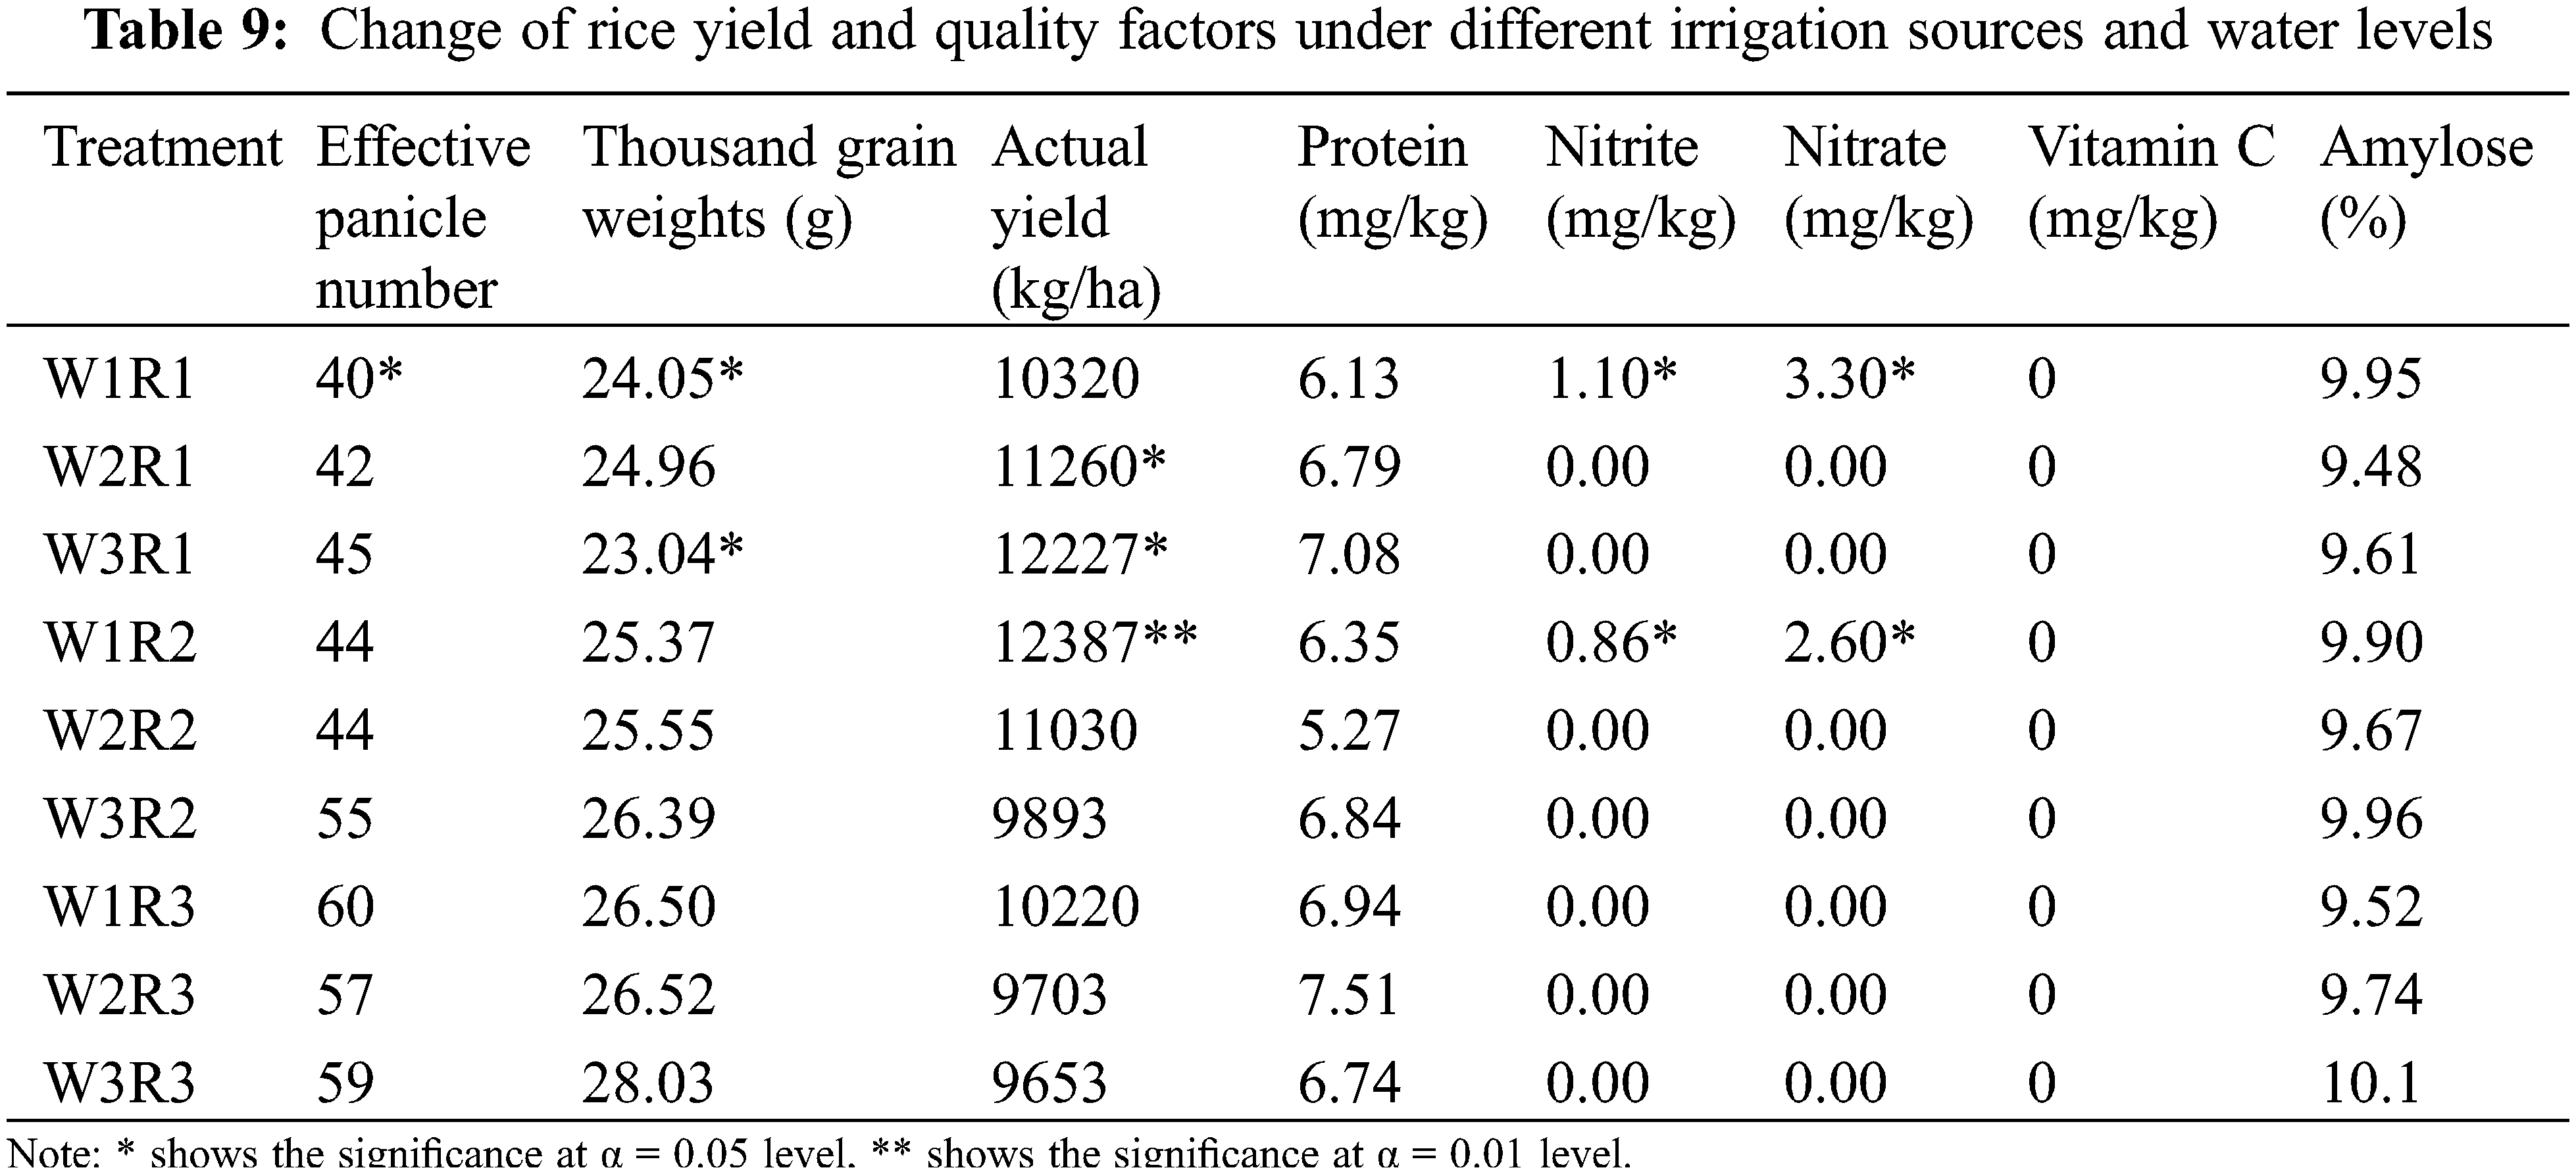
The average actual rice yield under R1 and R2 was 14.3% and 12.6% higher than that under R3, respectively. For the same irrigation water source, the yield increased significantly as the water level rose under the R1, while it was opposite to that under R2 and R3. For both of them, the highest yield occurred under the low water level of W1. The average rice yield under R1 was 1.5% and 14.3% higher than that under R2 and R3, respectively. The average rice yield under different water levels showed the changing trend of W1 > W2 > W3. The yield of W1 was 2.9% and 3.6% higher than that of W2 and W3 respectively. Therefore, the excessively high water level is not conducive to the increase of rice yield. This may be due to the high water level that inhibits the permeability of soil and roots, thereby inhibiting the yield of rice.
The average protein concentration under R1, R2, and R3 were 6.47, 6.52, and 6.89 mg/kg, respectively. The protein concentrations under R1 and R2 were 6.1% and 5.4% lower than that under R3. The average concentration of amylose under R1, R2 and R3 was 9.79%, 9.63%, and 9.89%, respectively. The amylose concentrations under R1 and R2 were 1.0% and 2.6% lower than that under R3, so reclaimed water irrigation might reduce the concentration of protein and amylose in rice. Under R1, as the water level increased, the protein concentration increased and the amylose concentration decreased; however, it was opposite to that under R3. The protein concentration under R2 was expressed as W3 < W2 < W1, and the amylose concentration was expressed as W2 < W1 < W3. The concentration of nitrate and nitrite in rice was highest under R1, but they both decreased with the increase of the field water level. This was mainly due to the higher nitrogen utilization efficiency of reclaimed water under W2 (91.2%) and W3 (96.5%), which were higher than that under W1 (83.2%). The concentration of nitrate and nitrite in rice in all treatments complied with the limit requirements of contaminants in rice according to the national food safety standard GB 2762-2017 (Nitrite and nitrate < 20 mg/kg). The rice under R2 and R3 did not contain neither nitrate nor nitrite. Vitamin C was not detected in all treatments. Therefore, secondary reclaimed water (R2) will not affect the safety of rice according to GB 2762-2017.
In this study, nitrogen utilization efficiency could be promoted with reclaimed water irrigation, achieving the effect of fertilizer saving, which was consistent with other researcher’s conclusions [6,8,33]. It was also found that sewage irrigation was helpful to increase soil nutrients concentration and micro-organism activity, such effect was more obvious with time growing [19]. With sewage irrigation, soil nitrogen was prone to loss due to strong nitrification and denitrification operations, resulting in groundwater pollution with NO3− migrating downward [34]. As the amount of fertilizer increased, the partial productivity of nitrogen fertilizer decreased with sewage irrigation [35,36]. According to Gwenzi’s study, the total nitrogen and available nitrogen in 0–30 cm soil layers were greatly improved with long-term treated sewage effluent (P < 0.05) [37], which was different from the results of this study. This was mainly due to the short research period of our study. There were other studies indicating that long-term sewage irrigation could increase soil nitrogen concentration and nitrogen utilization efficiency [38].
According to other researches, sewage irrigation could improve crop growth and yield without affecting crop quality [25]. With sewage irrigation, the total nitrogen and available nitrogen concentration at the root soil layer were lower than the treatment with river water irrigation, and total nitrogen concentration in plant was 48% [39].
In this study, an appropriate increase in the field storage depth will help to increase the thousand-grain weight of paddy rice under each treatment, but the excessively high water level inhibited the thousand-grain weight of paddy rice under R1 condition, and has no such inhibitory effect under R2 and R3. This may be due to the high concentration of pollutants in R1, and the excessively high water level effects on root respiration and soil permeability, while the pollutants in R2 were relatively low, so the inhibitory effect on the root system was not obvious. It can be seen that the reclaimed water irrigation can significantly increase rice yield, which is highly consistent with other researcher’s conclusions [23]. Also, as the field water level rised, the yield promotion effect under R1 was more obvious. This may be due to the high concentration of nutrient elements for R1 under high water level conditions; thus, soil nutrients were sufficient, which was conducive to the formation of rice yield.
However, all the conclusions obtained above were on the basis of the sandy/sandy clay soil in our experimental site. Whether the results are applicable to other soil conditions still needs to be studied. In addition, all the results above were on the basis of one-year experimental data; the issues whether long-term reclaimed water irrigation will harm plants, and soil and water environments still needs to be studied. Jobs dealing with how to avoid the toxicity problems and how to conduct studies on soil decontamination measurements will be meaningful.
This work studied the mechanism of different irrigation water sources (primary and secondary water treatments for rural sewage, and clear river water) and different water level controls (low water level, middle water level, and high water level) on the water and nitrogen utilization and growth of rice in Southern China. With reclaimed water irrigation, the peak of rice water consumption was delayed. Rainfall utilization was largest under the high water level control in the paddy field, while the water use efficiency of irrigation and crop decreased gradually with the increase of the water storage level in the paddy field. The nitrogen utilization efficiency under rural sewage irrigation was significantly higher than that under river water irrigation. From the perspective of the amount of fertilizer per unit area, reclaimed water irrigation can reduce the fertilizer application by 39.5% on average. Rice yield could significantly increase under irrigation with reclaimed water, while such increase effect of yield was more obvious as the field water level rose. The concentration of protein and amylose in paddy rice irrigated by rural sewage was lower than that by river water irrigation. The concentration of nitrate and nitrite in paddy rice under primary reclaimed water irrigation was the highest. The combination of secondary reclaimed water irrigation with middle water level control was beneficial to improve nitrogen utilization efficiency, crop yield and crop quality, at the same time satisfying the safety of rice.
Authorship: The authors confirm contribution to the paper as follows: study conception and design: Menghua Xiao; data collection: Yuanyuan Li; analysis and interpretation of results: Menghua Xiao, Shizong Zheng; draft manuscript preparation: Yuanyuan Li. All authors reviewed the results and approved the final version of the manuscript.
Acknowledgement: We fully appreciate the editors and all anonymous reviewers for their constructive comments on the manuscript.
Funding Statement: Our research was financially supported by National Key Research and Development Program (2019YFC0408803), Basic Public Welfare Research Project of Zhejiang Province (LGN20E090001), Major Scientific and Technological Projects of Zhejiang Provincial Department of Water Resources (RA1913), Water Conservancy Science and Technology in Zhejiang Province (RC1918, RC2029), and National Natural Science Foundation of China (52009044). We are also thankful to the reviewers and the editor for their valuable comments, corrections and suggestions.
Conflicts of Interest: The authors declare that they have no conflicts of interest to report regarding the present study.
References
1. Wang, D., Li, G. Y., Mo, Y., Cai, M. K., Biao, X. Y. (2018). Evaluation of optimal nitrogen rate for corn production under mulched drip fertigation and economic benefits. Field Crops Research, 216(1), 225–233. DOI 10.1016/j.fcr.2017.10.002. [Google Scholar] [CrossRef]
2. Kuscu, H., Turhan, A., Ozmen, N., Aydinol, P., Demir, A. O. (2014). Optimizing levels of water and nitrogen applied through drip irrigation for yield, quality, and water productivity of processing tomato (Lycopersicon esculentum Mill.). Horticulture Environment and Biotechnology, 55(2), 103–114. DOI 10.1007/s13580-014-0180-9. [Google Scholar] [CrossRef]
3. Jiang, J., Zhai, D. P., Zhang, C. B. (2019). Effects of irrigation and fertilizer levels on the distribution of water and salt in saline field and maize yield. Journal of Applied Ecology, 30(4), 1207–1217. [Google Scholar]
4. Li, M. Y., Wang, X. G., Xu, X. F., Duan, Q. Q., Xue, L. H. et al. (2020). Effects of treated domestic sewage irrigation on ammonia volatilization in straw-returning paddy fields. Agro-Environmental Science, 39(7), 1623–1632. [Google Scholar]
5. Xu, Z. R., Ye, H. Y., Zhuo, M., Xu, M. Z., Wu, L. (2015). Status quo and strategies of rural sewage treatment in Zhejiang province. Ecology & Rural Environment, 31(4), 473–477. [Google Scholar]
6. Guo, W. J., Chen, L., Li, L. D., Tang, X. Q. (2020). Present situation and countermeasures of domestic sewage treatment in rural area–A case study on Yongkang City of Zhejiang Province. China Water Resource, 2, 68–70. [Google Scholar]
7. Zhou, Y., Li, P., Qi, X. B., Hu, C., Guo, W. (2016). Influence of nitrogen rate on nitrogen release pattern in soil irrigated with reclaimed wastewater. Acta Science Circumstance, 36(4), 1369–1374. [Google Scholar]
8. Wang, Z., Li, J. S., Li, Y. F. (2017). Using reclaimed water for agricultural and landscape irrigation in China: A review. Irrigation and Drainage, 66(5), 672–686. DOI 10.1002/ird.2129. [Google Scholar] [CrossRef]
9. Li, Y. K., Li, J. S., Zhao, W. X., Wang, Z. (2015). Review on irrigation technology applying sewage effluent—Advances and prospects. Tanslation of Chinese Society of Agricultural Machinery, 46(6), 102–109. [Google Scholar]
10. Cui, B. J., Gao, F., Hu, C. (2019). The use of brackish and reclaimed waste water in agriculture: A review. Irrigation and Drainage, 38(7), 60–68. [Google Scholar]
11. Jing, R., Cui, E., Fan, X., Hu, C., Li, Z. Y. et al. (2019). Effects of different potassium (K) fertilizers on cadmium concentration in soil-crop system under reclaimed water irrigation. Journal of Soil and Water Conservation, 33(1), 328–339. [Google Scholar]
12. Njuguna, S. M., Makokha, V. A., Yan, X., Gitutu, R. W., Wang, Q. F. et al. (2019). Health risk assessment by consumption of vegetables irrigated with reclaimed waste water: A case study in Thika (Kenya). Journal of Environmental Management, 231, 576–581. DOI 10.1016/j.jenvman.2018.10.088. [Google Scholar] [CrossRef]
13. SEPA (State Environmental Protection Administration) (2002). Discharge standard of pollutants for municipal wastewater treatment plant. China: GB18918-2002. https://max.book118.com/html/2018/1224/6022211042001241.shtm. [Google Scholar]
14. Liu, Y. W., Xue, L. H., Yang, L. Z., Wang, Y. M. (2018). Effects of sewage irrigation on growth of rice seedlings and soil environment with straw incorporation. Chinese Journal of Applied Ecology, 29(8), 2739–2745. [Google Scholar]
15. Adeh, A., Varco, J. J., Rowe, D. E. (2003). Swine effluent irrigation rate and timing effects on bermudagrass growth, nitrogen and phosphorus utilization, and residual soil nitrogen. Journal of Environmental Quality, 32(2), 681–686. DOI 10.2134/jeq2003.6810. [Google Scholar] [CrossRef]
16. Marofi, S., Shakarami, M., Rahimi, G., Ershadfath, F. (2015). Effect of wastewater and compost on on leaching nutrients of soil column under basil cultivation. Agricultural Water Management, 158(11), 266–276. DOI 10.1016/j.agwat.2015.05.007. [Google Scholar] [CrossRef]
17. Pereira, B. F., He, Z., Stoffella, P. J., Montes, C. R., Melfi, A. J. et al. (2012). Nutrients and nonessential elements in soil after 11 years of wastewater irrigation. Journal of Environmental Quality, 41, 920–927. [Google Scholar]
18. Lu, S. B., Zhang, X. L., Pei, L. (2016). Influence of drip irrigation by reclaimed water on the dynamic change of nitrogen element in soil and tomato yield and quality. Cleaner Production, 139, 561–566. [Google Scholar]
19. Chen, W. P., Lu, S. D., Pan, N., Wang, Y. C., Wu, L. S. (2015). Impact of reclaimed water irrigation on soil health in urban green areas. Chemosphere, 119(1), 654–661. [Google Scholar]
20. Qin, X. B., Li, Y. E., Wan, Y. F., Liao, Y. L., Fan, M. R. et al. (2014). Effect of tillage and rice residue return on CH4 and N2O emission from double rice field. Translation of the CSAE, 30(11), 216–224. [Google Scholar]
21. Ma, Z. H., Xue, L. H., Pan, F. Y., Xu, S. S., Gao, Q. et al. (2016). Utilization of nitrogen in wastewater low in pollution degree in paddy fields and its effect on reducing fertilizer application in Tai Lake Region. Journal of Ecology and Rural Environment, 32(4), 570–576. [Google Scholar]
22. Yan, A. L., Zheng, Z. J., Qi, Y. T. (2015). Effect of rural sewage primary treatment water irrigation on Chinese cabbage growth quality. Journal of Drainage and Irrigation Machinery Engineering, 33(4), 352–355, 368. [Google Scholar]
23. Wu, W. Y., Xu, C. P., Liu, Q. L., Hao, Z. Y., Ma, F. S. et al. (2010). Effect of reclaimed water irrigation on yield and quality of fruity vegetables. Translation of the CSAE, 26(1), 36–40. [Google Scholar]
24. Bame, I. B., Hughes, J. C., Titshall, L. W., Buckley, C. A. (2014). The effect of irrigation with anaerobic baffled reactor effluent on nutrient availability, soil properties and maize growth. Agricultural Water Management, 134, 50–59. DOI 10.1016/j.agwat.2013.11.011. [Google Scholar] [CrossRef]
25. Han, H. H., Liu, X. Y., Gao, R., Cui, Y. L., Gu, S. Y. (2021). Effect of water saving and emission reduction under reclaimed water irrigation of rice. Water Saving Irrigation, 12, 43–49. [Google Scholar]
26. Liang, L. C., Yu, S. Q., Zhang, C., Qian, L., Qi, P. (2017). Spatial distribution and ecological risk assessment of heavy metals in Yongkang City. Journal of Zhejiang A&F University, 34(6), 972–982. [Google Scholar]
27. General Administration of Quality Supervision, Inspection and Quarantine of the People’s Republic of China (2020). Standards for irrigation water quality. China: GB5084–2021. http://down.foodmate.net/standard/yulan.php?itemid=96156. [Google Scholar]
28. Bao, S. D. (2000). Soil and agricultural chemistry analysis. Beijing: China Agricultural Press. [Google Scholar]
29. Ministry of Environmental Protection of the People’s Republic of China (2017). Water quality-determination of the chemical oxygen demand-dichromate method. China: HJ 828–2017. http://www.doc88.com/p-9959668900957.html. [Google Scholar]
30. Ministry of Environmental Protection of the People’s Republic of China (2010). Water quality-determination of ammonia nitrogen-Nessler’s reagent spectrophotometry. China: HJ 535–2009. https://www.doc88.com/p-77547193185148.html. [Google Scholar]
31. Ministry of Environmental Protection of the People’s Republic of China (2016). Water quality-determination of inorganic anions-Icon chromatography. China: HJ 84–2016. http://www.doc88.com/p-1781769199565.html. [Google Scholar]
32. Ministry of Environmental Protection of the People’s Republic of China (1987). Water quality-determination of anionic surfactants-methylene blue spectrophotometric method. China: GB/T 7494–87. https://www.doc88.com/p-5425884221440.html?r=1. [Google Scholar]
33. Yin, A. J., Xue, L. H., Yang, L. Z., Duan, Q. Q., Hou, P. F. (2017). Effects of the N and P concentrations in domestic wastewater on the growth, N and P uptakes of rice. Agro-Environmental Science, 36(4), 768–776. [Google Scholar]
34. Leal, R. M. P., Firme, L. P., Herpin, U. (2010). Carbon and nitrogen cycling in a tropical Brazilian soil cropped with sugarcane and irrigated with wastewater. Agricultural Water Management, 97(2), 271–276. DOI 10.1016/j.agwat.2009.09.018. [Google Scholar] [CrossRef]
35. Li, P., Hu, C., Fan, X. Y., Zhao, Z. J., Fan, T. et al. (2013). Root-layer soil nitrogen utilization of greenhouse tomato under reducing nitrogen topdressing with reclaimed water irrigation. Journal of Plant Nutrition and Fertilizer, 19(4), 972–979. [Google Scholar]
36. Minhas, P. S., Yadav, R. K., Dubey, S. K. (2015). Long term impact of waste water irrigation and nutrient rates: I. Performance, sustainability and produce quality of peri urban cropping systems. Agricultural Water Management, 156(S1), 100–109. DOI 10.1016/j.agwat.2015.03.012. [Google Scholar] [CrossRef]
37. Gwenzi, W., Munondo, R. (2008). Long-term impacts of pasture irrigation with treated sewage effluent on nutrient status of a sandy soil in Zimbabwe. Nutrient Cycling in Agroecosystems, 82(2), 197–207. DOI 10.1007/s10705-008-9181-3. [Google Scholar] [CrossRef]
38. Guo, W., Qi, X. B., Li, P., Li, Z. Y., Zhou, Y. (2015). Research process of the effects of reclaimed water irrigation on soil nitrogen and biological effectiveness. Chinese Agricultural Science Bulletin, 31(35), 181–186. [Google Scholar]
39. Huang, G. H., Yang, J. H., Huang, Q. Z. (2002). Effect of irrigation of turfgrass with treated domestic effluent on nitrogen concentrations in soil and plant. Translation of the CSAE, 18(3), 22–25. [Google Scholar]
Cite This Article
 Copyright © 2023 The Author(s). Published by Tech Science Press.
This work is licensed under a Creative Commons Attribution 4.0 International License , which permits unrestricted use, distribution, and reproduction in any medium, provided the original work is properly cited.
 Downloads
 Citation Tools