
 Submit a Paper
 Propose a Special lssue
 Open Access
ARTICLE

Estimation of Genetic Divergence and Character Association Studies in Local and Exotic Diversity Panels of Soybean (Glycine max L.) Genotypes
1 Oilseeds Research Institute, Ayub Agricultural Research Institute, Faisalabad, Pakistan
2 Department of Plant Breeding and Genetics, University of Agriculture, Faisalabad, Pakistan
3 Department of Agronomy, University of Agriculture, Faisalabad, Pakistan
4 College of Plant Science and Technology, Huazhong Agricultural University, Wuhan, China
5 Key Laboratory of Biology and Genetic Improvement of Oil Crops, The Ministry of Agriculture and Rural Affairs, Oil Crops Research Institute of Chinese Academy of Agricultural Sciences, Wuhan, 430062, China
6 Department of Agricultural Engineering, Khwaja Fareed University of Engineering and Information Technology, Rahim Yar Khan, Pakistan
7 Department of Plant Production, College of Food and Agriculture Sciences, King Saud University, Riyadh, Saudi Arabia
8 Grassland and Forage Division, National Institute of Animal Science, Rural Development Administration, Cheonan, Korea
9 Department of Agronomy, Faculty of Agriculture, University of Kafrelsheikh, Kafr Elsheikh, Egypt
* Corresponding Authors: Syed Ali Zafar. Email: ; Ayman El Sabagh. Email:
Phyton-International Journal of Experimental Botany 2023, 92(6), 1887-1906. https://doi.org/10.32604/phyton.2023.027679
Received 08 November 2022; Accepted 29 January 2023; Issue published 11 April 2023
 View Full Text
 Download PDF
Abstract
The availability of favorable genetic diversity is a thriving vitality for the success of a breeding program. It provides a firm basis of selecting superior breeding lines for the development of high yielding crop genotypes. In this context, present investigation aimed to generate information on genetic divergence and character association in a diversity panel of 123 local and exotic soybean genotypes. Analysis of variance revealed significant response of the evaluated genotypes based on studied attributes. It depicted the probability of selecting desirable soybean genotypes by focusing on character association studies and genetic diversity analysis. Correlation analysis revealed that seed yield per plant showed high positive correlation with 100-seed weight followed by pods per plant and plant height. Furthermore, path coefficient analysis exposed that pods per plant had maximum direct contribution in seed yield per plant followed by 100-seed weight, days to flowering and SPAD measurement. Genotype named “G-10” showed maximum yield per plant followed by 24607, G-52, 24593, Arisoy, 24566, 17426, A-3127, 24570 and 24567. Genetic diversity analysis grouped the evaluated germplasm into 17 clusters. All clusters showed zero intra-cluster variability; while inter-cluster divergence ranged from 9.00 to 91.11. Cluster V showed maximum inter-cluster distance with cluster XII followed by that of between V and VIII. Moreover, cluster IV with superior genotypes (G-10, 24607, 24593 and 24566), VI (17426 and 24567), XIII (24570) and X (Arisoy and G-52) showed above mean values for most of the studied characters. Overall, the results of hybridization between the superior genotypes of these cluster pairs might be useful for soybean breeding with improving agronomic traits and adaptability.Keywords
Soybean (Glycine max L.) belongs to fabaceae family, exhibits diploid chromosome number 2n = 40. The domestication and cultivation of soybean dates back to 5000 years ago and is thought to be originated in China [1]. The cultivated soybean is the progenitor of wild soybean, i.e., Glycine soja, both classified in the same genus Glycine. It is the leading legume crop of the world with a share of almost 50% in total legume cultivated area of the world [2]. Countries which contribute majorly in the global soybean production are United States, Brazil, Argentine, China and India [3,4]. Its seed contains high quality protein (40%) and oil contents (18%–22%) along with a significant quantity of carbohydrates (20%–30%), minerals and fiber contents (3%–6%) and 5% ash [5,6]. During 2018–19, soybean has been estimated to be grown on 124.89 million hectares globally with a total production of 348.61 million tons [7]. In Pakistan, soybean crop was introduced along with sunflower and safflower during 1960s. Unfortunately, its cultivation has been facing various setbacks predominantly due to lack of climate resilient, disease resistant and high yielding cultivars. There is a huge gap between total soybean production and the country’s demand because its cultivation is restricted to the northern areas of the country [8]. Therefore, a comprehensive research is needed to pursue for the selection of superior genotypes from a genetically diverse soybean pool. It would facilitate to develop high yielding, insect-pest resistant and climate resilient soybean varieties.
Genetic diversity analysis helps to assess the existing genetic variation present within a breeding line and among the breeding lines. Furthermore, identification of various groups based on genetic similarities and dissimilarities help in devising suitable hybridization scheme. Moreover, the selection of superior parent lines can be made to utilize the available genetic variation in a more productive way [9]. Availability of genetically diverse pool of germplasm greatly enhances the selection efficiency at the initial stage of a breeding program by selecting favorable genetic combinations. Identification of various genetic patterns leads to the systematic characterization of available genetic diversity. It also facilitates plant breeders to assess the phylogenetic associations among the tested genotypes [10]. Genetic diversity analysis can be done by following various approaches, such as pedigree information, morphological and agronomic characterization, biochemical and molecular approaches for germplasm classification [11–17]. Genetic diversity analysis based on morphological and agronomic performance is an effective tool to identify the phenotypic variation in particular agro-ecological conditions [18]. Estimation of genetic divergence can be accomplished by using D2 statistics approach [19]. It has been considered as the most efficient approach that classifies the evaluated germplasm into different clusters based on multivariate analysis.
Character association studies based on correlation and path coefficient analysis provide the basis to identify the strength of association among various yield and its related attributes [20–22]. It provides a basic insight into the elucidation of relative contribution of a particular growth attribute in the economic yield. Since plant yield is a very complex quantitative character which totally depends upon the strength of association among different growth attributes. Association studies based on only correlation analysis may mislead to select the best possible combinations due to its restricted ability of just estimating the association among different variables. While, path coefficient analysis measures the relative significance of yield attributing characters by splitting the genotypic correlation into direct and indirect effects. Considering these above issues, this study was aimed to select elite soybean genotypes accomplished through character association studies including correlation and path coefficient analysis, and assess the magnitude of genetic diversity followed by phenotypic clustering of soybean growth attributes.
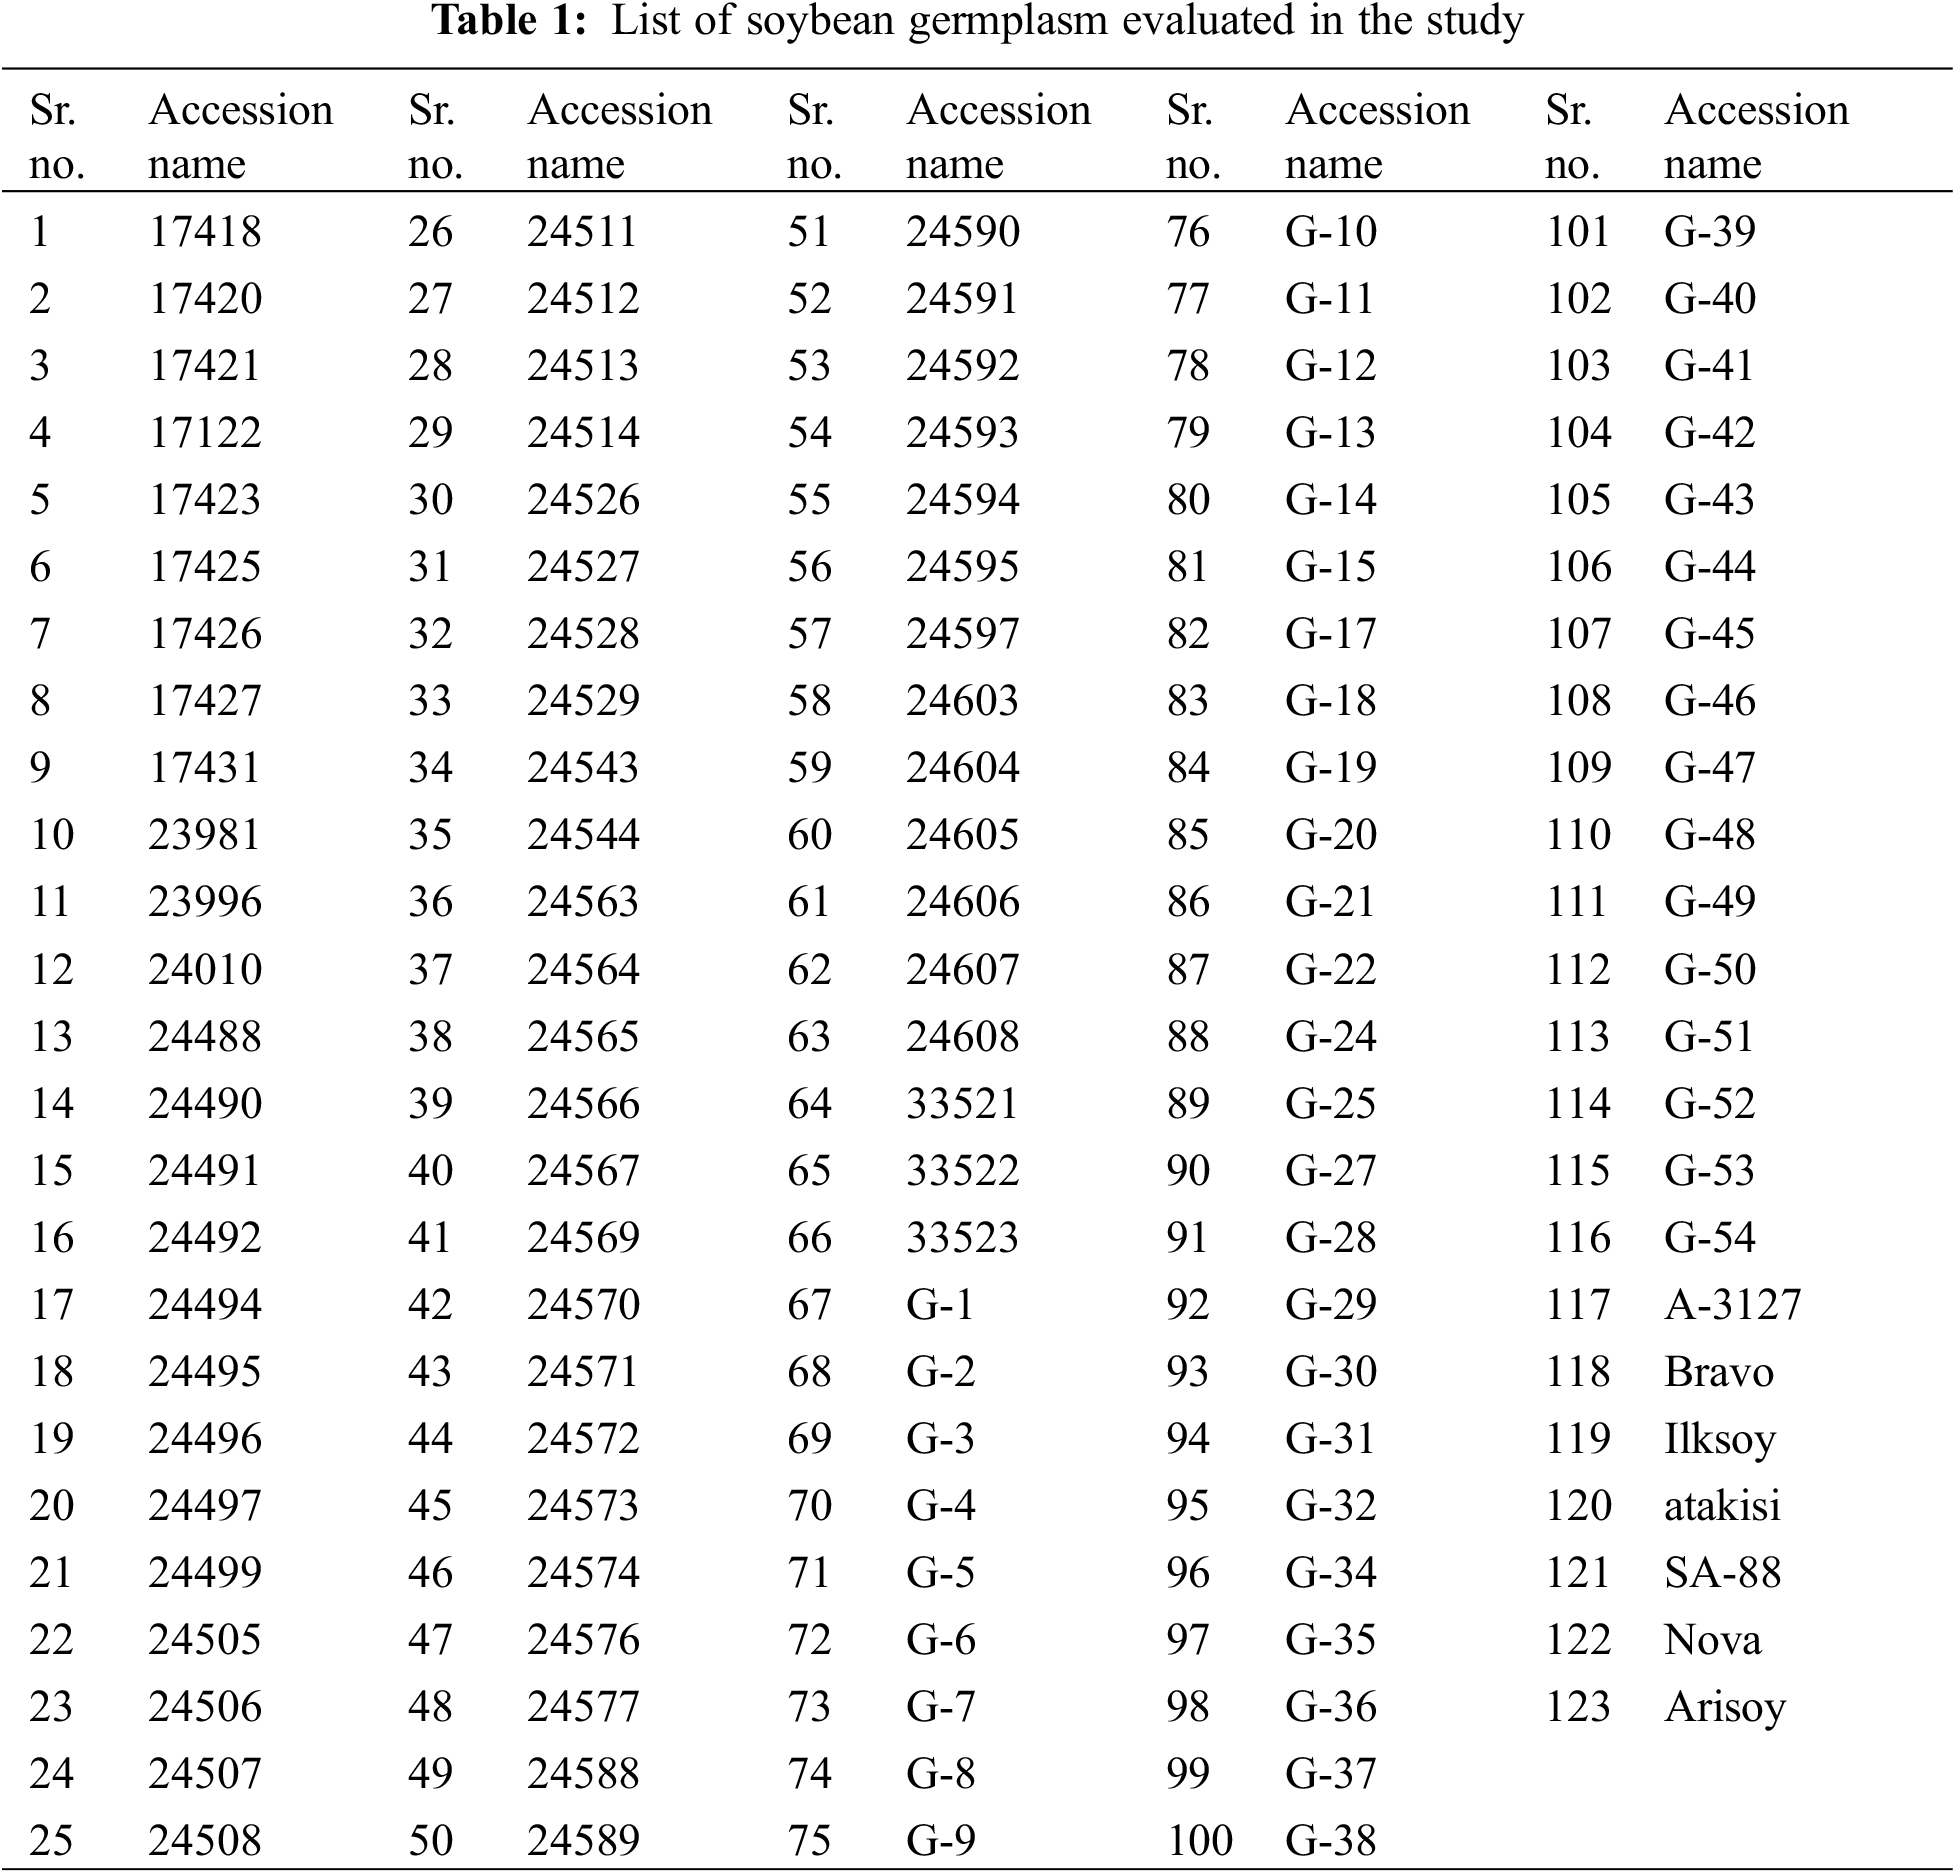
A diverse set of 123 soybean genotypes was procured (Table 1) from the national and international research institutions, e.g., Plant Genetic Resources Program (PGRP), National Agriculture Research Centre (NARC), Islamabad, Pakistan; The University of Agriculture, Peshawar, Pakistan; and Nigde Omer Halisdemir University, Nigde, Turkey.
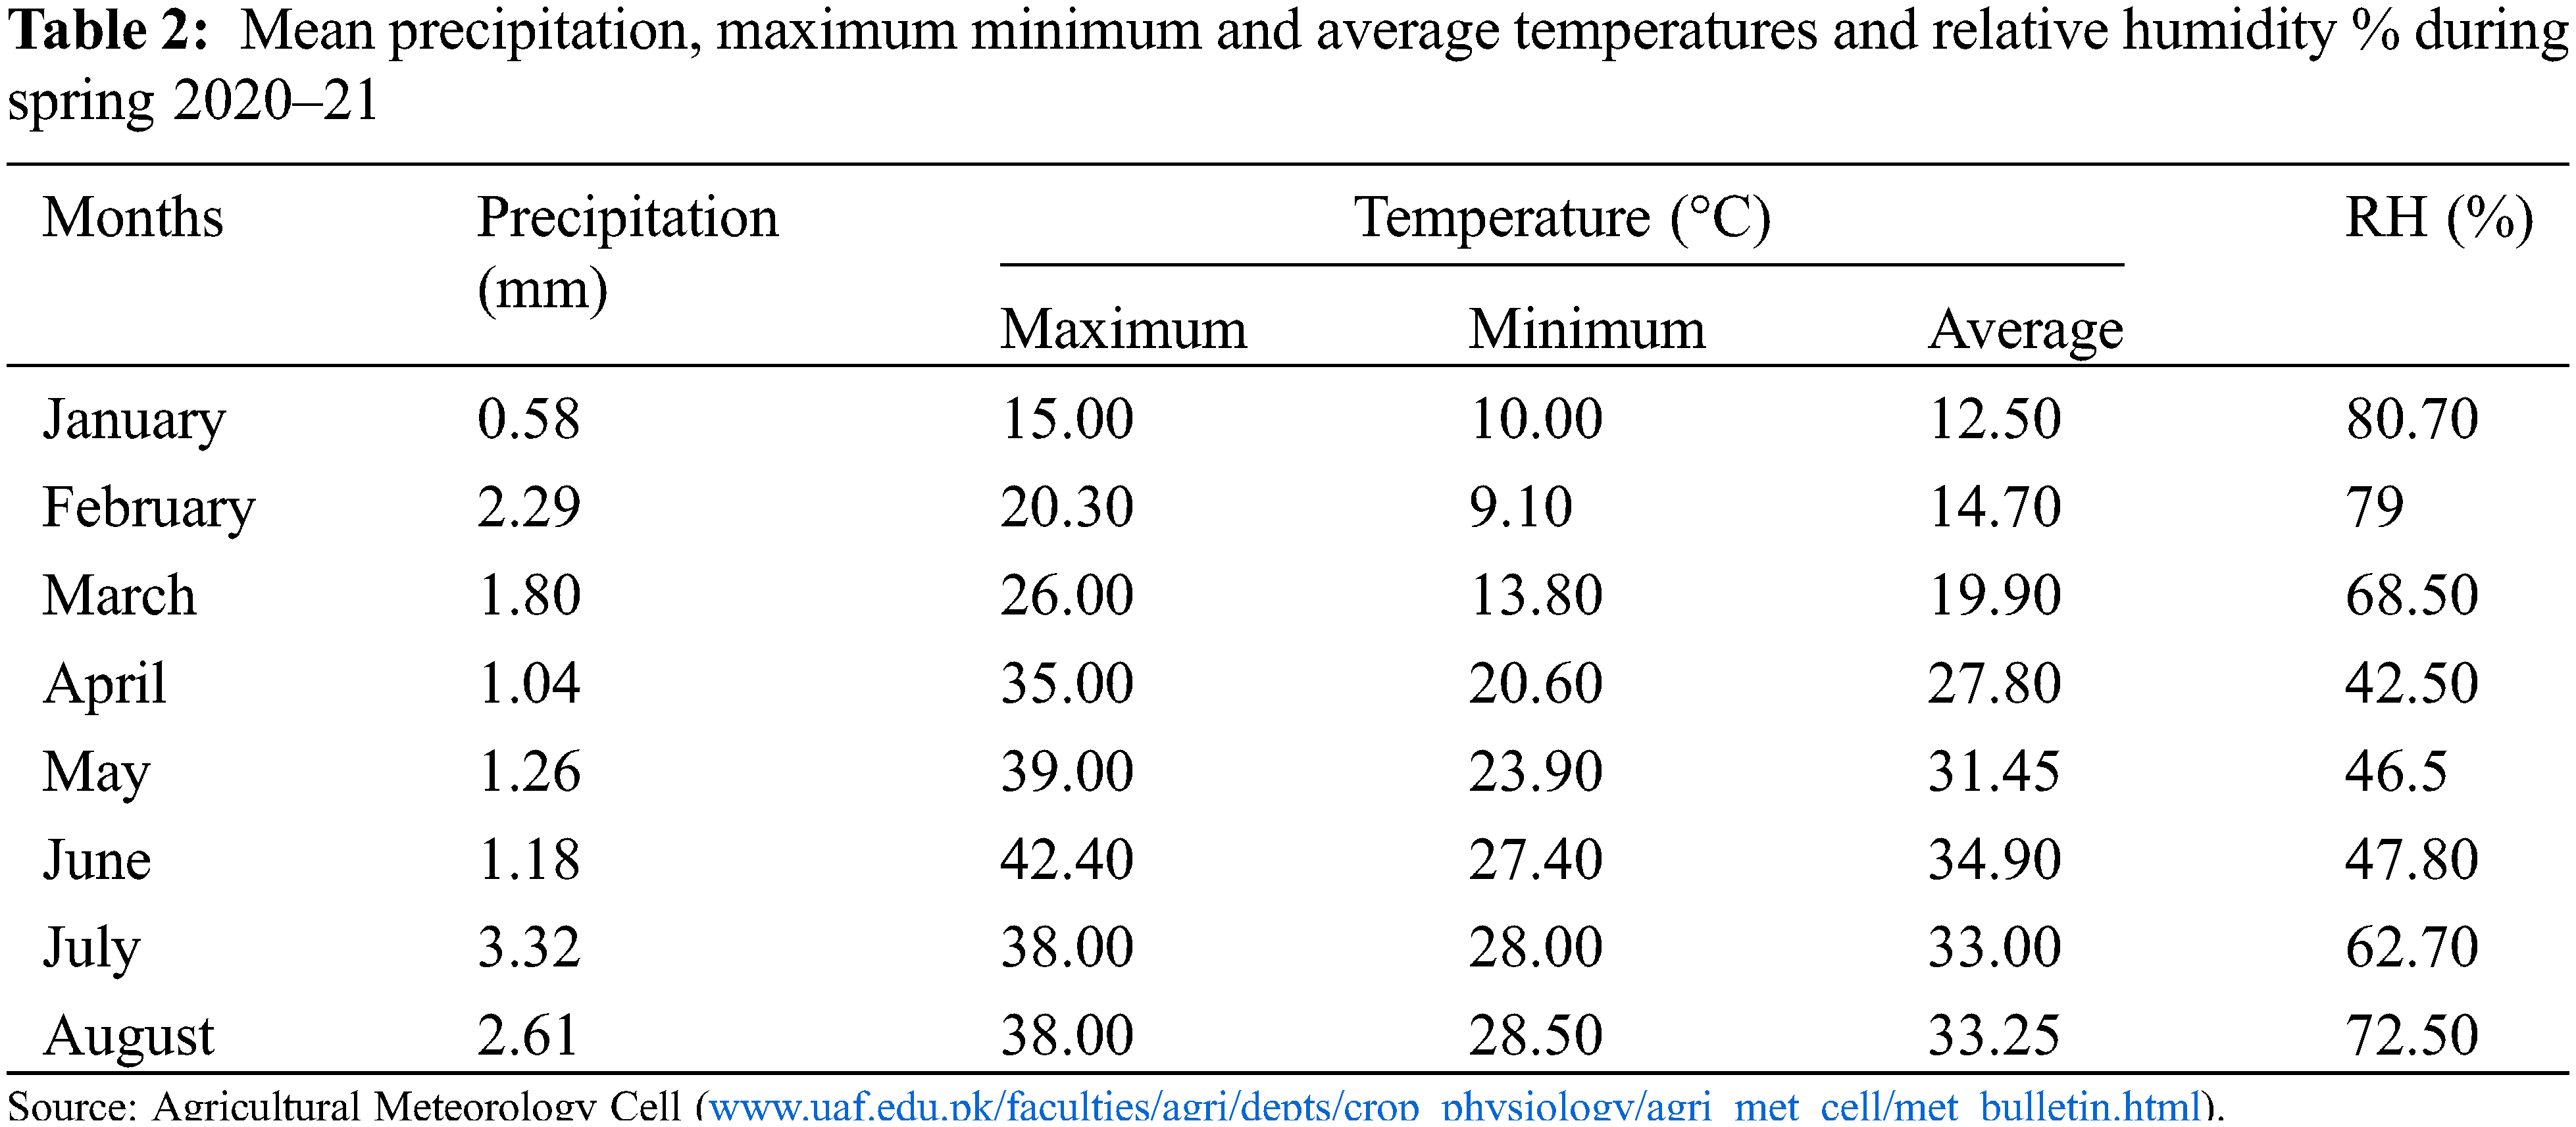
The study was carried out during spring season 2020–21 at the research area of Department of Plant Breeding and Genetics, University of Agriculture, Faisalabad, Pakistan. The weather conditions during spring 2020–21 have been illustrated in Table 2. A pot experiment was conducted by following randomized complete block design (RCBD) with three replications per genotype. Six pots per genotype (two pots per replication and four plants per replication) were maintained. After seedling emergence only two plants per pot were allowed to grow while others were thinned out. All recommended agronomic practices including irrigation, fertilization and plant protection measures were ensured timely to raise healthy plants. The pots were irrigated on daily basis but over irrigation of pots were avoided. Total 50 g of NPK fertilizer (20:20:20) was applied to each pot and were irrigated immediately. Seeds were treated with thiophanate methyl @ 2g/kg seed to prevent possible infestation of fungal diseases. To control whitefly infestation, diafenthiuron was applied @ 2.5 ml/L. For effective management against armyworm, lufenuron was applied @ 2.5 ml/L.
Data were collected based on different agronomic attributes, i.e., number of leaves plant−1, number of branches plant−1, days to flowering initiation, days to pod initiation, number of pods plant−1, days taken to maturity, number of seeds pod−1. Plant height (cm) was measured at R8 [23] growth stage through meter rod; while pod and petiole length (cm) were recorded through measuring scale and stem diameter (mm) through digital vernier caliper. SPAD measurement (cci) was taken at V3 [24] growth stage through SPAD-502 meter. 100 seed weight (g) and seed yield plant−1 (g) were recorded through electric weigh balance. Each pot with one plant was considered as one replication. Data from all replications were recorded and subjected to statistical analyses.
The recorded data were subjected to Analysis of Variance (ANOVA) according to Steel et al. [25] followed by Least Significant Difference (LSD) test through Statistix 8.1 software. Genetic diversity analysis based on phenotypic clustering was carried out by applying D2 statistics approach developed by Mahalanobis [19] through Minitab 17.1.0 software. Character association studies based on correlation and path coefficient analysis were carried out through R 3.1.0 software.
2.4.1 Estimation of Correlation Coefficients
Estimation of correlation coefficients was carried out by following [26]:
where, rp and rg represent coefficients of phenotypic and genotypic correlation, respectively; pCovxy and gCovxy represent phenotypic and genotypic co-variances between x and y, respectively; σ2px and σ2gx represent phenotypic and genotypic variances for variable x, respectively and σ2py and σ2gy represent phenotypic and genotypic variances for variable y, respectively.
2.4.2 Path Coefficient Analysis
Direct and indirect effects were calculated by utilizing coefficients of genotypic correlation according to Dewey et al. [27]:
where, rij denotes the relationship that each independent variable “I” (yield related character) shows with the dependent variable “j” (seed yield); Pij depicts the direct (diagonal) effects of the independent variable “i” on the dependent variable “j” as estimated through path analysis and denotes the additive indirect effects of a specific independent variable “j” from all of the other independent variable “k”. The effects of remaining characters are estimated as the residual effects as given by:
Estimation of D2 was carried out by following equation developed by [19]:
where,
3.1 Variability and Genetic Parameters
Present study investigated 14 different yield and its attributing characters to elucidate their relative association and the extent of genetic divergence among the evaluated soybean genotypes. The highly significant mean sum of square values for genotypes (Table 3) estimated through ANOVA revealed the availability of ample genetic variation among the evaluated genotypes (Table 3). It further encourages the selection of desirable soybean genotypes.
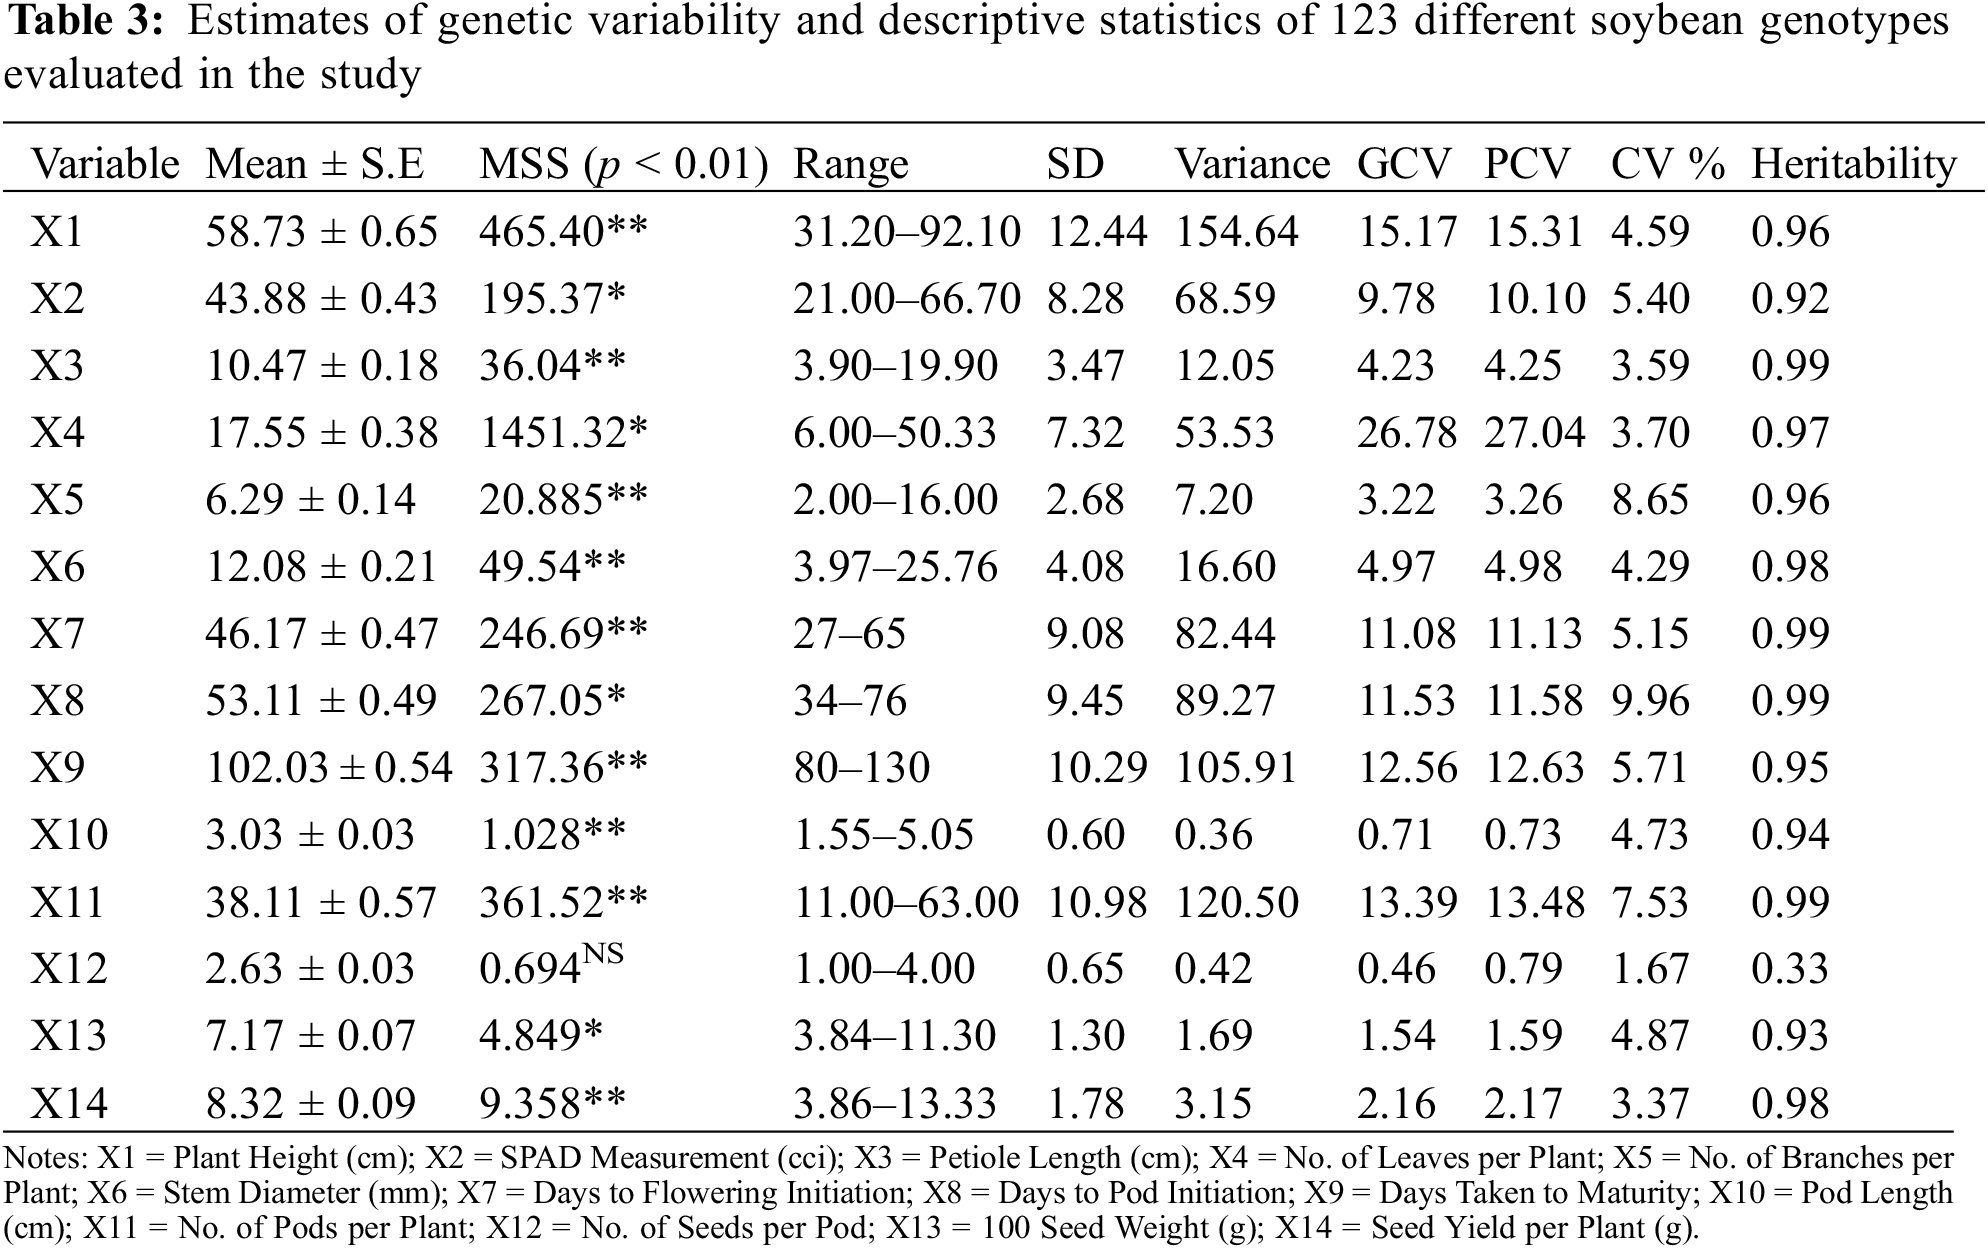
3.2 Descriptive Statistics for Morphological Attributes
Statistical analysis based on descriptive statistics (Table 3) elucidated that plant height ranged between 31.20 (G-12) to 92.10 (24566) cm with a general mean of 58.73 ± 0.65 having coefficient of variance 5%. PCV (15.31) and GCV (15.17) were moderate having high heritability (0.96%). SPAD measurement ranged between 21.00 (24527) to 66.70 (G-41) CCI with a general mean of 43.88 ± 0.43 having coefficient of variance 5.40%. PCV (10.10) and GCV (9.78) were found as low having heritability of 0.92%. Petiole length ranged between 3.90 (Ilksoy) to 19.90 (24588) cm with a general mean of 10.47 ± 0.18 having coefficient of variance 3.59%. PCV (4.25) and GCV (4.23) were very low having high heritability (0.99%). Number of leaves plant−1 ranged between 6.00 (23996) to 50.33 (24570) with a general mean of 17.55 ± 0.38 having coefficient of variance 3.70%. PCV (27.04) and GCV (26.78) were high having heritability (0.97%). Number of branches plant−1 ranged between 2.00 (G-4) to 16.00 (G-10) with a general mean of 6.29 ± 0.14 having coefficient of variance 8.65%. PCV (3.26) and GCV (3.22) were very low having high heritability (0.96%). Stem diameter ranged between 3.97 (G-12) to 25.76 (24593) mm with a general mean of 12.08 ± 0.21 having coefficient of variance 4.29%. PCV (4.98) and GCV (4.97) were very low having high heritability (0.98%). Days to flowering initiation ranged between 28 (24577) to 65 (24527) days with a general mean of 46.17 ± 0.47 having coefficient of variance 5.15%. PCV (11.13) and GCV (11.08) were moderate havng high heritability (0.99%).
Days to pod initiation ranged between 27 (24588) to 76 (24527) days with a general mean of 53.11 ± 0.49 having coefficient of variance 9.96%. PCV (11.58) and GCV (11.53) were moderate having heritability (0.99%). Days taken to maturity ranged between 80 (G-32) to 130 (24567) days with a general mean of 102.03 ± 0.54 having coefficient of variance 5.71%. PCV (12.63) and GCV (12.56) were moderate having high heritability (0.96%). Pod length ranged between 1.55 (24566) to 5.05 (24497) cm with a general mean of 3.03 ± 0.03 having coefficient of variance 4.73%. PCV (0.73) and GCV (0.71) were negligible having high heritability (0.94%). Number of pods plant−1 ranged between 11.00 (G-12) to 63.00 (G-10) cm with a general mean of 38.11 ± 0.57 having coefficient of variance 7.53%. PCV (13.48) and GCV (13.39) were moderate having high heritability (0.99%). Number of seeds pod−1 ranged between 1.00 (G-4) to 4.00 (17420) with a general mean of 2.63 ± 0.03 having coefficient of variance 1.67%. PCV (0.79) and GCV (0.46) were negligible having low heritability (0.33%). 100-seed weight ranged between 3.84 g (G-12) to 11.30 g (24593) with a general mean of 7.17 ± 0.07 having coefficient of variance 4.87%. PCV (1.59) and GCV (1.54) were negligible having heritability (0.93%). Seed yield plant−1 (g) ranged from 3.86 (G-12) to 13.33 (G-10) with a general mean of 8.32 ± 0.09 having coefficient of variance 3.37%. PCV (2.17) and GCV (2.16) were low having high heritability (0.98%).
Correlation coefficients for all yield and its contributing characters are shown in Table 4 and Fig. 1. Plant height showed significant and positive correlation for most of the characters under study, i.e., petiole length (0.336), number of leaves per plant (0.642), number of branches per plant (0.414), stem diameter (0.576), days to flowering initiation (0.902), days to pod initiation (0.837), days taken to maturity (0.938), number of pods per plant (0.951), number of seeds per pod (0.278), 100 seed weight (0.262) and seed yield per plant (0.485). Plant height showed significant but negative correlation with pod length (0.485). On the other hand, SPAD measurement showed non-significant correlation with plant height (0.017). Data regarding SPAD measurement showed non-significant correlation with rest of the studied characters. Pod length showed significant but negative correlation with most of the characters under study, i.e., number of leaves per plant (−0.161), number of branches per plant (−0.160), stem diameter (−0.265), days to flowering initiation (−0.277), days to pod initiation (−0.234), days taken to maturity (−0.332), number of pods per plant (−0.309), 100-seed weight (−0.127). Number of seeds per pod showed significant positive correlation with pod length (0.444). On the other hand, pod length showed non-significant correlation with SPAD measurement (0.062). Petiole length showed positive correlation with most of the characters under study, i.e., plant height (0.336), pod length (0.166), number of leaves per plant (0.298), days to flowering initiation (0.343), days to pod initiation (0.324), days taken to maturity (0.344), number of pods per plant 0.344), number of seeds per pod (0.384) and seed yield per plant (0.130). On the other hand, petiole length showed negative correlation with SPAD measurement (−0.061) and 100-seed weight (−0.056).
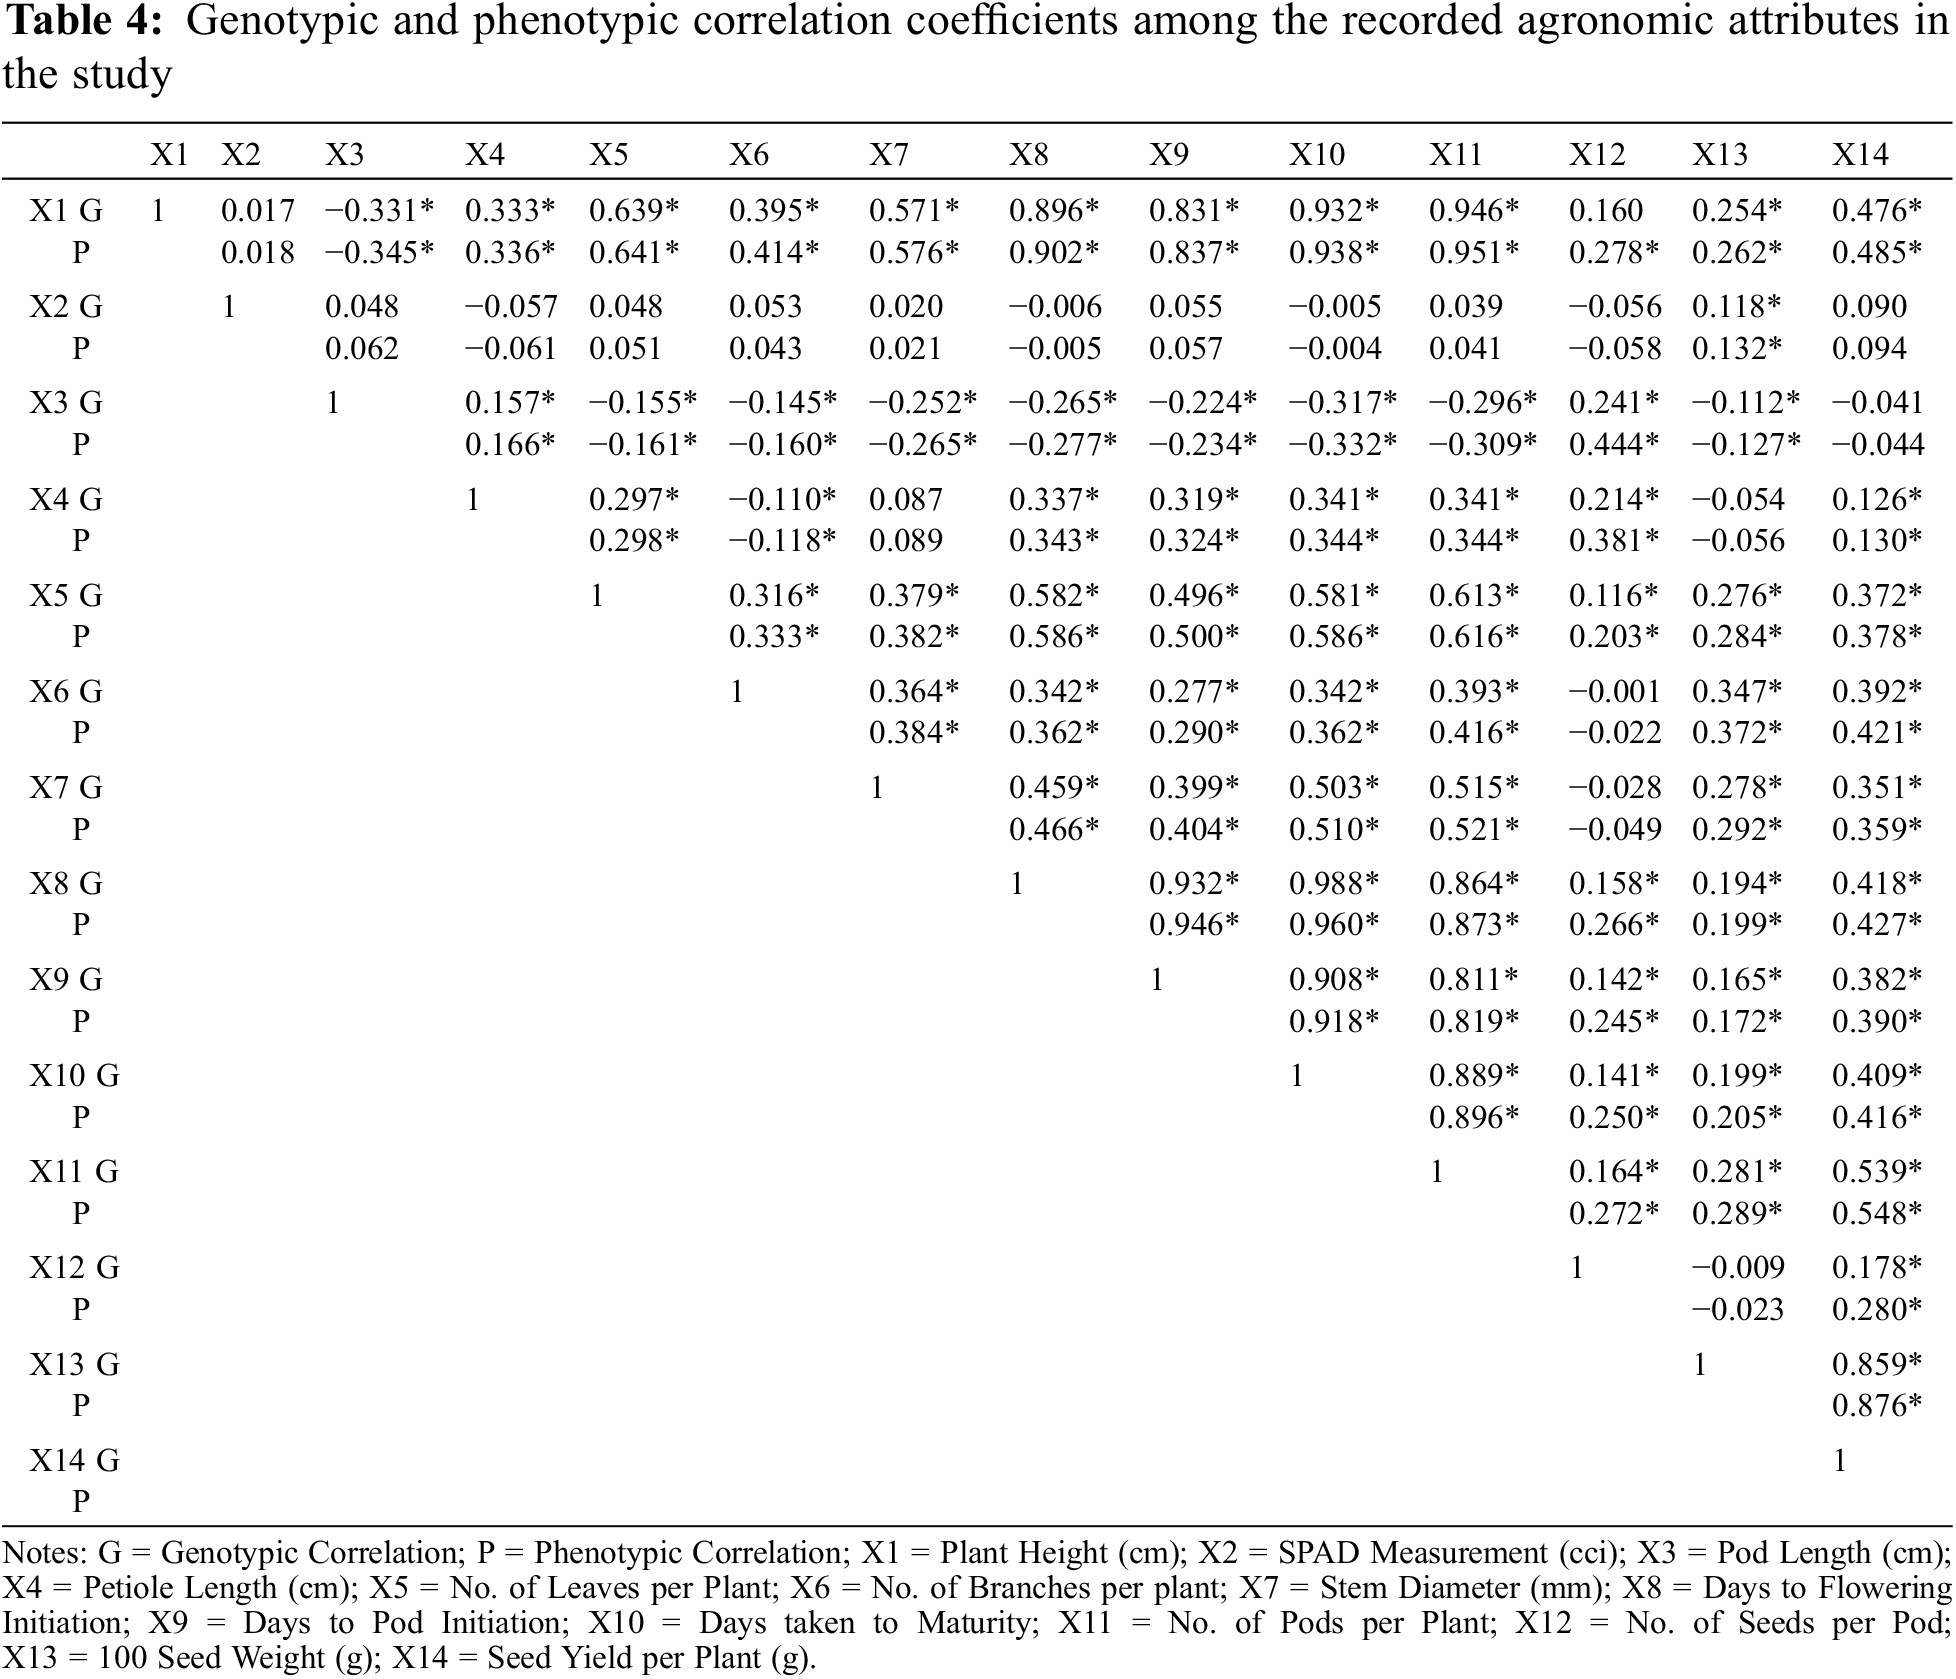
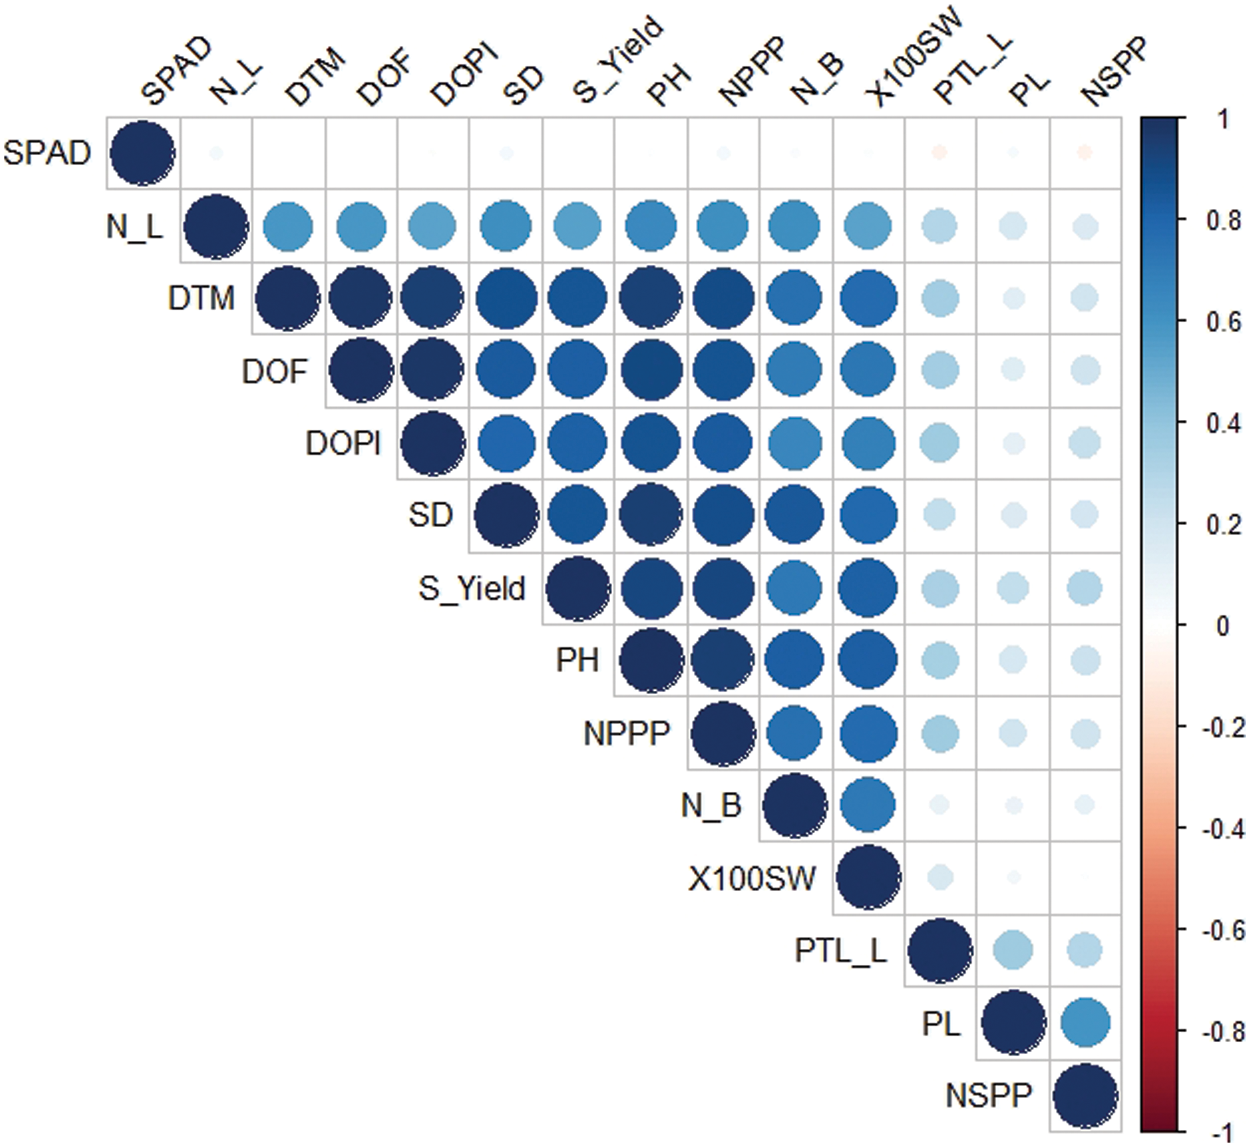
Figure 1: Correlogram for the 14 agronomic attributes recorded in the study. SPAD = SPAD measurements; N_L = No. of leaves per plant; DTM = Days taken to maturity; DOF = Days taken to flowering initiation; DOPI = Days to pod initiation; SD = Stem diameter (mm); S_Yield = Seed yield per plant (g); PH = Plant height (cm); NPPP = No. of pods per plant; N_B = No. of branches per plant; X100 SW = 100 seed weight (g); PTL_L = Petiole length (cm); PL = Pod length (cm); NSPP = No. of seeds per pod
Number of leaves per plant showed significant positive correlation with most of the characters under study, i.e., plant height (0.641), petiole length (0.298), number of branches per plant (0.333), stem diameter (0.382), days to flowering initiation (0.586), days to pod initiation (0.50), days taken to maturity 0.586), number of pods per plant (0.616), number of seeds per pod (0.203), 100-seed weight (0.284) and seed yield per plant (0.378). On the other hand, number of leaves per plant showed non-significant correlation with SPAD measurement (0.051); while, pod length was negatively correlated with number of leaves per plant (−0.161). Number of branches per plant showed significant positive correlation with most of the characters under study, i.e., stem diameter (0.384), days to flowering initiation (0.362), days to pod initiation (0.290), days taken to maturity (0.362), number of pods per plant (0.416), 100-seed weight (0.372) and seed yield per plant (0.421). Number of branches per plant were observed to be negatively correlated with number of seeds per pod (−0.049). Stem diameter was observed to be positively correlated with seed yield per plant (0.359), days to pod initiation (0.404), days taken to maturity (0.510), number of pods per plant (0.521), 100-seed weight (0.291) and days to flowering initiation (0.466). While, number of seeds per pod is negatively correlated (−0.049) with stem diameter. Days to flowering initiation is positively correlated with majority of the traits under study, i.e., seed yield (0.427), days taken to maturity (0.980), 100-seed weight (0.199), number of pods (0.873), number of seeds per pod (0.266) and days to pod initiation (0.946). Days to pod initiation is positively associated with seed yield (0.390), number of pods (0.819), 100-seed weight (0.172), number of seeds per pod (0.245) and days taken to maturity (0.918). Number of pods per plant showed significant positive association with seed yield (0.548), 100-seed weight (0.289) and number of seeds (0.272). Number of seeds per pod is negatively correlated with 100-seed weight (−0.023); while positively associated with seed yield (0.280). 100-seed weight was observed to be positively correlated (0.876) with seed production.
Path coefficient analysis was carried out to assess the relative contribution of each studied parameter towards seed yield per plant based on computed indirect and direct impacts (Table 5 and Fig. 2). Results based on path coefficient analysis exhibited positive and direct contribution of plant height in seed yield per plant (0.024). Similarly, plant height showed the highest and the lowest indirect positive contribution in seed yield per plant via SPAD measurement (0.719) and petiole length (0.009) respectively. SPAD measurement showed neither significant direct nor indirect contribution in seed production as correlation analysis exhibited non-significant relation with rest of the other variables under study. Pod length showed negative direct contribution in the seed yield per plant (−0.156). It exhibited maximum and minimum positive indirect contribution in seed production using SPAD measurement (0.301) and number of branches per plant (0.002), respectively. Petiole length showed direct positive effect on seed production per plant (0.026). It exhibited highest and lowest positive indirect contribution towards seed production using number of branches per plant (0.003) and SPAD measurement (0.316), respectively. Number of leaves showed negative direct contribution in seed production per plant (−0.092). Contrary to this, number of leaves exhibited maximum and minimum indirect and positive contribution in seed production by number of pods (0.383) and petiole length (0.008), respectively.
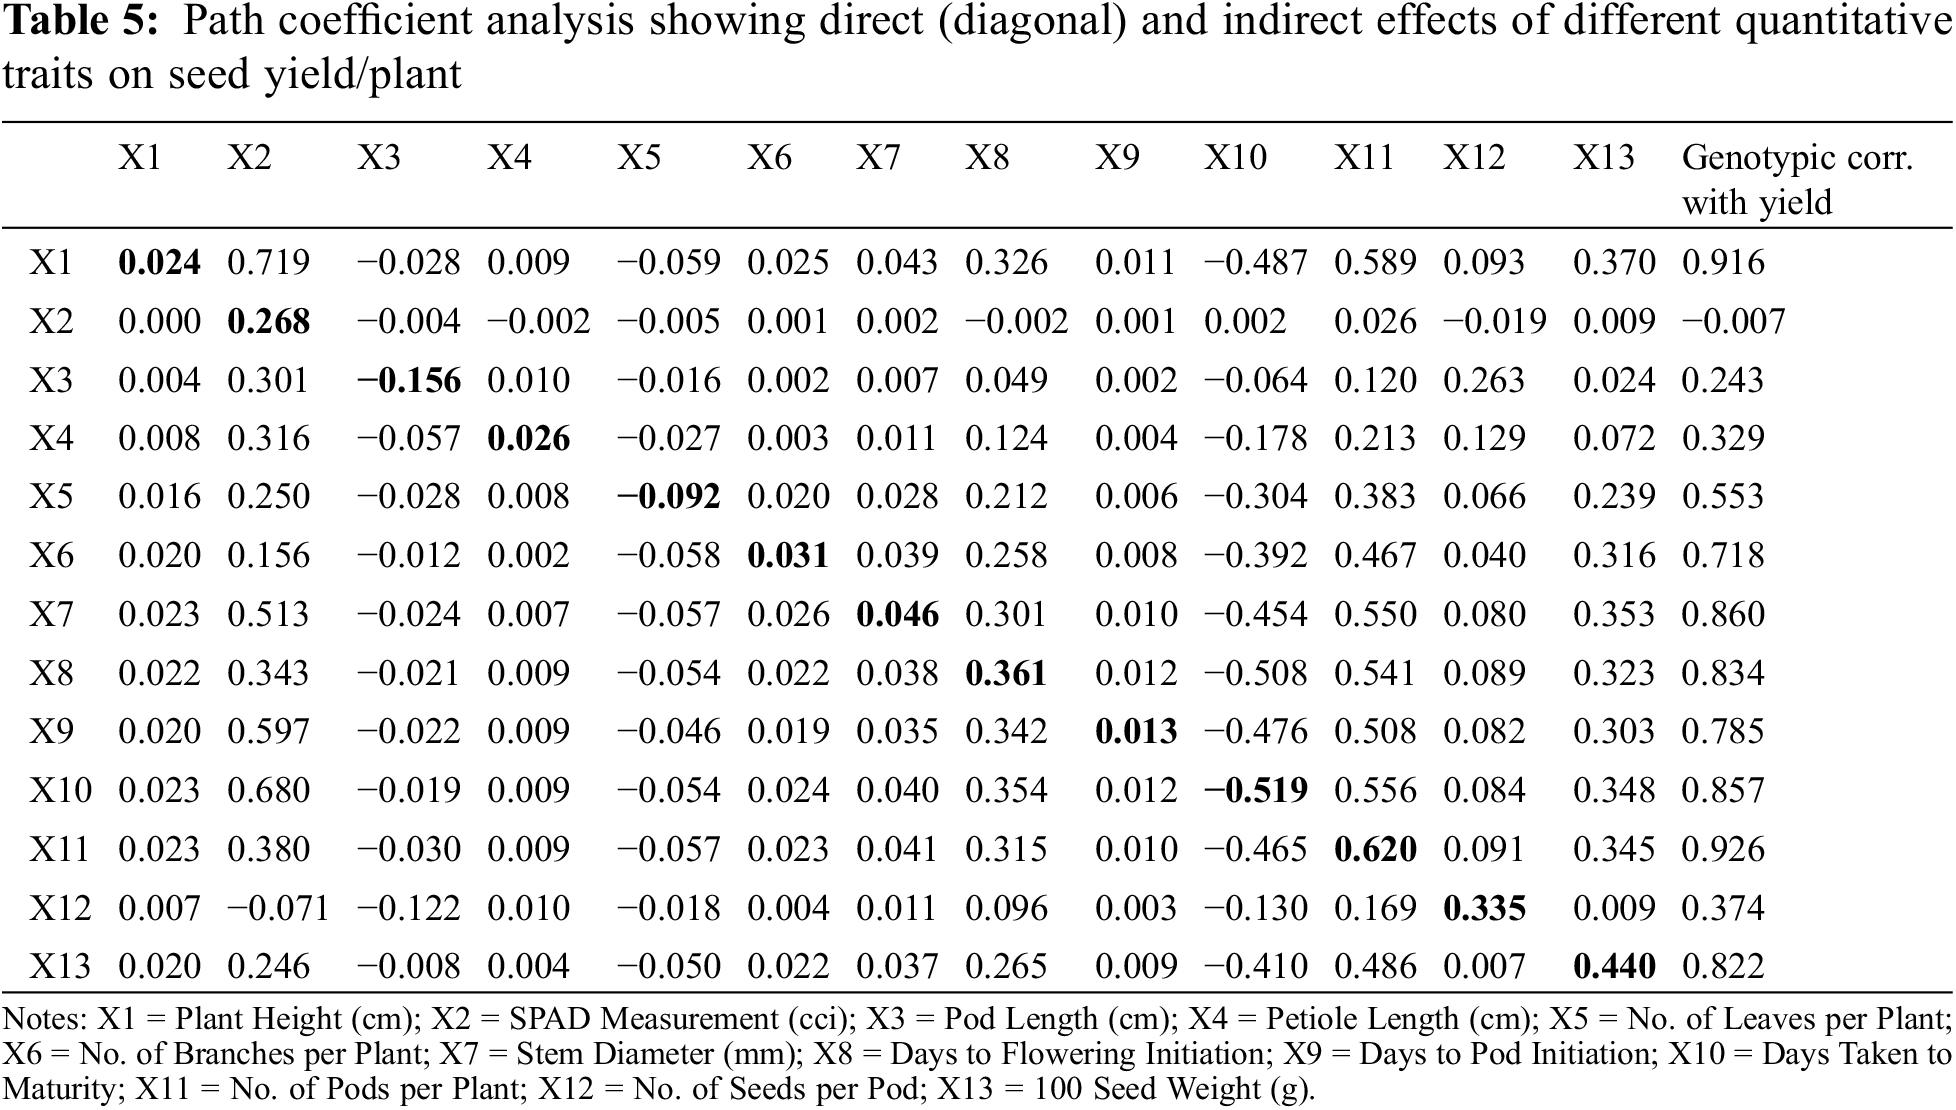
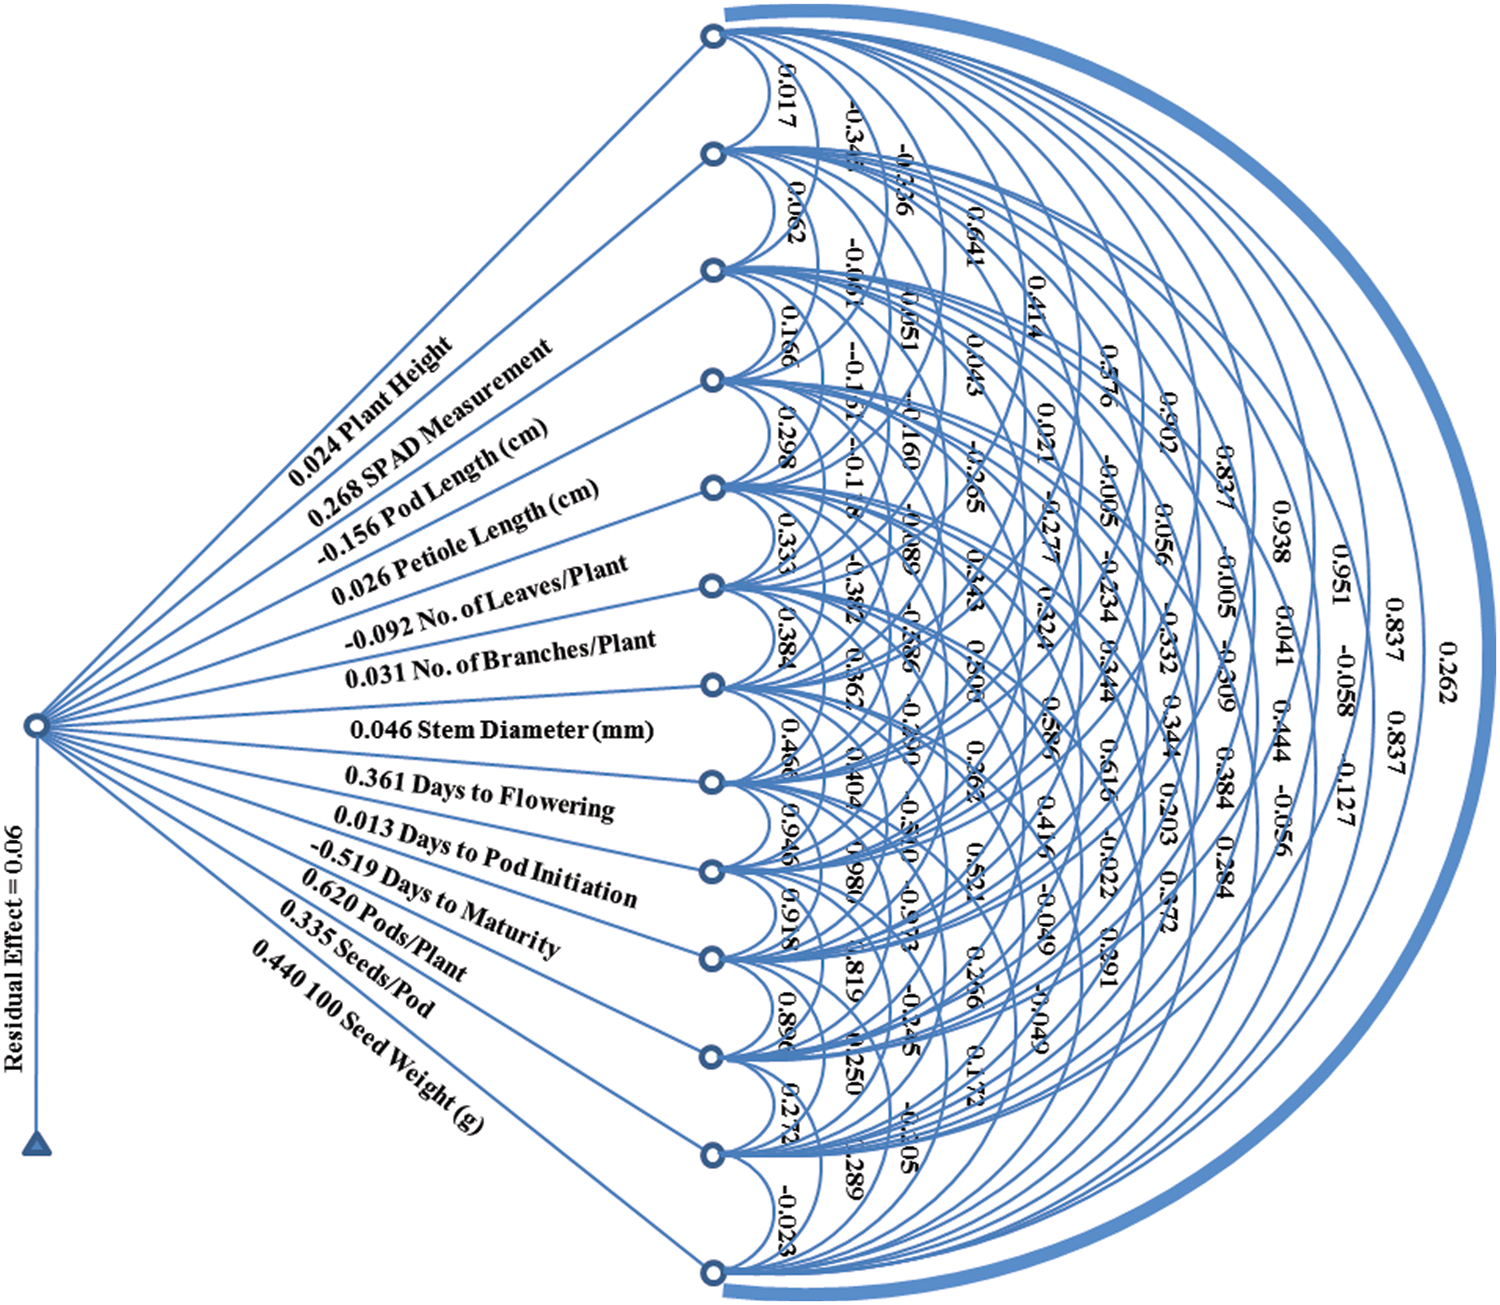
Figure 2: Genotypic path diagram for seed yield/plant (g)
Number of branches exhibited positive direct contribution in seed yield per plant (0.031). Maximum and minimum positive indirect contribution of number of branches for seed production was observed by 100-seed weight (0.316) and petiole length (0.002), respectively. Stem diameter exhibited positive direct effects on seed production per plant (0.046). The highest and the lowest positive indirect effect of stem diameter on seed production was recorded by days taken to pod initiation (0.010) and number of pods per plant (0.550), respectively. Days taken to flowering initiation exhibited direct and positive impacts on seed yield per plant (0.361). Maximum and minimum positive indirect effect of days to flowering initiation on seed production were recorded by number of pods and petiole length (0.009), respectively. Days to pod initiation showed positive direct contribution in seed production per plant (0.013). The highest and the lowest positive indirect effect of days to pod initiation on seed production was recorded by using SPAD measurement (0.597) and petiole length (0.009), respectively. In this study, data regarding days taken to maturity showed negative direct effect on seed production per plant (−0.519). Maximum and minimum positive indirect effect of days taken to maturity on seed production were computed by the help of SPAD measurement (0.680) and petiole length (0.009), respectively. Number of pods showed positive and direct contribution in seed yield (0.620). The highest and the lowest positive indirect contribution of number of pods in seed production was seen via SPAD measurement (0.380) and petiole length (0.009), respectively. Number of seeds per pod showed positive direct effects on seed production (0.335). Maximum and minimum positive indirect effect of number of seeds per pod on seed production was seen by days taken to pod initiation (0.003) and number of pods (0.169). 100-seed weight showed positive direct effect on seed yield per plant (0.440). The highest and the lowest positive indirect effect of 100-seed weight on seed production was seen by plant height (0.020) and number of pods per plant (0.486) respectively. The residual effects in the present study were estimated (0.06) depicting 6% of the total generated variation due to possible environment factors.
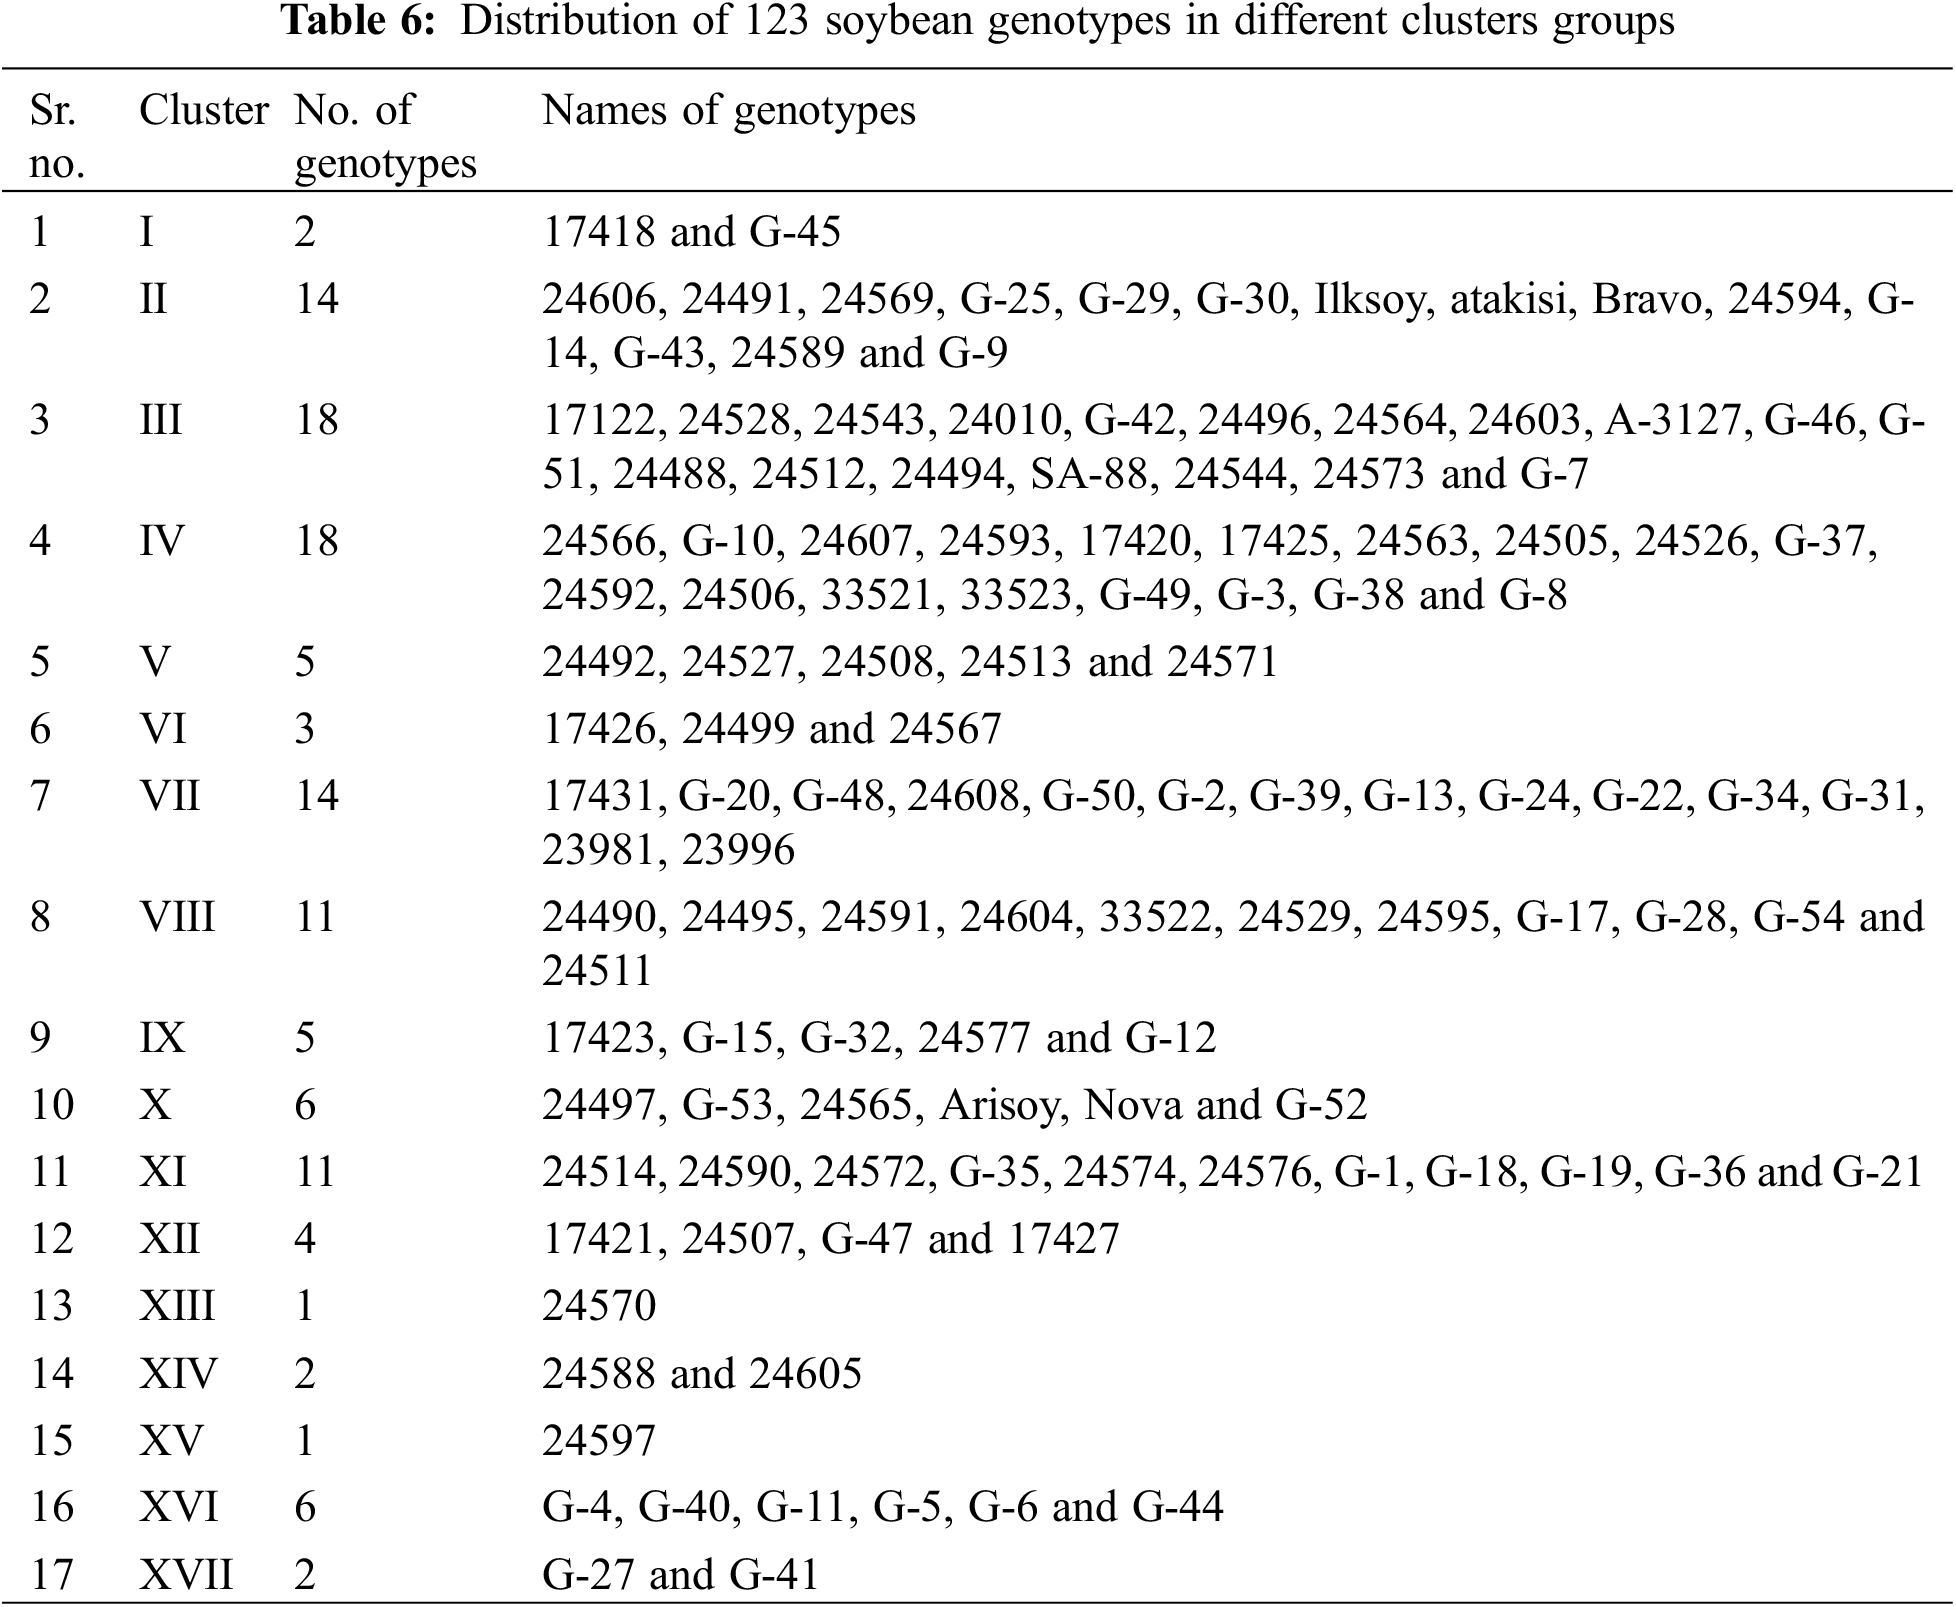
To assess the extent of genetic variability soybean genotypes were categorized into various clusters. It allowed optimizing the hybridization pattern among best performing entries of genetically distinct groups. A core set of 123 soybean genotypes was grouped into 17 different clusters. Among 17 clusters, clusters III and IV were the biggest with 18 genotypes in each followed by clusters VII and II with 14 genotypes in each. Clusters VIII and XI contained 11 genotypes in each; while clusters X and XVI contained six genotypes in each cluster. Moreover, clusters V and IX contained five genotypes in each followed by cluster VII with 4 genotypes whereas clusters including 1, XIV and XVII contained two genotypes in each cluster and cluster I was solitary as it contained only one genotype. The distribution of genotypes and clustering pattern is illustrated in Fig. 3 and Table 6. Average D2 values of inter and intra-cluster distances are demonstrated in Table 7. All 17 clusters in the study showed zero intra-cluster differences. Differences among the clusters ranged from 9.00 to 91.11 inter-cluster distances. Cluster I exhibited minimum inter-cluster distance with cluster IV (13.19) and maximum inter-cluster distance with cluster V (67.72). Cluster II exhibited minimum inter-cluster distance with cluster III (12.19) and maximum inter-cluster distance with cluster VII (49.67). Cluster III exhibited minimum inter-cluster distance with cluster XI (14.12) and maximum inter-cluster distance with cluster IX (46.97). Cluster IV exhibited minimum inter-cluster distance with cluster VIII (9.00) and maximum inter-cluster distance with cluster V (60.05). Cluster V exhibited minimum inter-cluster distance with cluster IV (18.16) and maximum inter-cluster distance with cluster XII (91.11). Cluster VI exhibited minimum inter-cluster distance with cluster IX (17.33) and maximum inter-cluster distance with cluster IV (76.88). Cluster VII exhibited minimum inter-cluster distance with cluster XVI (10.72) and maximum inter-cluster distance with cluster XII (70.99).
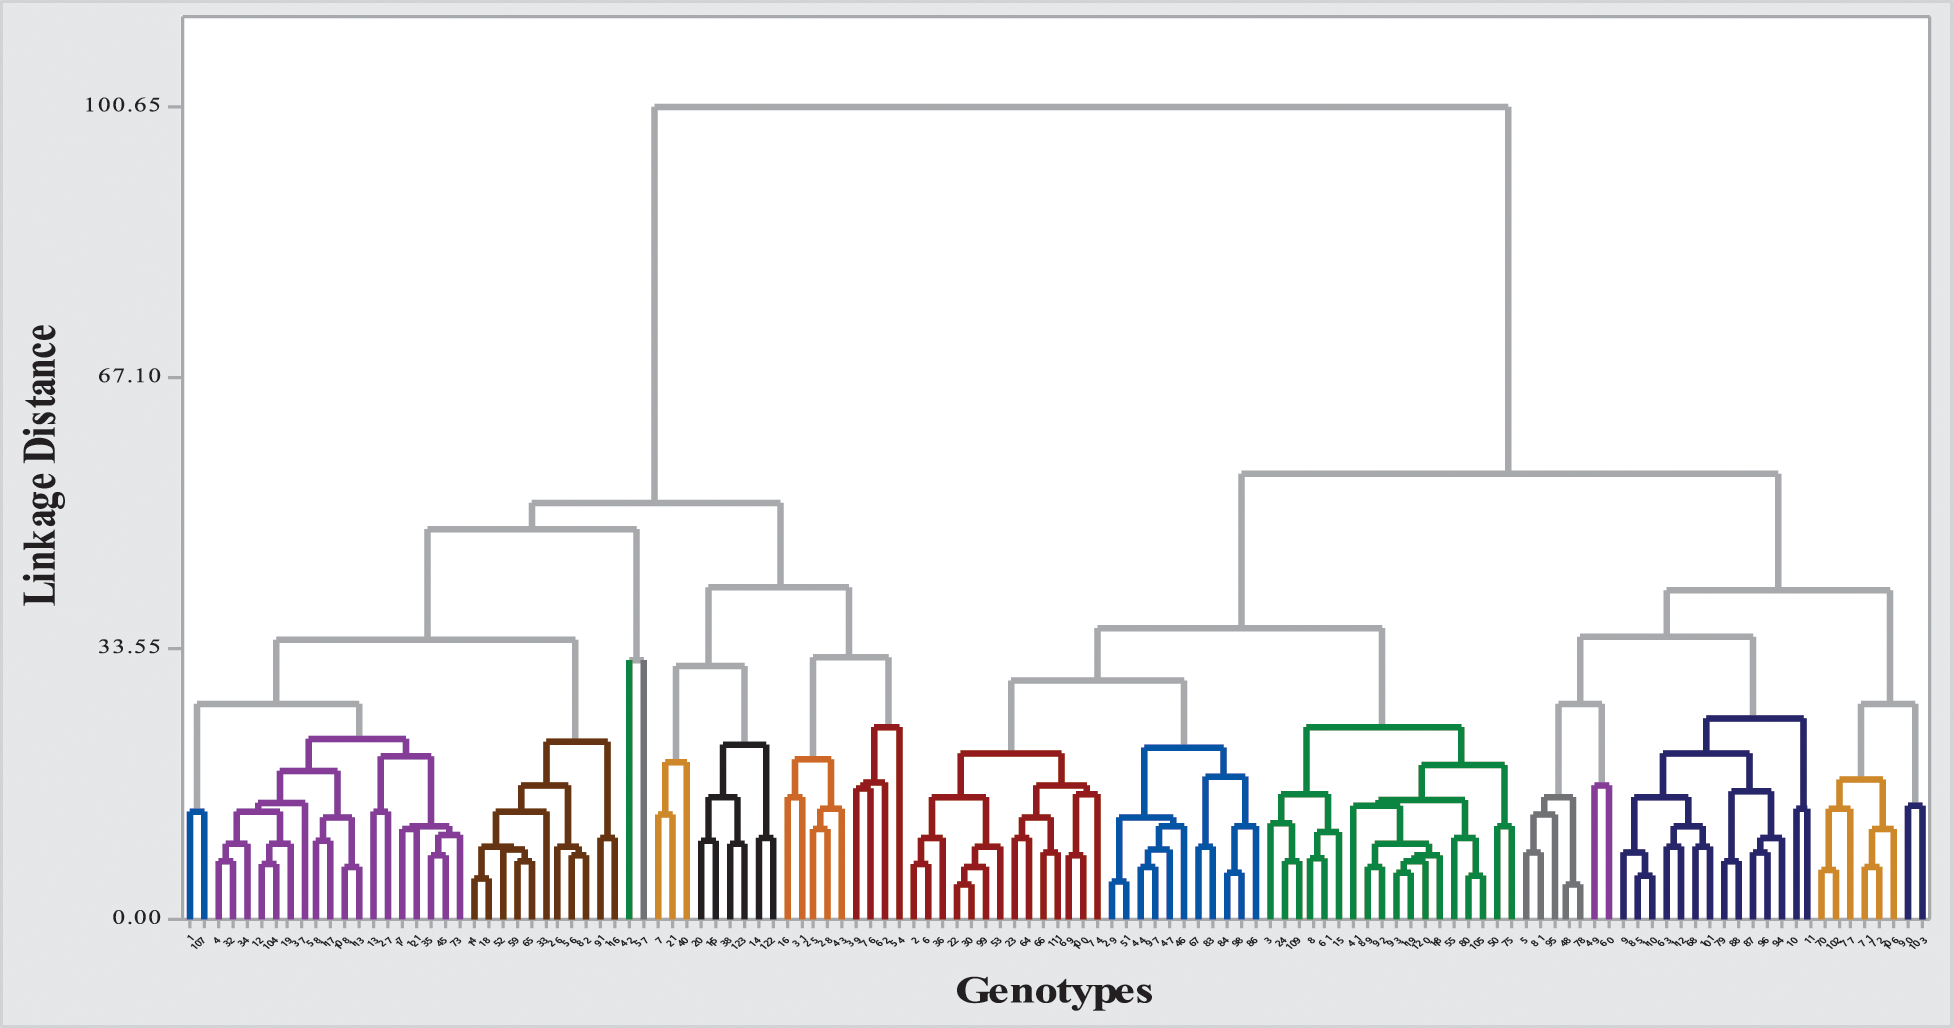
Figure 3: Dendrogram of 123 soybean genotypes based on morphological, phenological and yield attributing characters
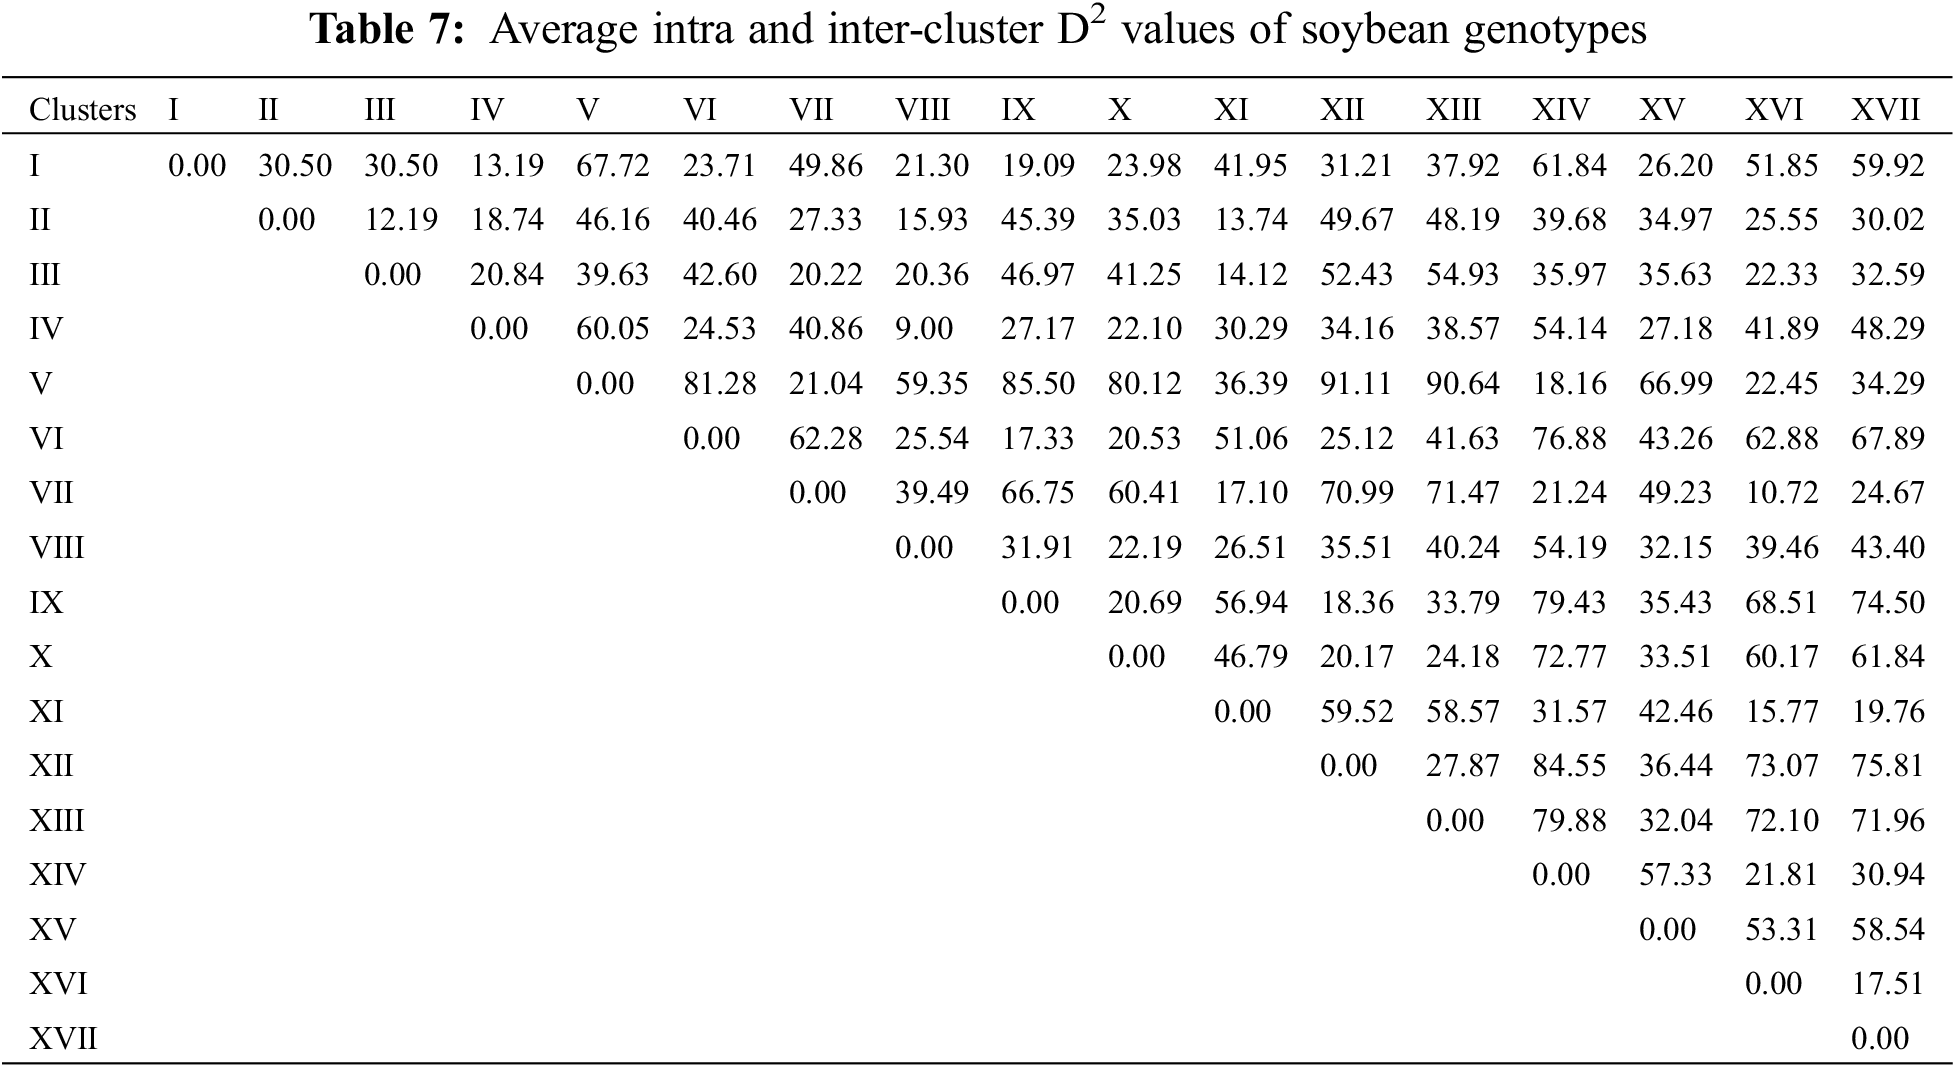
Cluster XIII exhibited minimum inter-cluster distance with cluster XI (26.51) and maximum inter-cluster distance with cluster XVII (43.40). Whereas, cluster IX minimum inter-cluster with cluster XII (18.36) and exhibit maximum inter-cluster distance with cluster XIV (79.43). Cluster X exhibited minimum inter-cluster distance with cluster XII (20.17) and maximum inter-cluster distances with cluster XIV (72.77) while cluster XI exhibited minimum inter-cluster distance with cluster XVI (15.77) and maximum inter-cluster distance with cluster XII (59.52). On the other hand, XII showed minimum inter-cluster distances with cluster XVIII and maximum inter-cluster distance with cluster IV (84.55) while cluster XIII showed minimum inter-cluster distances with cluster XV (32.04) and highest inter-cluster distance with cluster XIV (79.88). Cluster XIV exhibited minimum inter-cluster distances with cluster XVI (21.81) and maximum inter-cluster distances with cluster XV (57.33). Means of each cluster for 14 different agronomic attributes are illustrated in the Table 8. Cluster I comprised of only two genotypes which showed above mean values for all agronomic attributes except SPAD measurement. Cluster II contained 14 genotypes with above mean values of agronomic parameters, i.e., days taken to flowering initiation, petiole length, number of leaves per plant, SPAD measurement, days to pod initiation, and number seed per pod. Cluster III contained 18 soybean genotypes which showed more than mean values for number of seeds per pod, days to flowering initiation and number of leaves per plant. Cluster IV exhibit 18 evaluated genotypes which showed above average performance for rest of the studied agronomic characters except SPAD measurement. Cluster V contained five soybean genotypes and exhibit no parameter with above average mean cluster value for the studied agronomic parameters.
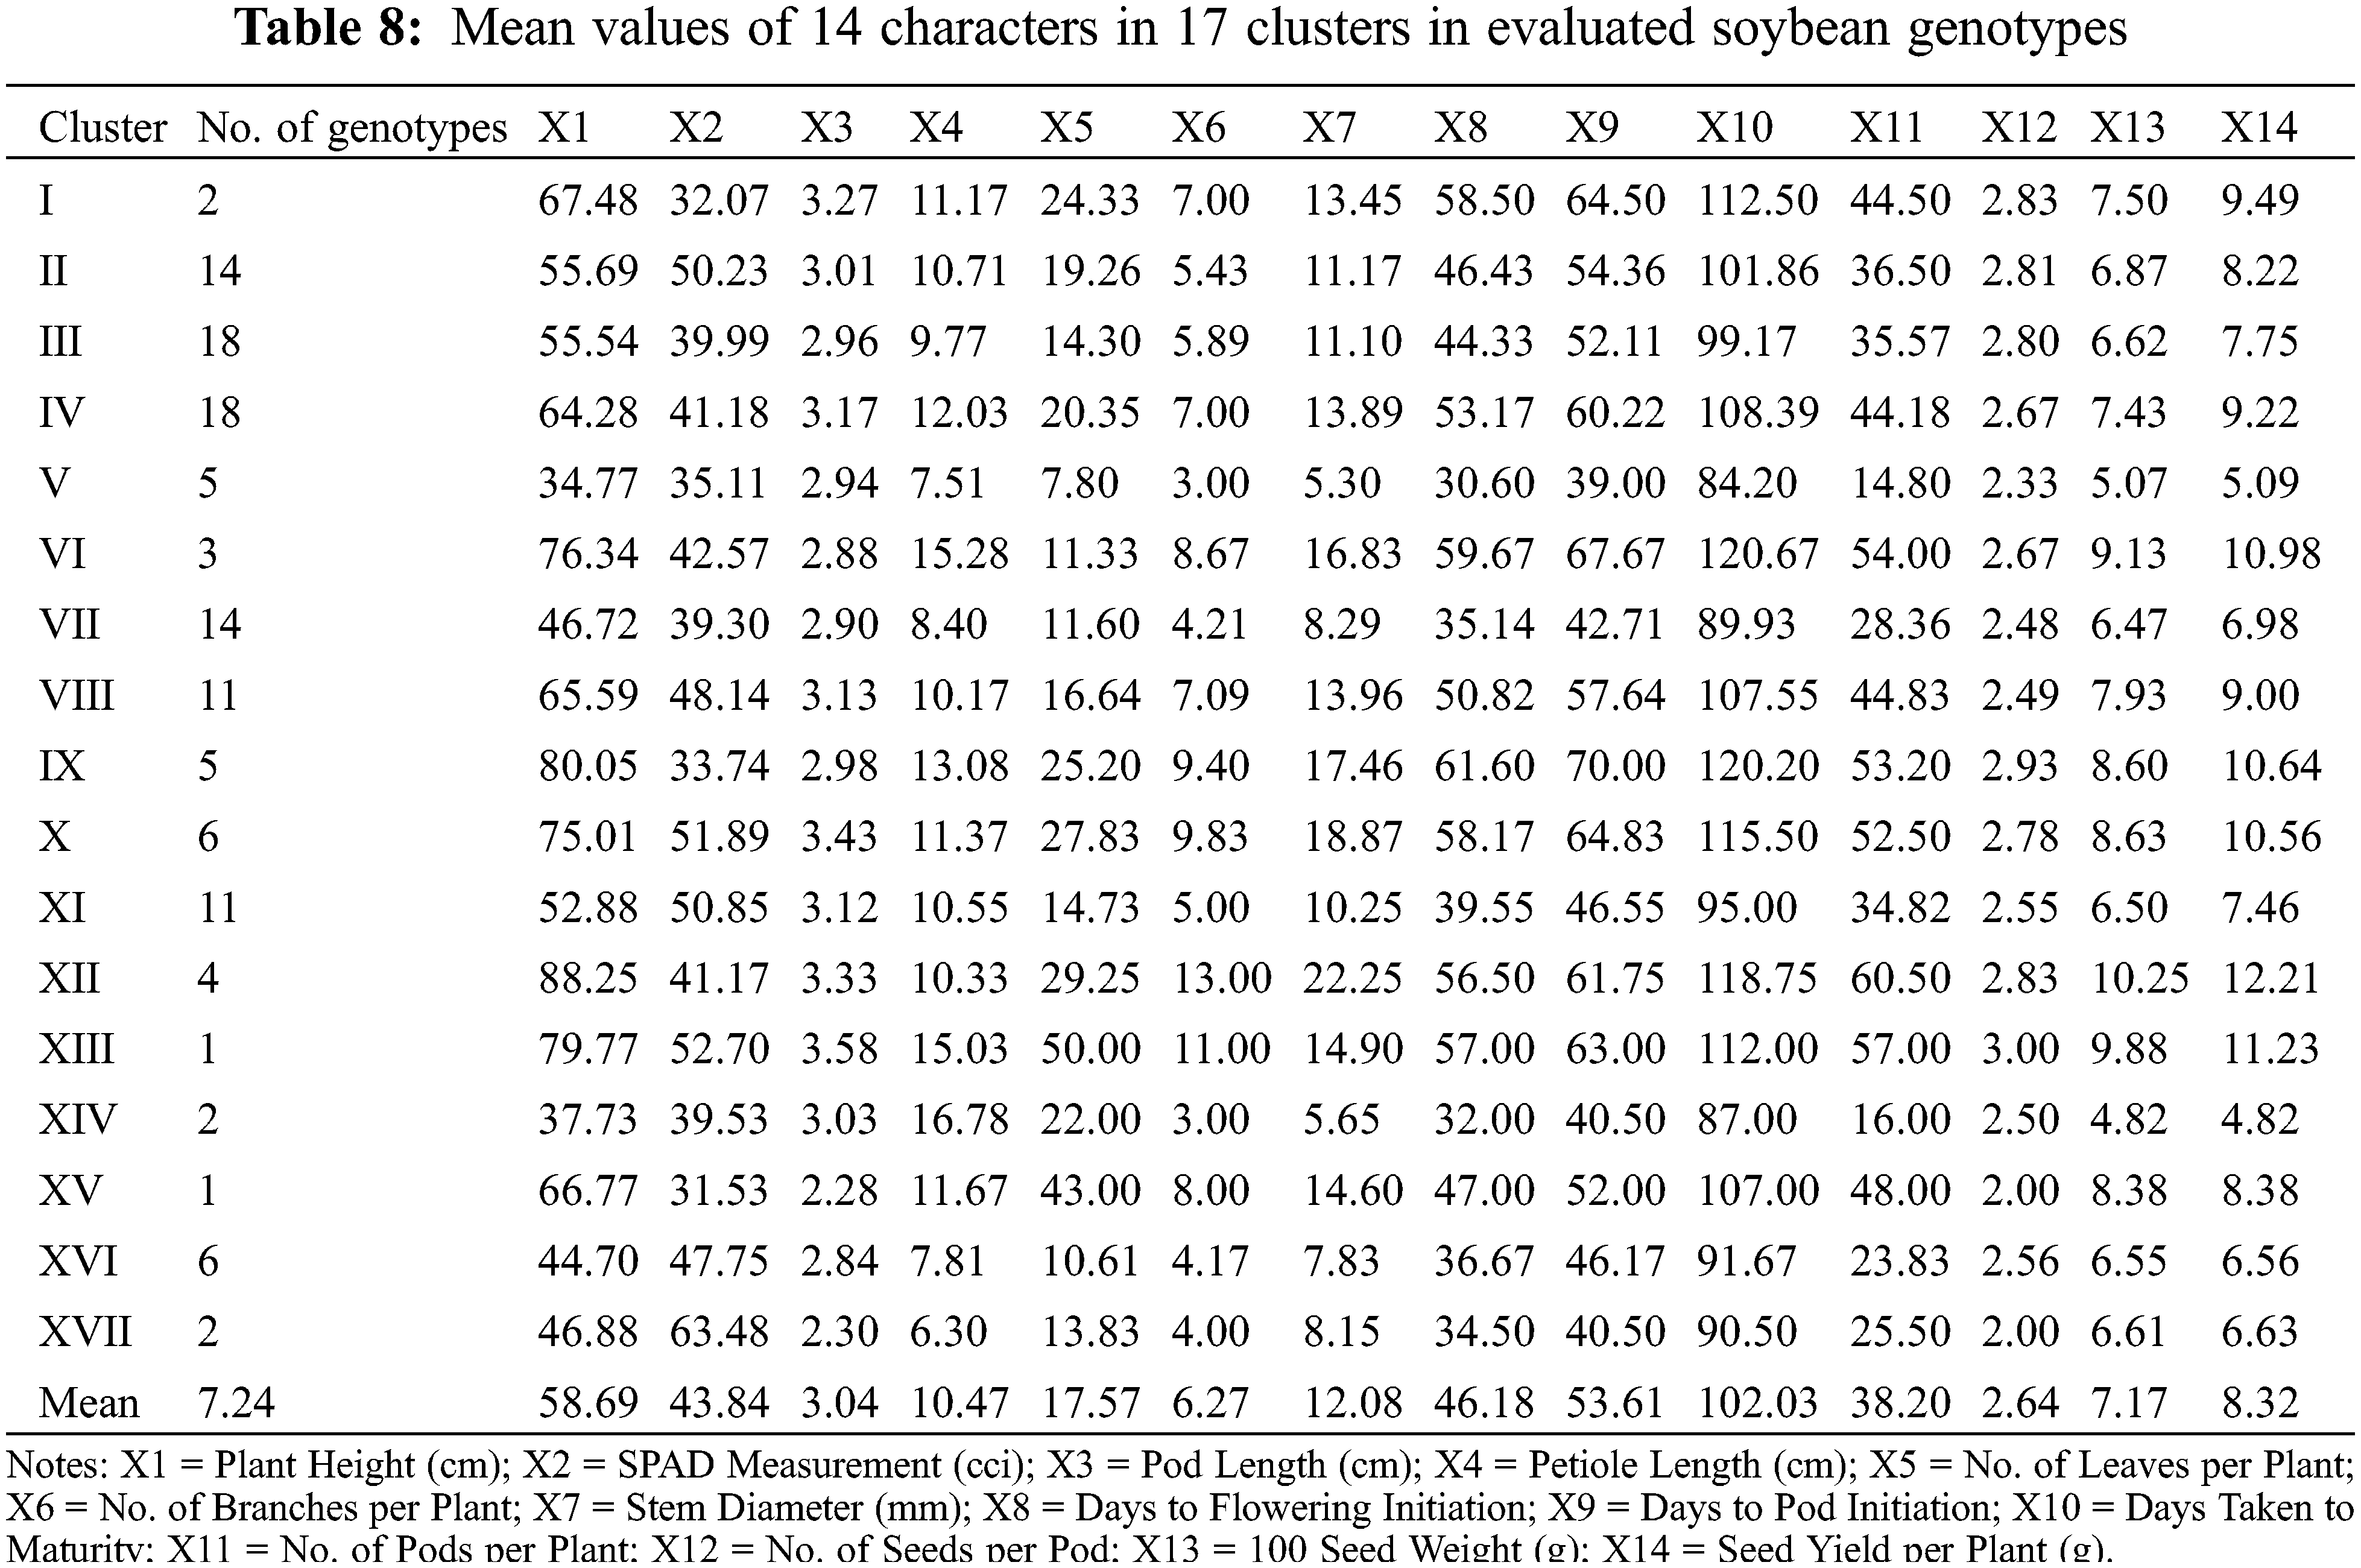
Cluster VI contained three genotypes and exhibit above average cluster means for all of the recorded agronomic parameters except SPAD measurement, pod length and number of leaves per plant. Cluster VII contained 14 genotypes with no parameter having above average cluster means. Cluster VIII contained 11 genotypes and exhibited above average cluster means for most of the characters except petiole length, number of leaves per plant and number of seeds per pod. Cluster IX contained five soybean genotypes and showed above average cluster means for most of the characters under study except SPAD measurement and pod length. Cluster X contained six soybean genotypes which showed above average cluster means for all agronomic parameters in the study except number of seeds per pod. Cluster XI covered 11 soybean genotypes with above average cluster means contained by SPAD measurement, pod length and petiole length. Cluster XII contained four soybean genotypes which showed above average cluster mean with rest of the recorded parameters except SPAD measurement and petiole length. Moreover, cluster XIII contained only one soybean genotype with above average cluster means with all of the studied agronomic characters. Cluster XIV contained four soybean genotypes and showed above average cluster means for only petiole length and number of leaves per plant. Cluster XV contained only one soybean genotype which showed above average cluster means for all characters except SPAD measurement, pod length, days taken to pod initiation, number of seeds per pod. Cluster XVI contained six soybean genotypes which showed above average cluster means only for SPAD measurement taken in the study. Cluster XVII contained only two soybean genotypes with above average cluster means only for SPAD measurement.
Utilization and conservation of gene diversity is a thriving vitality to develop crop genotypes that give high yield [28]. Analysis of variance (ANOVA) is a statistical method that uncovers the variability present among the treatment variables [29]. Analysis of variance (ANOVA) depicted significant genetic diversity in the evaluated soybean varieties for all recorded parameters excluding number of seeds per pod. Hence, variation exposed by ANOVA encourages the effective selection on the base of evaluated growth and yield parameters in order to initiate an effective soybean breeding program. Results of the study conducted by Sulistyo et al. [30] coincide with our findings as there is existence of ample variation. Descriptive statistics gives an obvious middle ground for effective data visualization based on quantitative description of different variables [31]. Various estimates of variability in the present study indicated non-significant environmental influence on evaluated soybean genotypes for most of the characters. A slight difference between genotypic coefficient of variation (GCV) and phenotypic (PCV) for almost all studied traits except days taken to maturity depicted the minimal environmental influence. Because of high susceptibility of soybean to photoperiod, there is a difference between GCV and PCV for days taken to maturity [32,33]. Moreover, high heritability estimates for most of the studied characters suggested the high transmissibility of genes associated with superior agronomic attributes. It also depicted the minimal environmental influence on the genetic expression of growth attributes [34]. Similar heritability estimates were seen in soybean [35] and maize [36], which proved to be of immense help in effective selection of superior agronomic attributes.
An adequate value of coefficient of variation (CV) percentage indicates the degree of precision with which the treatments are compared. In plant sciences, CV % is an important index for the assessment of yield stability based on agronomic performance [37]. Outcomes of this research show high CV % for most of the studied characters viz., 100 seed weight, No. of leaves, petiole length, No. of pods, days to pod initiation, SPAD measurement, stem diameter, days taken to flowering initiation, plant height, No. of branches, seed yield, pod length, and days taken to maturity. High heritability estimates for all of the studied agronomic characters could facilitate effective selection of the desirable soybean genotypes. Results of the descriptive statistics are in concordance with research conducted by Karunakar et al. [38] and Kumari et al. [39]. Selection relies on the level of the correlation between two traits in order to pinpoint pleiotropic effects and genetic linkage [20]. Correlation studies help pick good parental genotypes from the breeding population [40,41]. Generally, positive correlation depicts the direct relation among two variables while negative correlation coefficient leads to an inverse relation among two variables [42]. Several studies reported the significance of correlation analysis in indicating superior agronomic attributes to select high yielding genotypes in different oilseeds, i.e., in soybean [21,43,44], sesame [45–47] and canola [48,49]. In this research, correlation analysis revealed slight higher phenotypic correlation coefficients as compared to genotypic ones. Significant positive correlations among most of the studied characters with yield were recorded. Same result was observed by Ghodrati et al. [50] in soybean where most of the studied characters were positively correlated. Plant height is an integral phenotypic and growth attribute in plant breeding with which most of the other plant characteristics are associated. It provides an insight for estimating biological as well as economic yield. Plant height showed high positive relationship with almost all of the studied characters which directly depicted its usefulness for the selection of desirable soybean genotypes with improved agronomic performance. Similar association pattern of plant height with various yield and its attributing characters was observed by Mahbub et al. [51] except the association of 100-seed weight; which had a negative correlation with plant height in their findings while positively correlated in our study.
Utilization of SPAD readings is a simple and relatively reliable way for the instant assessment of chlorophyll contents without damaging the plant leaf [52]. Previously, Cruz et al. [53] argued that non-significant correlation might also lead to an effective interpretation of the degree of association based on magnitude and direction among different variables. In this research, SPAD measurements exhibited non-significant positive relation with many characters under observation whereas non-significant negative relation with number of seeds per pod, days to maturity and petiole length. Seed yield showed negative relation with pod length in this research. This significant decrease in pod length with increased yield might be due to increased number of pods per plant thus indicating the phenomenon of genetic determinacy. Similar results were observed in a study conducted by Akram et al. [54]. In contrast, Mahbub et al. [22] observed highly positive relationship between seed yield and pod length in soybean.
Selection of desirable genotypes from a genetically diverse pool of germplasm is the final goal of a soybean breeding program. Plant production is a complicated quantitative trait that relies on the relationship between growth parameters. Since correlation analysis can only estimate the relationship between variables, it may confound breeders to choose the optimal combination. In contrast, by decomposing the genotypic association into direct and indirect effects path coefficient analysis assesses the importance of yield-attributing traits. Therefore, a path coefficient analysis was performed to calculate the exact role that each trait had in the plant production. Path coefficient analysis has shown that most of the characters exhibit positive contribution in the seed production. High positive effect on seed production was estimated for plant height, 100-seed weight, number of branches per plant, days taken to flowering initiation, number of seeds per pod, SPAD measurement, stem diameter, number of pods per plant, petiole length and days taken to pod initiation. Similar results for 100-seed weight, number of pods per plant and number of branches per plant were individually revealed previously [44,55]. Positive effects of 100-seed weight, plant height and days taken to flowering initiation on seed yield coincides with the results concluded by Ghodrati et al. [50]. Whereas, Chavan et al. [56] revealed that plant height exhibited negative direct contribution in seed yield. Similarly, positive direct effects for number of branches per plant are in contradiction with the study conducted by Malek et al. [57].
Days taken to maturity number of leaves per plant and pod length negatively and directly contributed in seed yield per plant. This proposed that selection on the basis of such characters might reduce plant yield in soybean thus should not be included in the selection criteria. Similarly, Malik et al. [21] and Mahbub et al. [22] individually studied negative impacts of days taken to maturity on seed production; thus are in concordance with the results of the present study. On the other hand, Balla [43] showed high positive impact of days taken to maturity on seed production. Therefore, it might be possible that maturity index in soybean showed higher environmental influence as compared to the other reproductive growth attributes. Negative impacts of pod length on seed production in this research contradict with the study conducted by Arshad et al. [55] where it showed positive direct contribution in the seed yield. Results of the path coefficient analysis in this research concluded that selection based on various reproductive growth attributes i.e., number of pods per plant followed by days to flowering and 100-seed weight might lead to development of soybean genotypes with superior agronomic performance.
In plant breeding, identification of various groups based on genetic similarities and dissimilarities play a pivotal role in devising suitable hybridization scheme and the selection of superior parental lines [9]. Identification of various genetic patterns leads to the systematic characterization of available genetic diversity and facilitate plant breeders to assess the phylogenetic associations among the tested genotypes [10]. Estimation of genetic divergence can be effectively accomplished by using D2 statistics. Several researchers applied D2 statistics to classify evaluated genotypes into various groups or clusters in different legumes including soybean [58,39], chickpea [59], garden pea [60], lentils [61] and alfalfa [62]. In the present study, D2 statistics approach developed previously [19], and it was followed for phenotypic clustering of the evaluated soybean diversity panel based on various agronomic attributes. The soybean diversity panel was grouped into 17 clusters. All 17 clusters showed zero intra-cluster variability on the basis of which it can be assumed that negligible amount of variability has been existed within cluster. However, effective results for inter-cluster variation were observed where differences among the clusters ranged from 9.00 to 91.11. Cluster V gave maximal inter-cluster distance with cluster XII which showed that hybridization between the genotypes of these two genetically divergent clusters might produce extra-ordinary results, i.e., increased seed yield and adaptability. Considering the cluster mean analysis, it has been observed that cluster V contained early maturing genotypes as compared to rest of the clusters. Similarly, cluster XVII contained genotypes with highest SPAD readings depicting the higher photosynthetic efficiency in soybean and other plant species [63–66]. Cluster XII showed higher cluster means for No. of pods per plant along with 100-seed weight and seed yield per plant while the clustered genotypes took higher number of days to mature. Same outcomes were observed previously in soybean [58,39] where increased cluster mean for days taken to maturity resulted into higher seed yield per plant.
This study implies the high genetic divergence, growth and yield related attributes in soybean genotypes. Higher correlation coefficients coupled with considerable direct and indirect effects could be helpful for selecting superior yield and its attributing descriptors. Therefore, selection of desirable genetic combinations could be possible to develop soybean genotypes with superior agronomic performance. The exotic soybean genotypes also showed significant genetic potential regarding their utilization in the breeding program. Phenotypic clustering accomplished through cluster analysis effectively grouped the evaluated soybean diversity panel into various clusters. Genotypes which classified into those cluster groups having above mean value for maximum recorded parameters could be used for developing an effective soybean hybridization program. The findings of this study and the traits associated genotypic variations in soybean can be utilized by the breeders and farmers for improving agricultural traits in soybean.
Acknowledgement: The authors extend their appreciation to Researchers Supporting Project No. (RSP2023R298), King Saud University, Riyadh, Saudi Arabia.
Funding Statement: This research was funded by the Researchers Supporting Project No. (RSP2023R298), King Saud University, Riyadh, Saudi Arabia.
Conflicts of Interest: The authors declare that they have no conflicts of interest to report regarding the present study.
References
1. Li, J. H., Wang, E. T., Chen, W. F., Chen, W. X. (2008). Genetic diversity and Potential for promotion of plant growth detected in nodule endophytic bacteria of soybean grown in Heilongjiang Province of China. Soil Biology and Biochemistry, 40, 238–246. [Google Scholar]
2. Herridge, D. F., Peoples, M. B., Boddey, R. M. (2008). Global inputs of biological nitrogen fixation in agricultural systems. Plant and Soil, 311, 1–8. [Google Scholar]
3. Biate, D. L., Kumar, L. V., Ramadoss, D., Kumari, A., Naik, S. et al. (2014). Genetic diversity of soybean root nodulating bacteria. Bacterial Diversity in Sustainable Agriculture, 1, 131–145. [Google Scholar]
4. Chang, W. S., Lee, H. I., Hungria, M. (2015). Soybean production in the Americas. In: Principles plant-microbe interactions, pp. 393–400. Cham, Switzerland: Springer. [Google Scholar]
5. Liu, J., Zhu, J. K. (1997). Proline accumulation and salt-stress-induced gene expression in a salt-hypersensitive mutant of Arabidopsis. Plant Physiology, 114, 591–596. [Google Scholar] [PubMed]
6. Carrera, C., Martínez, M. J., Dardanelli, J., Balzarini, M. (2011). Environmental variation and correlation of seed components in nontransgenic soybeans: Protein, oil, unsaturated fatty acids, tocopherols, and isoflavones. Crop Science, 51, 800–809. [Google Scholar]
7. FAOSTAT (2019). World soybean production statistics. http://www.fao.org/faostat/en/#data/QC [Google Scholar]
8. Khurshid, H., Baig, D., Jan, S. A., Arshad, M., Khan, M. A. (2017). Miracle crop: The present and future of soybean production in Pakistan. MOJ Biology and Medicine, 2, 189–191. [Google Scholar]
9. Bhakuni, V., Shukla, P. S., Singh, K., Singh, V. K. (2017). Morphological characterization and assessment of genetic variability in soybean varieties. International Journal of Current Microbiology and Applied Sciences, 6, 361–369. [Google Scholar]
10. Naik, S. M., Madhusudan, K., Motagi, B. N., Nadaf, H. L. (2016). Diversity in soybean (Glycine max L.) accessions based on morphological characterization and seed longevity characteristics. Progressive Research—An International Journal, 11(3), 377–381. [Google Scholar]
11. Masoudi, B., Bihamta, M. R., Babaei, H. R., Peyghambari, S. A. (2008). Evaluation of genetic diversity for agronomic, morphological and phenological traits in soybean. Seed and Plant Journal, 24(3), 413–427. [Google Scholar]
12. Salimi, S., Lahiji, H. S., Abadi, G. M., Salimi, S., Moradi, S. (2012). Genetic diversity in soybean genotypes under drought stress condition using factor analysis and cluster analysis. World Applied Sciences Journal, 16, 474–478. [Google Scholar]
13. Malik, R., Tiwari, R., Arora, A., Kumar, P., Sheoran, S. et al. (2013). Genotypic characterization of elite Indian wheat genotypes using molecular markers and their pedigree analysis. Australian Journal of Crop Sciences, 7, 61–67. [Google Scholar]
14. Follmann, D. N., Souza, V. Q., Cargnelutti, A., Demari, G. H., Nardino, M. et al. (2019). Agronomic performance and genetic dissimilarity of second-harvest soybean cultivars using REML/BLUP and Gower’s algorithm. Bragantia, 18, 197–207. [Google Scholar]
15. Mukuze, C., Tukamuhabwa, P., Maphosa, M., Dari, S., Dramadri, I. O. et al. (2020). Genetic diversity analysis among soybean genotypes using SSR markers in Uganda. African Journal of Biotechnology, 19, 439–448. [Google Scholar]
16. Hwang, T. Y., Gwak, B. S., Sung, J., Kim, H. S. (2020). Genetic diversity patterns and discrimination of 172 korean soybean (Glycine max (L.) merrill) varieties based on SSR analysis. Agriculture, 10, 77. [Google Scholar]
17. Arslan, E., Mutlu, E. G., Dursun, O., Bagci, S. A. (2020). Comparative analysis of agronomic traits and ISSR method among some soybeans [Glycine Max (L.) Merr.] genotypes. Kahramanmaraş Sütçü İmam Üniversitesi Tarım ve Doğa Dergisi, 23, 687–696. [Google Scholar]
18. Kaur, G., Joshi, A., Jain, D., Choudhary, R., Vyas, D. (2016). Diversity analysis of green gram (Vigna radiata (L.) Wilczek) through morphological and molecular markers. Turkish Journal Agriculture and Forestry, 40, 229–240. [Google Scholar]
19. Mahalanobis, P. C. (1936). On the generalized distance in statistics. Proceedings of the National Institute of Science of India, vol. 2, pp. 49–55. [Google Scholar]
20. Sakai, K. I., Suzuki, A. (1964). Induced mutation and pleiotropy of genes responsible for quantitative characters in rice. Radiation Botany, 4, 141–151. [Google Scholar]
21. Malik, M. F., Ashraf, M., Qureshi, A. S., Ghafoor, A. (2007). Assessment of genetic variability, correlation and path analyses for yield and its components in soybean. Pakistan Journal of Botany, 39, 405. [Google Scholar]
22. Mahbub, M. M., Rahman, M. M., Hossain, M. S., Mahmud, F., Kabir, M. M. (2015). Genetic variability, correlation and path analysis for yield and yield components in soybean. American-Eurasian Journal Agriculture and Environment Sciences, 15(2), 231–236. [Google Scholar]
23. Diondra, W., Ivey, S., Washington, E., Woods, S., Walker, J. et al. (2008). Is there a correlation between plant height and yield in soybean. Reviews Biology and Biotechnology, 7, 70–76. [Google Scholar]
24. Hassanijalilian, O., Igathinathane, C., Doetkott, C., Bajwa, S., Nowatzki, J. et al. (2020). Chlorophyll estimation in soybean leaves infield with smartphone digital imaging and machine learning. Computers and Electronics in Agriculture, 174, 105433. https://doi.org/10.1016/j.compag.2020.105433 [Google Scholar] [CrossRef]
25. Steel, R. G., Torrie, J. H. (1980). Principles and procedures of statistics: A biometrical approach. New York: McGraw-Hill. [Google Scholar]
26. Cohen, J., Cohen, P., West, S. G., Aiken, L. S. (2002). Applied multiple regression/correlation analysis for the behavioral sciences, 3rd editionRoutledge. https://doi.org/10.4324/9780203774441 [Google Scholar] [CrossRef]
27. Dewey, D. R., Lu, K. (1959). A correlation and path-coefficient analysis of components of crested wheatgrass seed production. Agronomy Journal, 51(9), 515–518. https://doi.org/10.2134/agronj1959.00021962005100090002x [Google Scholar] [CrossRef]
28. Hufford, M. B., Berny, Y., Teran, J. C., Gepts, P. (2019). Crop biodiversity: An unfinished magnum opus of nature. Annual Review of Plant Biology, 29(1), 727–751. https://doi.org/10.1146/annurev-arplant-042817-040240 [Google Scholar] [PubMed] [CrossRef]
29. Sawyer, S. F. (2009). Analysis of variance: The fundamental concepts. Journal of Manual and Manipulative Therapy, 17(2), 27–38. https://doi.org/10.1179/jmt.2009.17.2.27E [Google Scholar] [CrossRef]
30. Sulistyo, A., Sari, K. P. (2018). Correlation, path analysis and heritability estimation for agronomic traits contribute to yield on soybean. IOP Conference Series: Earth and Environmental Science, 102, 12034. https://doi.org/10.1088/1755-1315/102/1/012034 [Google Scholar] [CrossRef]
31. Proches, S. (2016). Descriptive statistics in research and teaching: Are we losing the middle ground? Quality and Quantity, 50, 2165–2174. [Google Scholar]
32. Nico, M., Miralles, D. J., Kantolic, A. G. (2019). Natural post-flowering photoperiod and photoperiod sensitivity: Roles in yield-determining processes in soybean. Field Crops Research, 231, 141–152. [Google Scholar]
33. Yang, W., Wu, T., Zhang, X., Song, W., Xu, C. (2019). Critical photoperiod measurement of soybean genotypes in different maturity groups. Crop Sciences, 59, 2055–2061. [Google Scholar]
34. Saravanan, K. R., Vishnupriya, V., Prakash, M., Anandan, R. (2019). Variability, heritability and genetic advance in tomato genotypes. Indian Journal of Agricultural Research, 53, 92–95. [Google Scholar]
35. Mesfin, H. H. (2018). Path analysis, genetic variability and correlation studies for soybean (Glycine max (L.) Merill) for grain yield and secondary traits at Asosa, Western Ethiopia. Greener Journal of Plant Breeding and Crop Science, 6, 35–46. [Google Scholar]
36. Chavan, S., Bhadru, D., Swarnalatha, V., Mallaiah, B. (2020). Studies on genetic parameters, correlation and path analysis for yield and yield attributing traits in sweet corn (Zea mays L.). International Journal of Current Microbiology and Applied Sciences, 9, 1725–1734. [Google Scholar]
37. Ray, D. K., Gerber, J. S., MacDonald, G. K., West, P. C. (2015). Climate variation explains a third of global crop yield variability. Nature Communications, 6, 1–9. [Google Scholar]
38. Karunakar, J., Preethi, T. L., Boopathi, N. M., Pugalendhi, L., Hepziba, S. J. (2018). Genetic variability, correlation and path analysis in Moringa (Moringa oleifera L.). Journal of Pharmacognosy and Phytochemistry, 7, 3379–3382. [Google Scholar]
39. Kumari, S., Sreenivasa, V., Lal, S. K., Singh, S. K., Singh, K. P. (2019). Analysis of genetic diversity of 120 genotypes of Glycine max (L.) merrill by using D2 analysis. Journal of Pharmacognosy and Phytochemistry, 8, 1324–1329. [Google Scholar]
40. Abdelghany, A. M., Zhang, S., Azam, M., Shaibu, A. S., Feng, Y. et al. (2020). Profiling of seed fatty acid composition in 1025 Chinese soybean accessions from diverse ecoregions. Crop Journal, 8, 635–644. [Google Scholar]
41. Yu, K., Wang, H., Liu, X., Xu, C., Li, Z. et al. (2020). Large-scale analysis of combining ability and heterosis for development of hybrid maize breeding strategies using diverse germplasm resources. Frontiers in Plant Science, 11, 660. [Google Scholar] [PubMed]
42. Nogueira, A. P., Sediyama, T., de Sousa, L. B., Hamawaki, O. T., Cruz, C. D. et al. (2012). Path analysis and correlations among traits in soybean grown in two dates sowing. Bioscience Journal, 28, 877–888. [Google Scholar]
43. Balla, M. Y. (2017). Ibrahim, S.E. Genotypic correlation and path coefficient analysis of soybean [Glycine max (L.) Merr.] for yield and its components. Agriculture Research and Technology, 7, 1–5. [Google Scholar]
44. Machado, B. Q., Nogueira, A. P., Hamawaki, O. T., Rezende, G. F., Jorge, G. L. (2017). Phenotypic and genotypic correlations between soybean agronomic traits and path analysis. Genetics and Molecular Reseach, 16(2), gmr16029696. [Google Scholar]
45. Teklu, D. H., Kebede, S. A., Gebremichael, D. E. (2014). Assessment of genetic variability, genetic advance, correlation and path analysis for morphological traits in sesame genotypes. Asian Journal of Agricultural Research, 8, 181–194. [Google Scholar]
46. Fazal, A., Mustafa, H. S., Hasan, E., Anwar, M., Tahir, M. H. (2015). Interrelationship and path coefficient analysis among yield and yield related traits in sesame (Sesamum indicum L.). Nature Science, 13, 27–32. [Google Scholar]
47. Navaneetha, J. S., Murugan, E., Parameswari, C. (2019). Correlation and path analysis for seed yield and its components in sesame (Sesamum indicum L.). Electronic Journal Plant Breeding, 10, 1262–1268. [Google Scholar]
48. Rameeh, V. (2016). Multivariate analysis of some important quantitative traits in rapeseed (Brassica napus) advanced lines. Journal of Oilseed Brassica, 1, 162–169. [Google Scholar]
49. Tariq, H., Tanveer, S. K., Qamar, M., Javaid, R. A., Vaseer, S. G. (2020). Correlation and path analysis of Brassica napus genotypes for yield related traits. Life Science Journal, 17, 22–34. [Google Scholar]
50. Ghodrati, G. R., Sekhavat, R., Mahmoodi, S. H., Gholami, A. (2013). Evaluation of correlations and path analysis of components seed yield in soybean. International Journal of Agriculture, 3, 795. [Google Scholar]
51. Mahbub, M. M., Shirazy, B. J. (2016). Evaluation of genetic diversity in different genotypes of soybean (Glycine max (L.) Merrill). American Journal of Plant Biology, 25, 24–29. [Google Scholar]
52. d’Oliveira, P. S., Suzuki, L. S., da-Costa Carneiro, J., Machado, J. C., Prates, J. F. et al. (2020). Use of SPAD index in elephant grass pre-breeding. Ciências Agrárias, 41, 1047–1052. [Google Scholar]
53. Cruz, C. D., Regazzi, A. J., Carneiro, P. C. S. (2012). Modelos biométricos aplicados ao melhoramento genético. 4th edition. Viçosa: UFV. [Google Scholar]
54. Akram, R. M., Fares, W. M., Fateh, H. S., Rizk, A. M. (2011). Genetic variability, correlation and path analysis in soybean. Egyptian Journal of Plant Breeding, 15, 89–102. [Google Scholar]
55. Arshad, M., Ali, N., Ghafoor, A. (2006). Character correlation and path coefficient in soybean Glycine max (L.) Merrill. Pakistan Journal of Botany, 38, 121. [Google Scholar]
56. Chavan, B. H., Dahat, D. V., Rajput, H. J., Deshmukh, M. P., Diwane, S. L. et al. (2016). Correlation and path analysis in soybean. Studies, 1, 2. [Google Scholar]
57. Malek, M. A., Rafii, M. Y., Afroz, S. S., Nath, U. K., Mondal M. (2014). Morphological characterization and assessment of genetic variability, character association, and divergence in soybean mutants. Scientist World Journal, 1, 14–20. [Google Scholar]
58. Dubey, N., Avinashe, H. A., Shrivastava, A. N. (2018). Evaluation of genetic diversity among soybean [Glycine max (L.)] genotypes using multivariate analysis. Plant Archeology, 18, 908–912. [Google Scholar]
59. Singh, R. P., Singh, I., Singh, S., Sandhu, J. S. (2012). Assessment of genetic diversity among interspecific derivatives in chickpea. Journal of Food Legumes, 25, 150–152. [Google Scholar]
60. Sekhon, B. S., Sharma, A., Katoch, V., Kapila, R. K., Sood, V. K. et al. (2019). Assessment of genetic diversity in advanced breeding lines derived from intraspecific crosses of garden pea (Pisum sativum L.). Legume Research International Journal, 42, 145–152. [Google Scholar]
61. Satpathy, S., Debnath, S. (2020). Assessment of genetic divergence for quantitative traits in Lens culinaris. International Journal of Current Microbiology and Applied Sciences, 9, 252–261. [Google Scholar]
62. Rahman, M. A., Alam, I., Kim, Y. G., Ahn, N. Y., Heo, S. H. et al. (2015). Screening for salt-responsive proteins in two contrasting alfalfa cultivars using a comparative proteome approach. Plant Physiology and Biochemistry, 89, 112–122. [Google Scholar] [PubMed]
63. Islam, M. R., Kamal, M. M., Hossain, M. F., Hossain, J., Azam, M. G. et al. (2023). Drought tolerance in Mung bean is associated with the genotypic divergence, regulation of proline, photosynthetic pigment and water relation. Phyton, 92, 955–981. [Google Scholar]
64. Rahman, M. A., Kabir, A. H., Song, Y., Lee, S. H., Hasanuzzaman, M. et al. (2021). Nitric oxide prevents Fe deficiency-induced photosynthetic disturbance and oxidative stress in alfalfa by regulating Fe acquisition and antioxidant defense. Antioxidants, 10, 1556. [Google Scholar] [PubMed]
65. Kabir, A. H., Ela, E. J., Bagchi, R., Rahman, M. A., Peiter, E. et al. (2023). Nitric oxide acts as an inducer of Strategy-I responses to increase Fe availability and mobilization in Fe-starved broccoli (Brassica oleracea var. oleracea). Plant Physiology and Biochemistry, 194, 182–192. [Google Scholar] [PubMed]
66. Rahman, M. A., Woo, J. H., Lee, S. H., Park, H. S., Kabir, A. H. (2022). Regulation of Na+/H+ exchangers, Na+/K+ transporters, and lignin biosynthesis genes, along with lignin accumulation, sodium extrusion, and antioxidant defense, confers salt tolerance in alfalfa. Frontiers in Plant Science, 13, 1041764. [Google Scholar] [PubMed]
Cite This Article
 Copyright © 2023 The Author(s). Published by Tech Science Press.
This work is licensed under a Creative Commons Attribution 4.0 International License , which permits unrestricted use, distribution, and reproduction in any medium, provided the original work is properly cited.
 Downloads
 Citation Tools