
 Submit a Paper
 Propose a Special lssue
 Open Access
ARTICLE

Cd and Hg Mediated Oxidative Stress, Antioxidative Metabolism and Molecular Changes in Soybean (Glycine max L.)
1
Department of Biotechnology, Faculty of Natural Sciences, Jamia Millia Islamia, New Delhi, 110025, India
2
Department of Biosciences, Faculty of Natural Sciences, Jamia Millia Islamia, New Delhi, 110025, India
3
Department of Botany and Microbiology, College of Science, King Saud University, Riyadh, 11451, Saudi Arabia
4
Plant Biology Section, School of Integrative Plant Science, Cornell University, Ithaca, USA
* Corresponding Author: Mohammad Irfan Qureshi. Email:
Phyton-International Journal of Experimental Botany 2023, 92(6), 1725-1742. https://doi.org/10.32604/phyton.2023.026100
Received 16 August 2022; Accepted 16 December 2022; Issue published 11 April 2023
 View Full Text
 Download PDF
Abstract
Cadmium (Cd) and Mercury (Hg) is among the heavy metals most hazardous for plant and human health. Known to induce oxidative stress in plants and disbalance equilibrium in the antioxidant defence system, these metals alter plant growth and cause damage at the cellular and molecular levels. Soybean is an important oilseed crop that is raised in soils often contaminated by Cd and Hg. The comparative studies on the deleterious effect of Cd and Hg and the defence system of antioxidants were not studied earlier in soybean plant. In this study, soybean plants were exposed to Cd (100 µM CdCl2) and Hg (100 µM HgCl2) and studied for physiological, biochemical and molecular responses. Both Cd and Hg treatment increased the magnitude of oxidative stress. Activities of antioxidant enzymes were significantly upregulated in response to Cd and Hg stress. Quantitative and qualitative assessment of isolated RNA showed significant differences in RNA under stress. Integrity values of RNA con- firmed alterations. Transcript level of the Actin gene, involved in the morphogenesis of plants and also used as referenced gene in expression studies was analyzed using qRT-PCR just to check its stability and response under heavy metal stress. Results showed significant upregulation of the gene in the presence of Cd. It can be concluded that both Cd and Hg caused oxidative damage to plants, and adversely affected the quality of RNA. However, soybean tried to limit the adverse impacts of Cd and Hg stress by elevating the antioxidant system and upregulating Actin gene.Keywords
Soybean is among the important staple food sources all over the world. It is an excellent source of proteins, oil with less saturated fat, and fiber [1]. Hence, soybean serves as an important experimental crop in agricultural research areas [2]. Soy protein has very powerful effects of decreasing plasma cholesterol, cancer prevention, diabetes control, control of obesity, and defense against stomach and kidney disease [3,4]. In the process of water and mineral uptake, roots easily pick up uninvited ionized toxic heavy metals [5] which have no function in plant metabolism except causing toxicity and reducing plant growth and development [6].
Cadmium (Cd) is one of the most potentially hazardous metal pollutants which caused serious health hazards once absorbed in the body, it is efficiently taken into the human body and accumulated for the entire life of humans [7]. When Cd is released into agricultural lands it affects numerous parameters of plant growth and physiology. Cd alters RNA expression, DNA methylation, and modifies histones [8]. Exposure to Cd, altered the expression pattern of various key genes involved in the regulatory mechanism of plants [9]. Cd affects gene expressions through its ability to change the activities of various pathways of signal transduction [10]. In plants, Cd also changes the levels of metabolic constituents involved in various pathways and ultimately generated reactive oxygen species (ROS) by inducing oxidative stress [11]. The generated ROS reacted with proteins, pigments, lipids and eventually degraded nucleic acids [12].
Mercury (Hg) is another serious environmental pollutant that is toxic to plants and animals and has become a major problem in recent times [13]. Hg is well known for affecting the antioxidant defence mechanism of plants, by modulating various enzymatic and non-enzymatic antioxidant activities [14].
Actin is a housekeeping gene that encodes a protein, which was involved in various significant subcellular processes in plants. Cell shape was determined by actin microfilament cytoskeleton which is concerned with cell division, cell elongation and plane localization [15]. Actin has vital significance for plant growth and development [16]. Actin is commonly used as a reference gene (control) in comparative expression analysis studies due to its stability [17], but several researchers reported that various abiotic factors affected its stability and gene expression which induced changes in the morphogenesis of plants and ultimately affects plant development [12,18]. For the first time in this study, we analyze the transcript level of the soybean plant actin gene under heavy metal (Cd and Hg) treatment to infer its stability and response to stress. This gene was also studied to investigate whether it will be used as a reference gene in future gene expression studies in soybean under stress conditions.
This study analyzes the deleterious effects of most hazardous heavy metals, Cd and Hg on important physiological and biochemical parameters of soybean including defence mechanisms represented by enzymatic and non-enzymatic antioxidants. The impact of Cd and Hg on the quality of RNA and transcript level of the actin gene was also considered to deduce its stability and its role in defence.
2.1 Plant Growth and Stress Treatment
Soybean (Glycine max L.) seeds of genotype JS-335 were officially procured from the ICAR-Indian Institute of Soybean Research (Indore, Madhya Pradesh). Healthy and physically uniform seeds were washed with detergent and sterilized in 1% (v/v) sodium hypochlorite for 8 min followed by 15 washings with double distilled water (DDW). Seeds were germinated in moist condition on paper beds for 5 days. The experiments were designed to form three sets of treatments viz. Control, Cadmium (Cd) and Mercury (Hg). Seedlings were transferred to the pots filled with 0.5 kg Soilrite (sterilized) for full plant growth and watered on alternate days. The first sets of pots were used as Control (only supplied with Hoagland nutrient solution) and experiments were conducted from triplicate pots.
When plants were 30 days old, stress was induced, in the second set of pots 100 µM CdCl2 was supplied and the third set was supplied with 100 µM HgCl2, dissolved in Hoagland nutrient solution. This solution (Hoagland nutrient solution + stress) was supplied to pots once a day. The exposure to stressors continued for 10 days period. All pots were placed inside a growth chamber at 27°C and alternate light (16 h) and dark (8 h) periods.
2.2 Physiological and Biochemical Parameters
After 10 days of treatments, sampling of forty-days-old plants (40 DAS; vegetative stage) was done. Plants were uprooted and rinsed with distilled water. From all the treatments fully expanded mature fresh leaves were harvested and stored in liquid N2 for performing further experiments on three biological replicates. For metal estimation, root and leaf samples were dried in a hot-air oven at 70°C for 3 days.
2.2.1 Estimation of Metal Accumulation
The root and leaf samples of all treatments were placed in an oven for complete drying at 70°C for 3 days. 100 mL mixture of HNO3 and HClO4 in a 5:2 ratio was used for digesting 0.5 g of plant material. The digested mixture was filtered with Whatman filter paper and made up to 50 mL. The estimation of metals (Cd and Hg) was performed by ICP-OES (Inductively Coupled Plasma-Optical Emission Spectrometry) in CIRBSc, Jamia Millia Islamia, New Delhi–110025, India.
From fresh soybean plants, full height was measured of all sets of Control, Cd and Hg treated plants. All sets of plants were parted into roots, stems and leaves. Plant fresh weight (FW) and dry weight (DW) were measured in grams (g).
Chlorophyll pigments (chlorophyll a, chlorophyll b, total chlorophyll and total carotenoids) in leaves were calculated by Hiscox and Israelstam, 1979 [19]. 1 g of fresh leaves were powdered in liquid N2 using a mortar and pestle. Added 10 mL of dimethyl sulfoxide (DMSO), and placed in a hot air oven at 65°C for 1 h. Optical density (OD) was recorded at 480, 645, 520, and 663 nm in a spectrophotometer. The concentrations of chlorophyll pigments were estimated by the Arnon formula, 1949 [20].
2.3 Estimation of Thiobarbituric Acid Reactive Substances (TBARS)
The magnitude of oxidative stress was estimated in terms of TBARS by the method of Heath and Packer [21]. 0.5 g of fresh leaves were ground in liquid nitrogen. 1% (w/v) trichloroacetic acid (TCA) was added to this and centrifugation was done for 5 min at 9660 xg. 1.0 mL of supernatant mixed with 4.0 mL of 0.5% (w/v) 2-thiobarbituric acid (TBA). Finally, this mixture was incubated at 95°C for 35 min, then placed on an ice bath and again centrifuged for 5 min. Supernatant OD was measured at 532 nm and 600 nm.
2.4 Histochemical Detection of Hydrogen Peroxide
For physical detection of H2O2 effect on leaves, fresh leaves were put in DAB solution (3, 3′-Diaminobendizine, 1 mg/mL) and kept overnight. All the chlorophyll of leaves was removed by boiling for 10 min in ethanol. The reddish-brown color that appeared on leaves denoted the H2O2 content. It was visualized and photographed in white light illuminator [6].
2.4.1 Estimation of H2O2 Content
H2O2 content on leaves was assessed by Yu et al. method [22]. Leaves were ground and added with 3 mL of potassium phosphate buffer, spun at 9660 xg for 20 min. The supernatant was taken out and added with 0.5 mL of titanium chloride solution and incubated for 10 min at room temperature. Again spun for 10 min. Optical density was recorded at 410 nm for the estimation of H2O2 concentration.
2.5 Extraction and Analysis of Antioxidant Enzymes
0.5 g of leaf samples were mixed evenly with 5 mL of cooled phosphate buffer (100 mM, pH 7.4, 1 mM EDTA, 2.5 mM DL-dithiothreitol, 0.5% (v/v) Triton X-100 and 4% (w/v) insoluble polyvinylpyrrolidone) and centrifuged for 30 min at 9660 xg, the supernatant was taken out and used in enzymatic analysis. This Enzyme extraction was done at 4°C. All enzymatic assays were done at 25°C temperature.
2.5.1 Superoxide Dismutase Assay (SOD)
SOD activity was calculated by the process described by Dhindsa et al. [23]. It was estimated by its capacity to restrain photochemical reduction of nitro blue tetrazolium (NBT). In this assay 1.5 mL phosphate buffer (0.1 M) was mixed with 0.2 mL methionine and 0.1 mL extract of the enzyme with an equivalent amount of 1M NA2CO3, 2.25 mM NBT solution, 3 mM EDTA, 60 mM riboflavin and 10 mL DDW (Double Distilled Water). All the mixtures were incubated in dark for 10 min and then absorbance was taken at 560 nm. SOD was expressed in units of EU (Enzyme Unit) min−1 mg−1 protein.
2.5.2 Ascorbate Peroxidase Assay (APX)
Ascorbate peroxidase (APX) assay was done by taking supernatant absorbance at 290 nm according to Qureshi et al. [24]. A reaction mixture of 100 mM potassium phosphate buffer, pH 7.4, 0.5 mM ascorbate, 0.3% H2O2 and 100 μL of enzyme extract was formed at a total volume of 1 mL. Enzyme unit is stated as the quantity of APX necessary for the oxidation of 1 µM of ascorbate/min.
The catalase activity (CAT) was calculated as the decline in supernatant absorbance at 240 nm as described by Aebi [25]. The reaction mixture of 1 mL comprised 50 mM sodium phosphate buffer (pH 7.0), 20 mM H2O2 and 100 μL of enzyme extract. Enzyme kinetics was performed for 15 min and expressed EU mg−1 protein min−1. Enzyme unit is stated as the quantity of CAT necessary for the decomposition of 1 µM of H2O2/min.
2.5.4 Glutathione Reductase Activity (GR)
The activity of glutathione reductase (GR) was performed by the method of Anderson et al. [26]. The reduction in absorbance at 340 nm was measured to calculate the enzyme activity. Enzyme kinetics was performed for 15 min and enzyme unit is stated as the quantity of GR which catalyzed the reduction of 1 µM of GSSG mg−1 protein min−1.
2.6 Estimation of Non-Enzymatic Antioxidants
The amount of proline in leaf samples was estimated by the method described by Bates et al. [27]. 0.5 g of fresh leaves were ground and mixed with 10 mL of sulphosalicylic acid and then centrifuged for 10 min at 5590 xg. 2 mL acid ninhydrin mixed with 2 mL of supernatant with glacial acetic acid (2 mL) was added in it and placed in a water bath for 30 min at boiling temperature. After that, all reactions were done in an ice bath and toluene (4 mL) was added. The upper toluene layer was taken out into the cuvette and absorbance was recorded at 520 nm. Proline concentration was estimated by the standard curve of L-proline.
All data were represented as the mean ± standard error. Plants’ triplicate data were measured for all physiological and biochemical parameters. Statistical analysis was done using one-way analysis of variance (ANOVA) in SPSS-17 statistical software (SPSS Inc., USA) and evaluation of significant differences was calculated for all the data at p ≤ 0.05. MetaboAnalyst 3.0 (Appendix A) software was used for the generation of heat-map and calculation of Principal component analysis (PCA) and partial least squares discriminant analysis (PLS-DA).
Fresh leaf (1 g) was ground to powder by adding liquid N2 and 1 mL TRIzol reagent. Centrifugation of lysate was done at 4°C at 12,000 xg for 5 min, supernatant was taken out into a fresh vial and incubated for a further 5 min to dissociate from nucleoproteins. Then 0.2 mL of chloroform was added to the vial and incubated for 2–3 min. Again, centrifuged at 12,000 xg for 15 min at 4°C. The upper RNA layer was added to a new Eppendorf and 0.5 mL of Isopropanol was added and incubated for 10 min. Again, centrifugation was done at 12,000 xg for 10 min at 4°C. After discarding the supernatant, the pellet was resuspended in 1 mL of 75% ethanol. The sample was vortexed and then centrifuged at 7500 xg for 5 min. The RNA pellet was dried in air for 5 min, then dissolved in 40 µL of DEPC-treated water and 0.1 mM EDTA and further incubated at 60°C for 15 min. 5 µL of RNA solution was added to 495 µL DEPC-treated water.
2.8.1 Quantification of Total RNA
The absorbance of RNA samples was recorded at 260 and 280 nm using a spectrophotometer (IMPLEN, CA, USA). The ratio of OD260/OD280 and OD260/OD230 nm measures the purity of nucleic acids. A pure sample of RNA has an OD260/OD280 ratio lies in 1.8–2.0.
2.8.2 RNA Integrity Number (RIN)
RIN method is applied for electrophoretic RNA integrity measurements, usually obtained using gel electrophoresis with ethidium bromide staining for the visualization of bands of rRNA peaks. RIN for a sample is computed using several characteristics of an RNA electropherogram trace using the Agilent Bioanalyzer machine.
2.8.3 Qualitative Analysis of Total RNA
Isolated RNA from fresh leaves of Control, Cd and Hg treated plants was qualitatively analyzed in agarose (1%) gel electrophoresis stained with EtBr and seen with the help of a gel doc.
2.9 Reverse Transcriptase Polymerase Chain Reaction (RT-PCR) or cDNA Synthesis
cDNA first strand was synthesized using 2.5 µg of total RNA mixed with other reactants like oligo (dT) primer (18 mer, 0.5 µg in 1 µL) and DEPC-treated water (0.1%, 10 µL) were gently mixed, spun and incubated at 65°C/5 min and followed by placing on ice for 1 min. A mixture was prepared to have 4 µL reaction buffer, Ribolock RNase inhibitor (20 units in 0.5 µL), dNTPs mix (2 µL of 10 mM) and M-MuLV reverse transcriptase (200 units in 1 µL) mixed gently and briefly spun. Then this mixture was incubated at 42°C for 60 min, and after that reaction was terminated by heating at 70°C/10 min.
Primers were designed and synthesized for housekeeping gene plant actin using Primer3 plus software as follows:
Plant-Actin-qFP: 5′ – CTCAGTGGTGGTACTACTATGTTCACTGG – 3′
Plant-Actin-qRP: 5′ – AGATGGAGCCTCCAATCCAGACACTG – 3′
RT-PCR was done with primers of the actin gene. PCR was performed with initial PCR activation and denaturation done for 5 min at 94°C, followed by 35 cycles of denaturation at 94°C for 1 min, annealing at 52°C for 1 min and extension at 72°C for 1 min. The final extension was performed at 72°C for 10 min. Finally, PCR products picked with actin gene-specific primers were run and analyzed on 2% (w/v) agarose gel and photographed.
2.11 Quantitative Real-Time PCR (qRT-PCR)
qRT-PCR was done using a master mix of SYBR green, actin-specific primer and cDNA to make a volume of 50 μL. All reactions were kept in triplicates & run was taken on ABI Step-One Real-Time PCR machine. The conditions used for amplification were 95°C for 10 min, 40 cycles at 95°C for 15 s, and 60°C for 60 s followed by the conditions needed to calculate the melting curve. The cycle threshold (Ct) values of all samples were exported from the detection software MxProTM v.4.1 (Stratagene, Waldbronn, Germany).
3.1.1 Metal Accumulation and Growth Attributes
The concentration of metals recorded in soybean root and leaf was shown in (Table 1). Both 100 µM Cd and 100 µM Hg levels recorded the highest accumulation in roots as compared to leaves. Growth parameters were calculated on plant triplicates. It was noted both Cd and Hg caused stunted growth, chlorosis and necrosis in soybean leaves (Fig. 1). 100 µM concentration of CdCl2 and HgCl2 significantly decreased growth attributes (Table 2).
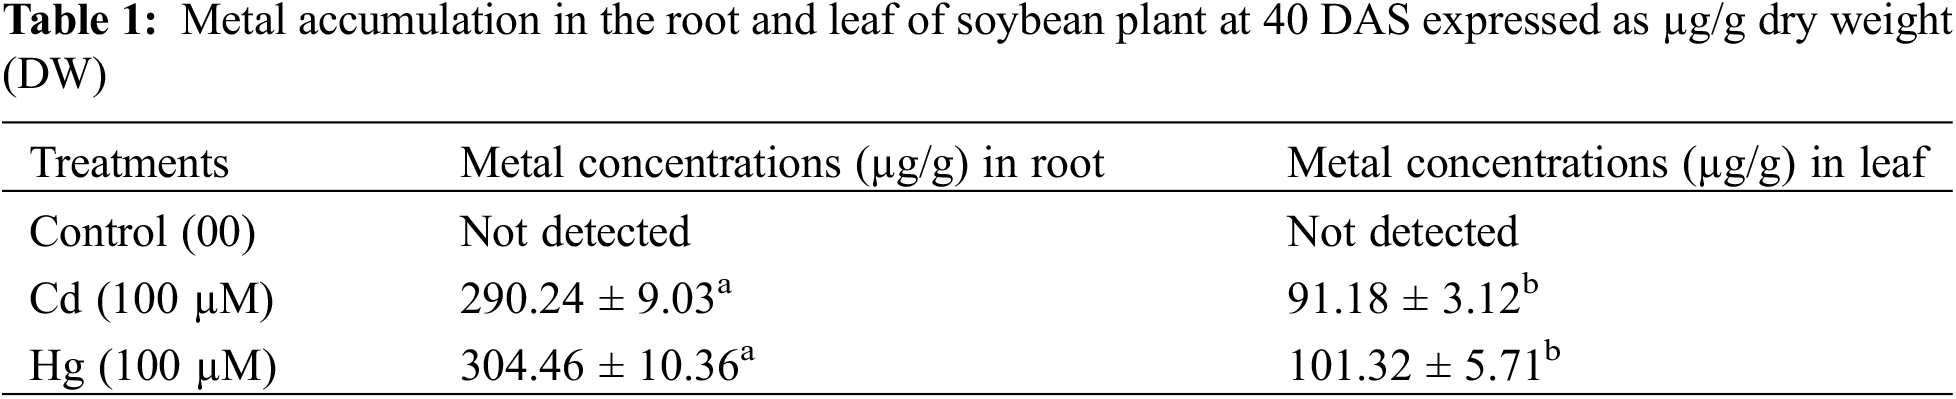
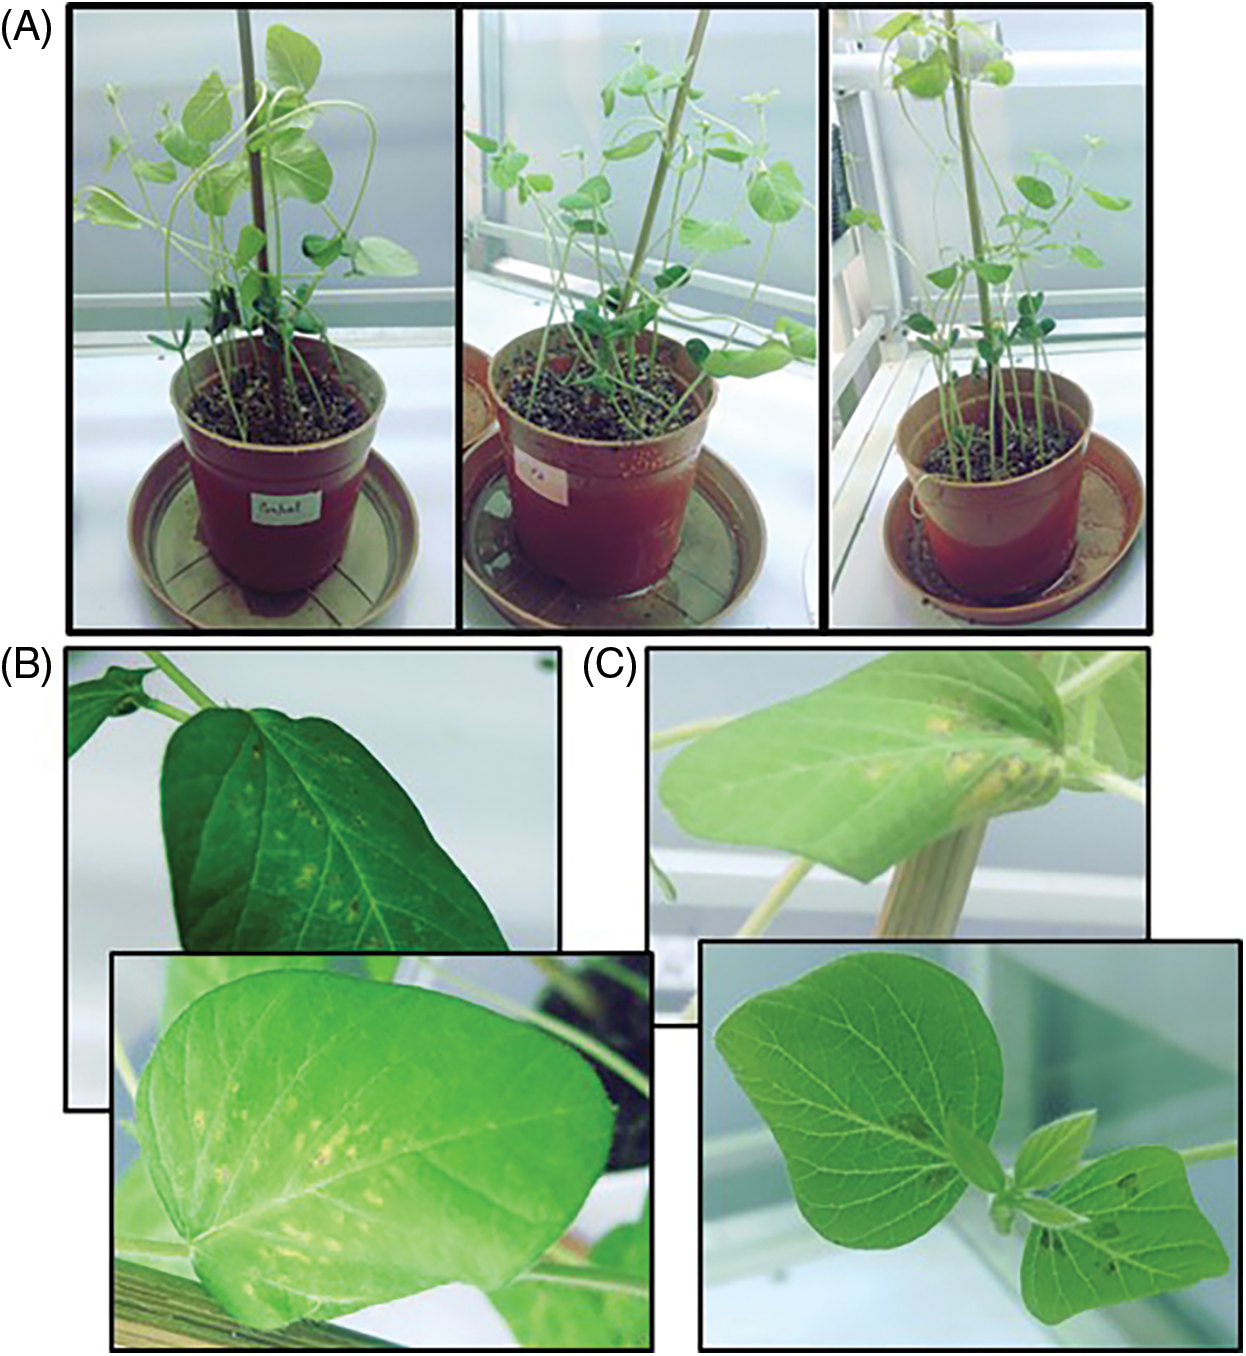
Figure 1: View of mature experimental soybean plants (A) All three sets (Control, Cd, Hg) (B) impact of Cd (100 µM) (C) impact of Hg (100 µM)
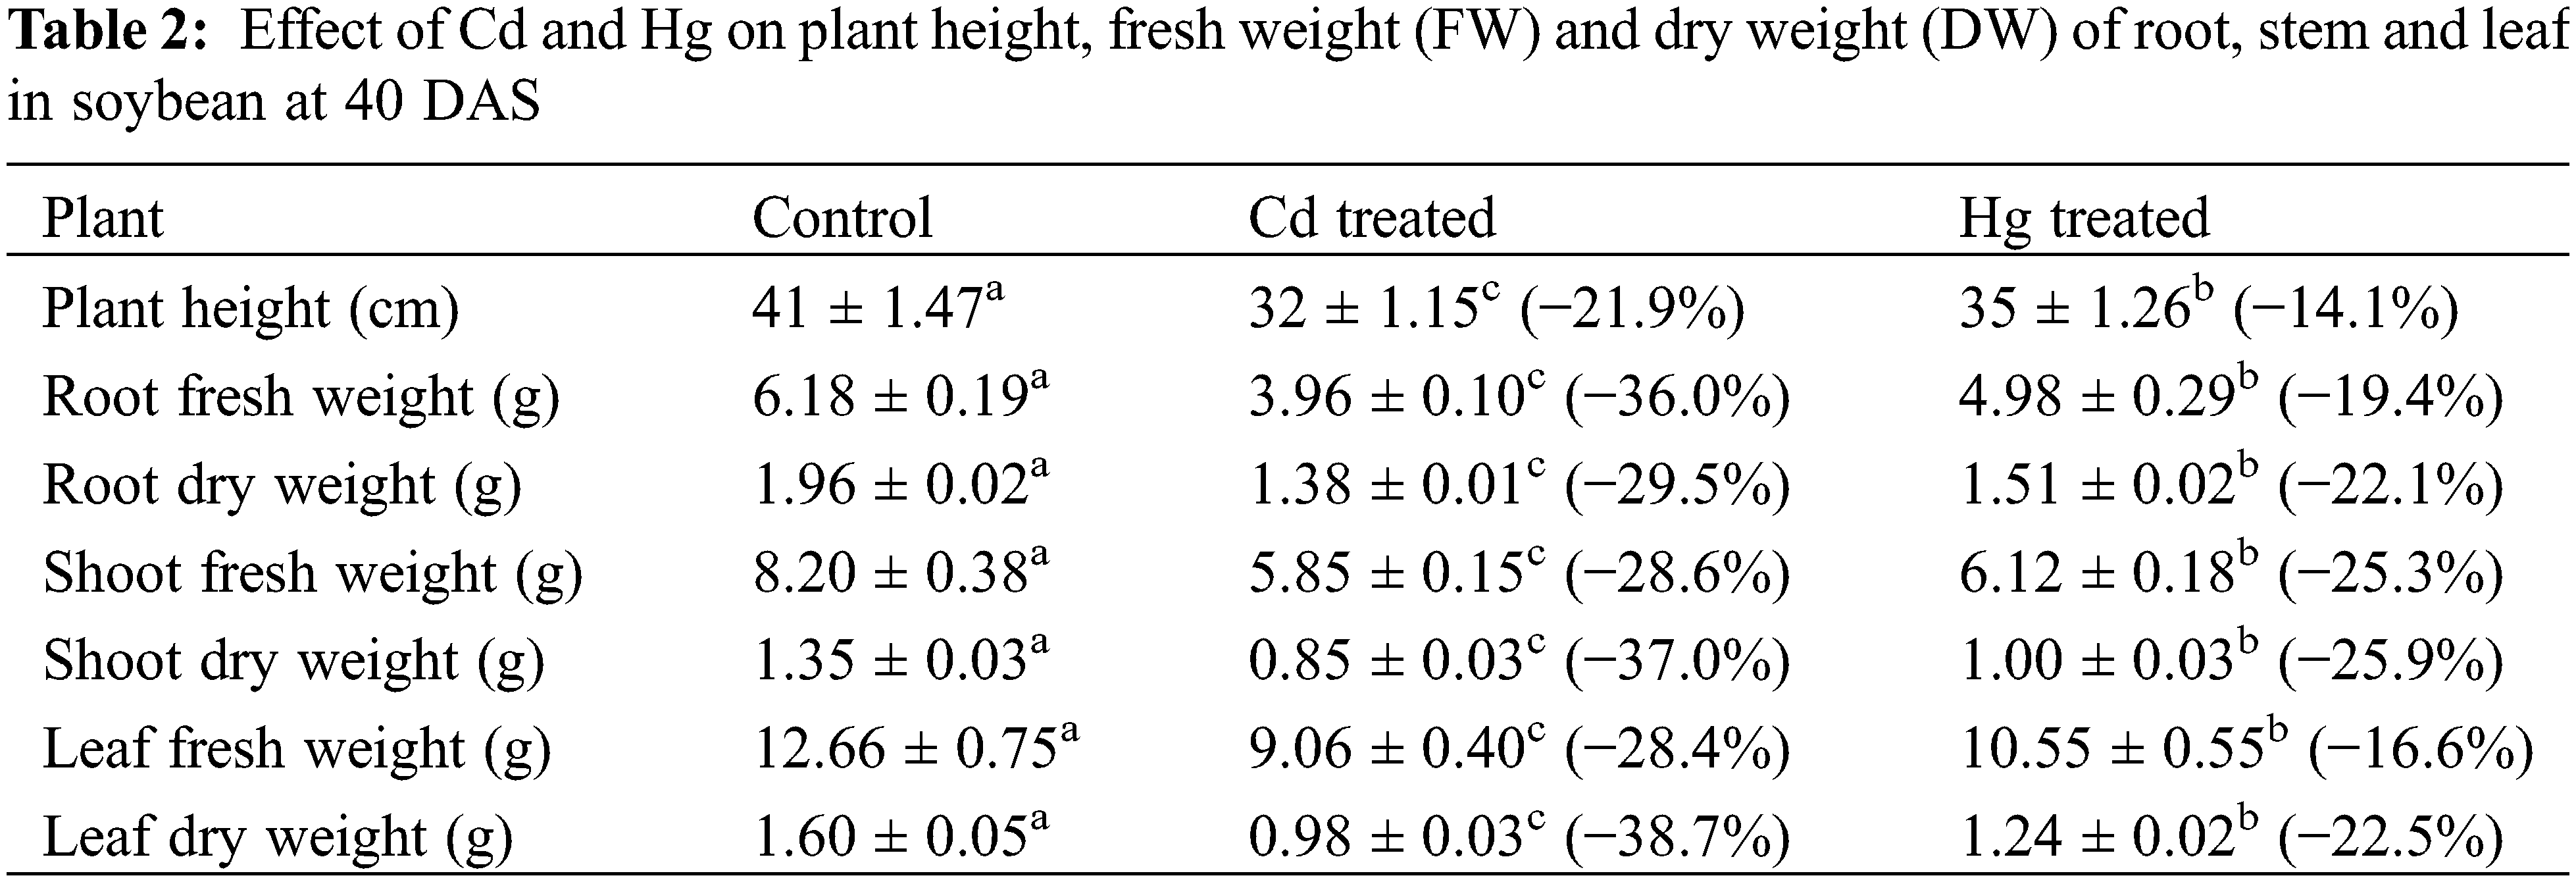
Each value indicates the mean of three replicates along with ± SE (Standard Error). Different lowercase letters show the presence of significant differences among treatments (p ≤ 0.05).
Treatment of Cd and Hg significantly decreased growth attributes as shown by earlier studies [28]. In response to Cd and Hg, a drastic reduction of growth parameters included plant height, shoot and root fresh weights (FW) and shoot and root dry weights (DW), leaf dry and fresh weight was observed in soybean plants as compared to Control. Reduction in plant growth might be due to Cd and Hg-induced changes in the plant biochemicals or physiological processes comprising cell division, cell differentiation and morphogenesis [29]. In our findings, Cd caused more damage to the plant physiologically as compared to Hg stress, with used concentrations.
3.2.1 Effect on Photosynthetic Pigments
Cd and Hg treated plants revealed a considerably diminished in photosynthetic pigments chlorophyll a (15.1% and 9.6%), respectively, chlorophyll b (28.2% and 16.3%), total chlorophyll (33.8% and 27.1%) and total carotenoids (25% and 16.6%) respectively of soybean leaves as compared with control plants shown in Fig. 2.
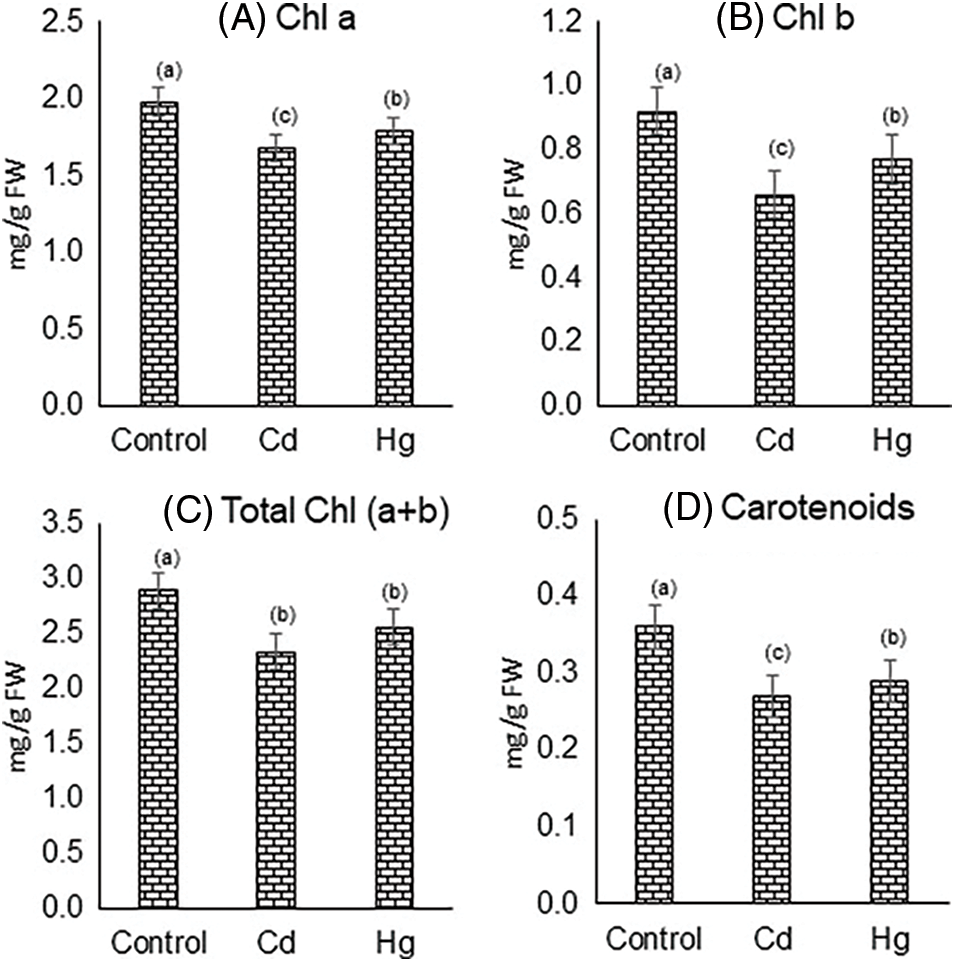
Figure 2: Impact of Cd and Hg on contents of photosynthetic pigments: (A) chlorophyll a, (B) chlorophyll b, (C) total chlorophyll (a + b), and (D) carotenoids. Each value indicates the mean of three replicates along with ± SE (Standard Error). Different letters show the presence of significant differences among treatments (p ≤ 0.05)
Chl a, and chl b are the main photosynthetic pigments that are associated with photosynthetic competence [30]. Contents of chl a, chl b, total chlorophyll, and total carotenoids declined due to Cd and Hg treatments. This decrease could be due to the inhibited synthesis or degradation by oxidative stress [31]. Carotenoids are essential substances that acted as photoreceptor pigments and as a regulator for abolishing singlet oxygen. Several studies have suggested a reduction in these photosynthetic pigments could be owing to the substitution of metal ions from molecules (such as Mg from chlorophyll), denaturing or inactivation of proteins, and disruption of cell membranes or organelles [31–33].
3.2.2 Cd and Hg Induced Changes in Antioxidant Enzymes
The activities of antioxidant enzymes such as superoxide dismutase (SOD), ascorbate peroxidase (APX), glutathione reductase, and catalase (CAT) were altered in response to both Cd and Hg stress. It is noteworthy that Cd and Hg-treated plants showed an increase in SOD, APX, GR, and CAT activities. SOD in the control plant was found to be 32 EU, 48.33 EU (+51%) in Cd and 42.39 EU (+24.5%) in the case of Hg (Fig. 3A). APX was found to be around 1.48 EU in control, 1.95 EU (+31.75%) in Cd and 1.82 EU (+23%) in case of Hg (Fig. 3B). GR was found to be around 0.626 EU in control, 1.12 EU in Cd (+78.9%) and 0.968 EU (+54.6%) in Hg (Fig. 3C). CAT activity was 1.36 EU in control, 1.96 EU (+44%) in Cd, and 1.83 EU (+34%) in Hg treatment (Fig. 3D).
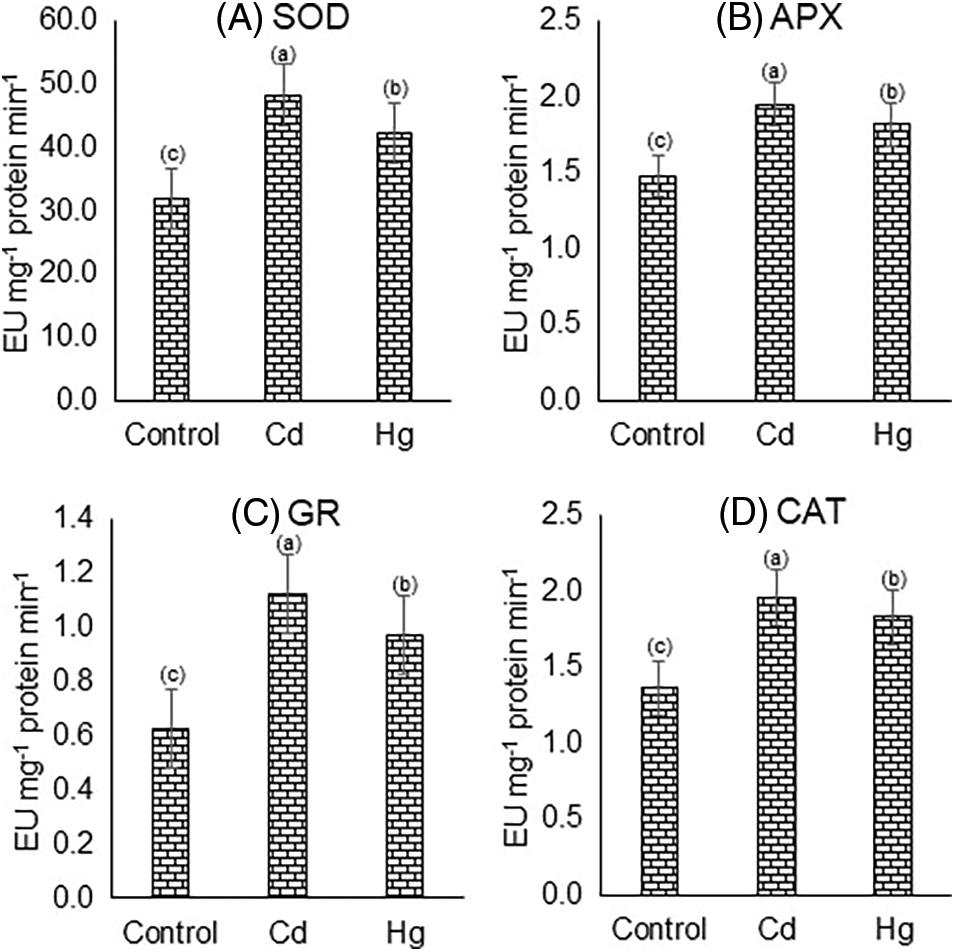
Figure 3: Impact of Cd and Hg on activities of enzymatic antioxidants: (A) Superoxide dismutase (SOD), (B) Ascorbate peroxidase (APX), (C) Glutathione reductase (GR), and (D) Catalase (CAT) activity. Each value indicates the mean of three replicates along with ± SE (Standard Error). Different letters show the presence of significant differences among treatments (p ≤ 0.05)
Plants retain a considerable volume of antioxidative enzymes for preventing oxidative damage. It is revealed that Cd and Hg both heavy metals treatments increased oxidative stress levels in plants due to which enzymatic antioxidative activities were enhanced greatly. This study correlated with previous studies in which antioxidative enzyme activities increased under heavy metal stress conditions [34–36]. Cd induces significant changes while Hg did not make much difference as compared to the untreated plant this may be due to the differential nature of both metals in terms of physiochemical properties. Increase in CAT, GR, APX and SOD activities were found in response to Cd and Hg stress. In plants’ natural defence system, Superoxide dismutase protects plants against ROS which was produced in stress conditions [6,33]. Conversion of toxic superoxide radical (O2−) to less toxic H2O2 and O2 was catalyzed by superoxide dismutase after induction of Cd and Hg stress. SOD perhaps removed more and more O2− and reduced the chances of OH− formation from superoxide radicals [34]. Higher SOD activity might be due to more increase in the content of O2− ions or higher formation of H2O2. CAT transforms H2O2 to H2O and O2 for preventing oxidative damage [33]. APX is a vital H2O2 scavenger that works in the Ascorbate Glutathione cycle as an electron donor. APX and GR activities significantly increased in the presence of Cd and Hg-treatment which was also proved by earlier studies [37,38]. Cd gave rise to oxidative damage to trigger anti-oxidative enzyme activities in plants. GR works with MDHAR and DHAR to sustain cellular redox balance [39]. Concerning this, few reports previously showed increased antioxidant resistance capacity in plants by the stimulation of some antioxidant enzyme activities such as GR in maize and other plants also [38,39].
3.2.3 Impact on Oxidative Stress (TBARS, Proline, Hydrogen Peroxide)
Heavy metal Cd and Hg increased the oxidative stress level. Control, Cd and Hg treated plants accumulated 17.38, 34.68 (78.9%), and 25.49 (46.6%) nmol TBARS g−1 FW, respectively in Fig. 4A.
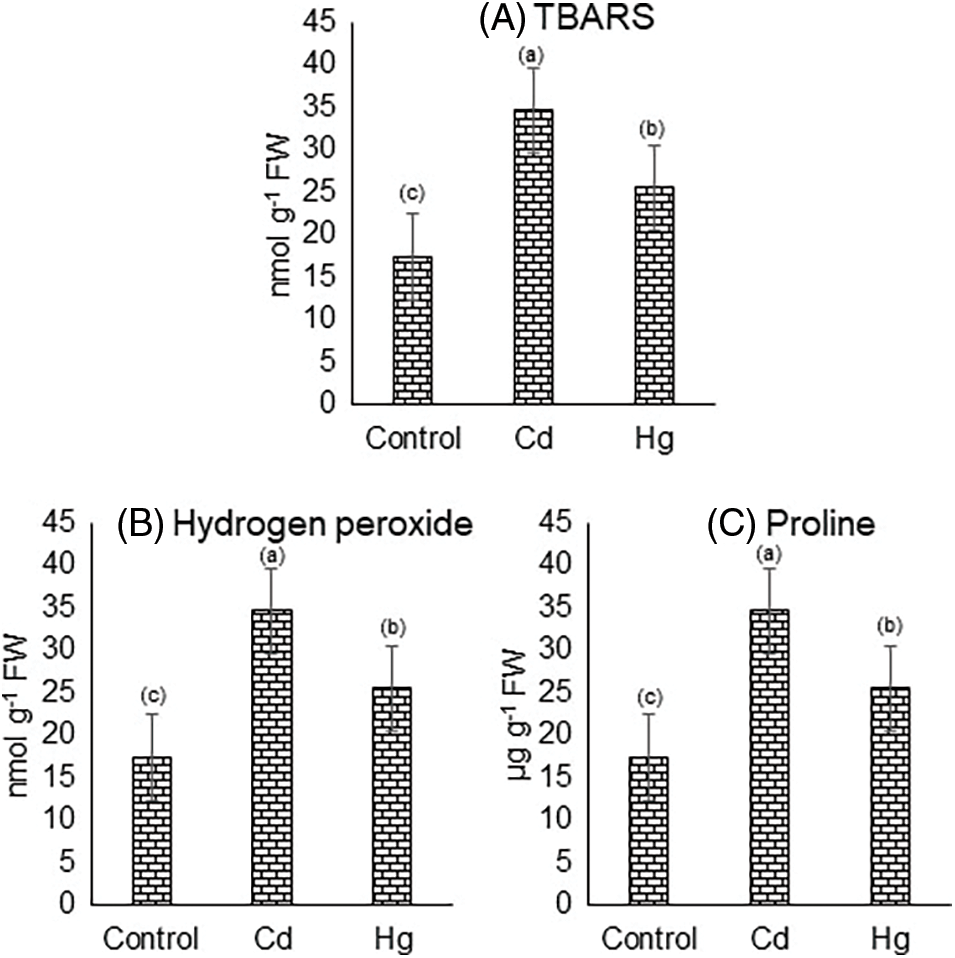
Figure 4: Impact of Cd and Hg on contents of (A) TBARS, (B) Hydrogen peroxide (H2O2), and (C) Proline. Each value indicates the mean of three replicates along with ± SE (Standard Error). Different lowercase letters show the presence of significant differences among treatments (p ≤ 0.05)
In response to Cd and Hg stress the hydrogen peroxide (H2O2) content in soybean leaves was considerably increased. The H2O2 level in Control was found to be 34.16 (µmol/g DW) which is increased by 59.80 (75%) and 49.79 (45.7%) in the case of Cd and Hg treated plants respectively in comparison to that of control in (Fig. 4B).
The effect of Cd and Hg stress increased leaf proline content in soybean. Proline content in Control was found to be around 68.05 (µg/g FW) while in the case of Cd and Hg it increased to 102.08 µg/g FW (50%), and 96.70 µg/g FW (42.1%), respectively (Fig. 4C).
In histochemical detection of hydrogen peroxide, both Cd and Hg increased H2O2 accumulation which was seen in (Fig. 5).
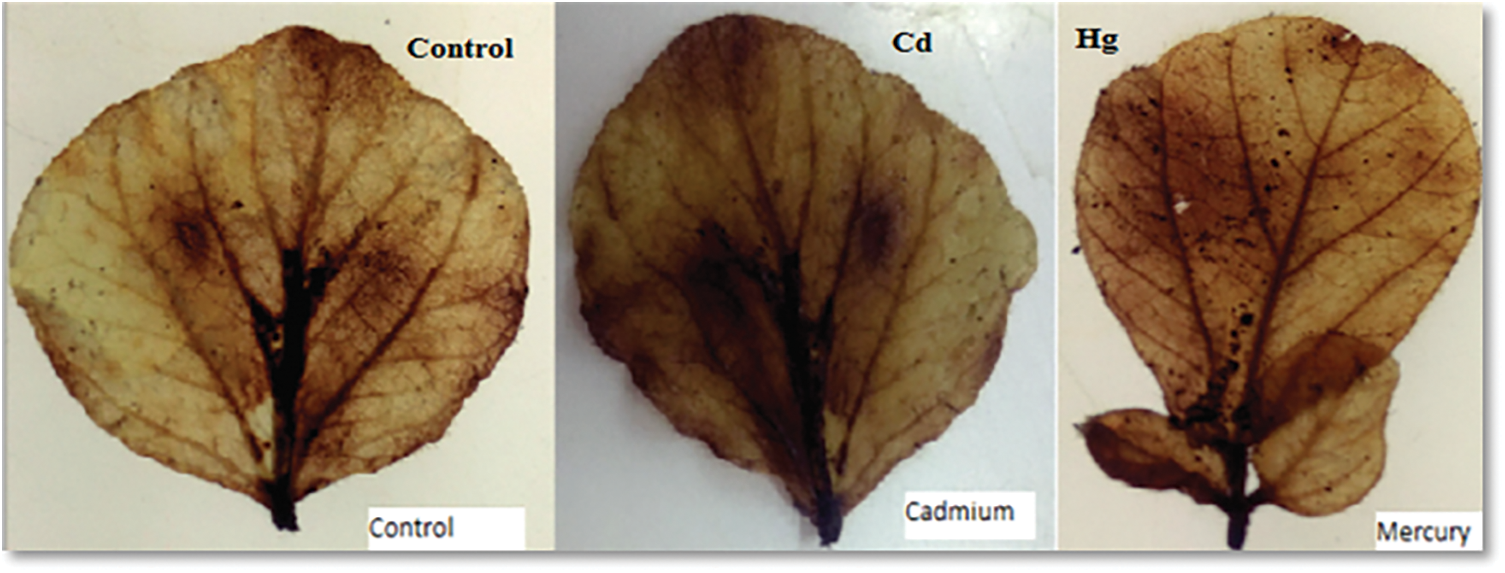
Figure 5: Soybean leaves showing H2O2 accumulation under Control, Cd and Hg treatment
TBARS and H2O2 contents were estimated in leaves which are considered an important indicator of oxidative stress [6,33,37]. Our results revealed that TBARS and H2O2 contents were increased after treatment of Cd and Hg in the soybean plant. Cd generated more oxidative stress as compared to Hg. It has been proposed that H2O2 contents escalated in several plants because of metal-induced stress [35]. Under Cd stress conditions, ROS levels and TBARS content increased. Increased ROS damages lipids membranes; besides, causing oxidative damage to other biomolecules in soybean plants [36]. A more abundant amount of proline was formed in stressed conditions. Proline rise in plants is a stress tolerance indicator and serve as osmoprotectant. Presumably, the metal-stressed plants activated the enzymes of proline biosynthesis, consequently producing more proline in leaves [37]. Cd shows more increase as compared to Hg.
3.3 Analysis of Multivariate Data
The connection of metabolites of oxidative stress, antioxidants, pigments, ascorbate peroxidase, glutathione reductase, and proline under Cd and Hg stress was analyzed by multivariate data using MetaboAnalyst software (Figs. 6A–6D). A heatmap of hierarchical clustering was generated for studying the correlation between these metabolites under Cd and Hg treatments concerning control. Hierarchical clustering showed variation between differentially expressed metabolites in the case of control and heavy metal treated plants (Fig. 6A). Principal component analysis loadings and score plots give information on our data and compare the differentially expressed metabolites in a soybean plant (Fig. 6C). Identification of maximum changes in the abundance of metabolites was described by the VIP plot which was formed from the loadings of PLS-DA (Fig. 6B). In the VIP plot 11 components came with VIP scores (0.10–2.0) including components such as proline (pro), H2O2, CAT, TBARS, total chlorophyll (tchl), APX, total carotenoids (tcaro), SOD, chlorophyll a (chl a), GR and chlorophyll b (chl b) in soybean. Graphs showed H2O2 content, proline content and level of antioxidants increased (Fig. 6B) (highlighted in red), but chlorophyll and carotenoids content decreased in (Fig. 6B) (seen in blue) in both Cd and Hg stress which suggested that antioxidants, proline, and H2O2 helps in plant defence against heavy metal stress.
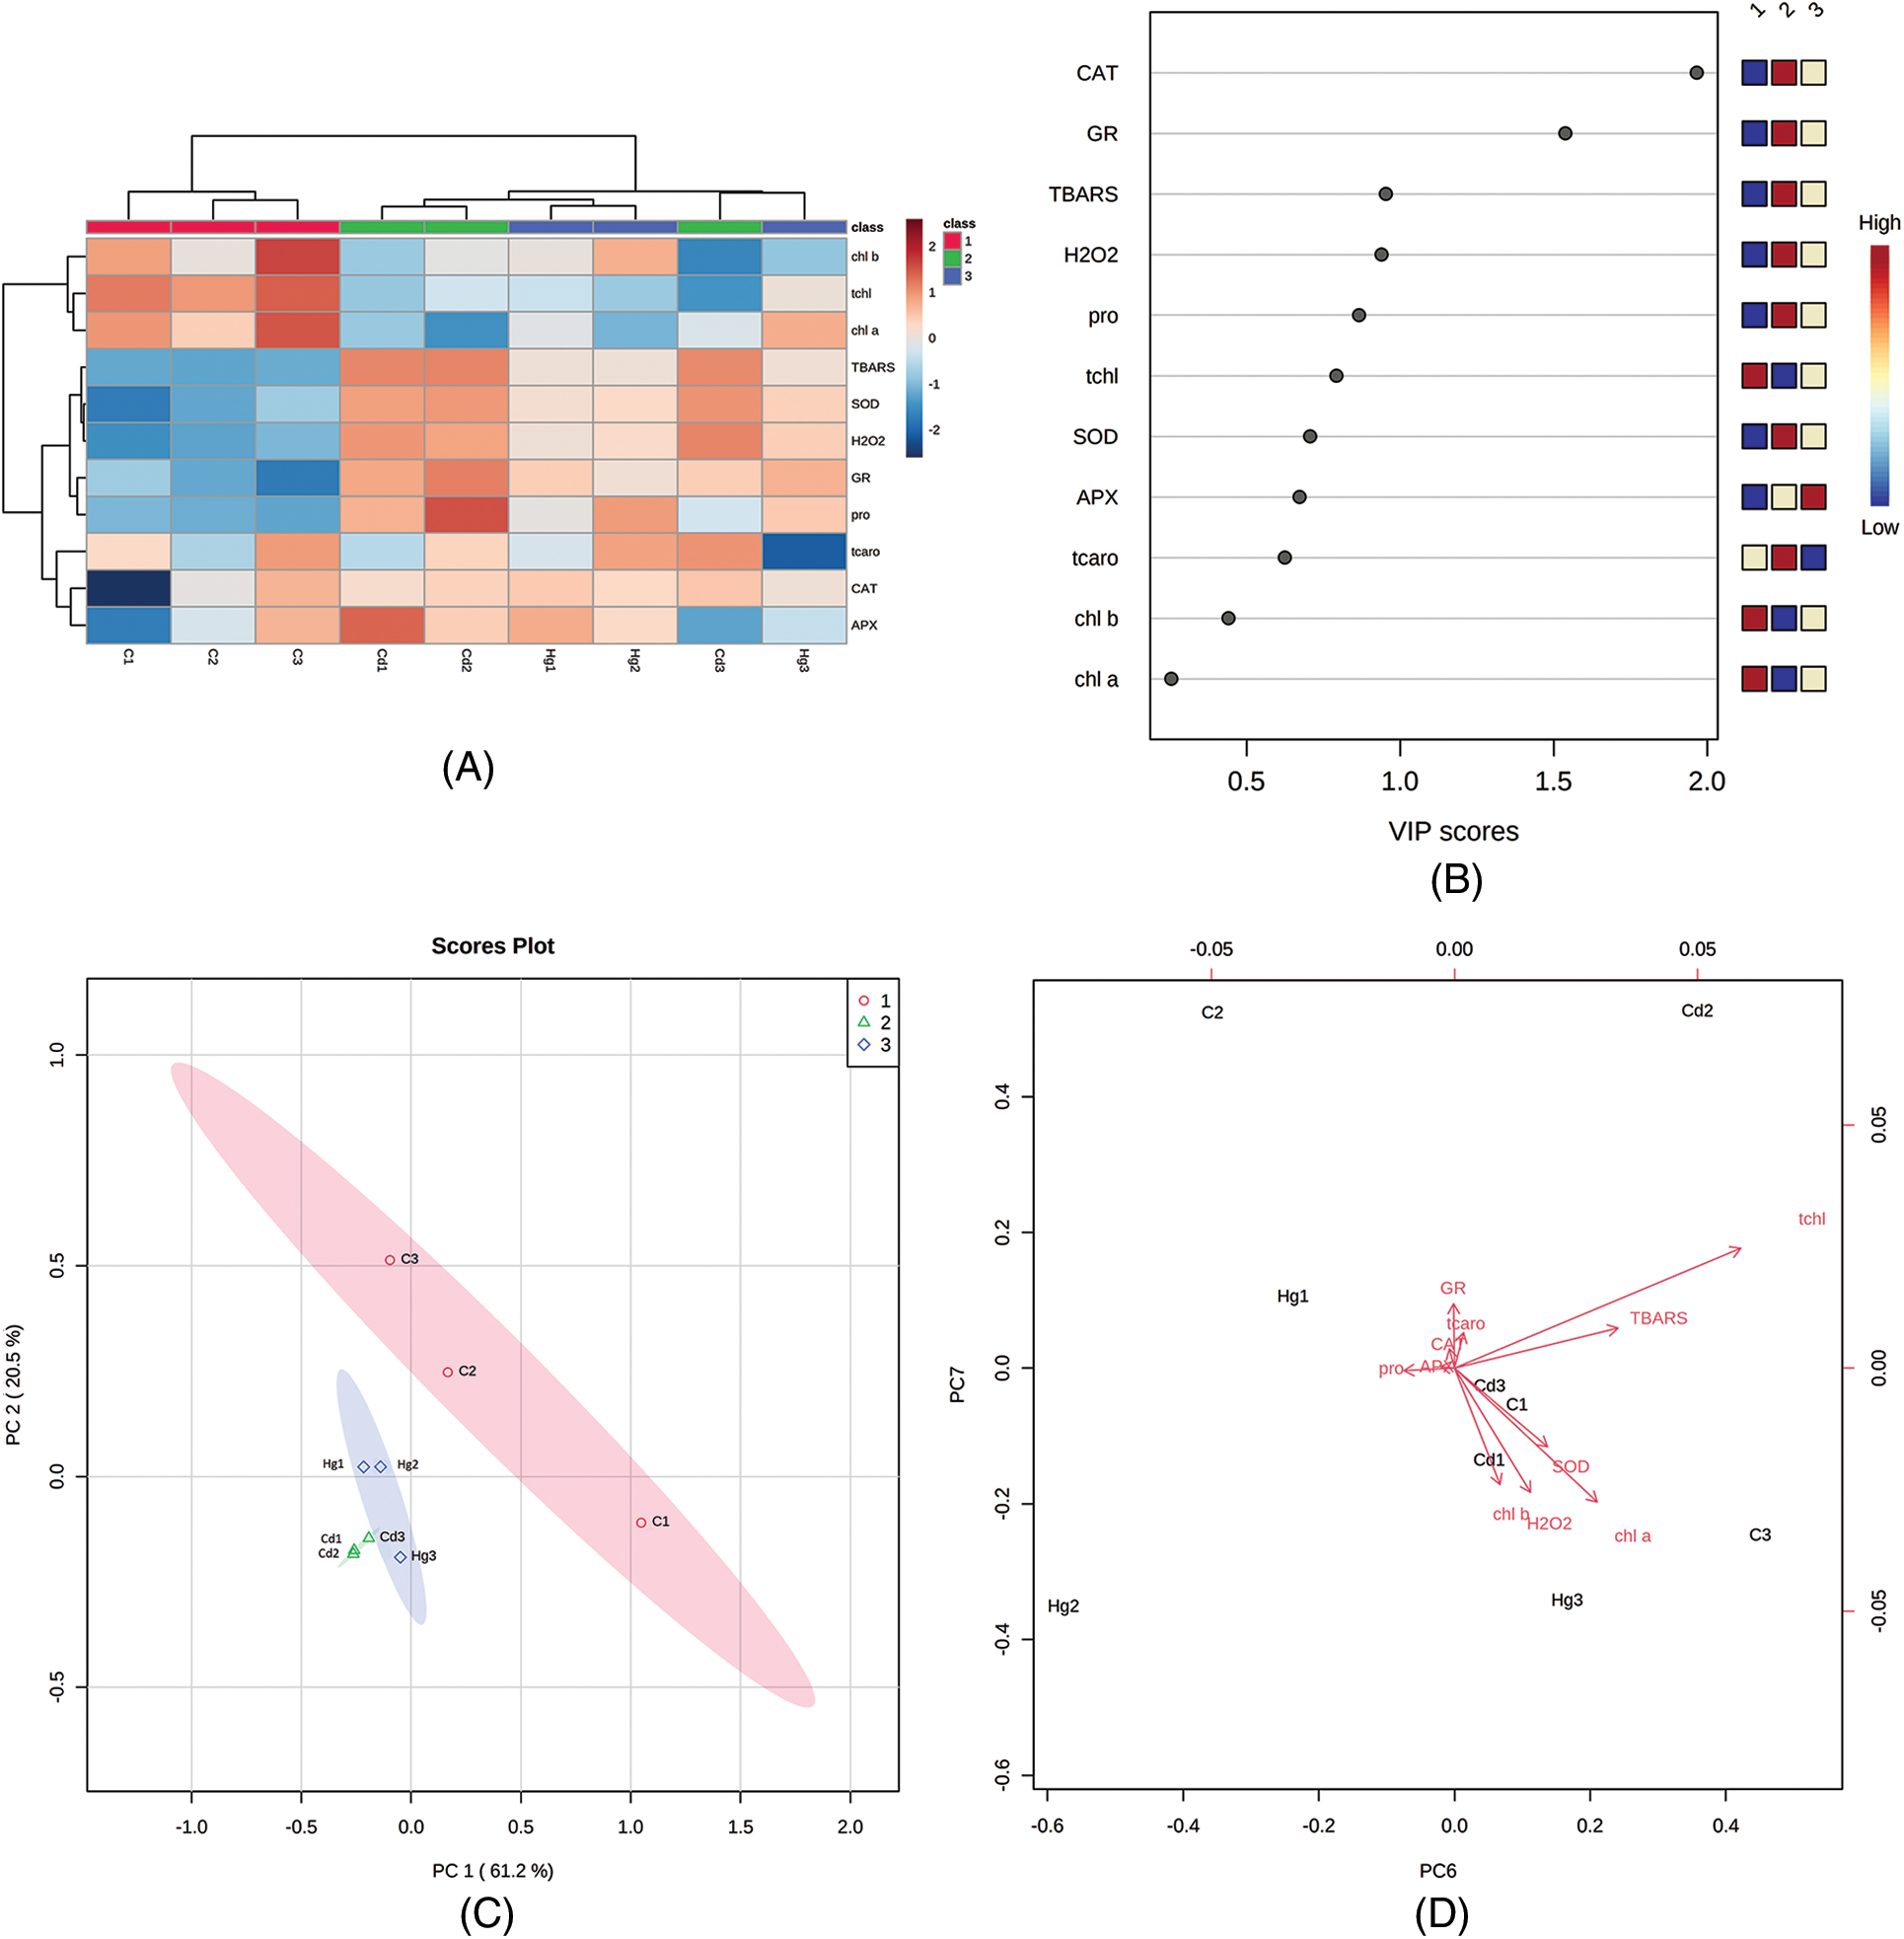
Figure 6: Multivariate data analysis obtained through MetaboAnalyst software (A) Hierarchical clustering (B) VIP plot (C) Scatter plot (D) Loadings plot showing differentially expressed metabolites (Biplot). These plots of PCA analysis indicate a correlation between different metabolic, antioxidant and oxidative stress parameters
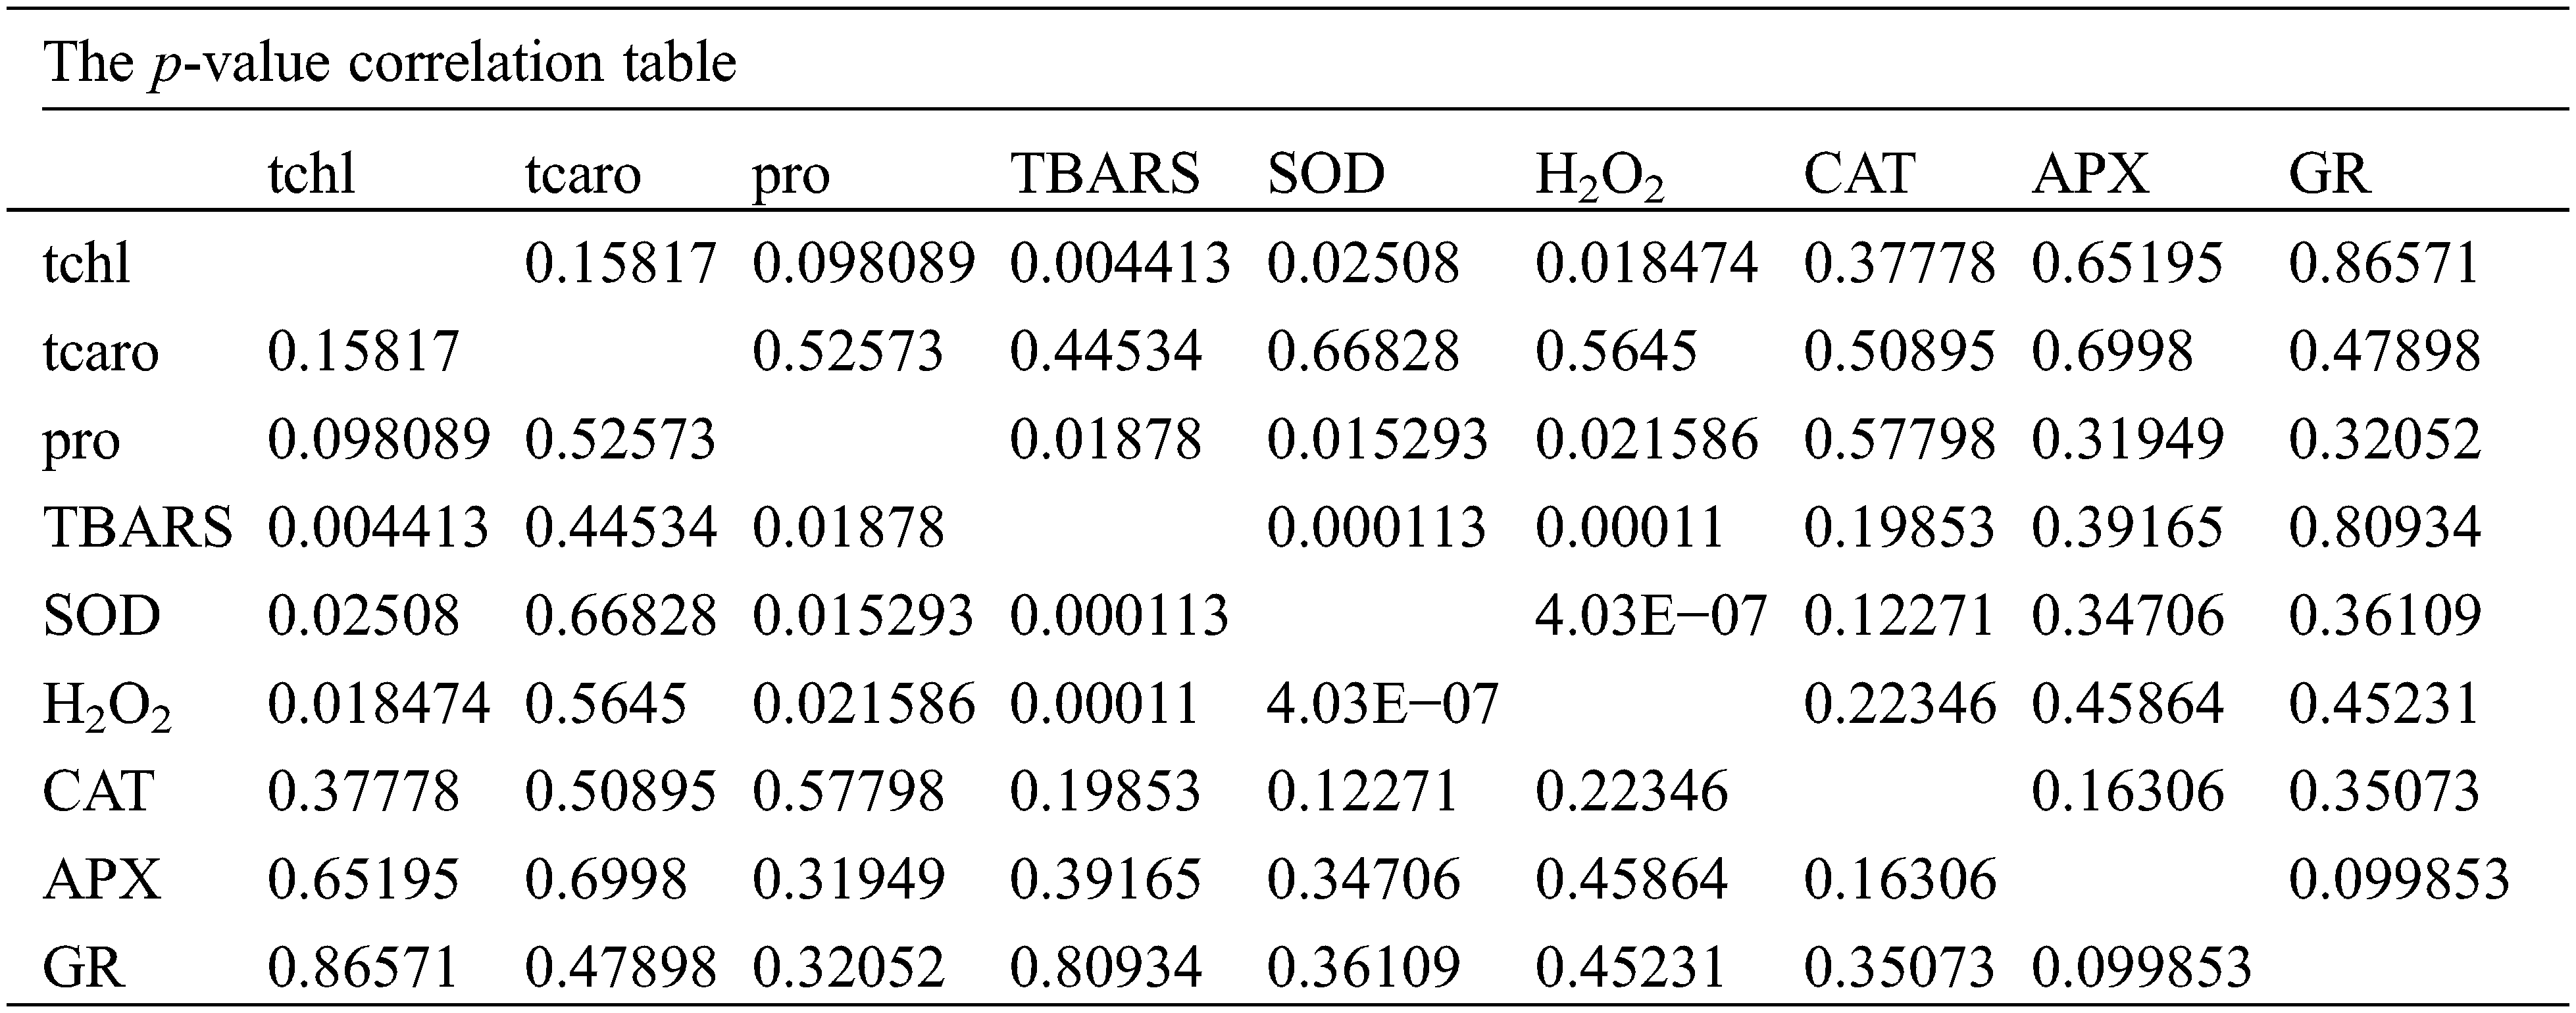
The first axis of the loadings score plot has 61.2% of the variance for the total values under Cd and Hg stress in leaves of soybean. TBARS, H2O2, and proline contributed to the first axis but on the second axis PCA2 contributed by antioxidants, chlorophyll and carotenoids showed less importance (20.5% of variance). The direction and length of the vectors point toward the potency and show a correlation among them. Large extended vectors of these studied parameters indicated that the vector significantly affects the outcome of our results. From these results, it was clear that the chl a, chl b and total carotenoids grouped and shows a positive correlation as found on positive loading of the right side of the biplot. Proline, CAT and H2O2 show a positive correlation in the biplot (Fig. 6D). The angles found among these different antioxidant parameters are small, demonstrating that they are in positive correlation [29]. However total chlorophyll and carotenoids are segregated in opposite directions with antioxidants, indicating that these factors are negatively correlated (Fig. 6D).
3.4 Molecular Aspects in Response to Cd and Hg Stress
3.4.1 Impact on Isolated RNA and Its Quantification
Total isolated RNA was found to be around 273 µg/g FW in the case of the control leaf. In response to Cd and Hg stress, the concentration of RNA was decreased. Anything higher than 1.8 is considered to be of acceptable purity. A low A260/A280 ratio in the case of Cd and Hg-treated leaf was likely due to the low yield of RNA (Table 3).
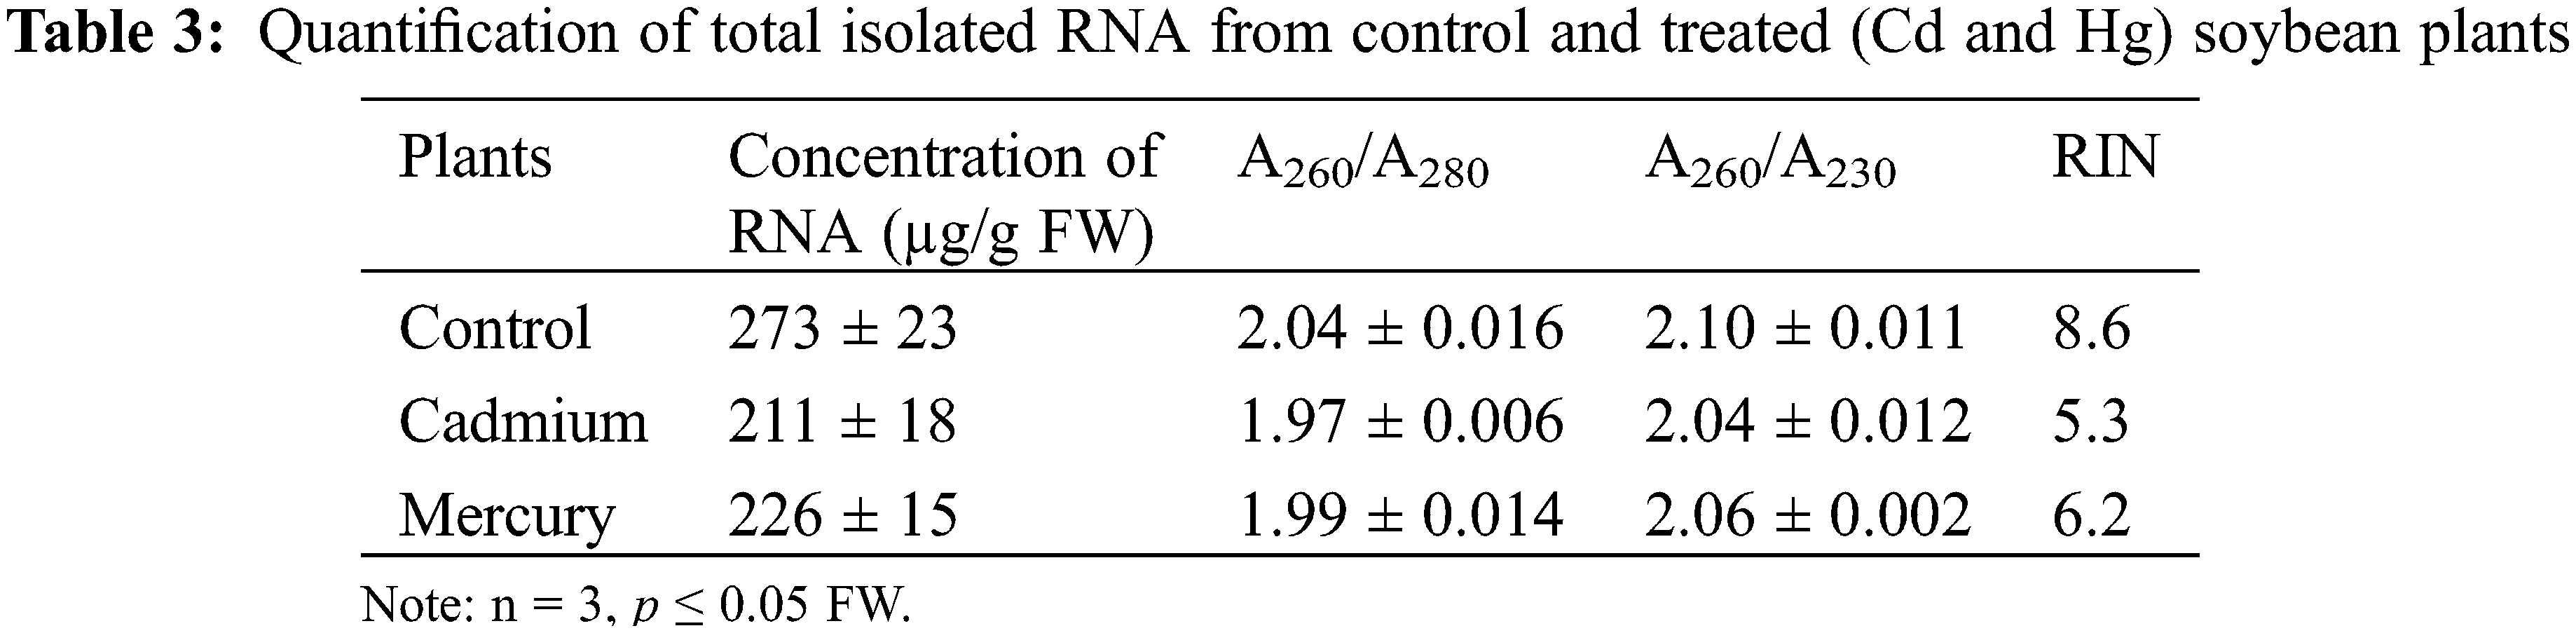
Cd seemed to have a major negative effect on the plant at the molecular level but Hg in comparison to Cd seems to have less destructive (Fig. 7) in the used concentration. The effect of Cd and Hg on isolated RNA was revealed. When compared with Control plant RNA, Cd and Hg-affected plants showed low RNA quality, and quantity as well as changed RNA integrity, as seen in the results section and also observed in earlier studies [40,41]. We considered that these responses were aroused through free radical-mediated oxidation, as hypothesized for other cellular constituents [42–45]. Cd causes oxidative stress and leads to the formation of ROS. In the presence of Cd, a major surge in oxidative stress might have led to the degradation of RNA. It has been shown that the 2′OH group, present in RNA, hydrolyzes readily which makes RNA an easily labile molecule [13,41]. Another reason that RNA was prone to degradation by reactive oxygen species (ROS) is that RNA is single-stranded, making it more vulnerable to degradation [44–47].
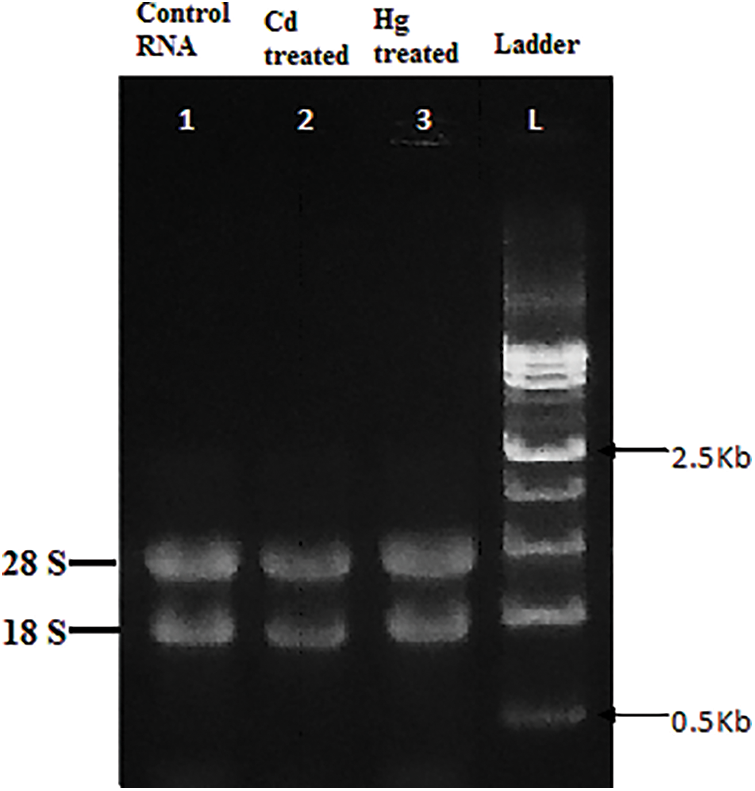
Figure 7: Total RNA isolated from soybean leaves under Control, Cd and Hg stress loaded in 1% Agarose gel with ladder
Destabilization of RNA could also be attributed to the interaction and intercalation of defence-related secondary metabolites with RNA which reduced its yield and quality [47]. RNA was quantitatively and qualitatively examined through spectrophotometry and optimum values of control samples suggested that non-stressed plants’ RNA remained stable but compromised in Cd- and Hg-treated plants [13,42,46].
In comparison to Cd, plants treated with Hg had better RNA in terms of quantity and quality. The mechanism which might have led to nucleic acid degradation is increased level of oxyradicals and degradation through a decay pathway called No-Go [43].
3.4.2 Effect on RNA Integrity Number (RIN)
RNA of control plants exhibited the highest RNA integrity value which implied no degradation at all but in the case of Cd, RNA integrity was lesser indicating towards degradation of RNA molecules (Fig. 7) and (Table 3). RNA integrity values (RIN) also may also be decreased due to the degradation of labile RNA molecules [40]. As RNA integrity check is the critical step toward gene expression, the degraded RNA has a direct impact on the transcript levels [44,47].
3.5 Gene Expression Analysis through qRT-PCR
In RT-PCR, cDNA was synthesized using actin gene-specific primers and PCR amplification was done which produced a 142 bp amplified product.
In qRT-PCR, Mean Ct values were calculated from triplicates data of Control, Cd and Hg-treated soybean. The mean Ct of actin gene of the control plant was found to be 23.5150 while in the case of Cd stress it was 19.0940. The mean Ct of the actin gene in response to Hg stress was found to be 21.5760. All Ct values obtained for each sample individually were represented on a box plot diagram (Fig. 8) in which the median Ct value was represented by middle lines.
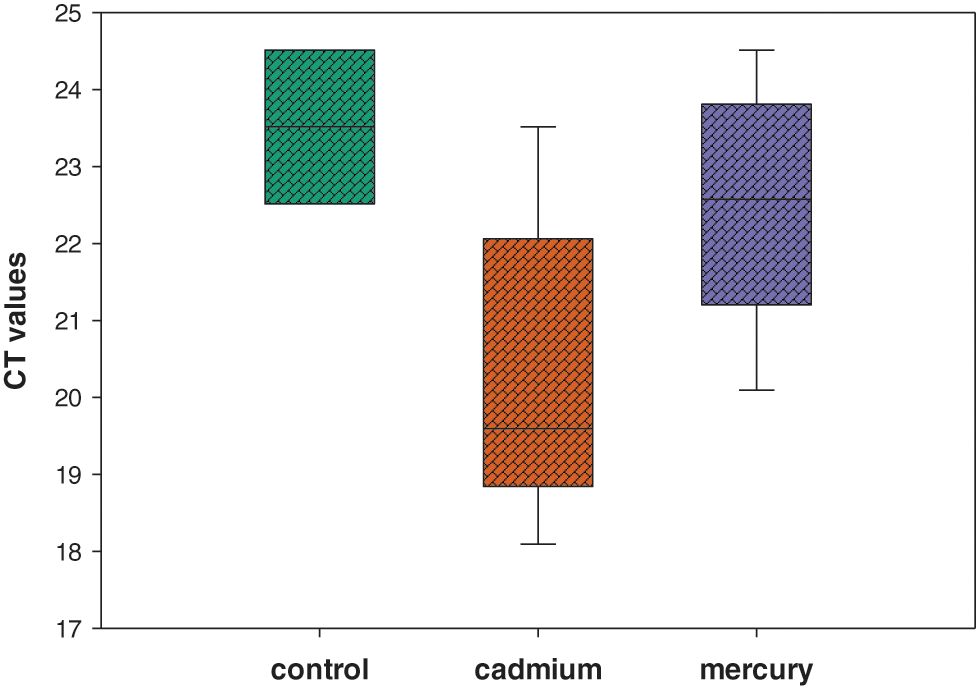
Figure 8: Box plot analysis of Ct values of actin gene obtained from distinct sample sets of Control, Cd and Hg treatment
Mean Ct was used to obtain the expression of actin gene in control and treated plants. Quantitative real-time expression analysis was performed using qRT-PCR. Data showed variations in Ct values of the actin gene in response to Cd and Hg stress [48] as compared to the control. In terms of gene expression, Ct values were negatively related to gene expression level, so the lower the Ct the higher the gene expressed [49,50]. Actin gene showed significant upregulation in response to Cd stress which might be due to the presence of metal-responsive signals produced inside the cell which ultimately leads to transcriptional factors activation and initiation of transcription to undo the damage caused by heavy metals [51,52]. Cd and Hg might have affected actin filaments through ROS which has activated repair mechanisms that increased actin gene expression directly. Stability and expression of actin gene which was determined by mean Ct values revealed upregulation in expression level (lowest Ct value) in response to Cd stress as compared to Control which had the highest Ct value and showed stable expression [53–57].
Ideally, the expression of this internal control gene was not changed. However abiotic stress factors can alter gene expression in plants [56,58–60]. Our study was also validated by previous studies which suggested that internal standards, mostly housekeeping genes used in the quantification of RNA expression in qRT-PCR could vary with many biotic and abiotic stress factors [58–60].
Our study contributed to comparative physiological, biochemical and some molecular aspects of Cd and Hg stress in the soybean plant at the vegetative stage (pre-flowering). Plants reacted differentially when exposed to Cd and Hg and generated high levels of oxidative stress. Our findings concluded that the soybean plant showed more response in case of Cd stress compared to Hg and proved to be more disastrous. Soybean plants responded to heavy metal stress by accumulating more proline and increased enzymatic and non-enzymatic cellular antioxidant activities for their defence. It can be concluded that both Cd and Hg caused oxidative damage to plants which adversely affected the quality of RNA. The actin gene showed a differential gene expression pattern in response to Cd and Hg, especially Cd upregulated the actin gene expression. qRT-PCR results contributed to the choice of selection of a more stable and better housekeeping gene to be used as a reference gene in qRT-PCR in plants exposed to heavy metal stress.
Acknowledgement: The authors would like to extend their sincere appreciation to the researchers supporting Project Number RSP2023R186, King Saud University, Riyadh, Saudi Arabia.
Funding Statement: The study has been supported by Project Number RSP2023R186, King Saud University, Riyadh, Saudi Arabia.
Author Contributions: Conceptualization, S. N. and M. I. Q. Methodology, S. N. and N. A. Software, S. N., and M. I. Validation, S. N., A. A. A. H. and M. I. Data curation, S. N., A. A. A. H and M. I. Q. Writing—original draft preparation, S. N., and F. K. Writing—review and editing, S. N., A. A. A. H., and M. I. Q. Supervision, N. A. and M. I. Q. All authors have read and agreed to the published version of the manuscript.
Conflicts of Interest: The authors declare that they have no conflicts of interest to report regarding the present study.
References
1. Rajni, M., Tanwar, B., Goyal, A., Kumar, V. (2020). Soybean (Glycine max). In: Health attributes and food applications, pp. 1–46. Singapore: Springer. https://doi.org/10.1007/978-981-15-4194-0_1 [Google Scholar] [CrossRef]
2. Saha, A., Suprodip, M. (2019). Nutritional benefit of soybean and its advancement in research. Sustainable Food Production, 5, 6–16. https://doi.org/10.18052/www.scipress.com/SFP.5.6 [Google Scholar] [CrossRef]
3. Shurtleff, W., Aoyagi, A. (2015). History of soybeans and soyfoods in Sweden, Norway, Denmark and Finland. In: Extensively annotated bibliography and sourcebook. Lafayette, CA: Soyinfo Center. [Google Scholar]
4. Oh, Y. S., Jun, H. S. (2014). Role of bioactive food components in diabetes prevention: Effects on beta-cell function and preservation. Nutrition and Metabolic Insights, 7(6), 51–59. https://doi.org/10.4137/NMI.S13589 [Google Scholar] [PubMed] [CrossRef]
5. McBride, M. B., Richards, B. K., Steenhuis, T., Spiers, G. (2000). Molybdenum uptake by forage crops grown on sewage sludge-amended soils in the field and greenhouse. Journal of Environmental Quality, 29(3), 848–854. https://doi.org/10.2134/jeq2000.00472425002900030021x [Google Scholar] [CrossRef]
6. Baig, M. A., Ahmad, J., Bagheri, R., Ali, A. A., Al-Huqail, A. A. et al. (2018). Proteomic and ecophysiological responses of soybean (Glycine max L.) root nodules to Pb and hg stress. BMC Plant Biology, 18(18), 283. https://doi.org/10.1186/s12870-018-1499-7 [Google Scholar] [PubMed] [CrossRef]
7. Hasan, M. K., Cheng, Y., Kanwar, M. K., Chu, X. Y., Ahammed, G. J. et al. (2017). Responses of plant proteins to heavy metal stress–A review. Frontiers in Plant Sciences, 1492(8), 1–16. https://doi.org/10.3389/fpls.2017.01492 [Google Scholar] [PubMed] [CrossRef]
8. Wallace, D. R., Taalab, Y. M., Heinze, S., Lovaković, B. T., Pizent, A. (2020). Toxic-metal-induced alteration in miRNA expression profile as a proposed mechanism for disease development. Cells, 9(4), 901. https://doi.org/10.3390/cells9040901 [Google Scholar] [PubMed] [CrossRef]
9. Godt, J., Scheidig, F., Christian, S. G., Esche, V., Brandenburg, P. et al. (2006). The toxicity of cadmium and resulting hazards for human health. Journal of Occupational Medicine and Toxicology, 1(1), 22. https://doi.org/10.1186/1745-6673-1-22 [Google Scholar] [PubMed] [CrossRef]
10. Manara, A. (2012). Plant responses to heavy metal toxicity. In: Furini, A. (Ed.Plants and heavy metals, pp. 27–53. Dordrecht: Springer. https://doi.org/10.1007/978-94-007-4441-7_2 [Google Scholar] [CrossRef]
11. Dalcorso, G., Fariniti, S., Furini, A. (2010). Regulatory networks of cadmium stress in plants. Plant Signalling and Behavior, 5(6), 663–667. https://doi.org/10.4161/psb.5.6.11425 [Google Scholar] [PubMed] [CrossRef]
12. Sharma, P., Jha, A. B., Dubey, R. S., Pessarakli, M. (2012). Reactive oxygen species, oxidative damage, and antioxidative defense mechanism in plants under stressful conditions. Journal of Botany, 26(1), 1–26. https://doi.org/10.1155/2012/217037 [Google Scholar] [CrossRef]
13. Clemens, S., Ma, J. F. (2016). Toxic heavy metal and metalloid accumulation in crop plants and foods. Annual Review Plant Biology, 67(29), 489–512. https://doi.org/10.1146/annurev-arplant-043015-112301 [Google Scholar] [PubMed] [CrossRef]
14. Li, R., Wu, H., Ding, J. (2017). Mercury pollution in vegetables, grains and soils from areas surrounding coal-fired power plants. Scientific Reports, 46545(7), 1–9. https://doi.org/10.1038/srep46545 [Google Scholar] [PubMed] [CrossRef]
15. Paez-Garcia, A., Sparks, J. A., de Bang, L., Blancaflor, E. B. (2018). Plant actin cytoskeleton: New functions from old scaffold. In: Sahi, V., Baluška, F. (Eds.Concepts in cell biology—history and evolution, vol. 23, pp. 103–137. Cham: Springer. [Google Scholar]
16. McDowell, J. M., Huang, S., McKinney, E. C., An, Y. Q., Meagher, R. B. (1996). Structure and evolution of the actin gene family in Arabidopsis thaliana. Genetics, 142(2), 587–602. https://doi.org/10.1093/genetics/142.2.587 [Google Scholar] [PubMed] [CrossRef]
17. Valente, V., Teixeira, S. A., Neder, L. (2014). Selection of suitable housekeeping genes for expression analysis in glioblastoma using quantitative RT-PCR. Annual Review of Neuroscience, 21(2), 62–63. https://doi.org/10.5214/ans.0972.7531.210207 [Google Scholar] [PubMed] [CrossRef]
18. Hruz, T., Wyss, M., Docquier, M. (2011). RefGenes: Identification of reliable and condition specific reference genes for RT-qPCR data normalization. BMC Genomics, 12(1), 156. https://doi.org/10.1186/1471-2164-12-156 [Google Scholar] [PubMed] [CrossRef]
19. Hiscox, J. D., Israelstam, G. F. (1979). A method for the extraction of chlorophyll from leaf tissue without maceration. Canadian Journal Botany, 57(12), 1332–1334. https://doi.org/10.1139/b79-163 [Google Scholar] [CrossRef]
20. Arnon, D. I. (1949). Copper enzymes in isolated chloroplasts. Polyphenol oxidase in Beta vulgaris. Plant Physiology, 24(1), 1–15. https://doi.org/10.1104/pp.24.1.1 [Google Scholar] [PubMed] [CrossRef]
21. Heath, R., Packer, L. (1968). Photo peroxidation in isolated chloroplasts: I. Kinetics and stoichiometry of fatty acid peroxidation. Archives of Biochemistry and Biophysics, 125(1), 189–198. https://doi.org/10.1016/0003-9861(68)90654-1 [Google Scholar] [PubMed] [CrossRef]
22. Yu, C. W., Murphy, T. M., Lin, C. H. (2003). Hydrogen peroxide-induced chilling tolerance in mung beans mediated through ABA-independent glutathione accumulation. Functional Plant Biology, 30(9), 955–963. https://doi.org/10.1071/FP03091 [Google Scholar] [PubMed] [CrossRef]
23. Dhindsa, R. S., Plumb-Dhindsa, P., Thorpe, T. A. (1981). Leaf senescence: Correlated with increased levels of membrane permeability and lipid peroxidation, and decreased levels of superoxide dismutase and catalase. Journal of Experimental Botany, 32(1), 93–101. https://doi.org/10.1093/jxb/32.1.93 [Google Scholar] [CrossRef]
24. Qureshi, M. I., Abdin, M. Z., Qadir, S., Iqbal, M. (2007). Lead-induced oxidative stress and metabolic alterations in Cassia angustifolia Vahl. Biologia Plantarum, 51(1), 121–128. https://doi.org/10.1007/s10535-007-0024-x [Google Scholar] [CrossRef]
25. Aebi, H. (1984). Catalase in vitro. Methods in Enzymology, 105, 121–126. https://doi.org/10.1016/S0076-6879(84)05016-3 [Google Scholar] [PubMed] [CrossRef]
26. Anderson, M. E., Powrie, F., Puri, R. N., Meister, A. (1985). Glutathione monoethyl ester: Preparation, uptake by tissues, and conversion to glutathione. Archives of Biochemitry Biophysics, 239(2), 538–548. https://doi.org/10.1016/0003-9861(85)90723-4 [Google Scholar] [PubMed] [CrossRef]
27. Bates, L. S., Waldren, R. P., Teare, I. D. (1973). Rapid determination of free proline for water-stress studies. Plant and Soil, 39(1), 205–207. https://doi.org/10.1007/BF00018060 [Google Scholar] [CrossRef]
28. Rane, J., Maheshwari, M., Nagarajan, S. (2001). Effect of preanthesis water stress on growth, photosynthesis and yield of six wheat cultivars differin in drought tolerance. Indian Journal of Plant Physiology, 6(1), 53–60. [Google Scholar]
29. El-Tayeb, M. A. (2005). Response of barley grains to the interactive effect of salinity and salicylic acid. Plant Growth Regululators, 45(6), 215–224. https://doi.org/10.1007/s10725-005-4928-1 [Google Scholar] [CrossRef]
30. Kirschbaum, M. U. F. (2011). Does enhanced photosynthesis enhance growth? Lessons learned from CO2 enrichment studies. Plant Physiology, 155(1), 117–124. https://doi.org/10.1104/pp.110.166819 [Google Scholar] [PubMed] [CrossRef]
31. Smirnoff, N. (1993). The role of active oxygen in the response of plants to water deficit and desiccation. New Phytologist, 125(1), 27–58. https://doi.org/10.1111/j.1469-8137.1993.tb03863.x [Google Scholar] [PubMed] [CrossRef]
32. Sadak, M. S., Abdelhamid, M. T., Schmidhalter, U. (2015). Effect of foliar application of aminoacids on plant yield and some physiological parameters in bean plants irrigated with sea water. Acta Biologica Colombiana, 20(1), 141–152. https://doi.org/10.15446/abc.v20n1.42865 [Google Scholar] [CrossRef]
33. Ahmad, J., Baig, M. A., Ali, A. A., Al-Huqail, A. A., Ibrahim, M. M. et al. (2018). Differential antioxidative and biochemical responses to aluminium stress in Brassica juncea cultivars. Horticulture and Environment Biotechnology, 18(5), 615–627. https://doi.org/10.1007/s13580-018-0068-1 [Google Scholar] [CrossRef]
34. Mittler, R., Vanderauwera, S., Suzuki, N., Miller, G., Tognetti, V. B. et al. (2011). ROS signaling: The new wave. Trends in Plant Sciences, 16(6), 300–309. https://doi.org/10.1016/j.tplants.2011.03.007 [Google Scholar] [PubMed] [CrossRef]
35. Sadak, M. S. (2016). Physiological role of signal molecules in improving plant tolerance under abiotic stress. International Journal of ChemTech Research, 9(7), 46–60. [Google Scholar]
36. Jain, M., Mathur, G., Koul, S., Sarin, N. B. (2011). Ameliorative effects of proline on salt stress-induced lipid peroxidation in cell lines of groundnut (Arachis hypogaea L.). Plant Cell Reports, 20(1), 463–468. https://doi.org/10.1007/s002990100353 [Google Scholar] [CrossRef]
37. Dhir, B., Sharmila, P., Saradhi, P. P. (2004). Hydrophytes lack potential to exhibit cadmium stress induced enhancement in lipid peroxidation and accumulation of proline. Aquatic Toxicology, 66(2), 141–147. https://doi.org/10.1016/j.aquatox.2003.08.005 [Google Scholar] [PubMed] [CrossRef]
38. Mobin, M., Khan, N. A. (2007). Photosynthetic activity, pigment composition and antioxidative response of two mustard (Brassica juncea) cultivars differing in photosynthetic capacity subjected to cadmium stress. Journal of Plant Physiology, 164(5), 601–610. https://doi.org/10.1016/j.jplph.2006.03.003 [Google Scholar] [PubMed] [CrossRef]
39. Chaoui, A., Mazhoudi, S., Ghorbal, M. H., El Ferjani, E. (1997). Cadmium and zinc induction of lipid peroxidation and effects on antioxidant enzyme activities in bean (Phaseolus vulgaris L.). Plant Science, 127(2), 139–147. https://doi.org/10.1016/S0168-9452(97)00115-5 [Google Scholar] [CrossRef]
40. Margaret, B. F., Christopher, M. R., Christina, W. (2017). Decline in RNA integrity of dry-stored soybean seeds correlates with loss of germination potential. Journal of Experimental Botany, 68(9), 2219–2230. https://doi.org/10.1093/jxb/erx100 [Google Scholar] [PubMed] [CrossRef]
41. Ahmed, J., Baig, M. A., Ali, A. A., Al-Huqail, A. A., Qureshi, M. I. (2017). Comparative assessment of four RNA extraction methods and modification to obtain high quality RNA from Parthenium hysterophorus leaf. 3 Biotech 7(6), 373. https://doi.org/10.1007/s13205-017-1003-3 [Google Scholar] [CrossRef]
42. Chmielowska-Bąk, J., Izbiańska, K., Grzyb, A. E., Bayar, M., Deckert, J. (2018). Cadmium stress leads to rapid increase in RNA oxidative modifications in soybean seedlings. Frontiers in Plant Sciences, 2219(8), 1–7. https://doi.org/10.3389/fpls.2017.02219 [Google Scholar] [PubMed] [CrossRef]
43. Simms, C. L., Hudson, B. H., Mosior, J. W., Rangwala, A. S., Zaher, H. S. (2014). An active role for the ribosome in determining the fate of oxidized mRNA. Cell Reports, 9(4), 1256–1264. https://doi.org/10.1016/j.celrep.2014.10.042 [Google Scholar] [PubMed] [CrossRef]
44. Schroeder, A., Mueller, O., Stocker, S. (2006). The RIN: An RNA integrity number for assigning integrity values to RNA measurements. BMC Molecular Biology, 7(3), 1471–2199. https://doi.org/10.1186/1471-2199-7-3 [Google Scholar] [PubMed] [CrossRef]
45. Brisco, M. J., Morley, A. A. (2012). Quantification of RNA integrity and its use for measurement of transcript number. Nucleic Acids Research, 40(18), e144. https://doi.org/10.1093/nar/gks588 [Google Scholar] [PubMed] [CrossRef]
46. Adams, R. L. P., Knowler, J. T., Leader, D. P. (1992). The biochemistry of the nucleic acids. London: Chapman & Hall. [Google Scholar]
47. Bazin, J., Langlade, N., Vincourt, P., Arribat, S., Balzergue, S. et al. (2011). Targeted mRNA oxidation regulates sunflower seed dormancy alleviation during dry after-ripening. Plant Cell, 23(6), 2196–2208. https://doi.org/10.1105/tpc.111.086694 [Google Scholar] [PubMed] [CrossRef]
48. de Jonge, H. J. M., Fehrmann, R. S. N., de Bont, E. S. J. M., Hofstra, R. M. W., Gerbens, F. et al. (2007). Evidence based selection of housekeeping genes. PLoS One, 9(2), e898. https://doi.org/10.1371/journal.pone.0000898 [Google Scholar] [PubMed] [CrossRef]
49. Pereira, W. J., Bassinello, Z. P., Brondani, C., Vianello, P. R. (2017). An improved method for RNA extraction from common bean seeds and validation of reference genes for qPCR. Crop Breeding and Applied Biotechnology, 17(2), 150–158. https://doi.org/10.1590/1984-70332017v17n2a22 [Google Scholar] [CrossRef]
50. Hruz, T., Wyss, M., Docquier, M. (2011). Identification of reliable and condition specific reference genes for RT-qPCR data normalization. BMC Genomics, 12(1), 156. https://doi.org/10.1186/1471-2164-12-156 [Google Scholar] [PubMed] [CrossRef]
51. Tvermoes, B. E., Bird, G. S., Freedman, J. H. (2011). Cadmium induces transcription independently of intracellular calcium mobilization. PLoS One, 6(6), 20542. https://doi.org/10.1371/journal.pone.0020542 [Google Scholar] [PubMed] [CrossRef]
52. Ma, J. (2011). Transcriptional activators and activation mechanisms. Protein and Cell, 11(2), 879–888. https://doi.org/10.1007/s13238-011-1101-7 [Google Scholar] [PubMed] [CrossRef]
53. Wendell, J. P., Priscila, Z. B., Claudio, B., Rosana, P. V. (2017). An improved method for RNA extraction from common bean seeds and validation of reference genes for qPCR. Crop Breed Applied Biotechnology, 17(2), 150–158. https://doi.org/10.1590/1984-70332017v17n2a22 [Google Scholar] [CrossRef]
54. Zhang, X., Lei, L., Lai, J., Zhao, H., Song, W. (2018). Effects of drought stress and water recovery on physiological responses and gene expression in maize seedlings. BMC Plant Biology, 18(1), 68. https://doi.org/10.1186/s12870-018-1281-x [Google Scholar] [PubMed] [CrossRef]
55. Hu, Y., Chen, H., Luo, C., Dong, L., Zhang, S. et al. (2014). Selection of reference genes for real-time quantitative PCR studies of kumquat in various tissues and under abiotic stress. Scientia Horticulturae, 174, 207–216. https://doi.org/10.1016/j.scienta.2013.12.003 [Google Scholar] [CrossRef]
56. Borges, A., Tsai, S. M., Caldas, D. G. G. (2012). Validation of reference genes for RT-qPCR normalization in common bean during biotic and abiotic stresses. Plant Cell Reports, 31(5), 827–838. https://doi.org/10.1007/s00299-011-1204-x [Google Scholar] [PubMed] [CrossRef]
57. Libault, M., Thibivilliers, S., Bilgin, D. D., Radwan, O., Benitez, M. et al. (2008). Identification of four soybean reference genes for gene expression normalization. Plant Genome, 1(1), 44–54. [Google Scholar]
58. Eticha, D., Zahn, M., Bremer, M., Yang, Z., Rangel, A. F. (2010). Transcriptomic analysis reveals differential gene expression in response to aluminium in common bean (Phaseolus vulgaris) genotypes. Annuals of Botany, 105(7), 1119–1128. https://doi.org/10.1093/aob/mcq049 [Google Scholar] [PubMed] [CrossRef]
59. Youko, O., Takayuki, Y., Hiroyuki, K., Harumi, S., Satomi, M. et al. (2016). Genome-wide transcriptome analysis of cadmium stress in rice. Biomed Research International, 2016, 1–9. https://doi.org/10.1155/2016/9739505 [Google Scholar] [PubMed] [CrossRef]
60. Ogawa, I., Nakanishi, H., Mori, S. (2009). Time course analysis of gene regulation under cadmium stress in rice. Plant and Soil, 325, 9739505. https://doi.org/10.1155/2016/9739505 [Google Scholar] [CrossRef]
Appendix A
Cite This Article
 Copyright © 2023 The Author(s). Published by Tech Science Press.
This work is licensed under a Creative Commons Attribution 4.0 International License , which permits unrestricted use, distribution, and reproduction in any medium, provided the original work is properly cited.
 Downloads
 Citation Tools