
 Submit a Paper
 Propose a Special lssue
 Open Access
ARTICLE

Involvement of the ABA- and H2O2-Mediated Ascorbate–Glutathione Cycle in the Drought Stress Responses of Wheat Roots
1 College of Life Science, Henan Normal University, Xinxiang, 453007, China
2 School of Life Science and Basic Medicine, Xinxiang University, Xinxiang, 453003, China
* Corresponding Authors: Leishan Chen. Email: ; Jianhui Ma. Email:
Phyton-International Journal of Experimental Botany 2024, 93(2), 329-342. https://doi.org/10.32604/phyton.2024.046976
Received 20 October 2023; Accepted 10 January 2024; Issue published 27 February 2024
 View Full Text
 Download PDF
Abstract
Abscisic acid (ABA), hydrogen peroxide (H2O2) and ascorbate (AsA)–glutathione (GSH) cycle are widely known for their participation in various stresses. However, the relationship between ABA and H2O2 levels and the AsA–GSH cycle under drought stress in wheat has not been studied. In this study, a hydroponic experiment was conducted in wheat seedlings subjected to 15% polyethylene glycol (PEG) 6000–induced dehydration. Drought stress caused the rapid accumulation of endogenous ABA and H2O2 and significantly decreased the number of root tips compared with the control. The application of ABA significantly increased the number of root tips, whereas the application of H2O2 markedly reduced the number of root tips, compared with that under 15% PEG-6000. In addition, drought stress markedly increased the DHA, GSH and GSSG levels, but decreased the AsA levels, AsA/DHA and GSH/GSSG ratios compared with those in the control. The activities of the four enzymes in the AsA–GSH cycle were also markedly increased under drought stress, including glutathione reductase (GR), ascorbate peroxidase (APX), monodehydroascorbate reductase (MDHAR) and dehydroascorbate reductase (DHAR), compared with those in the control. However, the application of an ABA inhibitor significantly inhibited GR, DHAR and APX activities, whereas the application of an H2O2 inhibitor significantly inhibited DHAR and MDHAR activities. Furthermore, the application of ABA inhibitor significantly promoted the increases of H2O2 and the application of H2O2 inhibitor significantly blocked the increases of ABA, compared with those under 15% PEG-6000. Taken together, the results indicated that ABA and H2O2 probably interact under drought stress in wheat; and both of them can mediate drought stress by modulating the enzymes in AsA–GSH cycle, where ABA acts as the main regulator of GR, DHAR, and APX activities, and H2O2 acts as the main regulator of DHAR and MDHAR activities.Keywords
Wheat (Triticum aestivum L.) is a major cereal crop cultivated in arid and semi-arid regions worldwide [1]. Drought stress has emerged as a significant abiotic stress threatening wheat growth, development, and production. In recent years, frequent drought events in arid and semi-arid regions have posed serious challenges to crop production. Severe and extreme drought events have obviously intensified since the late 1990s in China, with arid areas expanding by approximately 3.72% per decade over the past five decades [2]. Wheat plants have developed various physiological processes, such as stomatal movement, oxidation resistance, root development, and osmotic regulation, to combat drought stress [3–5]. Therefore, exploring the response of plants to drought stress is crucial to improve wheat quality and promote its yield.
Drought stress generally induces the production of reactive oxygen species (ROS), particularly H2O2, thereby disrupting redox homeostasis and subsequently causing oxidative damage to lipids, proteins, and nucleic acids in plant cells [6]. H2O2 plays an important signaling role in plants. H2O2, at low levels, acts as a signaling molecule, transmitting information and triggering the appropriate cellular defenses or responses to environmental changes. However, excessive H2O2 can result in metabolic dysfunction or cell death in extreme cases. ABA is an important endogenous regulatory hormone, and an anti-stress signaling molecule in plants because of its rapid accumulation when responsing to various environmental stresses such as drought, high osmoticum, high salinity, and low temperature/freezing [7,8]. Notably, many processes involved in drought stress regulation operate via ABA-dependent or ABA-independent pathways [9,10].
Plants have developed enzymatic and non-enzymatic oxidant-scavenging pathways to alleviate the oxidative damage caused by drought stress. The AsA–GSH cycle is one of the pathways that plays a vital role in plant antioxidant defense systems. This cycle efficiently scavenges ROS by mobilizing AsA and GSH and utilizing the four enzymes: GR, APX, MDHAR and DHAR [6,11,12]. Interestingly, both H2O2 and ABA are closely associated with the AsA–GSH cycle. For instance, H2O2 can alleviate salt stress through the AsA–GSH cycle in plants [13]. Similarly, ABA alleviates the oxidative damage induced by drought stress by promoting the AsA–GSH cycle [13–15].
Regarding all above, both H2O2 and ABA are involved in the responses to drought stress and are related to AsA–GSH cycle in plants. But the relationship between H2O2 and ABA levels and the AsA–GSH cycle in response to drought stress in wheat roots has not been documented in the literature. Therefore, we hypothesized that there is a regulatory relationship between H2O2 and ABA levels and the AsA–GSH cycle in wheat. To verify our hypothesis, we established different experimental treatments and determined the activities of the four enzymes in the AsA–GSH cycle under different treatments to explore the possible regulatory relationships between H2O2 and ABA levels and the cycle under drought stress in wheat roots.
2.1 Plant Materials and Experiment Treatments
Wheat seeds (Aikang 58) were sterilized for 10 min with 0.1% (w/v) HgCl2 and washed with water, then soaked in water for 24 h under dark conditions. Uniformly sized seeds were placed on a petri dish with a wet filter paper on the bottom. Then, the germinated seeds were continuously cultured in the Hoagland solution in an artificial plant incubator at 20°C with 70% humidity and a 16 h light/8 h dark at 300 µmol m−2 s−1 light intensity.
Wheat seedlings at the two leaf stage, were exposed to Hoagland solution containing different reagents and the Hoagland solution alone used as the control. This study consisted of the following treatments: (1) 15% PEG-6000 (for drought stress), (2) 100 µM ABA, (3) 10 mM H2O2, (4) 15% PEG-6000 + 100 µM Fluridone (Flu) and (5) 15% PEG-6000 + 50 U/ml Catalase (CAT). All these reagents were dissolved in the Hoagland solution for use. Fluridone was used as an inhibitor of ABA biosynthesis, and CAT was used as a scavenger of H2O2 [13]. The fresh root tips of wheat seedlings at 0, 6, 12, 24 and 48 h under different treatments were collected, and stored in −80°C refrigerator to measure various parameters after different treatments. Every experiment was repeated three times.
2.2 Determination of H2O2 Levels
H2O2 levels were determined according to the method previously described [16]. Root tips (0.2 g) were ground in liquid nitrogen to the fine powder, which was extracted using pre-cooled acetone (2 ml). Then the suspension was centrifugated for 10 min at 5000 × g, The concentrated ammonia (0.1 ml) and 5% TiSO4 (0.1 ml) were added into the supernatant, and then centrifugated for 10 min at 3000 × g, and 2 M H2SO4 was used for the resuspension of titanium-peroxide complex. The absorbance at 415 nm was measured by Ultraviolet-visible Spectrophotometer (UV-2600; Shimadzu, Japan), and then the level of H2O2 was calculated through absorbance.
2.3 Determination of ABA Levels
To extract and purify endogenous ABA from the root tips, a previously described method was used [17]. Briefly, 0.1 g of root tips were prepared for extraction. The filtered samples were measured using high-performance liquid chromatography (Waters 600; Waters Corporation, Milford, MA, USA) equipped with a photodiode array detector and a C18 column (4.6 mm × 150 mm; 5 µm) as described previously with some modifications [18]. The separation of the compounds was determined by using a mobile phase methanol solution at a flow rate of 0.5 ml min−1. During the determination, the extraction solution of 10 µl for each sample was detected at 254 nm, with the column temperature set at 35°C. Before detection, all samples need to be filtered using 0.45 µm filter membranes. According to the standard curve, the ABA level was determined by calculating the peak area.
2.4 Determination of the Number of Root Tips
To determine the number of root tips, wheat seedlings were exposed to the treatments of Hoagland solution, 15% PEG-6000, 15% PEG-6000 + 100 µM ABA and 15% PEG-6000 + 10 mM H2O2 for 24 and 48 h, and the root tissues of wheat seedlings were selected for further analysis as our previously described [19]. Each treatment consisted of twenty biological replicates. The root tissues were cleaned with water and spread out in a plexiglass tray (200 mm × 250 mm), which contains a moderate amount of distilled water. The roots was scanned using a recording scanner (Epson 1680, Suwa, Japan), and the figures were analysed with Win RHIZO Pro Vision 5.0a (Regent Instruments Inc., Quebec, QC, Canada) to get the number of root tips.
2.5 Extraction and Measurement of AsA and GSH Levels
AsA and GSH levels were determined using previously described methods, with slight modifications. Firstly, 0.5 g root tips were ground in a solution of 5% meta-phosphoric acid mixed with 1 mM ethylenediaminetetraacetic acid (EDTA) to a homogenate, and then centrifugated 15 min at 11,500 × g, and obtained the supernatant for the following determination of AsA and GSH levels. The level of AsA was estimated as previously described [20]. To determine the total AsA level, 0.1 M dithiothreitol was used to obtain the reduced AsA and then measured the absorbance at 265 nm. The reduced AsA level was subtracted from the total AsA level to obtain the oxidized AsA level. The level of GSH was estimated using a standard curve of GSH and GSSG, as previously described [20,21]. The GSH level was calculated by subtracting the GSSG level from the total GSH level.
2.6 Determination of GR, APX, MDHAR, and DHAR Activities
Next, enzyme activities were measured using previous methods, with slight modifications [22,23]. Firstly, weigh 0.2 g of wheat samples. The samples were extracted by adding 3 ml of extraction buffer. The extraction buffer is composed of 50 mM potassium phosphate buffer, 1 mM EDTA, and 1% PVP. After centrifugation for 15 min at 15,000 × g, the enzyme activity was measured with supernatant solution. GR activity was measured by recording the absorbance of the reaction solution at 340 nm on account of oxidized GSH-dependent consumption of NADPH, using an extinction coefficient of 6.22 mM−1 cm−1 [22]. For the measurements of APX, MDHAR, and DHAR activities, 1 mM AsA was added before centrifugation. APX activity was measured by calculating the absorbance at 290 nm [22]. MDHAR activity was calculated according to the changes of oxidized NADPH using an extinction coefficient of 6.22 mM−1 cm−1 [23]. DHAR activity was measured by calculating the absorbance at 290 nm [23].
3.1 The Effect of Drought Stress on Root Tips
Root tips of wheat seedlings are particularly important as they can directly receive drought signals and quickly respond to drought stress. Hence, we focused on the changes in the research indices of the root tips of wheat seedlings in this study. Here, fluorescence analysis was adopted to abserve the changes in the H2O2 levels of wheat seedlings. The results showed that the H2O2 levels gradually increased during 0–48 h (Fig. 1A) and reached their highest level at 48 h under drought stress. H2O2 levels increased over time and its largest and smallest increases in levels were observed at 48 and 6 h, with increases of 140% and 33.66%, respectively; the levels were significantly increased by 110% and 133% at 12 and 24 h under 15% PEG-6000, respectively, compared with those in the control (Fig. 1B). The largest (82.7%) and smallest (28.9%) increase in ABA levels were observed at 24 and 6 h, respectively; the levels were significantly increased by 38.57% and 76.28% at 12 and 48 h under 15% PEG-6000, respectively, compared with those in the control (Fig. 1C). These findings indicate that both H2O2 and ABA may be involved in the adaptive responses triggered by drought stress.
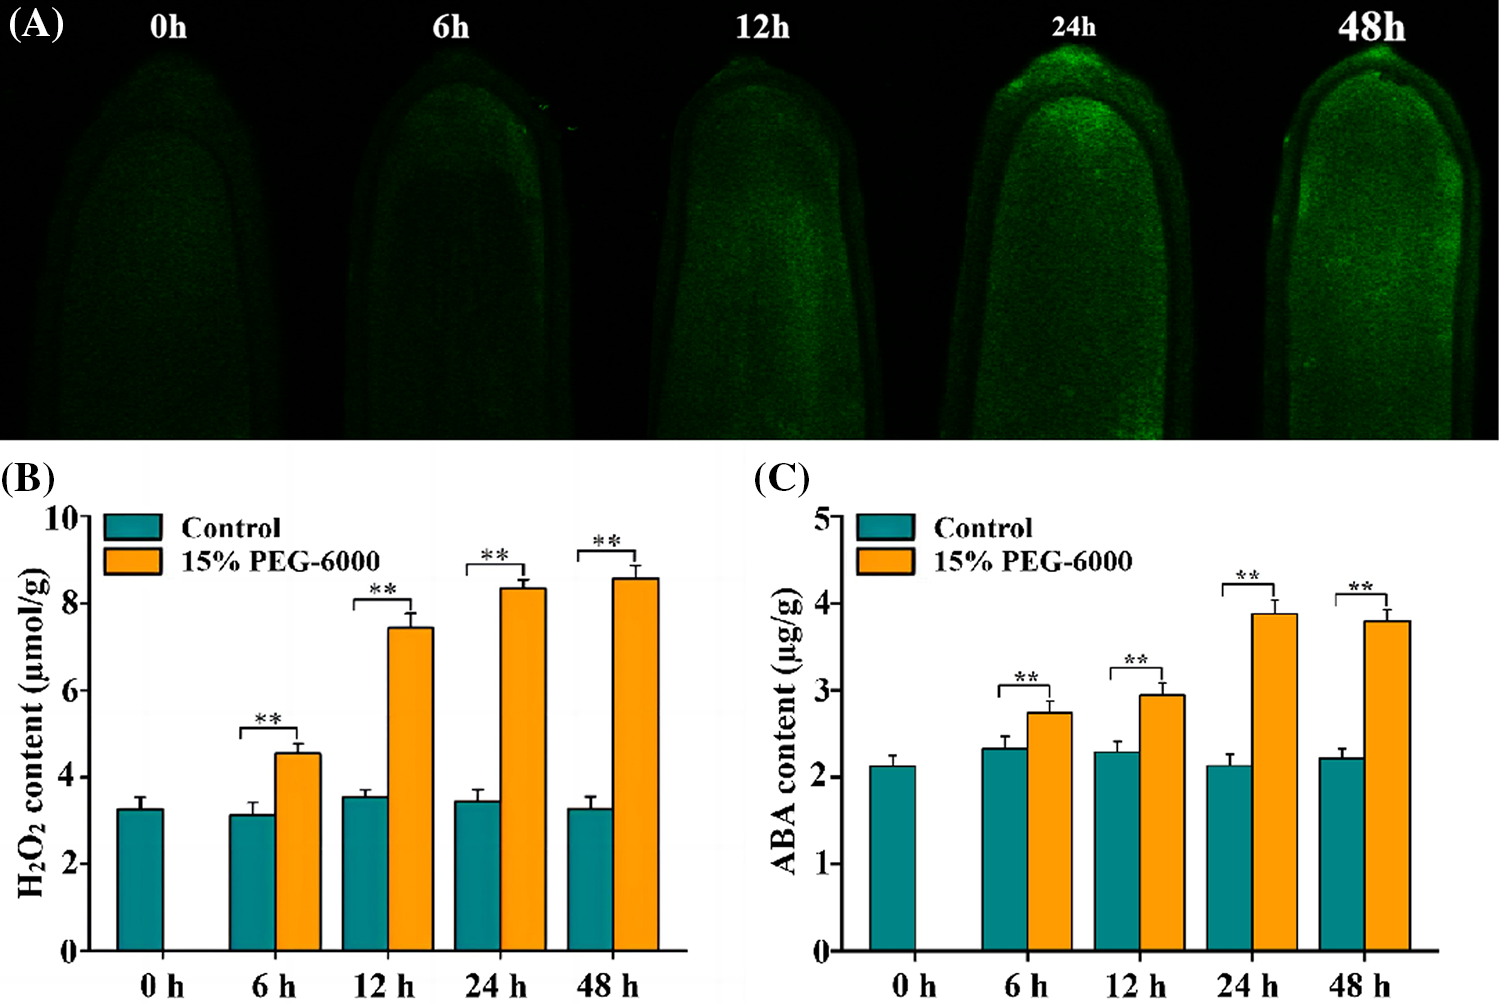
Figure 1: The changes of H2O2 and ABA levels in the root tips of wheat seedlings during 0–48 h under drought stress. 15% PEG-6000 was used for drought stress. (A) Fluorescence analysis of H2O2 levels under drought stress during 0–48 h (The higher the fluorescence intensity, the higher the H2O2 levels). The levels of H2O2 (B) and ABA (C) in the root tips of wheat seedlings under drought stress during 0–48 h. The data were represented with mean and standard deviation (SD) of three biological replications. **p < 0.01 indicates the significant differences
We further investigated the development of wheat root tips under drought stress with H2O2 or ABA. We found that the number of root tips was significantly reduced by 29.6% and 30.8% at 24 and 48 h under 15% PEG-6000, respectively, compared with the control (Figs. 2A and 2B). Interestingly, the number of root tips was significantly increased by 26.3% and 26.4% at 24 and 48 h under 15% PEG-6000 + 100 µM ABA, but the the number of root tips was significantly reduced by 21.1% and 35.6% at 24 and 48 h under 15% PEG-6000 + 10 mM H2O2, compared with that in 15% PEG-6000 (Figs. 2A and 2B). Therefore, we speculated that H2O2 and ABA were indeed involved in the development of root tips under 15% PEG-6000.
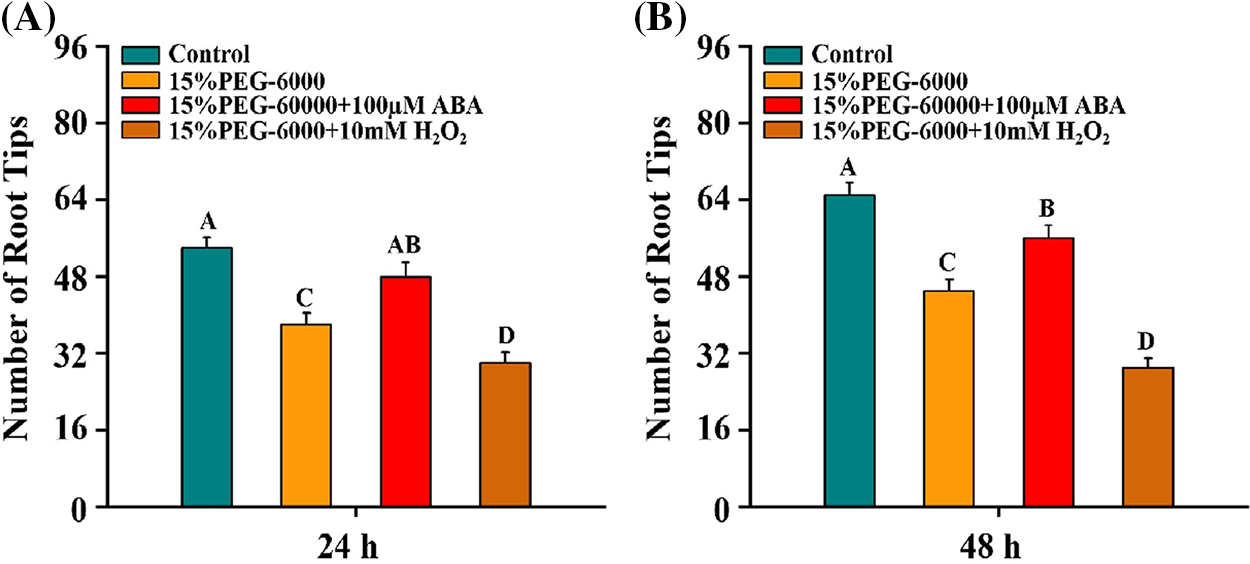
Figure 2: Effects of H2O2 (A) and ABA (B) on the development of the root tips under drought stress at 24 and 48 h. The treatments of Hoagland solution (Control), 15% PEG-6000 (for drought stress), 15% PEG-6000 + 100 µM ABA and 15% PEG-6000 + 10 mM H2O2 were used to analyze the the development of the root tips. The data were represented with mean and SD of twenty biological replications. Least significant difference (LSD) was used for multiple comparisons, and different letters mean the significant differences at 0.01 level
3.2 AsA and GSH Levels under Drought Stress
ASA and GSH also play crucial roles in regulating drought stress in plants, and they are two essential substances in the ASA-GSH cycle [24–26]. We found that AsA levels were significantly reduced by 16.53%, 26.02% and 33.02% at 12, 24, and 48 h, respectively, whereas those of DHA were markedly increased by 16.39, 27.17 and 35.85 at 12, 24, and 48 h, respectively, which decreased the AsA/DHA ratio by 19.35%, 34.57% and 47.67% at 12, 24, and 48 h, respectively, under drought stress compared with those in the control (Figs. 3A–3C). Drought stress significantly increased the GSH levels by 11.33%, 17.28%, and 27.34% at 12, 24 and 48 h, respectively, and increased the GSSG levels by 16.48%, 32.71%, 56.55% and 66.05% at 6, 12, 24 and 48 h, respectively, but markedly declined the GSH/GSSG ratio by 16.29% and 22.22% at 24 and 48 h, respectively, compared with those in the control (Figs. 3D–3F).
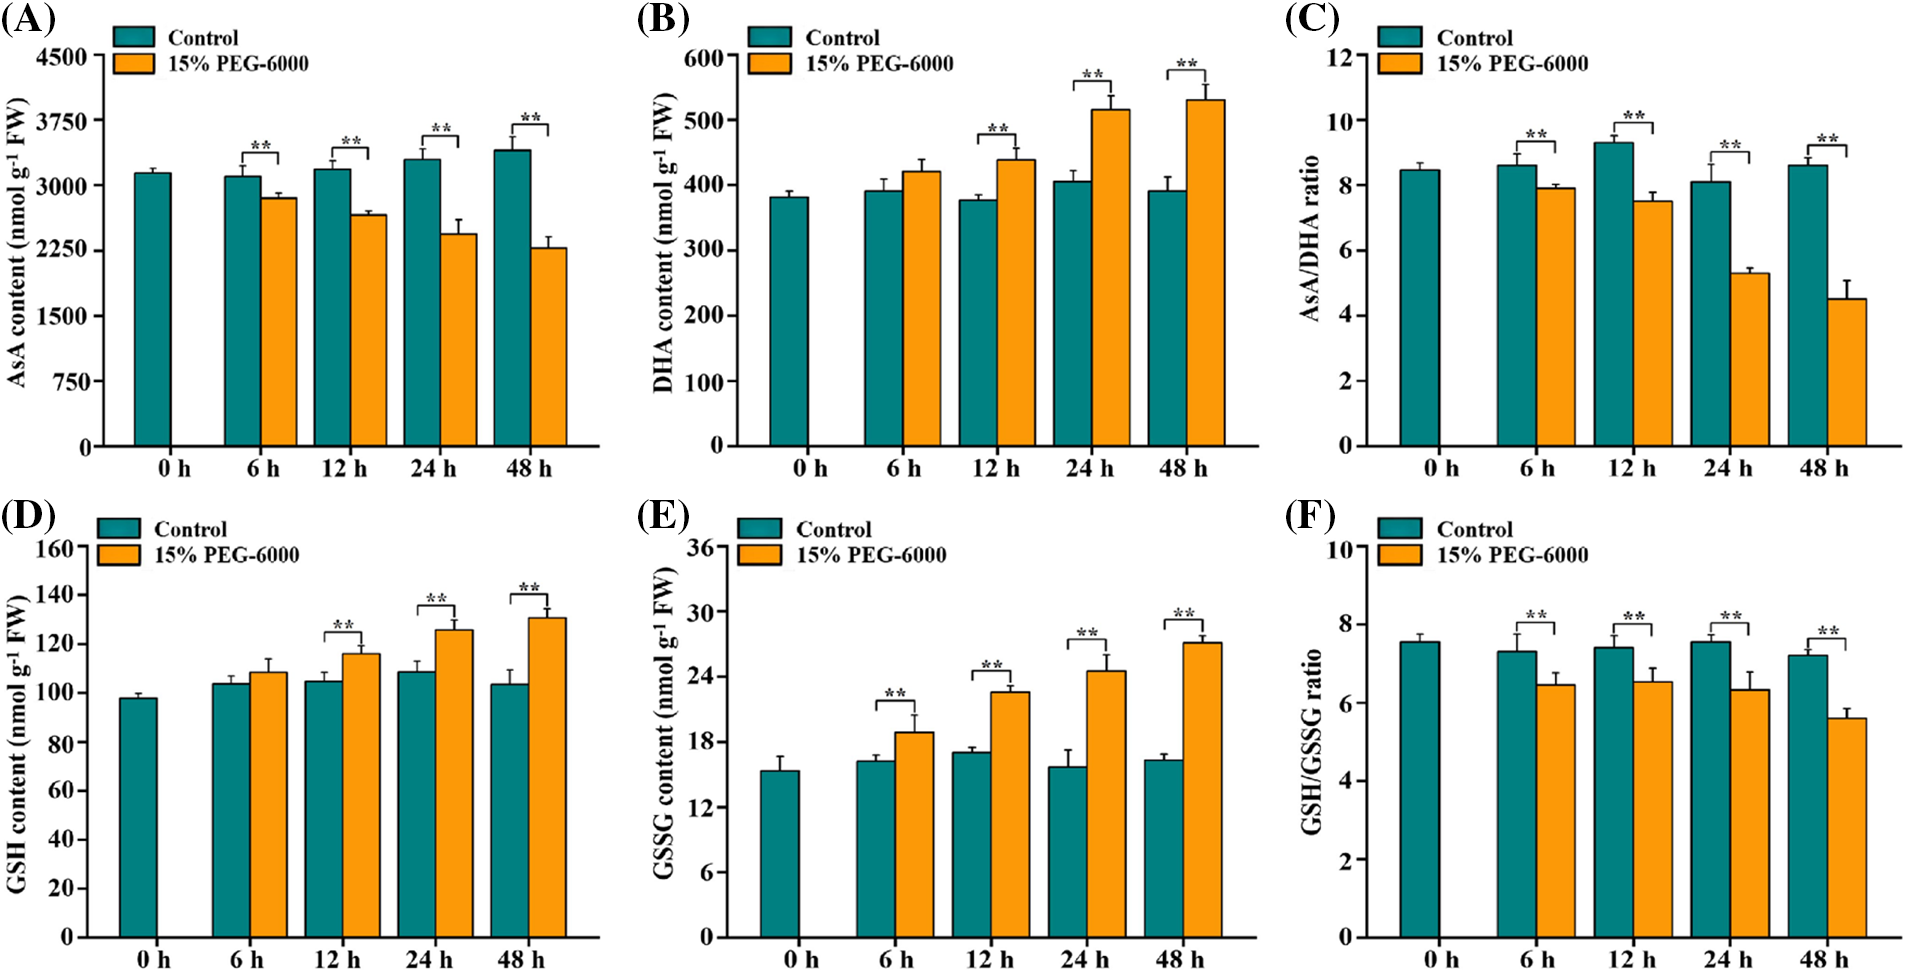
Figure 3: The levels of AsA levels (A), DHA levels (B), AsA/DHA ratio (C), GSH levels (D), GSSG levels (E) and GSH/GSSG ratio (F) in the root tips of wheat seedlings during 0–48 h under drought stress. 15% PEG-6000 was used for drought stress. The data were represented with mean and SD of three biological replications. **p < 0.01 indicates the significant differences
3.3 Effects of Drought Stress on the AsA–GSH Cycle in the Root Tips of Wheat Seedlings
The AsA–GSH cycle works in different vital activities mainly through the modulation of its four key enzymes contained in it. Therefore, we determined the four enzymes activities in the AsA–GSH cycle in the root tips of wheat seedlings under15% PEG-6000 to explore the relationship between drought stress and AsA–GSH cycle. We found that GR, APX, MDHAR, and DHAR activities were markedly higher than those in the control during 0–48 h under drought stress. Activities of GR, APX, MDHAR, and DHAR were significantly increased by 155%, 77.63%, 209%, and 77.63%, respectively, compared with those in the control (Figs. 4A–4D). For GR activity under drought stress, the smallest increase was observed at 6 h (71.19%), followed by 24 h (136%) and 48 h (108%), compared with that in the control (Fig. 4A). For MDHAR activity under drought stress, the smallest increase was observed at 6 h (37.10%), followed by 12 h (96.56%) and 48 h (84.20%), compared with that in the control (Fig. 4C). For APX and DHAR activities under drought stress, the smallest increase was observed at 6 h (23.39%) and 48 h (183%), respectively, compared with that in the control (Figs. 4B and 4D). Hence, the increased activities of GR, APX, MDHAR, and DHAR indicated that the ASA–GSH cycle was activated when responsing to drought stress in wheat roots.
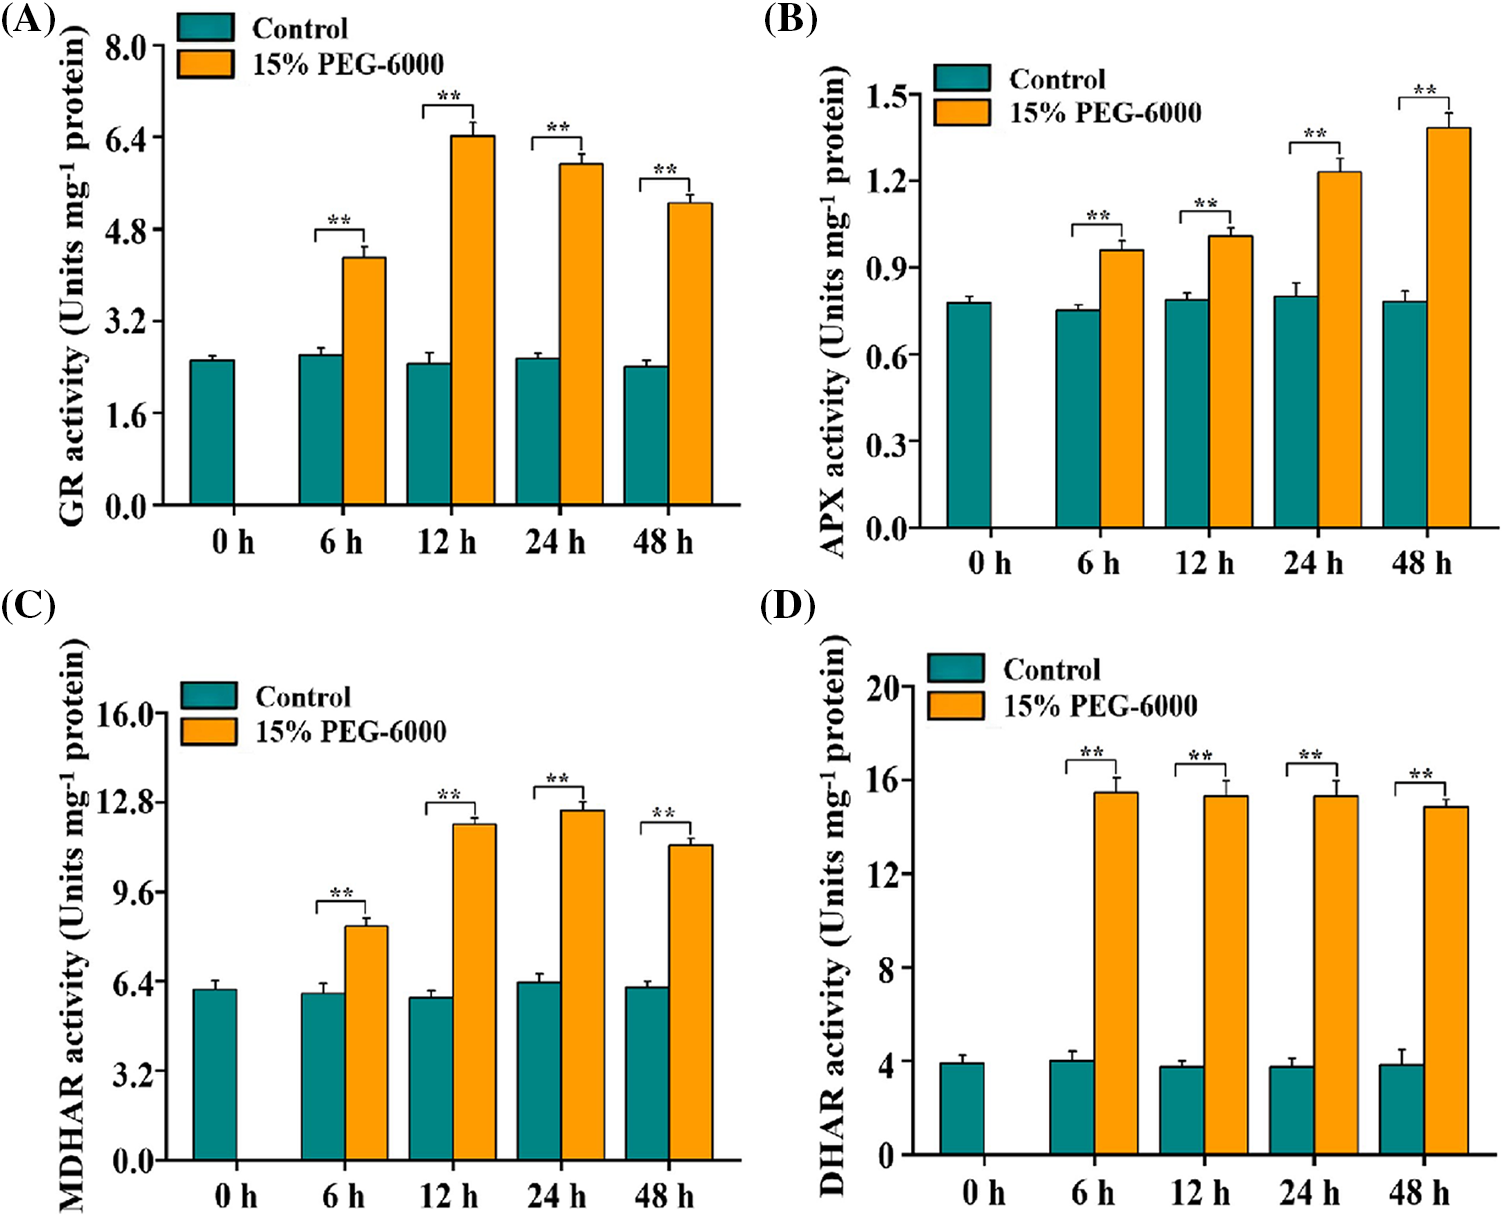
Figure 4: GR (A), APX (B), MDHAR (C), and DHAR (D) activities in the root tips of wheat seedlings during 0–48 h under drought stress. 15% PEG-6000 was used for drought stress. The data were represented with mean and SD of three biological replications. **p < 0.01 indicates the significant differences
3.4 Relationship between ABA and H2O2 Levels and the AsA–GSH Cycle under Drought Stress
To explore the relationship between ABA and H2O2 levels and the AsA–GSH cycle, the root tips of wheat seedlings was subjected to different treatments: control (Hoagland solution), 15% PEG-6000 (inducing drought stress), 10 mM H2O2, 100 µM ABA, 15% PEG-6000 + 50 U/ml CAT and 15% PEG-6000 + 100 µM Fluridone. By comparing the enzymes activities in the AsA–GSH cycle under different treatments, we gained more precise and in-depth insights into the relationship between ABA and H2O2 levels and the AsA–GSH cycle in regulating drought stress in the root tips of wheat seedlings.
3.4.1 Relationship between ABA and H2O2 under Drought Stress
We firstly investigate the relationship between H2O2 and ABA under drought stress using ABA inhibitor and H2O2 scavenger. From the result, we found that drought stress significantly induced the increase of H2O2 and ABA levels compared with the control (Figs. 5A and 5B). The largest increase in H2O2 level was observed at 48 h, with an increase of 160.8%, and the largest increase in ABA level was observed at 48 h, with an increase of 83.3%, under 15% PEG-6000 compared with those in the control, respectively (Figs. 5A and 5B). Pretreatment with Fluridone promoted the increase of H2O2, whereas pretreatment with CAT blocked the increase of ABA, compared with 15% PEG treatment (Figs. 5A and 5B). The largest increase in H2O2 level under 15% PEG + Fluridone was observed at 48 h, with an increase of 25.7% (Fig. 5A), and the largest decrease in ABA level under 15% PEG + CAT was observed at 24 h, with a decrease of 21.3% (Fig. 5B), compared with those under 15% PEG treatment. All these indicated that H2O2 and ABA probably interact under drought stress.
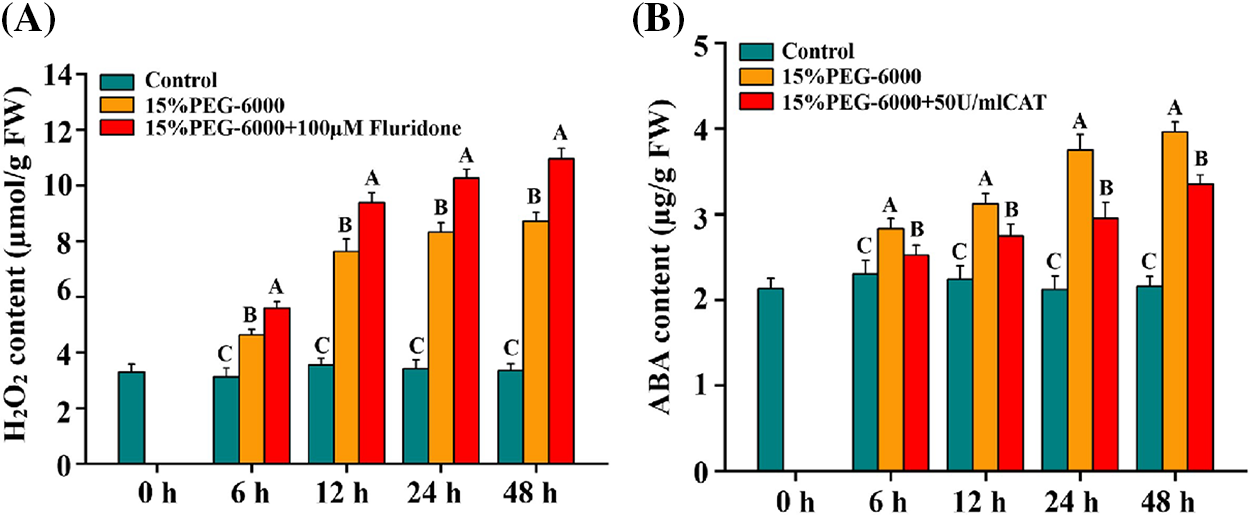
Figure 5: The relationship between H2O2 (A) and ABA (B) during 0–48 h under drought stress. The treatments of Hoagland solution (Control), 15% PEG-6000 (for drought stress), 15% PEG-6000 + 100 µM Fluridone and 15% PEG-6000 + 50 U/ml CAT were adopted for different treatments. The data were represented with mean and SD of three biological replications. Least significant difference (LSD) was used for multiple comparisons, and different letters mean the significant differences at 0.01 level
3.4.2 Relationship between ABA and H2O2 Levels and GR Activity
In our present study, the activity of GR was significantly increased under 15% PEG-6000, 100 μM ABA, and 10 mM H2O2 compared with the control (Figs. 6A and 6B). Interestingly, GR activity was significantly decreased under 15% PEG-6000 + 100 µM Fluridone treatment, which was reduced by 30.77% at 6 h, 55.41% at 12 h, 59.03% at 24 h, and 48.42% at 48 h, respectively, compared with that in the 15% PEG-6000 treatment, whereas it showed little changes under 15% PEG-6000 + 50 U/ml CAT treatment compared with that under 15% PEG-6000 (Figs. 6A and 6B). Therefore, we speculate that ABA may be the main regulator of GR activity.
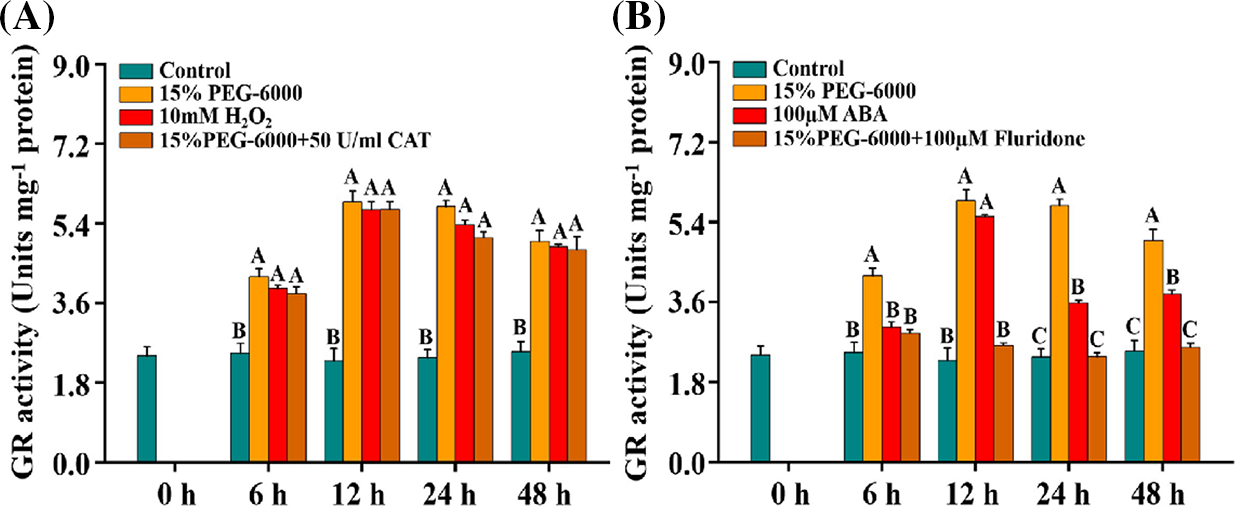
Figure 6: The relationship between H2O2 (A) and ABA (B) levels and GR activity during 0–48 h under drought stress. Hoagland solution (Control), 15% PEG-6000 (for drought stress), 10 mM H2O2, 100 µM ABA, 15% PEG-6000 + 50 U/ml CAT and 15% PEG-6000 + 100 µM Fluridone were adopted for different treatments. The data were represented with mean and SD of three biological replications. Least significant difference (LSD) was used for multiple comparisons, and different letters mean the significant differences at 0.01 level
3.4.3 Relationship between ABA and H2O2 Levels and APX Activity
Similar changes were observed in APX activity under different treatments. The activity of APX was significantly increased under 15% PEG-6000, 100 μM ABA, and 10 mM H2O2 compared with control (Figs. 7A and 7B). Under 15% PEG-6000 + 100 µM Fluridone treatment, APX activity was significantly reduced by 31.25% at 6 h, 30.43% at 24 h and 28.38% at 48 h, respectively, compared with that under 15% PEG-6000 (Fig. 7B). However, almost no reduction was found under 15% PEG-6000 + 50 U/ml CAT treatment compared with that under 15% PEG-6000, indicating that APX activity is mainly regulated by ABA (Fig. 7A).
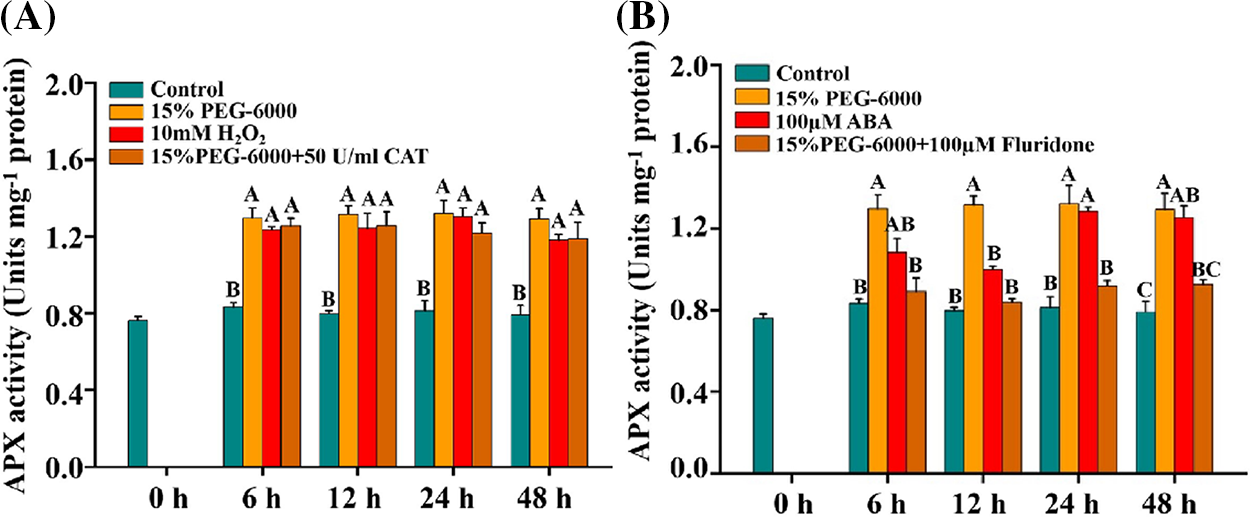
Figure 7: The relationship between H2O2 (A) and ABA (B) levels and APX activity during 0–48 h under drought stress. Hoagland solution (Control), 15% PEG-6000 (for drought stress), 10 mM H2O2, 100 µM Fluridone, 15% PEG-6000 + 50 U/ml CAT and 15% PEG-6000 + 100 µM Fluridone were adopted for different treatments. The data were represented with mean and SD of three biological replications. Least significant difference (LSD) was used for multiple comparisons, and different letters mean the significant differences at 0.01 level
3.4.4 Relationship between ABA and H2O2 Levels and MDHAR Activity
We found that the activity of MDHAR was significantly increased under 15% PEG-6000, 10 mM H2O2, and 100 µM ABA compared with the control (Figs. 8A and 8B). Contrary to the changes in GR activity, MDHAR activity was significantly decreased under 15% PEG-6000 + 50 U/ml CAT compared with that in the 15% PEG-6000 treatment, which was reduced by 15.10% at 6 h, 17.88% at 12 h, 26.56% at 24 h and 56.57% at 48 h, respectively, compared with that under 15% PEG-6000 (Fig. 8A). However, we did not observe a significant inhibition of MDHAR activity under 15% PEG-6000 + 100 µM Fluridone compared with that under 15% PEG-6000 (Fig. 8B). These results imply that H2O2, rather than ABA, maybe the primary regulator of MDHAR.
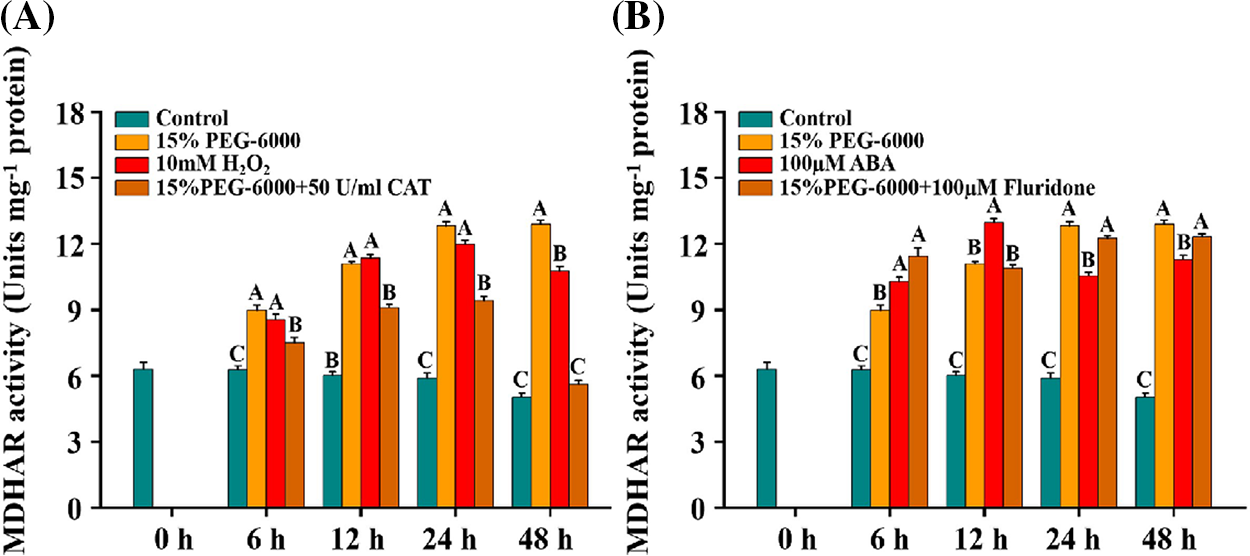
Figure 8: The relationship between H2O2 (A) and ABA (B) levels and MDHAR activity during 0–48 h under drought stress. Hoagland solution (Control), 15% PEG-6000 (for drought stress), 10 mM H2O2, 100 µM ABA, 15% PEG-6000 + 50 U/ml CAT and 15% PEG-6000 + 100 µM Fluridone were adopted for different treatments. The data were represented with mean and SD of three biological replications. Least significant difference (LSD) was used for multiple comparisons, and different letters mean the significant differences at 0.01 level
3.4.5 Relationship between ABA and H2O2 Levels and DHAR Activity
For DHAR activity, we observed that the activity of DHAR was significantly induced under 15% PEG-6000, 10 mM H2O2 and 100 µM ABA compared with that in the control, while it was significantly decreased under 15% PEG-6000 + 50 U/ml CAT and 15% PEG-6000 +100 µM Fluridone, compared with that under 15% PEG-6000 during 6–48 h (Figs. 9A and 9B). Under 15% PEG-6000 + 50 U/ml CAT treatment, the decrease of DHAR activity was approximately 40% at 6, 12, 24, and 48 h (Fig. 9A). Under 15% PEG-6000 + 100 µM Fluridone treatment, the largest increase and the smallest increase in activity were observed at 48 h with a 78.85% increase and at 24 h with a 25.58% increase compared with those under 15% PEG-6000 (Fig. 9B). These findings suggest that the activity of DHAR may be regulated by both ABA and H2O2 together. These findings provide insights into the relationship between ABA and H2O2 levels and DHAR activity under drought stress.
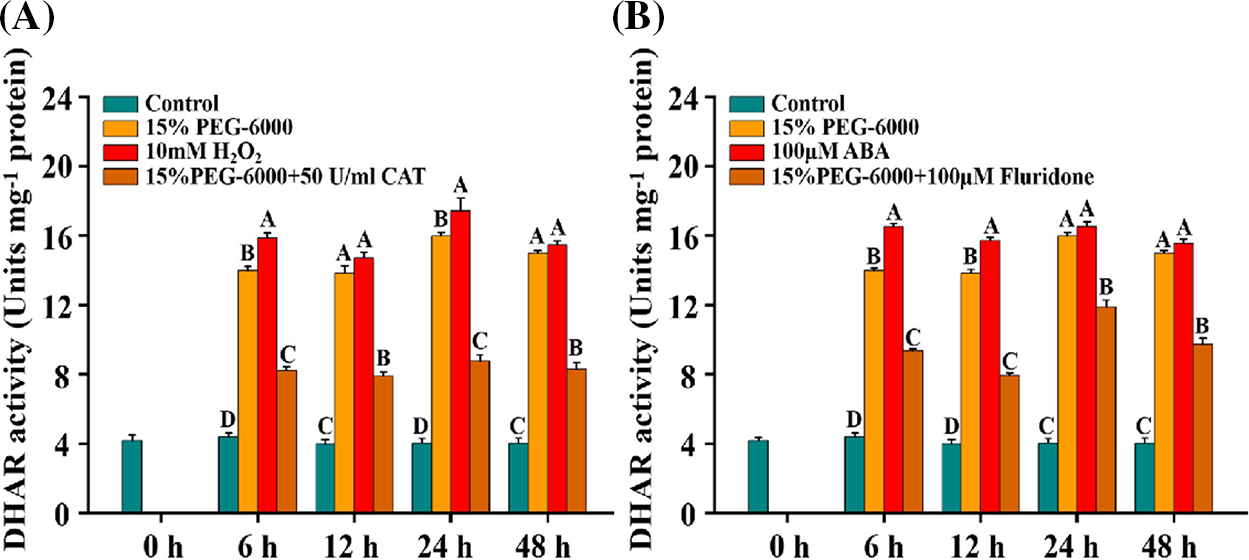
Figure 9: The relationship between H2O2 (A) and ABA (B) levels and DHAR activity during 0–48 h under drought stress. Hoagland solution (Control), 15% PEG-6000 (for drought stress), 10 mM H2O2, 100 µM ABA, 15% PEG-6000 + 50 U/ml CAT and 15% PEG-6000 + 100 µM Fluridone were adopted for different treatments. The data were represented with mean and SD of three biological replications. Least significant difference (LSD) was used for multiple comparisons, and different letters mean the significant differences at 0.01 level
Due to the complexity of soil composition and the difficulty of controlling it under practical conditions, actual soil is rarely used for drought stress research. Moreover, it is hard to distinguish drough stress from many other stresses in the soil. Therefore, the establishment of stable and controllable conditions are especially important in the research of water stress. As PEG has low chronic toxicity, its relative molecular mass is so large that it is hardly absorbed, its water solubility is good, and it can maintain a uniform water potential in the solution. Therefore, the water relationship of plants is similar regardless of whether they are grown in soil or PEG solution with the same water potential [27]. Therefore, a 15% PEG-6000 solution was adopted to explore the relationship between H2O2 and ABA levels and the AsA–GSH cycles in the root tips of wheat seedlings under drought stress in our study.
Since the 1990s, the frequency and intensity of drought events have increased significantly in wheat-producing areas of China, particularly in the northern regions [28]. Drought stress has emerged as the primary abiotic stress threatening the normal growth and production of wheat. To deal with drought stress, plants have developed intricate regulatory pathways, including ABA-dependent and -independent pathways, ROS signaling, and the AsA–GSH cycle [29,30], which are induced by drought stress in various plant species [31,32]. In our study, we also observed that the levels of ABA, and H2O2 were both induced under drought stress in wheat roots compared with the control (Fig. 1). It has been demonstrated that H2O2 can enhance drought resistance of wheat by increasing its accumulation in leaves [33]. In addition, the study has also shown that drought stress can result in the rapid accumulation of ABA and H2O2 in soybean roots [13]. Therefore, our results are consistent with those of previous studies about drought stress. In our study, drought stress declined the number of root tips, compared with the control. The application of ABA increased the number of root tips, whereas the application of H2O2 significantly declined the number of root tips, compared with that under the treatment of 15% PEG-6000. Root tips are the primary tissues to absorb nutrients and water [34,35]. Therefore, root tips play a vital role in ensuring the normal growth of plants under different environmental conditions. However, root tips are significantly affected by drought stress [36,37]. Therefore, our results on the development of root tips under drought are consistent with previous studies. In addition, it has been proved that both H2O2 and ABA are involved in the regulation of drought stress. Exogenous application of ABA can alleviate drought stress but H2O2 aggravated drought stress [33,38]. Our results showed that the application of ABA significantly increased the number of root tips, whereas the application of H2O2 significantly decreased the number of root tips, compared with that under 15% PEG-6000, which also demonstrated that H2O2 and ABA participated in the development of root tips through drought stress.
In recent years, there have been numerous studies focusing on the individual roles of H2O2, ABA, and the AsA–GSH cycle in drought stress responses [39,40]. However, the specific relationship between H2O2 and ABA levels and the AsA–GSH cycle in regulating drought stress in wheat roots remains unknown. Hence, we measured the levels of ascorbate and glutathione and the activities of four enzymes in the AsA–GSH cycle after 15% PEG-6000 treatment, and all of them were significantly induced compared with those in the control (Figs. 3 and 4). AsA acts as an antioxidant, exists in large quantities in plants and can remove reactive oxygen species efficiently [38]. From our results, the AsA levels decreased whereas those of DHA increased in wheat roots under 15% PEG-6000 compared with the control, which declined the AsA/DHA ratio under 15% PEG-6000. What’s more, increased APX activity under 15% PEG-6000 was related to decreased AsA levels compared with those in the control and increased MDHAR and DHAR activities indicated increased antioxidant capacity as they are mainly responsible for the regeneration of AsA. GSH plays an important role in multiple stress responses, such as drought stress [38,41]. In our present study, the level of GSSG in wheat roots was significantly induced under 15% PEG-6000. GSH is involved in the clearance of reactive oxygen species, leading to its transformation into GSSG; hence, the levels of GSSG are increased under 15% PEG-6000. GSSG can be converted to GSH again under GR activity, so the increase in GR activity under 15% PEG-6000 is responsible for the increased GSH levels [41].
Previous studies have proved that ABA can enhance drought tolerance by reducing H2O2 contents, and exogenous application of H2O2 can increase ABA contents under drought stress [33,38]. In our results, we also observed that application of Fluridone under 15% PEG-6000 promoted the increases of H2O2 level and application of CAT blocked the increases of ABA level, respectively, compared with those under 15% PEG-6000 (Figs. 5A and 5B). All above indicated that H2O2 and ABA probably interact under drought stress. We further investigated the relationship between H2O2 and ABA levels and the AsA–GSH cycle. Interestingly, compared with the treatment of 15% PEG-6000, DHAR activities were significantly inhibited under the treatment of 15% PEG-6000 + 100 μM Fluridone, while the activities of MDHAR and DHAR were significantly inhibited under the treatment of 15% PEG-6000 + 50 μM CAT, compared with those under the treatment of 15% PEG-6000. These findings suggest a close relationship between ABA and H2O2 and the activities of the enzymes in the AsA–GSH cycle. The inhibitory effects observed in the presence of Fluridone and CAT suggest that ABA and H2O2 are participated in regulation of the enzymes in the AsA–GSH cycle under 15% PEG-6000. These results show that there exists a special relationship between ABA and H2O2 levels and the AsA–GSH cycle under drought stress in wheat roots.
Finally, we have proposed a schematic model to elucidate the regulatory pathways in wheat roots under drought stress (Fig. 10). According to the model, H2O2 and ABA possibly affected each other under drought stress. And H2O2 and ABA played crucial roles in regulating drought stress by modulating the AsA–GSH cycle in wheat roots, which H2O2 positively regulates the activities of MDHAR and DHAR, whereas ABA positively regulates the activities of GR, APX, and DHAR. These regulatory effects enhanced the AsA–GSH cycle, thereby alleviating the impacts of drought stress in wheat. Though our findings mainly highlight the relationship between H2O2 and ABA levels and the AsA–GSH cycle under drought stress in wheat, it will be helpful to further explore the interactive signaling roles in regulating a range of biological functions regarding to the normal growth and development of plants and the responses to many other abiotic stresses. In conclusion, this study provides new insights into the relationship between H2O2 and ABA levels and the AsA–GSH cycle in response to drought stress and may provide new ideas for the research of other related fields such as ecology and agriculture.
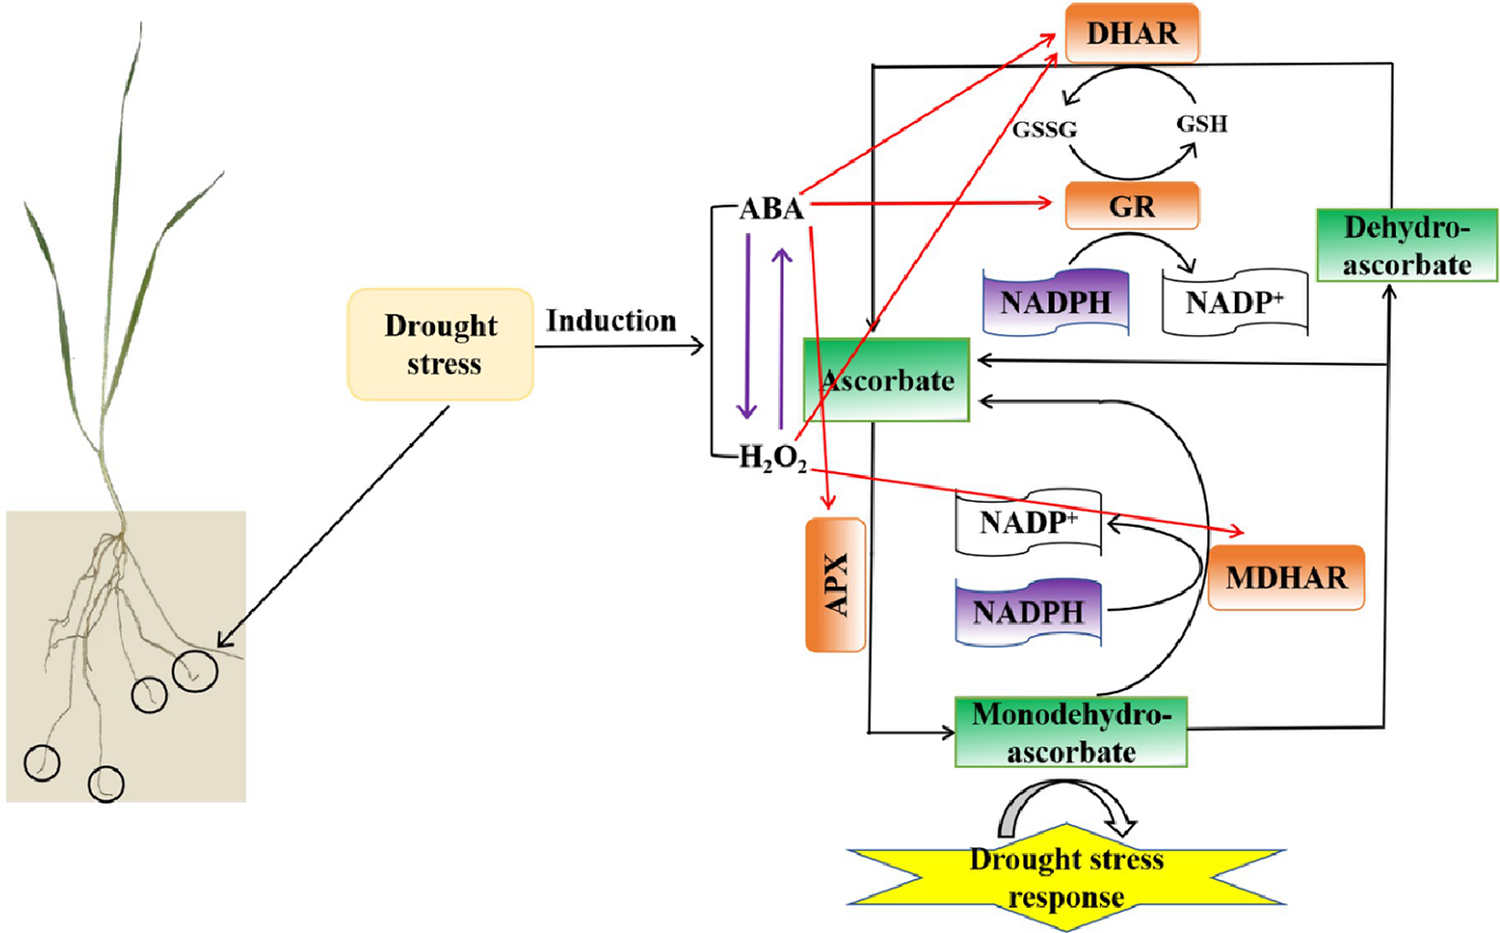
Figure 10: The schematic model of the relationship between H2O2 and ABA levels and the AsA–GSH cycle under drought stress in wheat roots. Purple arrows between H2O2 and ABA indicate that H2O2 and ABA probably interact under drought stress. The red arrows in the model indicate that ABA positively regulates APX, and DHAR activities, whereas H2O2 positively regulates MDHAR and DHAR activities in response to drought stress
Acknowledgement: None.
Funding Statement: This research was funded by the National Key Research and Development Program of China (2023YFD2301505).
Author Contributions: Jianhui Ma and Leishan Chen designed the experiments and wrote the manuscript. Mengyuan Li, Zhongye Gao, and Lina Jiang conducted the experiments. Jianhui Ma provided the funding. All the authors have read and approved the final manuscript.
Availability of Data and Materials: All related information is available in this manuscript.
Ethics Approval: None.
Conflicts of Interest: The authors declare that they have no conflicts of interest to report regarding the present study.
References
1. Ma J, Geng Y, Liu H, Zhang M, Liu S, Hao C, et al. TaTIP41 and TaTAP46 positively regulate drought tolerance in wheat by inhibiting PP2A activity. J Integr Plant Biol. 2023;65(9):2056–70. [Google Scholar] [PubMed]
2. Yu M, Li Q, Hayes MJ, Svoboda MD, Heim RR. Are droughts becoming more frequent or severe in China based on the standardized precipitation evapotranspiration index: 1951–2010? Int J Climatol. 2014;34:545–58. [Google Scholar]
3. Hasanuzzaman M, Nahar K, Anee TI, Fujita M. Exogenous silicon attenuates cadmium-induced oxidative stress in Brassica napus L. by modulating AsA-GSH pathway and glyoxalase system. Front Plant Sci. 2017;8:1061. [Google Scholar] [PubMed]
4. Ostria-Gallardo E, Zúñiga-Contreras E, Carvajal DE, de La Peña TC, Gianoli E, Bascuñán-Godoy L. Two congeneric shrubs from the atacama desert show different physiological strategies that improve water use efficiency under a simulated heat wave. Plants. 2023;12(13):2464. [Google Scholar] [PubMed]
5. Hasanuzzaman M, Bhuyan MHMB, Zulfiqar F, Raza A, Mohsin SM, Mahmud JA, et al. Reactive oxygen species and antioxidant defense in plants under abiotic stress: revisiting the crucial role of a universal defense regulator. Antioxidants. 2020;9(8):681. [Google Scholar] [PubMed]
6. Gill SS, Tuteja N. Reactive oxygen species and antioxidant machinery in abiotic stress tolerance in crop plants. Plant Physiol Biochem. 2010;48(12):909–30. [Google Scholar] [PubMed]
7. Gupta K, Gupta B, Ghosh B. Spermidine and abscisic acid-mediated phosphorylation of a cytoplasmic protein from rice root in response to salinity stress. Acta Physiol Plant. 2012;34:29–40. [Google Scholar]
8. Parvin S, Lee OR, Sathiyaraj G, Khorolragchaa A, Kim YJ, Devi BS, et al. Interrelationship between calmodulin (CaM) and H2O2 in abscisic acid-induced antioxidant defense in the seedlings of Panax ginseng. Mol Biol Rep. 2012;39(7):7327–38. [Google Scholar] [PubMed]
9. Yoshida T, Mogami J, Yamaguchi-Shinozaki K. ABA-dependent and ABA-independent signaling in response to osmotic stress in plants. Curr Opin Plant Biol. 2014;21:133–9. [Google Scholar] [PubMed]
10. Yamaguchi-Shinozaki K, Shinozaki K. Transcriptional regulatory networks in cellular responses and tolerance to dehydration and cold stresses. Annu Rev Plant Biol. 2006;57:781–803. [Google Scholar] [PubMed]
11. Begara-Morales JC, Sánchez-Calvo B, Chaki M, Mata-Pérez C, Valderrama R, Padilla MN, et al. Differential molecular response of monodehydroascorbate reductase and glutathione reductase by nitration and S-nitrosylation. J Exp Bot. 2015;66(19):5983–96. [Google Scholar] [PubMed]
12. Mishra RK, Mishra G, Singh R, Parihar P, Kumar J, Srivastava PK, et al. Managing arsenic (V) toxicity by phosphate supplementation in rice seedlings: modulations in AsA-GSH cycle and other antioxidant enzymes. Environ Sci Pollut Res Int. 2022;29(10):14418–29. [Google Scholar] [PubMed]
13. Wang H, Yang L, Li Y, Hou J, Huang J, Liang W. Involvement of ABA- and H2O2-dependent cytosolic glucose-6-phosphate dehydrogenase in maintaining redox homeostasis in soybean roots under drought stress. Plant Physiol Biochem. 2016;107:126–36. [Google Scholar] [PubMed]
14. Zhang A, Jiang M, Zhang J, Ding H, Xu S, Hu X, et al. Nitric oxide induced by hydrogen peroxide mediates abscisic acid-induced activation of the mitogen-activated protein kinase cascade involved in antioxidant defense in maize leaves. New Phytol. 2007;175(1):36–50. [Google Scholar] [PubMed]
15. Hu X, Jiang M, Zhang J, Zhang A, Lin F, Tan M. Calcium-calmodulin is required for abscisic acid-induced antioxidant defense and functions both upstream and downstream of H2O2 production in leaves of maize (Zea mays) plants. New Phytol. 2007;173(1):27–38. [Google Scholar] [PubMed]
16. Patterson BD, MacRae EA, Ferguson IB. Estimation of hydrogen peroxide in plant extracts using titanium (IV). Anal Biochem. 1984;139(2):487–92. [Google Scholar] [PubMed]
17. Vilaró F, Canela-Xandri A, Canela R. Quantification of abscisic acid in grapevine leaf (Vitis vinifera) by isotope-dilution liquid chromatography-mass spectrometry. Anal Bioanal Chem. 2006;386(2):306–12. [Google Scholar]
18. Wang C, Yang A, Yin H, Zhang J. Influence of water stress on endogenous hormone contents and cell damage of maize seedlings. J Integr Plant Biol. 2008;50(4):427–34. [Google Scholar] [PubMed]
19. Ma J, Zhao D, Tang X, Yuan M, Zhang D, Xu M, et al. Genome-wide association study on root system architecture and identification of candidate genes in wheat (Triticum aestivum L.). Int J Mol Sci. 2022;23(3):1843. [Google Scholar] [PubMed]
20. Yu CW, Murphy TM, Lin CH. Hydrogen peroxide-induced chilling tolerance in mung beans mediated through ABA-independent glutathione accumulation. Funct Plant Biol. 2003;30(9):955–63. [Google Scholar] [PubMed]
21. Nahar K, Hasanuzzaman M, Rahman A, Alam MM, Mahmud JA, Suzuki T, et al. Polyamines confer salt tolerance in mung bean (Vigna radiata L.) by reducing sodium uptake, improving nutrient homeostasis, antioxidant defense, and methylglyoxal detoxification systems. Front Plant Sci. 2016;7:1104. [Google Scholar] [PubMed]
22. Jiang M, Zhang J. Effect of abscisic acid on active oxygen species, antioxidative defence system and oxidative damage in leaves of maize seedlings. Plant Cell Physiol. 2001;42(11):1265–73. [Google Scholar] [PubMed]
23. Yin L, Wang S, Eltayeb AE, Uddin MI, Yamamoto Y, Tsuji W, et al. Overexpression of dehydroascorbate reductase, but not monodehydroascorbate reductase, confers tolerance to aluminum stress in transgenic tobacco. Planta. 2010;231(3):609–21. [Google Scholar] [PubMed]
24. Kaya C, Ugurlar F, Farooq S, Ashraf M, Alyemeni MN, Ahmad P. Combined application of asparagine and thiourea improves tolerance to lead stress in wheat by modulating AsA-GSH cycle, lead detoxification and nitrogen metabolism. Plant Physiol Biochem. 2022;190:119–32. [Google Scholar] [PubMed]
25. Yao M, Ge W, Zhou Q, Zhou X, Luo M, Zhao Y, et al. Exogenous glutathione alleviates chilling injury in postharvest bell pepper by modulating the ascorbate-glutathione (AsA-GSH) cycle. Food Chem. 2021;352:129458. [Google Scholar] [PubMed]
26. Tiwari RK, Lal MK, Kumar R, Chourasia KN, Naga KC, Kumar D, et al. Mechanistic insights on melatonin-mediated drought stress mitigation in plants. Physiol Plant. 2021;172(2):1212–26. [Google Scholar] [PubMed]
27. Mexal J, Fisher JT, Osteryoung J, Reid CP. Oxygen availability in polyethylene glycol solutions and its implications in plant-water relations. Plant Physiol. 1975;55(1):20–4. [Google Scholar] [PubMed]
28. Yao N, Li L, Feng P, Feng H, Li Liu D, Liu Y, et al. Projections of drought characteristics in China based on a standardized precipitation and evapotranspiration index and multiple GCMs. Sci Total Environ. 2020;704:135245. [Google Scholar] [PubMed]
29. Anjum NA, Sharma P, Gill SS, Hasanuzzaman M, Khan EA, Kachhap K, et al. Catalase and ascorbate peroxidase-representative H2O2-detoxifying heme enzymes in plants. Environ Sci Pollut Res Int. 2016;23(19):19002–29. [Google Scholar] [PubMed]
30. Li Q, Yu B, Gao Y, Dai AH, Bai JG. Cinnamic acid pretreatment mitigates chilling stress of cucumber leaves through altering antioxidant enzyme activity. J Plant Physiol. 2011;168(9):927–34. [Google Scholar] [PubMed]
31. Liu L, Huang L, Sun C, Wang L, Jin C, Lin X. Cross-talk between hydrogen peroxide and nitric oxide during plant development and responses to stress. J Agric Food Chem. 2021;69(33):9485–97. [Google Scholar] [PubMed]
32. Luna CM, Pastori GM, Driscoll S, Groten K, Bernard S, Foyer CH. Drought controls on H2O2 accumulation, catalase (CAT) activity and CAT gene expression in wheat. J Exp Bot. 2005;56(411):417–23. [Google Scholar] [PubMed]
33. Wei L, Wang L, Yang Y, Wang P, Guo T, Kang G. Abscisic acid enhances tolerance of wheat seedlings to drought and regulates transcript levels of genes encoding ascorbate-glutathione biosynthesis. Front Plant Sci. 2015;6:458. [Google Scholar] [PubMed]
34. Villordon AQ, Ginzberg I, Firon N. Root architecture and root and tuber crop productivity. Trends Plant Sci. 2014;19(7):419–25. [Google Scholar] [PubMed]
35. Halder T, Liu H, Chen Y, Yan G, Siddique KHM. Identification of candidate genes for root traits using genotype-phenotype association analysis of near-isogenic lines in hexaploid wheat (Triticum aestivum L.). Int J Mol Sci. 2021;22(7):3579. [Google Scholar] [PubMed]
36. Lynch JP. Harnessing root architecture to address global challenges. Plant J. 2022;109(2):415–31. [Google Scholar] [PubMed]
37. Khan ZI, Ahmad K, Batool F, Wajid K, Mehmood N, Ashfaq A, et al. Evaluation of toxic potential of metals in wheat crop grown in wastewater-contaminated soil in Punjab. Pakistan Environ Sci Pollut Res Int. 2019;26(24):24958–66. [Google Scholar] [PubMed]
38. Shan C, Zhang S, Ou X. The roles of H2S and H2O2 in regulating AsA-GSH cycle in the leaves of wheat seedlings under drought stress. Protoplasma. 2018;255(4):1257–62. [Google Scholar] [PubMed]
39. Agurla S, Gahir S, Munemasa S, Murata Y, Raghavendra AS. Mechanism of stomatal closure in plants exposed to drought and cold stress. Adv Exp Med Biol. 2018;1081:215–32. [Google Scholar] [PubMed]
40. Shan C, Zhou Y, Liu M. Nitric oxide participates in the regulation of the ascorbate-glutathione cycle by exogenous jasmonic acid in the leaves of wheat seedlings under drought stress. Protoplasma. 2015;252(5):1397–405. [Google Scholar] [PubMed]
41. Nahar K, Hasanuzzaman M, Alam MM, Fujita M. Glutathione-induced drought stress tolerance in mung bean: coordinated roles of the antioxidant defence and methylglyoxal detoxification systems. AoB Plants. 2015;7:plv069. [Google Scholar] [PubMed]
Cite This Article
 Copyright © 2024 The Author(s). Published by Tech Science Press.
This work is licensed under a Creative Commons Attribution 4.0 International License , which permits unrestricted use, distribution, and reproduction in any medium, provided the original work is properly cited.
 Downloads
 Citation Tools