
 Submit a Paper
 Propose a Special lssue
 Open Access
ARTICLE

Comparative Study of Genetic Structure and Genetic Diversity between Wild and Cultivated Populations of Taxus cuspidata, Northeast China
School of Science, Liaodong University, Dandong, 118003, China
* Corresponding Author: Yanwen Zhang. Email:
Phyton-International Journal of Experimental Botany 2024, 93(2), 355-369. https://doi.org/10.32604/phyton.2024.047183
Received 28 October 2023; Accepted 11 January 2024; Issue published 27 February 2024
 View Full Text
 Download PDF
Abstract
Taxus cuspidata is a rare plant with important medicinal and ornamental value. Aiming at the obvious differences between wild and cultivated populations of T. cuspidata from Northeast China, a total of 61 samples, that is, 33 wild yews and 28 cultivated yews were used to analyze the differences and correlations of the kinship, genetic diversity, and genetic structure between them by specific length amplified fragment sequencing (SLAF-seq). Finally, 470725 polymorphic SLAF tags and 58622 valid SNP markers were obtained. Phylogenetic analysis showed that 61 samples were classified into 2 clusters: wild populations and cultivated populations, and some wild yews were categorized into the cultivated populations; the genetic diversity analysis showed that the Nei diversity index of wild populations (0.4068) was smaller than that of cultivated populations (0.4414), and the polymorphic information content (PIC) of wild populations (0.2861) was smaller than that of cultivated populations (0.3309). The genetic differentiation analysis showed that the total populations of gene diversity (Ht) of cultivated and wild populations were respectively 0.8159 and 0.5685, the coefficient of gene differentiation (Gst) of cultivated and wild populations was respectively 0.3021 and 0.1068, and the gene flow (Nm) (2.4967) of wild populations was larger than cultivated populations (0.8199). The molecular variance (AMOVA) revealed that inter-population variation accounted for 29.57% of the total genetic variation, while intra-population variation accounted for 70.42% of the total genetic variation (p < 0.001), this suggested that the genetic variation in the T. cuspidata is mainly attributed to within-population factors. In conclusion, the genetic distance between geographical ecological groups of wild populations was generally smaller than that of cultivated populations, and the degree of genetic diversity and genetic differentiation was smaller than that of cultivated populations. As evident, the utilization of SLAF-seq technology enables efficient and accurate development of SNP markers suitable for genetic analysis of T. cuspidata species. These developed SNP markers can provide a molecular foundation for T. cuspidata breeding, construction of genetic maps, variety identification, and association analysis of agronomic traits.Keywords
In agroforestry, the plant populations that grow in the wild without human intervention and possess model species-specific characteristics are generally referred to as wild populations; On the other hand, the populations that have undergone artificial selection and improvement, resulting in obvious trait differentiations, are referred to as cultivated populations [1]. There are significant differences between wild and cultivated populations in terms of morphological characteristics, physiological metabolism, etc., and especially in genetic structure and genetic diversity are significant [2]. For example, wild populations of peanuts possess excellent genes that cultivated populations lack, such as the web blotch resistance gene of Arachis kretschmeri [3], the root-knot nematode resistance gene of Arachis cardenasii, etc. [4]; The genetic distance between wild and cultivated populations of Camellia taliensis are substantial, and population structure analysis reveals that wild populations have a more homogeneous genetic background compared to cultivated populations, but there is also evidence of introgressive hybridization [5]. Armeniaca vulgaris shows significant genetic differentiation and distant genetic relationships between wild and cultivated populations, but introgression hybridization also exists [6]. On the other hand, most studies indicate that wild populations generally exhibit higher genetic diversity compared to cultivated populations. For instance, the genetic relationship between wild and cultivated populations of Hevea brasiliensis is very distant, and the genetic diversity of wild populations is richer than that of cultivated populations [7]. The genetic diversity of wild populations of Carthamus tinctorius is richer than cultivated populations, while the level of genetic differentiation is greater in cultivated populations [8]. Wild populations of Spanish olive (Canarium album) exhibit significantly higher genetic diversity than cultivated populations [9]. However, there have been exceptions found in previous studies as well. For example, there is no significant difference in genetic diversity between wild and cultivated populations of Panax ginseng in East Asia [10], the genetic diversity and differentiation level of wild populations of Astragalus memeranaceus are lower than that of cultivated populations, but there is a greater gene flow within the wild populations compared to the cultivated populations [11]. In conclusion, during the process of domestication from wild populations to cultivated populations, a species may acquire or enhance certain desirable traits, but it may also lose or weaken some potential functional genes, resulting in changes in genetic structure and diversity within the populations [12].
T. cuspidata Sieb. et Zucc belongs to the genus Taxus of the family Taxaceae, it belongs to a typical critically endangered wild plant with an extremely small population. It is mainly distributed in Northeast China, Hokkaido and Kyushu in Japan, Sinuiju in North Korea, Amurskaya Oblas, and the islands of Sakhalin and Kuril in Russia [13]. Wild populations are often scattered in mixed coniferous-broad-leaved forests, with the highest frequency of distribution in forests dominated by Pinus koraiensis, Picea spp., and Abies spp. [14]. Furthermore, ecological factors such as altitude, slope directions, gradient, and slope positions significantly influence the distribution of T. cuspidata populations. They are commonly found in altitudes ranging from 700 to 900 meters, preferentially on shady slopes with slope angles from 15° to 20° [15]. The T. cuspidata is a dioecious species with low fruiting rates. Its seeds undergo physiological post-maturation and are dispersed by wind. The yew contains paclitaxel in its branches and leaves, which can be used to treat various cancers, and it is also a precious tree species for garden landscaping in East Asian countries [16]. However, due to excessive logging for paclitaxel extraction and utilization, the natural populations of the T. cuspidata have been severely disturbed and destroyed by human activities, leading to a continuous decline in population stability, reduction in suitable distribution areas, and it has now become a first-class protected endangered plant in China.
T. cuspidata and its variants of T. cuspidata var. nana (Japanese yew) are located in Northeast China, as well as Japan and Korea with a long cultivation history, the origin of cultivated species is complex, including Japanese yew, and its hybrids (CH) with wild T. cuspidata, and even its genes infiltrated from other Taxus species may be involved, so the morphological variation in tree shape, leaf color, leaf length, fruit color, and other morphological variations are richer than that of wild populations [17,18]; Golden leaf yew is a leaf color variant derived from three strains, namely wild T. cuspidata, Japanese yew, and Korean yew. Now gradually formed nearly 20 cultivated species (Table 1) [16]. However, scientific identification of all the cultivated varieties and analysis of the genetic relationship among different types of variations are still lacking. Furthermore, there have been no reports on the systematic evolutionary analysis of wild and cultivated populations, as well as studies on genetic structural differences and correlations of T. cuspidata. As a result, research on the conservation of T. cuspidata resources, genetic improvement, and breeding has always lagged.
We speculate that although there is some geographic isolation among individuals in the wild populations, the wind-mediated gene flow from cross-pollination in sexual reproduction leads to a relatively simple genetic structure and lower genetic diversity among populations. In contrast, cultivated populations, which mainly reproduce through vegetative propagation to maintain desirable traits, have a higher genetic diversity due to a wider range of sources, and their genetic structure may be more complex. Therefore, this study focused on 61 samples of T. cuspidata in Northeast China, the SLAF-seq technique was used to uncover how intense artificial selection and long-term domestication have led to higher levels of genetic diversity and genetic differentiation in cultivated populations compared to wild populations, aiming to clarify the genetic background, kinship, and differences in genetic structure between them. This will provide important evidence for determining and guiding the introduction or hybridization between them in the breeding process. It will also serve as a genetic basis for establishing core local germplasm preservation populations, quality identification, and the cultivation of new varieties and strains of T. cuspidata.
2.1 Plant Materials and Collection Sites
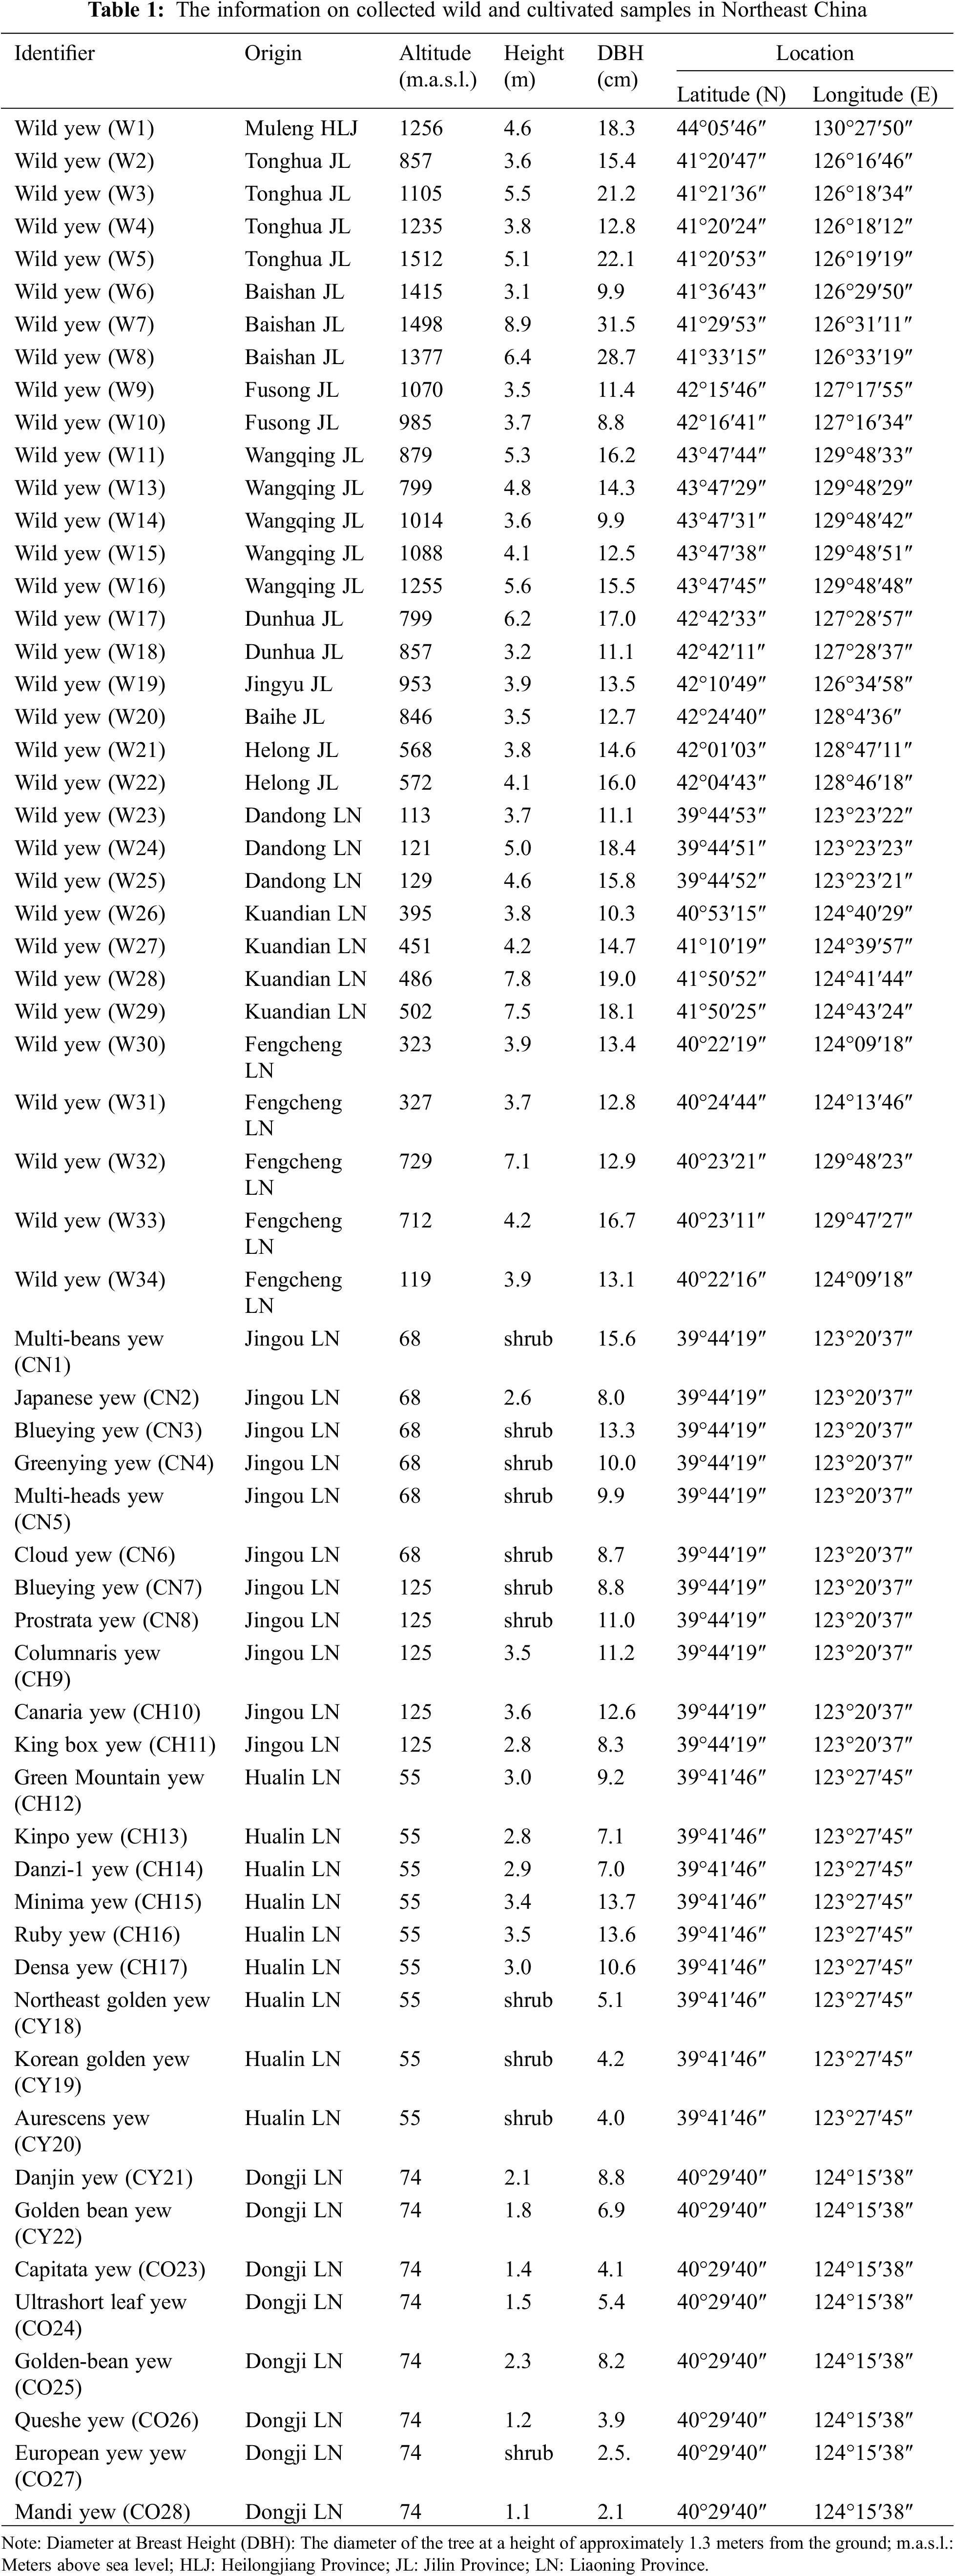
Wild population materials (W) were collected from multiple natural distribution areas of T. cuspidata in Northeast China from 2020 to 2022, including Dandong and Kuandian in Liaoning Province, Tonghua, Baishan, Fusong, Wangqing, Dunhua, Panshi, Jingyu, Baihe, and Hualong in Jilin Province, and Muleng in Heilongjiang Province, China (Fig. 1). The samples were obtained from fresh leaves of mature plants. To ensure genetic heterogeneity, the distance between individuals was generally more than 100 meters. A total of 33 samples were collected from the wild population. The cultivated population samples were collected from several large-scale plantations of T. cuspidata in Dandong, Liaoning Province, and other locations. These samples included Japanese yew (CN), hybrid forms (CH), golden leaf varieties (GY), and other varieties (CO), with a total of 28 individual samples. For specific information, please refer to Table 1.
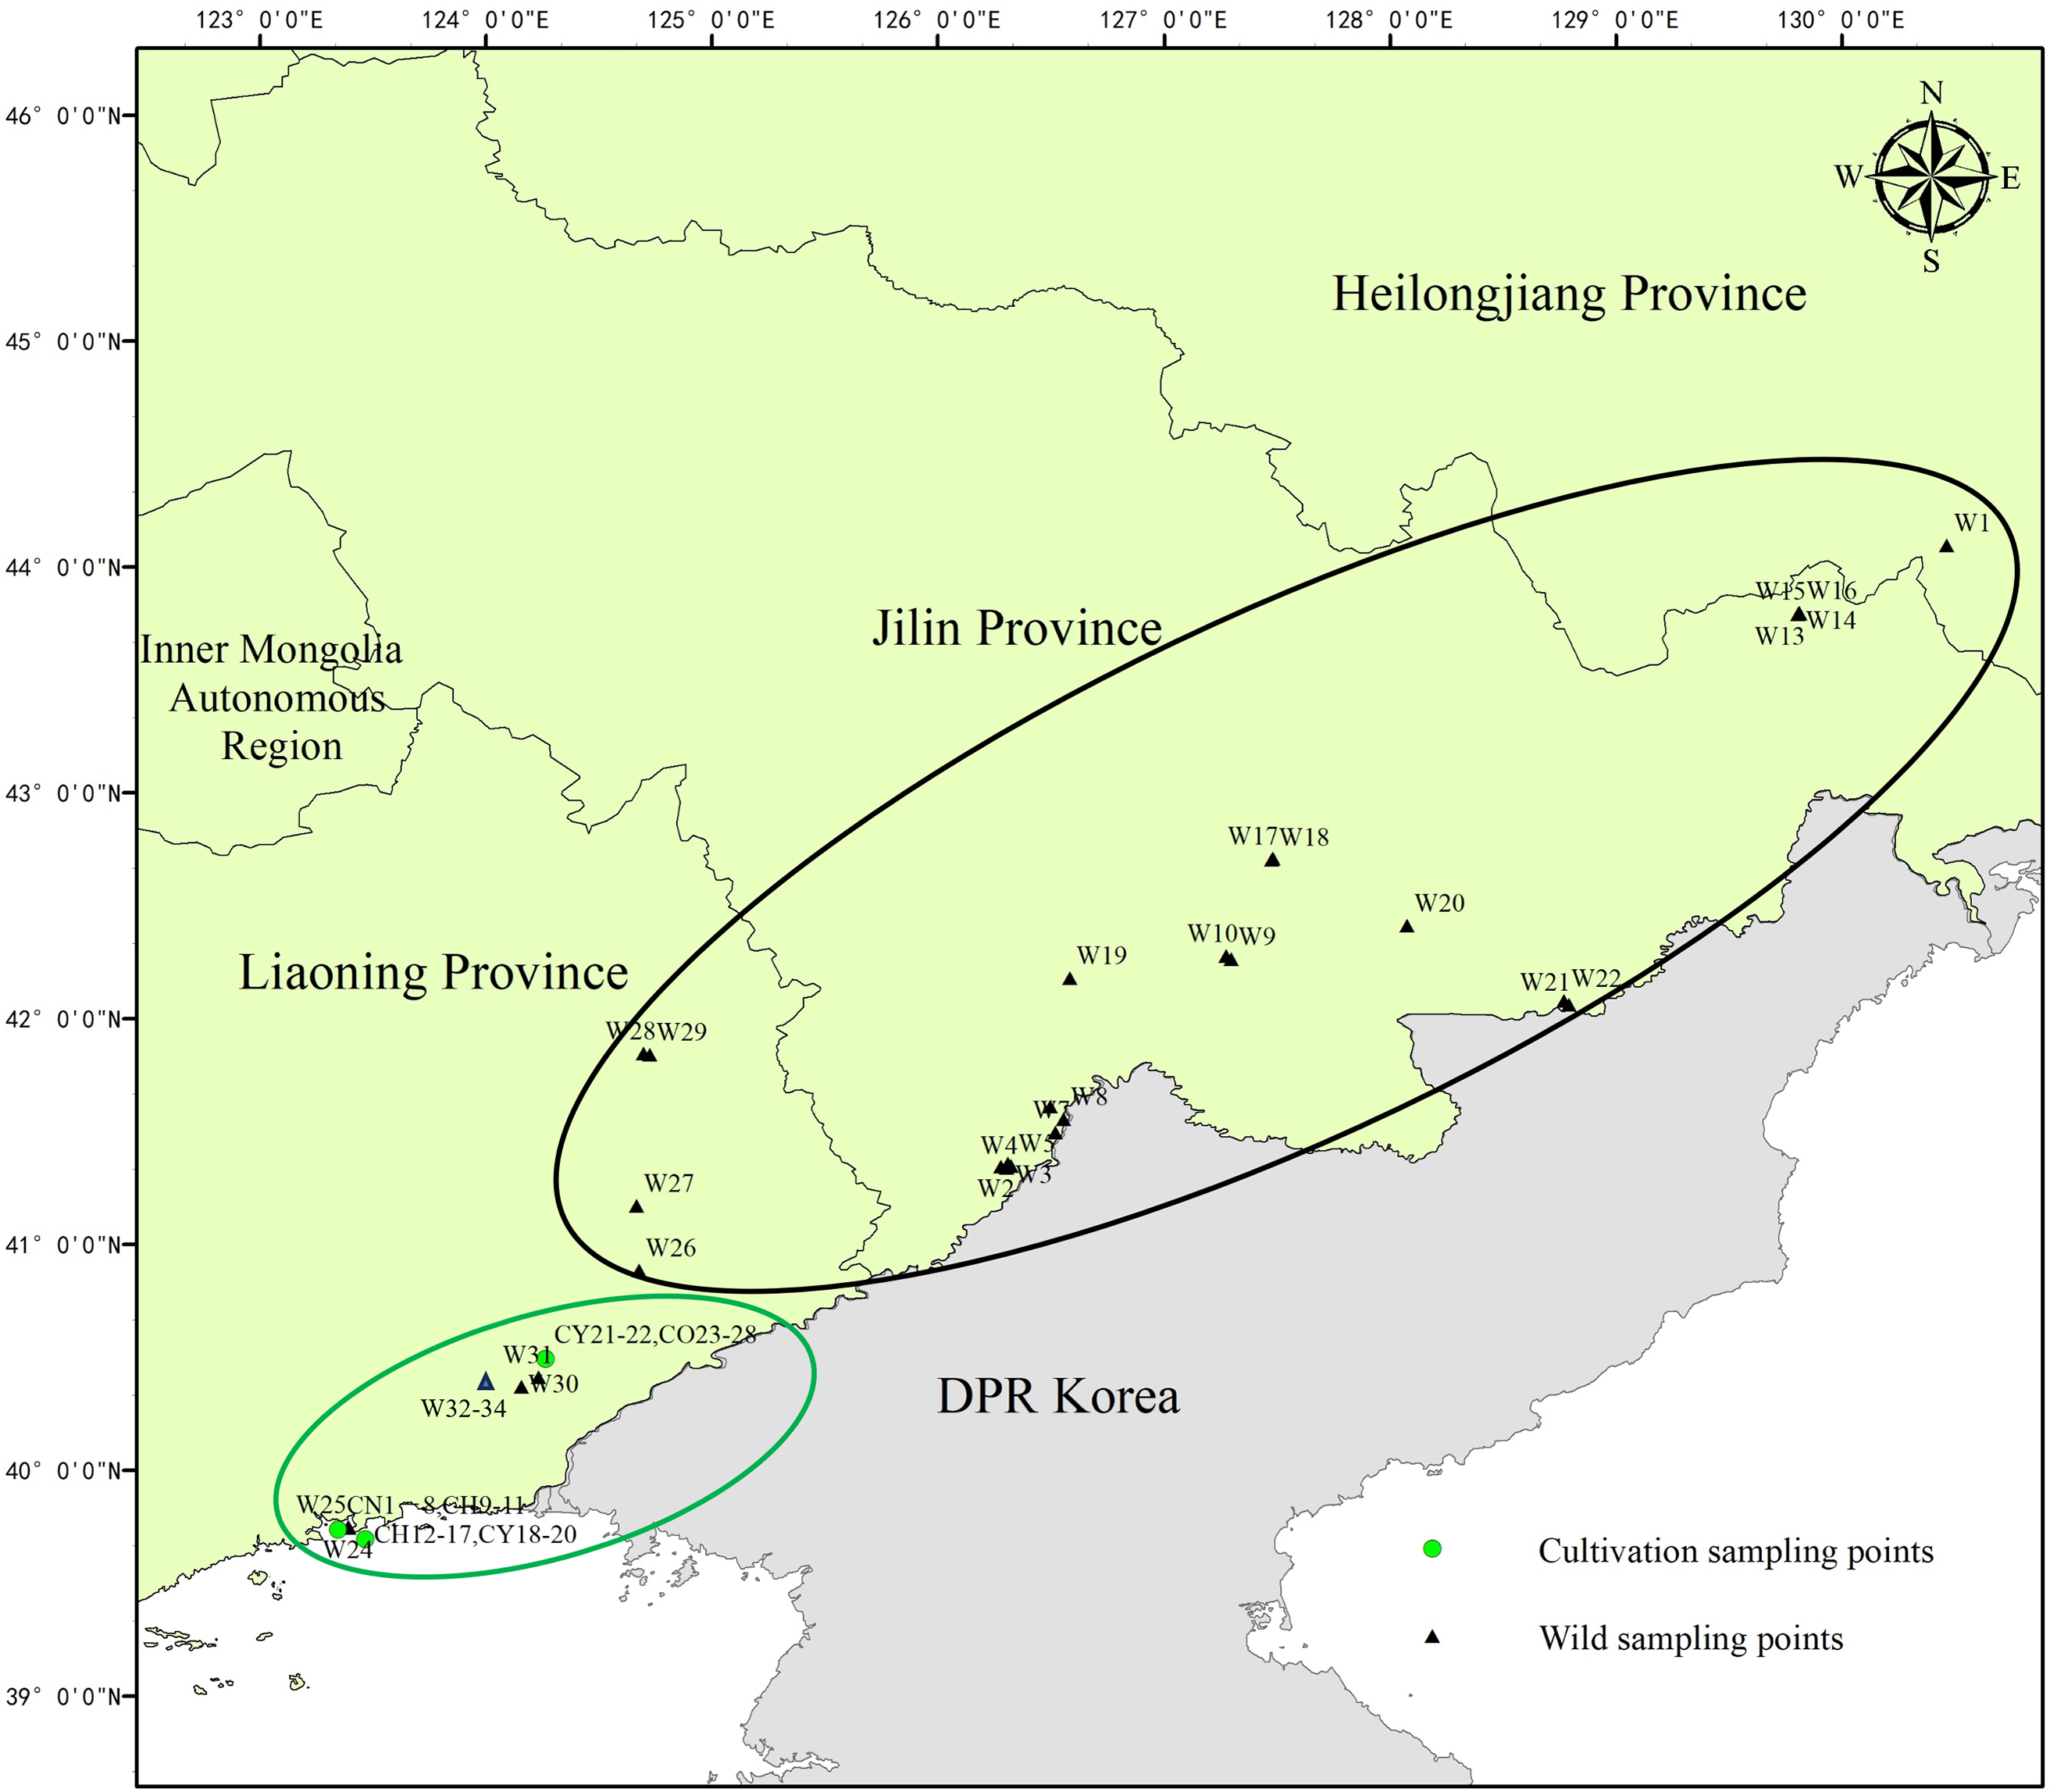
Figure 1: Geographic distribution area of the sampled T. cuspidata. The black range represents the wild population, while the green range represents the cultivated population
2.2 Genomic DNA Extraction and Quality Control
Genomic DNA was extracted from the leaves of 61 samples using a modified CTAB method [19]. Genomic DNA was diluted to 75–100 ng, and DNA concentration was measured with a NanoDrop-1000 spectrophotometer (NanoDrop, Wilmington, DE, USA), and DNA quality was determined by electrophoresis in 1.0% agarose gels using λ DNA as a standard. To prevent false positive reads, the sequence error rate was estimated using the data from rice as a control. The ratio of high-quality reads with quality scores greater than Q30 (indicating a 0.1% chance of an error, i.e., 99.9% confidence) in the raw reads and guanine-cytosine (GC) content were calculated for quality control.
2.3 SLAF Library Construction and High-Throughput Sequencing
Based on phylogenetic similarity, the T. chinensis genome, whose sequence was publicly available (https://www.ncbi.nlm.nih.gov/assembly/GCA_019776745.2), was used as reference genome with a genome size of 10.23 Gb and a GC content of 34.79%. SLAF-predict software independently developed by Biomarker Technologies Corporation was used to predict the enzyme digestion by the reference genome, and the genomic DNA from each qualified sample was digested separately according to the selected optimal enzyme digestion scheme. After enzyme digestion, the digested fragments were added a single nucleotide (A) using Klenow Fragment (3′→5′ exo-) (NEB) and dATP at 37°C, an A-tail was added to the 3’ ends of the resulting fragments (274–324 bp in length), and duplex tag-labeled sequencing adapters were ligated to the A-tailed fragments with T4 DNA ligase. After PCR amplification and screening, the adaptor-filtered reads were used for SLAF library construction [20]. Finally, SLAFs were sequenced on an Illumina HiSeqTM2500 (Illumina, Inc., San Diego, CA, USA) sequencing platform at Biomarker Technologies Corporation in Beijing (https://www.bmkgene.com/).
The original sequencing data were filtered before analysis to ensure the quality of the information analysis. To check the reliability of this approach and SLAF library construction quality, raw sequencing data were identified using Dual-index sequencing to obtain the reads for each sample [21]. After filtering the adaptors of the sequencing reads, the sequencing quality and data quantity were evaluated, namely, the number of reads, GC content, and Q30 data. And rice (Oryza sativa L. ssp. japonica) (http://rice.plantbiology.msu.edul) genome sequencing data constituted a control library for the evaluation of the accuracy of the SLAF library construction [22,23].
2.5 SLAF Tags and SNP Markers Development
Low-quality reads (quality scores <30) were filtered out and a pipeline combining Burrows-Wheeler Aligner (BWA) [24]. Two SNP development programs: genome analysis toolkit (GATK) [25] and sequence alignment/map tool (SAM) [26] were used to develop and identify SNPs, and the “Unified Genotyper” function of GATK was used for variant calling, the sequencing results were aligned with the rice reference genome using BWA. And their intersection was merged as the candidate SNP dataset. Only biallelic SNPs were retained as the final SNP dataset. The SNPs were then filtered according to the following criteria: minor allele frequency (MAF) ≥ 0.05 and integrity > 0.5. Finally, the SNPs were validated for wild and cultivated samples using custom TaqMan® genotyping assays (Thermo Fisher Scientific, Waltham, MA, USA). TaqMan® MGB probes and primer sets were designed using the Custom TaqMan® Assay Design Tool (Thermo Fisher Scientific). The genotyping assays were performed using Applied Biosystems® StepOne™ Real-Time PCR system (Thermo Fisher Scientific).
2.6 Genetic Structure and Kinship Analysis
The phylogenetic tree of 61 samples was constructed using MEGA X software [27], based on the Neighbor-joining method with the Kimura 2-parameter model, bootstrap was repeated 1000 times to analyze their affinities. Admixture software was used to analyze the population structure [28]. The number of subpopulations (K value) was preset from 1 to 10 for clustering and cross-validation, and the optimal number of subpopulations was determined according to the valley value of the cross-validation error rate. Principal component analysis (PCA) was performed using EIGENSOFT software [29]. The interpopulation genetic differentiation coefficient (Fst) between populations was calculated using Arlequin software [30] to assess the degree of population genetic differentiation.
3.1 Analysis of SLAF-Seq Data and SNP Markers
In this study, we first constructed an SLAF-seq library for 61 samples. The SLAF library was constructed and eventually, the HinCII enzyme (New England Biolabs, USA) was selected to digest the genome of T. cuspidata. The efficiency of HinCII digestion was 98.39%, and the proportion of residual enzymatic sites was 1.61%. The efficiency of double-end comparison was 83.25%, the efficiency of single-end comparison was 0.57%, and the efficiency of non-comparison was 16.18%. Consequently, the digestion scheme was feasible, and the SLAF library construction was robust. The high-throughput sequencing of the SLAF libraries yielded a total of 54.61 GB of raw reads consisting of 240.55 Mb double-end reads generated from 61 samples, reads for each sample varied from 1154031–6941267, of which the smallest amount of data was obtained by the CN8 with 1154031 reads, and the W29 obtained the largest amount of data with 6941267 reads; the average Q30 of sequencing in this study was 94.72%, and the average GC content was 37.97%. the Q30 data indicated the high quality of sequencing and reliable sequencing results.
For the 61 samples, a total of 1788524 SLAF tags were obtained, of which 470725 SLAF tags with polymorphisms. A total of 3084611 population SNPs were developed, with the number of SNPs in each sample ranging from 343838 to 1982805, and 58622 valid SNPs were validated for wild and cultivated samples. The completeness of these SNPs was 5.82%–19.82%, and the heterozygosity ranged from 11.14% to 64.28%. In summary, the valid SNPs can be used for subsequent analysis of genetic evolution.
The phylogenetic tree showed that 61 samples were categorized into two clusters (Fig. 2), the cluster I was the wild population of T. cuspidata, including 21 wild samples, i.e., W1, W4, W8, W9, W10, W11, W13, W14, W15, W16, W17, W18, W19, W20, W21, W22, W26, W27, W30, W31, W32, and 1 cultivated individual CY21. Cluster II included 27 cultivated individuals, that was, CN samples (8), CH samples (9), CY samples (4), CO samples (6), and 12 wild individuals, i.e., W3, W7, W2, W33, W28, W29, W34, W5, W6, W23, W24, W25.
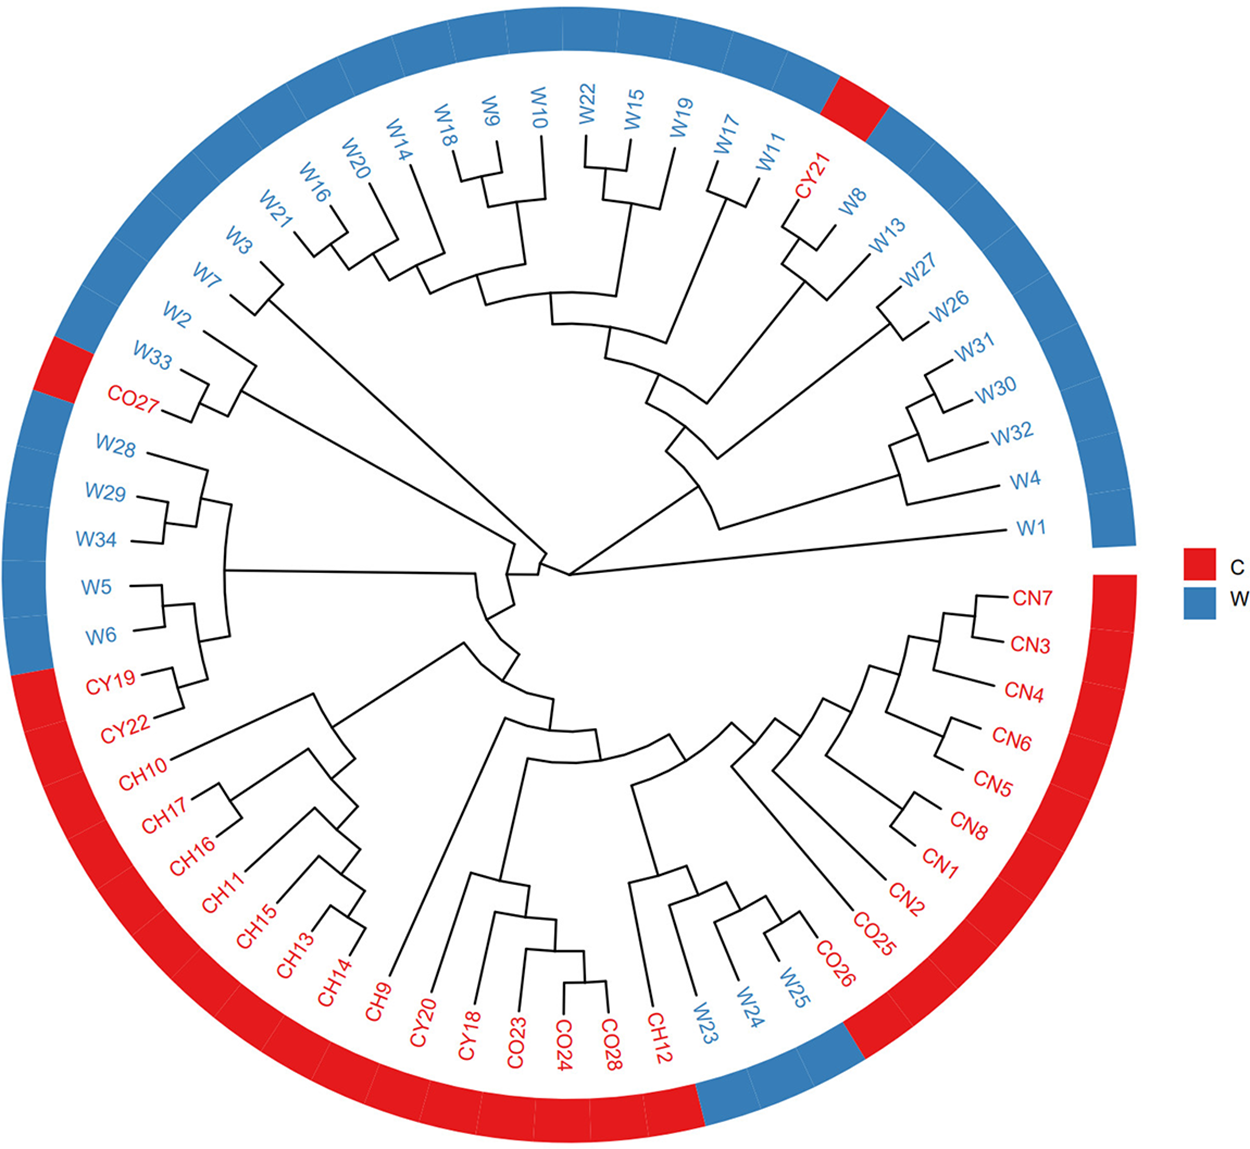
Figure 2: Polygenetic thee of 61 samples of T. cuspidata based on SNPs
To determine the population structure of T. cuspidata, the Bayesian clustering analysis using Structure software was performed (Fig. 3). The Delta K results indicated that the optimal number of genetic clusters representing the most similar ancestral populations was at K = 2, The cross-validation error rate (CV error) was lowest at this value, suggesting that the 61 samples of T. cuspidata can be divided into two clusters: wild population and cultivated population, which revealed that the genetic differentiation between wild and cultivated populations is evident. It can be seen that individuals from different origins might have originated from two ancestors, which is consistent with the results of phylogenetic tree analysis.
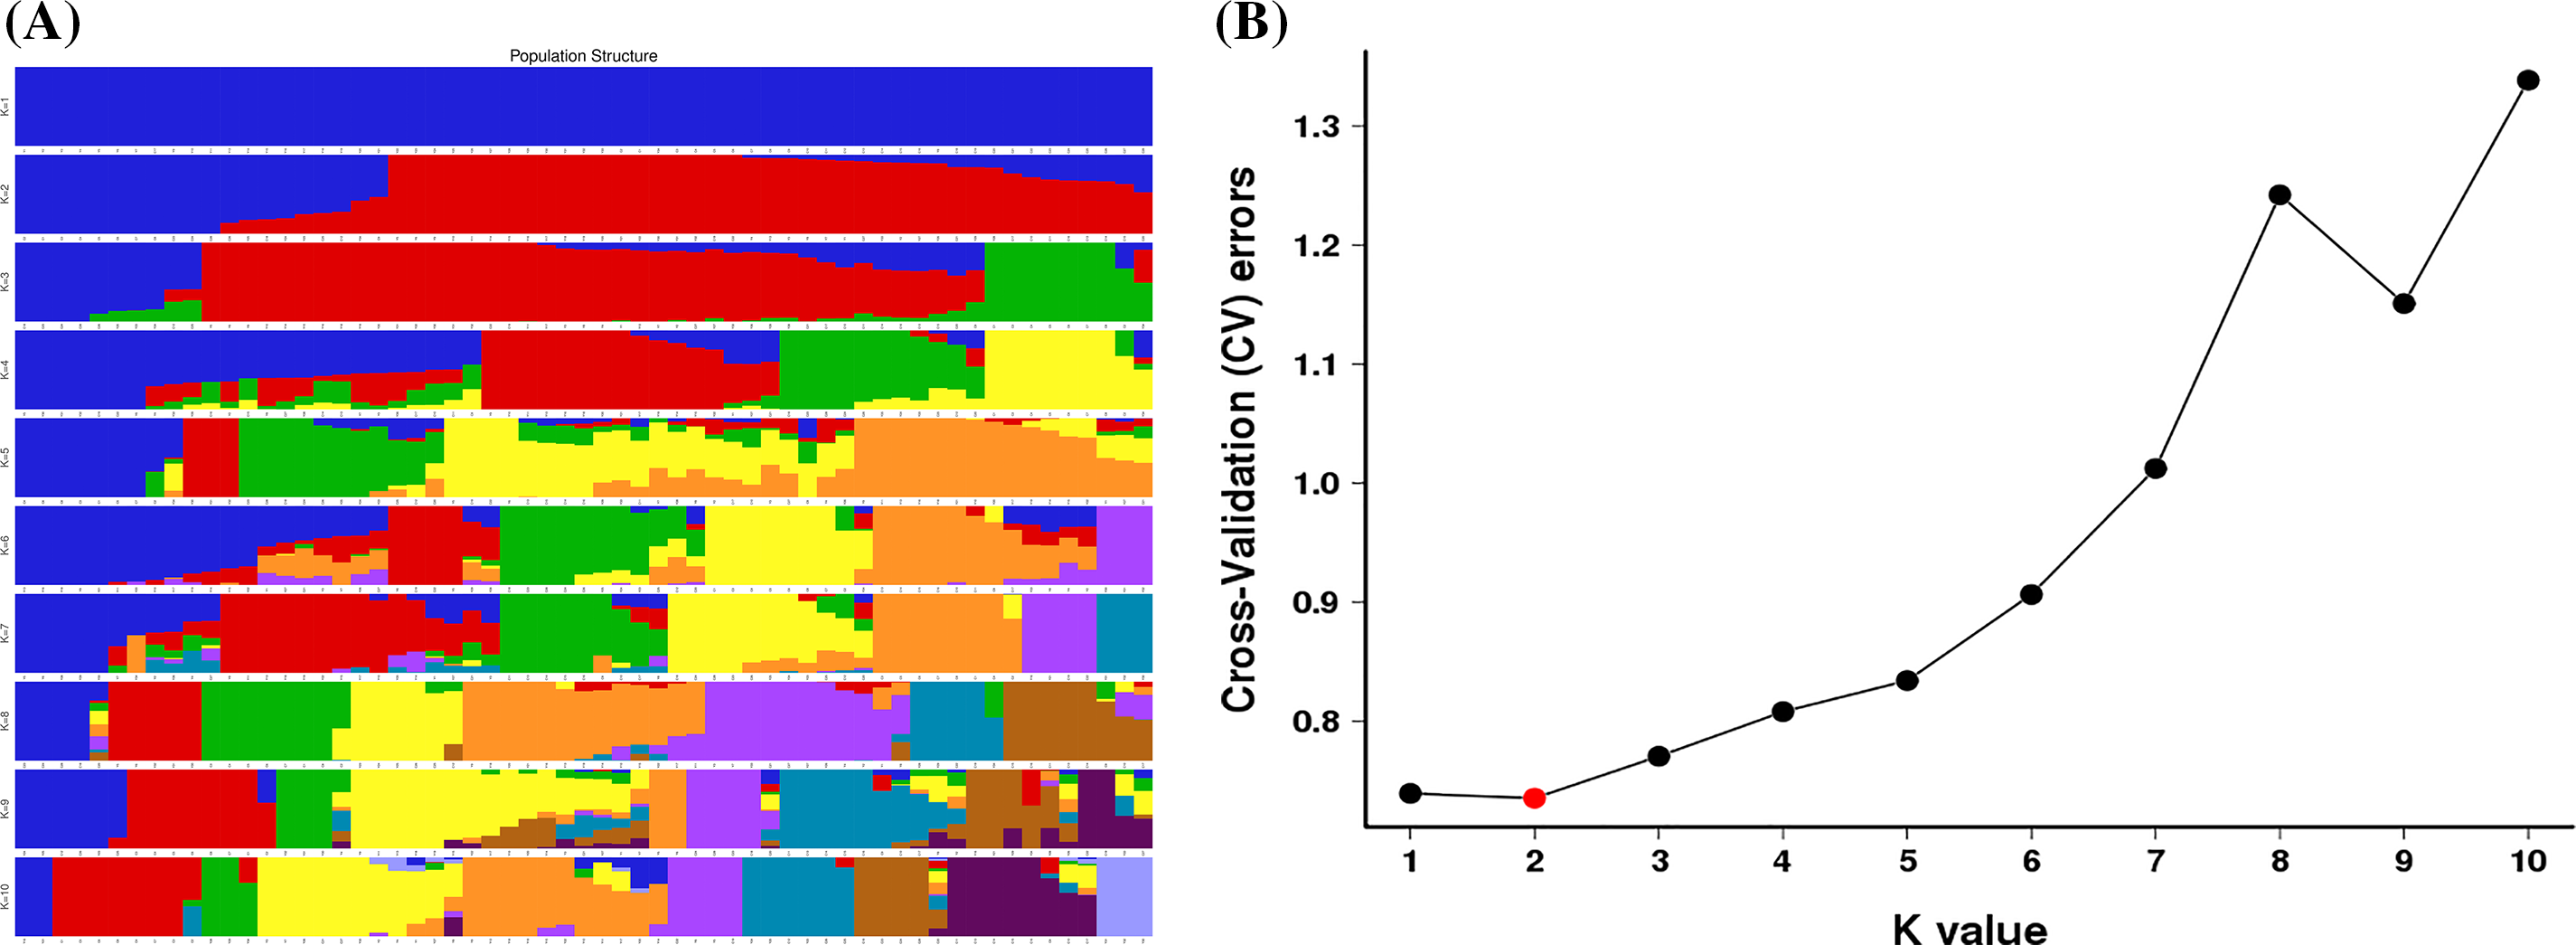
Figure 3: Admixture of the 61 samples cluster values corresponding to each K value (A) and validation error rate corresponding to the different K value (B)
3.4 Principal Components Analysis (PCA)
The PCA results revealed (Fig. 4) that 61 samples of T. cuspidata were differentiated into two clusters in the three-dimensional space (PCA1, PCA2, PCA3). Specifically, the majority of the wild individuals and cultivated individuals exhibited a clear separation trend. Most of the wild individuals were distributed on the right side of the principal component axes and were closely clustered together. These results are consistent with the population genetic structure and clustering analysis.
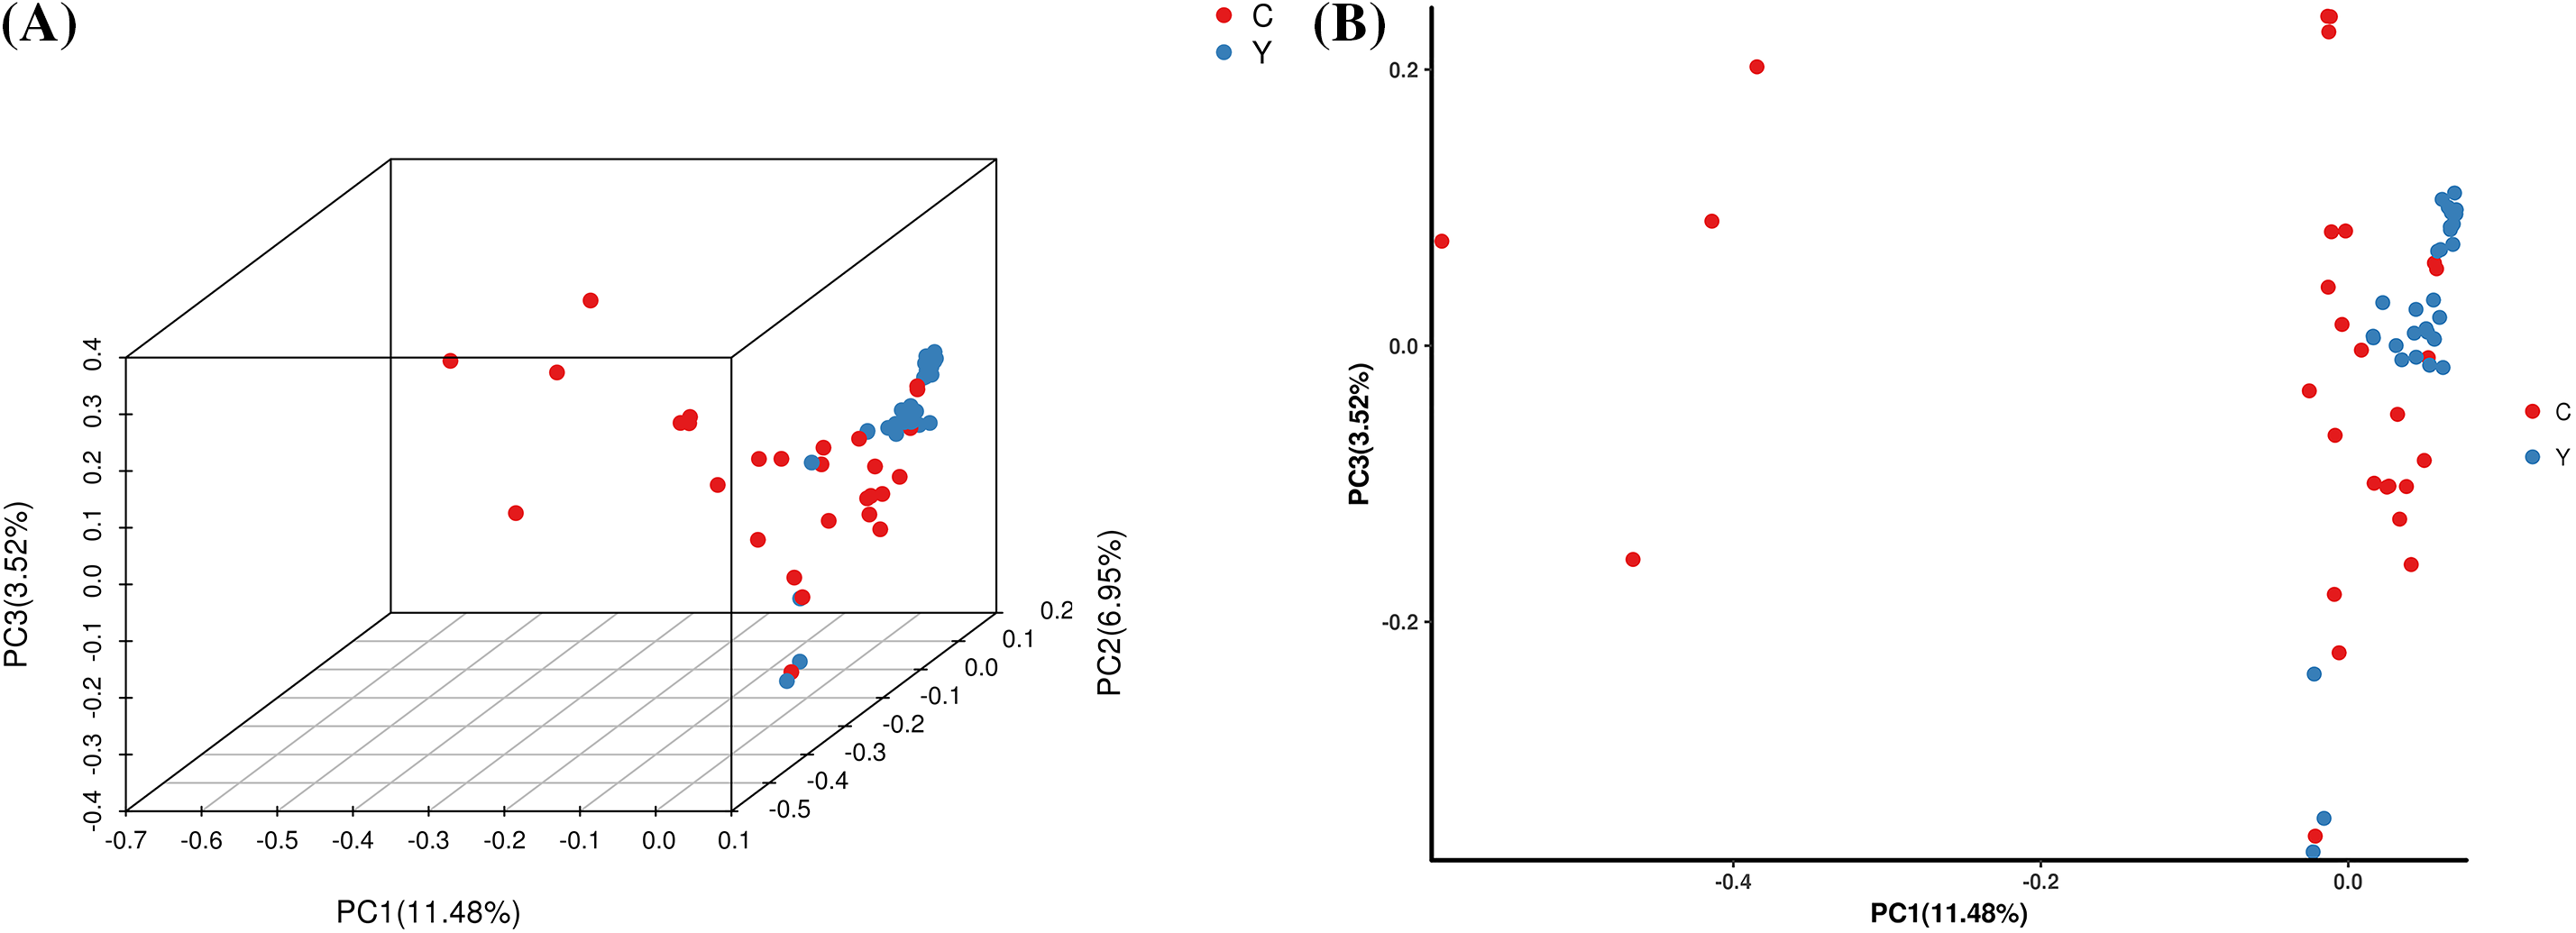
Figure 4: PCA three-dimensional cluster diagram (A) and two-dimensional cluster diagram (B) of each sample. A point represents a sample. Y represents wild populations of T. cuspidate; C represents cultivated populations of T. cuspidate
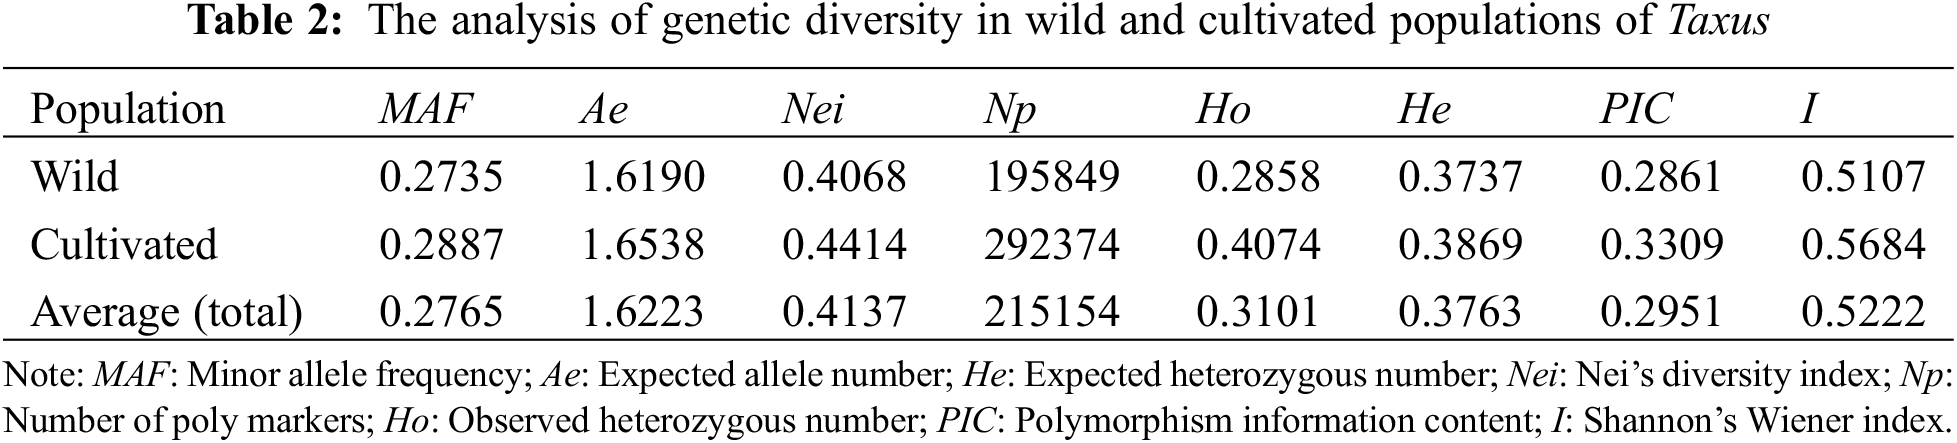
3.5 Genetic Diversity and Differentiation
Genetic diversity analysis revealed that (Table 2) the total Nei diversity index of the 61 samples was 0.4137, with the wild population (0.4068) having a lower Nei diversity index than the cultivated population (0.4414). The total PIC was 0.2951, with the wild population (0.2861) showing lower levels of PIC than the cultivated population (0.3309).
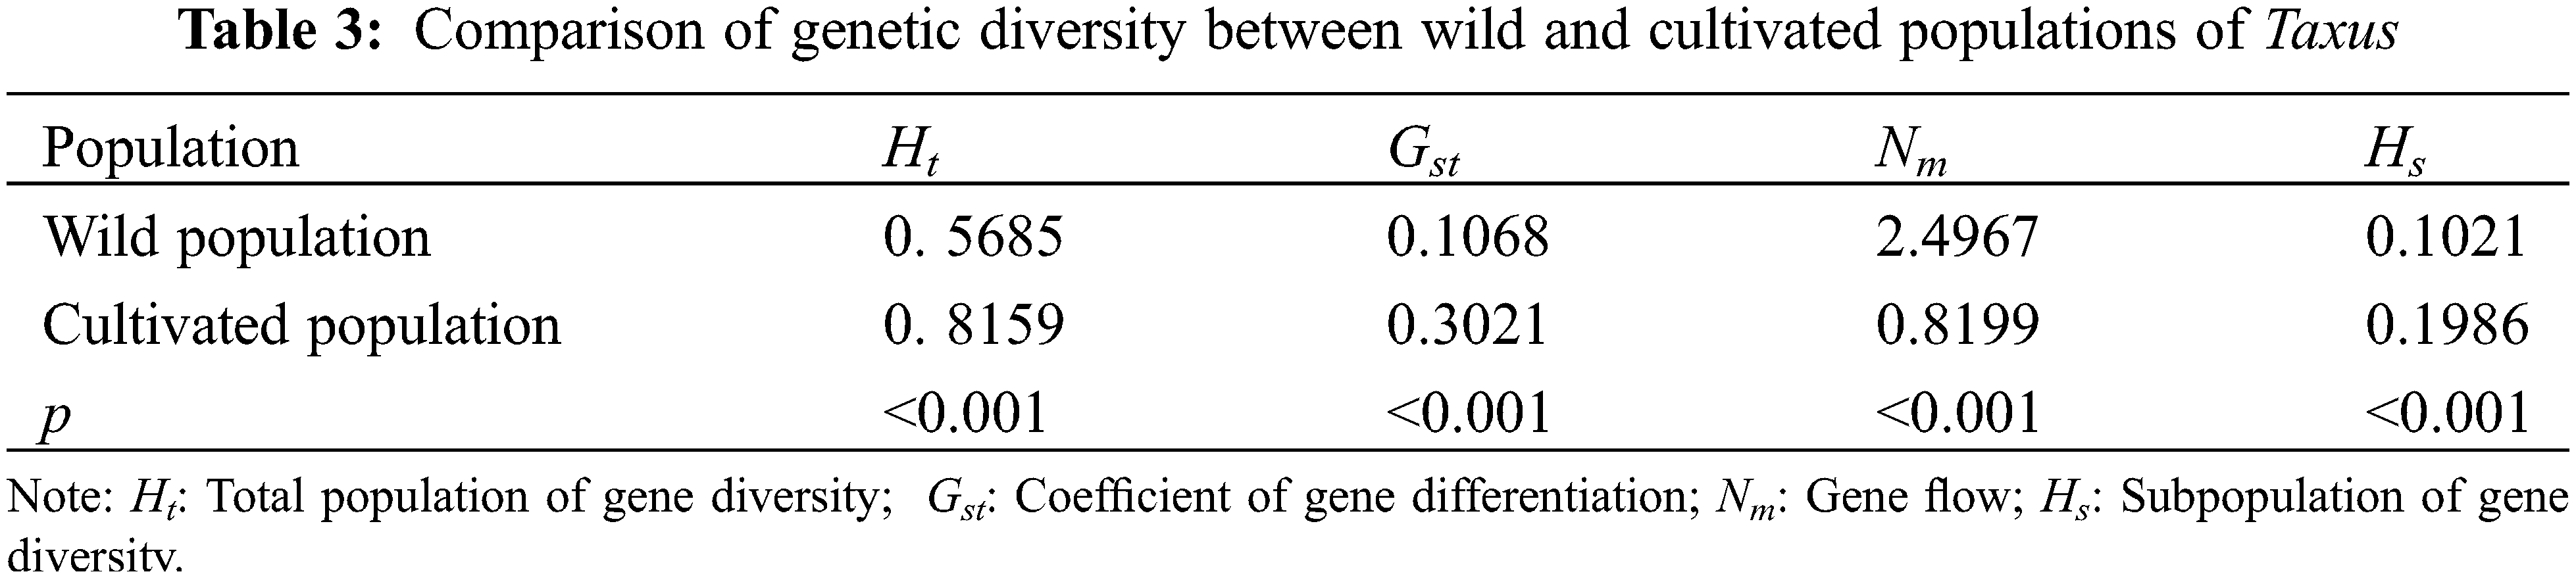
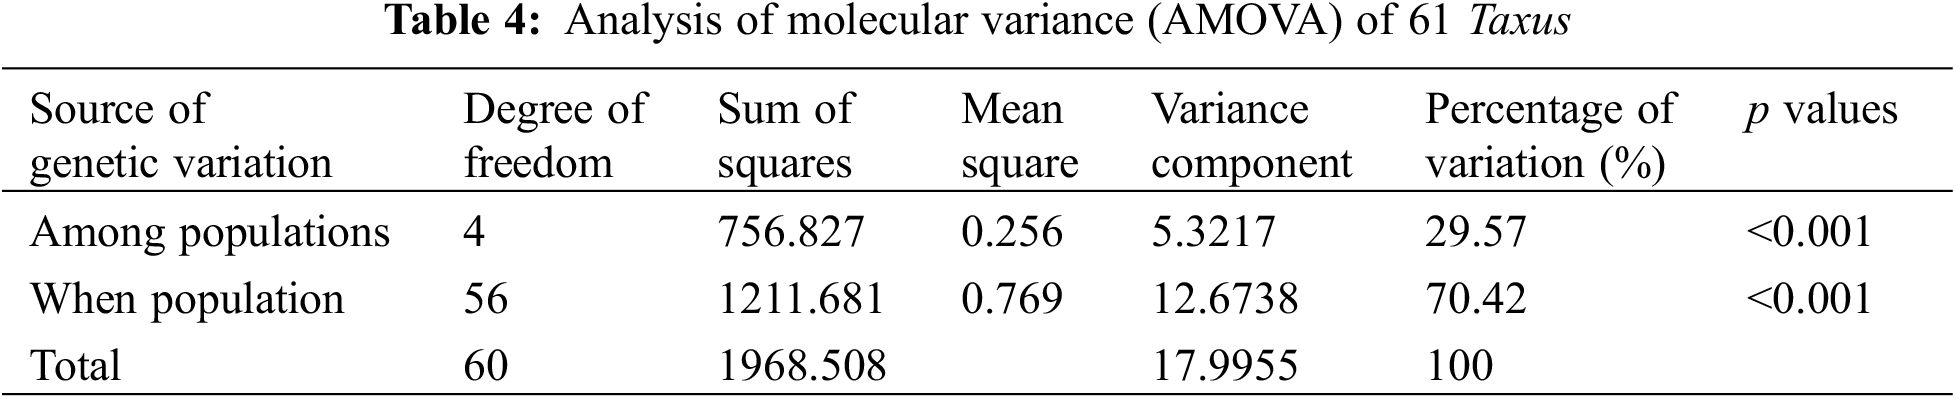
Genetic differentiation analysis revealed (Table 3) that the total population heterozygosity (Ht) of cultivated and wild populations were 0.8159 and 0.5685, respectively. The subpopulation heterozygosity (Hs) was 0.1986 and 0.1021, respectively. The genetic differentiation coefficient (Gst) of cultivated and wild populations were 0.3021 and 0.1068, respectively. The gene flow (Nm) of wild populations was Nm 2.4967 > 1, indicating frequent gene exchange and lower genetic differentiation. while the cultivated species Nm was 0.8199 < 1, indicating limited gene exchange and higher genetic differentiation. These results suggest that the level of genetic differentiation is significantly lower in the wild population compared to the cultivated population, in which the indicators of the genetic structure of the wild populations were similar to that of the wild T. cuspidata in the Changbai Mountains [31]. Further analysis of molecular variance (AMOVA) revealed that inter-population variation accounted for 29.57% of the total genetic variation, while intra-population variation accounted for 70.42% of the total genetic variation (p < 0.001). This suggests that the genetic variation in the T. cuspidata populations is mainly attributed to within-population factors (Table 4).
4.1 The Genetic Distance between Wild and Cultivated Populations
The genetic distances between geographic ecological groups of wild species are generally smaller than those of cultivated species. Furthermore, the genetic relationships between the two populations are all closely related to the geographical distribution and ecological conditions. W1 is from Muleng, Heilongjiang, which is distantly related to individuals from the Changbai Mountains of Jilin and Liaoning due to geographic isolation, and forms its group; W23, W24, and W25 are arborvitae-type plants from Jinjiang Mountain Park in Dandong City, which are more closely related to the Japanese yews, it is speculated that these century-old trees may have originated from Japan or the Korean Peninsula, and introduced into the Northeast region together with these Japanese yews. The genetic distance among the CN strain is close. of which CN2 is a tree grown from a seedling and shows significant genetic differences from other vegetatively propagated Japanese yews. CN8 is a native plant derived from Japan a hundred years ago, and its leaves are longer than CN1, it is speculated that CN1 was derived from a bud mutation of CN8 through artificial cutting or grafting; the CH strain is speculated to be a hybrid species between wild T. cuspidata and Japanese yew, the morphological characteristics of some hybrids were inclined to the wild T. cuspidata, while others were inclined to the Japanese yew, but most of them fall in between. To verify the occurrence of the CH strain, our research team crossed CH11 and CH12 with Japanese yew as the maternal parent and wild T. cuspidata as the paternal parent, CH11 is a hybrid species, while CH12 is an individual that has not undergone hybridization, which is closely related to the Japanese Yew; CY21 is a variant of the wild T. cuspidata called Northeastern golden yew, which derives from the Changbai Mountains. Therefore, it is closely related to them. CY18 and CY20 are derived from Japan and Korea, respectively, and they are very closely related or possibly the same species. As for the CO strain, due to its diverse sampling, they distributed relatively distant and dispersed, especially containing genes from other species, so the genetic relationships were far away from each other.
4.2 The Genetic Diversity between Wild and Cultivated Populations
The genetic diversity of the cultivated populations is significantly higher than that of the wild populations at the whole genome level, resulting in the number of wild populations being much smaller than that of the cultivated populations, which is consistent with the results of the studies on rice [32,33], barley [34], and soybean [35], etc. The speculated reasons for this are as follows: Firstly, yew is a sessile plant and cannot migrate freely; they can only exchange genes through pollen or seed dispersal. Additionally, the low reproduction rate and survival rate of the T. cuspidata populations result in poor population competitiveness. Secondly, because of excessive human logging activities, natural selection, and environmental factors, etc., the wild populations have experienced habitat fragmentation, namely the integral continuous habitat of wild populations has transformed into multiple heterogeneous small groups during the evolution process, that is, the geographic distribution among groups is distant and the distribution ranges are gradually shrinking. This leads to a decline in gene flow and population size, and subsequently a decrease in the genetic diversity of wild populations [36]. However, the cultivated population has a complex origin. firstly, some species of cultivated populations derived from variants of different wild T. cuspidata, for example, the early Japanese yew introduced from Japan only retained a portion of the genetic information from the wild Japanese Yew after domestication. Secondly, a series of genetically variable traits are produced during the process of intense artificial selection and long-term domestication, these variants are mainly retained and expanded breeding through nutrient propagation, leading to rich genetic diversity. in production, mutated buds and their growing branches are commonly selected to cultivate new varieties through vegetative propagation. that is, the degree of genetic variation in cultivated populations increased due to bud mutation selection, resulting in a higher level of genetic diversity compared to the wild population.
4.3 The Genetic Differentiation between Wild and Cultivated Populations
The wild population exhibits significantly less genetic differentiation compared to the cultivated population, which is consistent with the genetic differentiation patterns observed in domesticated species of soybeans [37], rice [35], barley [38], etc. In wild populations, sexual reproduction to produce seeds was achieved by wind-mediated pollination [39], whereas in cultivated populations, breeders always tend to adopt vegetative propagation methods to preserve and propagate individuals with the dominant mutants or bud variations. As a result, there is significant genetic differentiation among different varieties, which phenomenon is also observed in some other cultivated plants. Secondly, human intervention has led to distinct differences in the habitats of cultivated and wild populations, resulting in different natural selection pressures, further enhancing the genetic differentiation between the two populations. On one hand, the smaller size of cultivated populations or the modern closed pure-breeding mode of the cultivated population leads to different degrees of genetic differentiation, which implies that the wild populations have higher flexibility compared to the cultivated populations and possess a greater resistance to inbreeding depression. On the other hand, the dominant variation traits or individuals that meet human needs are selected by humans, developing beneficial variations in a direction favorable to humans. Compared to natural selection, artificial selection is more efficient, thereby increasing the genetic diversity of cultivated species. However, the cluster analysis reveals that some wild individuals are clustered into the cultivated populations, indicating these “wild” germplasms contain domesticated alleles, which may be the introgression of genes from the cultivated species or the variation of the common ancestor, it reveals that many cultivated species has evolved from ancient wild species through domestication which has led to differentiation during adaptation to the local wild environment. This indicates that both the cultivated and wild populations exhibit allelic variants that are specific to their respective populations, similar to the genetic differentiation patterns observed in wild rice (Oryza rufipogon) and Asian cultivated rice [1].
Analyzing the differences and correlations in the kinship, genetic diversity, and genetic structure between different populations of T. cuspidata can determine its genetic evolutionary relationships, thereby providing a genetic basis for the conservation, breeding, and propagation of T. cuspidata genetic resources [40]. The wild and cultivated populations of T. cuspidata preserve extremely valuable genetic resources [41]. However, the wild population is critically endangered, and its permanent loss will entail the disappearance of the unique genetic resources associated with this species. Therefore, the conservation of genetic diversity in wild populations is of utmost importance. The hybrid improvement of cultivated populations and the conservation of genetic diversity are two complementary aspects. Hence, in future research, it is essential to study and explore the important issue of balancing hybrid improvement in the cultivated population with the conservation of germplasm resources [42]. Additionally, the assessment of the distribution patterns and evolutionary characteristics of genetic diversity in T. cuspidata varieties should emphasize the conservation of genetic diversity in wild resources. In terms of future breeding, greater efforts should be made to explore and utilize the wild resources of T. cuspidata, increase gene exchange between cultivated and wild populations, introduce advantageous genes from wild T. cuspidata into cultivated populations through hybridization, and enhance the genetic diversity of cultivated populations. This can improve the quality of germplasm resources, such as growth rate, appearance, and stress resistance. These endeavors will provide a genetic basis for establishing core conservation populations of T. cuspidata [43], conducting quality identification, and breeding new varieties and strains.
Acknowledgement: We thank Huang Sheng-Jun, Sun Qi, and Wu Lei for their assistance in the field.
Funding Statement: This work was supported by Grants from the National Science Foundation of China to Yanwen Zhang (32272757, 31972363); Grants from the Liaoning Provincial Department of Education Project to Dandan Wang (JYTMS20230698); Grants from the Liaoning Provincial Science and Technology Fund Project: Comparative Multi-Omics Study of Wild and Cultivated Species of Taxus chinensis.
Author Contributions: Dandan Wang, Xiaohong Li performed the experiments and data analysis. Dandan Wang drew the figures and wrote sections of the manuscript. Yanwen Zhang contributed to conceiving and designing the experiments.
Availability of Data and Materials: All data included in this study are available upon request by contact with Dandan Wang.
Ethics Approval: Not applicable.
Conflicts of Interest: The authors declared that they have no conflicts of interest to report regarding the present study.
References
1. Wang H, Vieira FG, Crawford JE, Chu C, Nielsen R. Asian wild rice is a hybrid swarm with extensive gene flow and feralization from domesticated rice. Genome Res. 2017;27:1029–38. [Google Scholar] [PubMed]
2. Roucou A, Violle C, Fort F, Roumet P, Ecarnot M, Vile D. Shifts in plant functional strategies over the course of wheat domestication. J Appl Ecol. 2018;55:25–37. [Google Scholar]
3. Mallikarjuna N, Hoisington D. Peanut improvement: production of fertile hybrids and backcross progeny between Arachis hypogaea and A. kretschmeri. Food Secur. 2009;1(4):457–62. [Google Scholar]
4. Pasupuleti J, Ramaiah V, Rathore A. Genetic analysis of resistance to late leaf spot in interspecific groundnuts. Euphytica. 2013;193(1):13–25. [Google Scholar]
5. Mao J, Jiang HJ, Yang RB, Li CX, Ma CY, Chen L, et al. Genetic diversity and population structure of wild and cultivated Camellia taliensis populations. J Tea Sci. 2021;41(4):454–62. [Google Scholar]
6. Bao WQ, Wu YT, Wang L, Zhao H, Du HY. Genetic diversity and population structure of the wild apricot and cultivation apricot. J Plant Genet Res. 2017;18(2):201–9. [Google Scholar]
7. Tomoya M, Hisato K, Norishige Y, Yoichiro H. Show more assessment of genetic relationships among cultivated and wild Rubus accessions using AFLP markers. Sci Hortic. 2015;193:163–73. [Google Scholar]
8. Derakhshan E, Majidi MM, Sharafi Y, Mirlohi A. Discrimination and genetic diversity of cultivated and wild safflowers (Carthamus spp.) using EST-microsatellites markers. Biochem Syst Ecol. 2014;54:130–6. [Google Scholar]
9. Angjelina B, Concepcion MD, Luciana B, Zlatko S, Diego B. Genetic diversity and relationships of wild and cultivated olives at regional level in Spain. Sci Hortic. 2010;124:323–30. [Google Scholar]
10. Jang WJ, Jang Y, Kim NH, Waminal NE, Kim YC, Lee JW. Show more genetic diversity among cultivated and wild Panax ginseng populations revealed by high resolution microsatellite markers. J Ginseng Res. 2019;11:689–92. [Google Scholar]
11. Liu SX, Shen YJ, Du CY, Wei GJ, Xiao Y, Wang XF. Genetic diversity analysis of cultivated varieties and wild of Astragalus Membranaceus based on ISSR. Mol Plant Breed. 2023;6:1024–30 (In Chinese). [Google Scholar]
12. Liu A, Ku Y, Contador CA, Lam HM. The impacts of domestication and agricultural practices on legume nutrient acquisition through symbiosis with rhizobia and arbuscular mycorrhizal fungi. Front Genet. 2020a;11:583954. [Google Scholar] [PubMed]
13. Qin HT, Möller M, Milne R, Luo YH, Zhu GF. Multiple paternally inherited chloroplast capture events associated with Taxus speciation in the Hengduan mountains. Mol Phylogenet Evol. 2023;189:107915. [Google Scholar] [PubMed]
14. Liu T, Li YL, Zhou ZQ, Hu HQ. Intra specific and in terspecific competition of Japanese yew (Taxus cuspidata). Acta Ecol Sin. 2021;27(3):924–9. [Google Scholar]
15. Chen J, Long T, Yang L, Wang Y, Xu C, Li J. Habitat suitability assessment of Taxus cuspidate. J Beijing Forest Univer. 2019;41(4):51–9. [Google Scholar]
16. Ma YT, Zhang Z, Zhang YW, Zhao JM. Morphological variation of Taxus cuspidata under cultivation conditions. J Changchun Nor Univer. 2021;2:113–7. [Google Scholar]
17. Doyle JJ. A rapid DNA isolation procedure for small quantities of fresh leaf tissue. Phytochem Bull. 1987;19:11–5. [Google Scholar]
18. Zhang DQ, Zhou N. Genetic diversity and population structure of the endangered conifer Taxus wallichiana var. mairei (Taxaceae) revealed by simple sequence repeat (SSR) markers. Biochem Syst and Ecol. 2013;49:107–14. [Google Scholar]
19. Sun XW, Liu DY, Zhang XF, Li WB, Liu H, Wang H. SLAF-seq: an efficient method of large-scale de novo SNP discovery and genotyping using high-throughput sequencing. PLoS One. 2013;8:e58700. [Google Scholar] [PubMed]
20. DePristo MA, Banks E, Poplin R, Garimella KV, Maguire JR. A framework for variation discovery and genotyping using next-generation DNA sequencing data. Nat Genet. 2011;43:491–8. [Google Scholar] [PubMed]
21. Kozich JJ, Westcotts SL, Baxter NT, Sarah KH, Schloss PD. Development of a dual-index sequencing strategy and curation pipeline for analyzing amplicon sequence data on the MiSeq Ilumina sequencing platform. Appl Environ Microb. 2013;79(17):5112–20. [Google Scholar]
22. Davey JW, Cezard T, Fuentes-utrilla P, Gharbi K, Blaxter ML. Special features of RAD Sequencing data: implications for genotyping. Mol Ecol. 2013;2211:3151–64. [Google Scholar]
23. van Ooijen JW. Multipoint maximum likelihood mapping in a full-sib family of an outbreeding species. Genet Res. 2011;93:343–9. [Google Scholar]
24. Mckenna A, Hanna M, Banks E, Sivachenko A, Cibulskis K, Kernytsky A. The genome analysis toolkit: a MapReduce framework for analyzing next-generation DNA sequencing data. Genome Res. 2010;20(9):1297–303. [Google Scholar] [PubMed]
25. Li H, Handsaker B, Wysoker A, Fennel T, Ruan J. The sequence alignment/map format and SAM tools. Bioinformatics. 2009;25(16):2078–9. [Google Scholar] [PubMed]
26. Kumar S, Stecher G, Li M, Knyaz C, Tamura K. MEGA X: molecular evolutionary genetics analysis across computing platforms. Mol Biol Evol. 2018;35(6):1547–9. [Google Scholar] [PubMed]
27. Alexander DH, Novembr EJ, Lange K. Fast model-based estimation of ancestry in unrelated individuals. Genome Res. 2009;19:1655–64. [Google Scholar] [PubMed]
28. Price AL, Patterson NJ, Plenge RM, Weinblatt ME, Shadick NA, Reich D. Principal components analysis connects for stratification in genome wide association studies. Nat Genet. 2006;38:904–9. [Google Scholar] [PubMed]
29. Excoffier L, Lischer HEL. Arlequin suite ver 3.5: a new series of programs to perform population genetics analyses under Linux and Windows. Mol Ecol Res. 2010;10:564–7. [Google Scholar]
30. Cheng BB, Zheng YQ, Sun QW. Genetic diversity and population structure of Taxus cuspidata in the Changbai mountains assessed by chloroplast DNA sequences and microsatellite markers. Biochem Syst Ecol. 2015;63:157–64. [Google Scholar]
31. Yang CC, Sakai H, Numa H, Itoh T. Gene tree discordance of wild and cultivated Asian rice deciphered by genome-wide sequence comparison. Gene. 2010;477(1–2):53–60. [Google Scholar]
32. Duan SH, Li SQ, Li SB, Zhu YG. Genetic diversity of wild rice and cultivated rice. Acta Agronomica Sin. 2009;35(3):467–74. [Google Scholar]
33. Surinder S, Prabhjot SN, Jaswinder S. Transposon-based genetic diversity assessment in wild and cultivated barley. Crop J. 2017;5(4):296–304. [Google Scholar]
34. Dong LD, Cheng J, Fang C, Kong LP, Yang H, Hou Z. Parallel selection of distinct Tof5 alleles drove the adaptation of cultivated and wild soybean to high latitudes. Mol Plant. 2021;18:182–94. [Google Scholar]
35. Miao Y, Lang X, Zhang Z, Su JR. Phylogeographer and genetic effects of habitat fragmentation on endangered Taxus yunnanensis in Southwest China as revealed by microsatellite data. Plant Biol. 2014;16(2):365–74. [Google Scholar] [PubMed]
36. Wen ZX, Zhao TJ, Ding YL, Gai JY. Genetic diversity, geographic differentiation, and evolutionary relationship among ecotypes of Glycine max and G. soja in China. Chin Sci Bull. 2009;54(23):4393–403. [Google Scholar]
37. Xie GY, Jin SY, Li HT, Ai MK, Han F. Chemical constituents and antioxidative, anti-inflammatory and anti-proliferative activities of wild and cultivated Corydalis saxicola. Ind Crop Prod. 2021;169:113647. [Google Scholar]
38. Kuroda Y, Kaga A, Tomooka N, Vaughan DA. Population genetic structure of Japanese wild soybean (Glycine soja) based on microsatellite variation. Mol Ecol. 2006;15:959–74. [Google Scholar] [PubMed]
39. Li N, Tang N, Ren YH, Wang Z. Effects of forest ropeway construction on bird diversity and its seed dispersal mutualism for endangered Taxus chinensis, Southeast China. Glob Ecol Conserv. 2022;38:e02227. [Google Scholar]
40. Liu J, Milne RI, Möller M, Zhu GF, Ye LJ, Luo YH. Integrating a comprehensive DNA barcode reference library with a global map of yews (Taxus L.) for forensic identification. Mol Ecol Res. 2018;18(5):1115–31. [Google Scholar]
41. Maroso F, Vera M, Ferreiro J, Mayol M, Riba M, Martinez P, et al. Genetic diversity and structure of Taxus baccata from the Cantabrian-Atlantic area in Northern Spain: a guide for conservation and management actions. Forest Ecol Manag. 2021;482:118844. [Google Scholar]
42. Möller M, Liu J, Li Y, Li JH, Ye LJ. Repeated intercontinental migrations and recurring hybridizations characterise the evolutionary history of yew (Taxus L.). Mol Phylogenet Evol. 2020;153:106952. [Google Scholar]
43. Shah A, Li DZ, Gao M, Li HT, Möller M. Genetic diversity within and among populations of the endangered species Taxus fuana (Taxaceae) from Pakistan and implications for its conservation. Biochem System Ecol. 2008;36:183–93. [Google Scholar]
Cite This Article
 Copyright © 2024 The Author(s). Published by Tech Science Press.
This work is licensed under a Creative Commons Attribution 4.0 International License , which permits unrestricted use, distribution, and reproduction in any medium, provided the original work is properly cited.
 Downloads
 Citation Tools