
 Submit a Paper
 Propose a Special lssue
 Open Access
ARTICLE

Impact of Different Rates of Nitrogen Supplementation on Soil Physicochemical Properties and Microbial Diversity in Goji Berry
1 State Key Laboratory of Efficient Production of Forest Resources, The College of Forestry, Beijing Forestry University, Beijing, 100083, China
2 National Wolfberry Engineering Research Center, Wolfberry Science Research Institute, Ningxia Academy of Agriculture and Forestry Sciences, Yinchuan, 750002, China
* Corresponding Author: Shuchai Su. Email:
Phyton-International Journal of Experimental Botany 2024, 93(3), 467-486. https://doi.org/10.32604/phyton.2024.047628
Received 12 November 2023; Accepted 25 January 2024; Issue published 28 March 2024
 View Full Text
 Download PDF
Abstract
Goji berry (Lycium barbarum L.) is substantially dependent on nitrogen fertilizer application, which can significantly enhance fruit yield and Goji berry industrial development in Ningxia, China. This study aimed to analyze the functions of differential nitrogen application rates including low (N1), medium (N2), and high (N3) levels in soil microbial community structure (bacterial and fungal) at 2 diverse soil depths (0–20, 20–40 cm) through high-throughput sequencing technology by targeting 16S RNA gene and ITS1 & ITS2 regions. All the observed physicochemical parameters exhibited significant improvement (p < 0.05) with increased levels of nitrogen and the highest values for most parameters were observed at N2. However, pH decreased (p < 0.05) gradually. The alpha and beta diversity analyses for bacterial and fungal communities’ metagenome displayed more similarities than differences among all groups. The top bacterial and fungal phyla and genera suggested no obvious (p > 0.05) differences among three group treatments (N1, N2, and N3). Furthermore, the functional enrichment analysis demonstrated significant (p < 0.05) enrichment of quorum sensing, cysteine and methionine metabolism, and transcriptional machinery for bacterial communities, while various saprotrophic functional roles for fungal communities. Conclusively, moderately reducing the use of N-supplemented fertilizers is conducive to increasing soil nitrogen utilization rate, which can contribute to sustainable agriculture practices through improved soil quality, and microbial community structure and functions.
Keywords
Supplementary Material
Supplementary Material FileLycium plants (family Solanaceae) are native to arid and semi-arid parts of Eurasia, Africa, North America, South America and so on [1]. Two of the 31 Lycium species identified worldwide are Lycium barbarum L. and Lycium chinense Mill. which stand out for their unique chemical composition and health benefits. For over 2,000 years, these fruits, also known as goji berries or wolfberries, exert a critical effect on traditional Chinese medicine [2]. In Ningxia (an arid region of Northwestern China), Goji berry cultivation becomes a main income source [3]. In most parts of Ningxia, substantial fertilizer management practices are followed; however, neither the kind of fertilizer nor its time or rate of application corresponds with the nutritional needs of L. barbarum [3,4]. In addition to being a major resource waster, these irrational management techniques also raise the possibility of environmental pollution. For the goji berry sector to attain sustainable production, cost-effective management practices must be implemented to improve soil quality, boost crop yield, and increase agricultural economic advantages.
In agriculture, synthetic/inorganic fertilizers have been frequently applied since they are cost-effective and serve as fast sources of plant nutrients, considerably increasing plant production. Nitrogen is a key nutritional component required by plants in proper growth. The excessive nitrogen fertilizer application to boost agricultural productivity is debated for over 5 decades [5]. Increased N inputs often increase plant productivity [6], alter the composition of local plant communities, and typically decrease the diversity of local plant species [7,8]. In addition, changes in microbial taxa, such as nitrifiers, are well documented when soils receive different supplementation rates. Despite the numerous benefits that are obtained by applying reactive N, numerous environmental problems occur due to repeated and excessive environmental N application, which included soil/water acidification, contamination of groundwater-surface or additional water mineral resources, and increasing ozone depletion [9]. Recent studies indicate that different N supplementation rates can shape the bacterial and fungal community structure [10,11]. The soil microbial community composition has changed as a result of different N supplementation rates, which has probably caused changes in how well they operate. This theory has been reinforced by laboratory investigations, showing that microbial communities are not functionally redundant or comparable and that changes in their structure make an influence on processes at the ecosystem level [12,13], even though the direct effects of increasing N inputs on particular N cycling mechanisms have been extensively documented [14].
Goji berry’s growth heavily relies on the application of nitrogen fertilizer, which significantly enhances Goji berry yield and Goji berry industrial development [15]. Nonetheless, its low efficiency in nitrogen utilization usually results in excess N fertilizer use by farmers, ultimately generating negative impacts on the environment. Therefore, investigating the interaction mechanism among Goji berry plants, nitrogen fertilizer, and spatial microorganisms for improving N utilization rate represents the key research goal for achieving great agricultural development. This study focused on exploring how diverse N application rates (low, medium, and high) affected Goji berry planted soil physicochemical characteristics, microbial community structure, and their enriched functions at different depths 0-20 cm and 20-40 cm (rhizosphere soil and non-rhizosphere soil), as it is shown that reducing nitrogen fertilizer application can be beneficial for improving N utilization efficiency and soil quality.
The current experiment was conducted at the base of Qiyuanlvfeng Agriculture and Forestry Technology Co., Ltd., Sanhe Town, Haiyuan County, Zhongwei, Ningxia (Fig. 1) between April 2020 (36°25′48″N, 106°09′00″E, 1428.5 m above sea level) and September 2022. The mean annual precipitation and temperature were 367 mm and 7.5°C separately. This experimental site has a flat terrain, a deep soil layer, good soil quality, and uniform fertility. The tested variety was a 4-year-old plant of the main Lycium barbarum L. variety “Ningqi No. 7”, with a row spacing of 1 m × 3 m, grew vigorously and was free from pests and diseases.
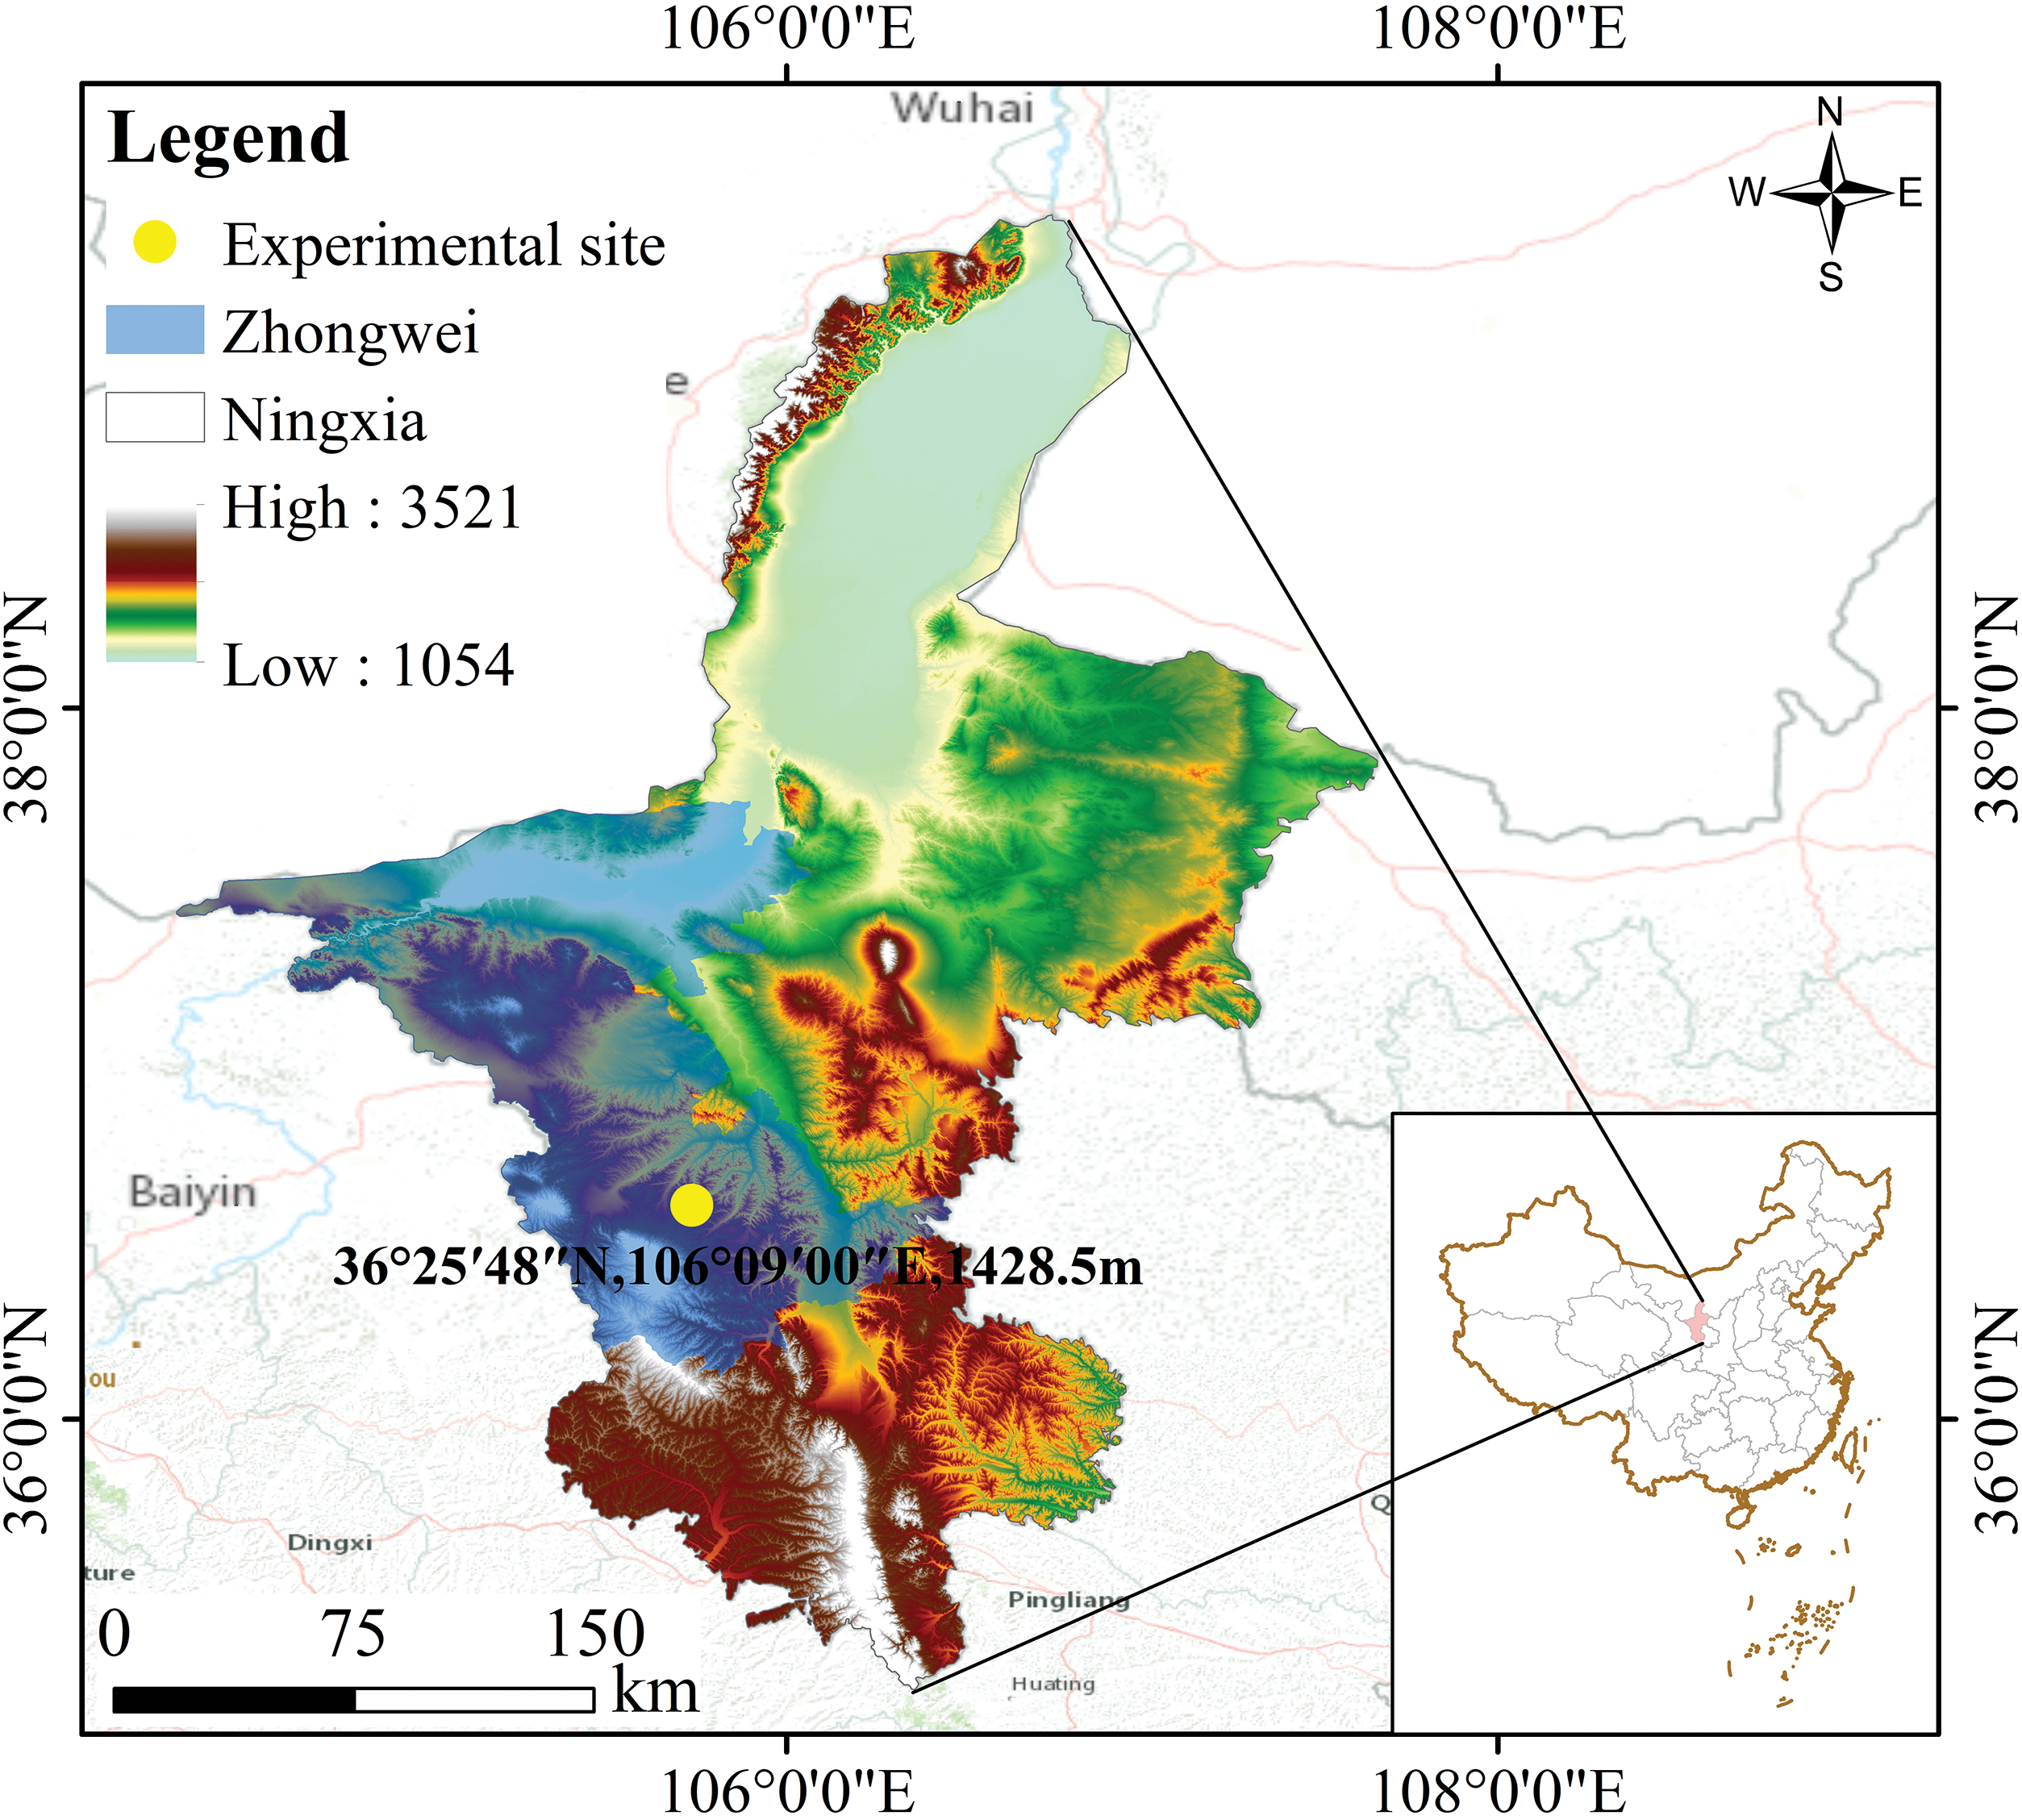
Figure 1: Map of the experimental site
This experiment was of the one-way randomized complete block design (RCBD) under three treatments: N1 (low fertilizer): reducing nitrogen by 20%, i.e., applying 540 kg·hm−2 of pure nitrogen (The details are listed in Supplementary Tables S1 to S3); N2 (medium-fertilizer): medium N, which means applying 675 kg·hm−2 of pure nitrogen; N3 (high-fertilizer, control): N elevation by 20%, i.e., applying pure N 810 kg·hm−2, which is the standard for the traditional N use in the local area. N fertilizer was used with common urea (N 46%); phosphorus fertilizer was heavy superphosphate (P2O5 50%); potash fertilizer was potassium sulfate (K2SO4 50%), and the amount of phosphorus and potash fertilizers were the same in each treatment, with application amounts of 450 kg·hm−2 and 300 kg·hm−2, respectively. Fertilization was performed based on phenological period of Goji berries, with a total of 5 fertilizations throughout the year. Nitrogen, phosphorus, and potassium fertilizers were adopted in batches, with fertilization times around April 20th (budding/unfolding stage), May 20th (green fruit stage), June 15th (fruit ripening period), late July to early August (autumn fruit stage), and late September (autumn dormancy period). Before May 20th, N and P/K fertilizer application occupied >50% and <40% of the annual growth period, separately. After June, N and P/K fertilizer application covered <50% and >60% of the annual growth period, accordingly. The community area was 6 m × 9 m, 3 replicates, and randomly arranged in blocks. Following field water management, the traditional watering method of local farmers, usually watering 1–2 days after fertilization or according to dry and wet soil conditions, performing a total of about 9 times of watering during the annual growth period, was adopted. The annual irrigation volume was about 7500 m3/hm2, of which the first irrigation was in mid to late April, while the second irrigation was 8 to 10 days apart from the first, and the third irrigation was in the flowering and bearing period of perennial branches. In the summer harvest period, irrigation was carried out once every one to two fruit picking, when generally, irrigation was conducted 2–3 times. After entering the autumn fruit period, one irrigation was carried out in early August combined with fertilization; one irrigation occurred in early September, and the last winter irrigation was performed in early November.
For the soil metagenome analysis, a total of 36 samples (18 respective rhizosphere and non-rhizosphere soils) were collected. More details regarding the samples are given in Supplementary Table S4. The samples were obtained according to previous description [16] on August 01, 2022 (after two years of continuous nitrogen treatment, the soil in the field has already formed a stable gradient environment). At that time, the wolfberry plants were at the autumn fruit stage. Besides, 3–5 normal plants were selected in each replicate under every treatment, and labeled by site-directed markers. In addition, a 5-point sampling approach was adopted to collect rhizosphere soil samples in the 0–40 cm soil layer attached to the root cap [17]. Non-rhizosphere soil samples were collected from 15–20 cm away from the root cap and 0-40 cm vertical depths by taking a 5-point sampling approach. The soil amount collected each time was broadly identical. The samples were mixed, added in the frozen storage tubes, and packaged in the liquid nitrogen tanks before being sent to the laboratory to preserve under −80°C.
2.1 Physicochemical Properties
For the physicochemical properties, totally 24 samples, 6 random samples before the start of fertilization and 18 samples (after two years of continuous nitrogen treatment) from low, medium, and high N treatment groups (6 from each treatment) were collected. Sampling detail with their labels is shown in Supplementary Table S5.
The physicochemical parameters [pH, electrical conductivity (EC), organic matter (OM), total nitrogen (TN), total phosphorus (TP), total potassium (TK), available nitrogen (AN), available phosphorus (AP), and available potassium (AK)] of soil samples at 0–20 and 20–40 cm layers were analyzed by the “Soil Agrochemical Analysis Method” [18]. Water extracts (pH, 1:2.5 w/v; EC, 1:5 w/v) were used to evaluate pH and EC after being suspended for 30 min (ORION-STAR A215, Thermo Fisher Scientific, Waltham, MA, USA). Total nitrogen in the soil was determined after the acid digestion using the micro Kjeldahl approach [19]. Total P and total K were predicted in line with Pemberton [20] and by the atomic absorption spectrophotometer after alkaline and acidic digestion of the soil, respectively. The Molybdenum Blue procedure with hydrochloric acid and ammonium was followed to determine available phosphorus [21]. Alkaline hydrolysable diffusion was used to estimate available nitrogen [22]. Available K was extracted and quantified with ammonium acetate through flame photometry. Redox titration using 0.8 mol/L K2Cr2O7 was used to assess soil organic matter.
2.2 DNA Extraction, PCR Amplification, and Metagenomic Sequencing
Genomic DNA was extracted by the CTAB approach [23], which was then diluted to 1 ng/l and examined for purity and concentration using agarose gel electrophoresis. For bacterial community amplification, standard Illumina sequencing primers (515 FB and 806 RB) were utilized for amplifying the V3-V4 region of 16S rRNA gene [24]: for identification of fungal diversity, the ITS rDNA region was targeted by fungal-specific ITS1F and ITS4 primers [25]. In addition, the amplification region includes Archaea 16S V4-V5/Archaea 16S V8, 18S V9, and ITS2 zones. For PCR amplification, the Phusion® High-Fidelity PCR Master Mix (New England Biolabs) with GC Buffer was used. After purification with magnetic beads, PCR products were quantified enzymatically, and examined with 2% agarose gel electrophoresis. Later, in this work, agar gel electrophoresis was conducted for validating the mixture of equal quantities of PCR products, and the Qiagen glue recovery kit was applied for recovery. TruSeq® DNA PCR-Free Sample Preparation Kit was used in library creation. Following library quantification using Qubit and Q-PCR, sequencing was performed on the NovaSeq6000.
Trimmomatic with a 50 bp window size was used for the initial quality control step [26]. Bases having a Phred quality score of less than 20 were trimmed. Cutadapt was adopted to delete the primer sequence. In this study, FLASH [27] was utilized for combining raw paired-end reads, requiring the minimal overlap sequence length of at least 10 bp and the maximal permitted mismatch ratio at 0.1. Chimeric sequences were identified and removed with UCHIME [28]. In our analysis, effective tags from all data were clustered into Operational Taxonomic Units (OTUs) using Uparse algorithm (Uparse v7.0.1001, http://www.drive5.com/uparse/ accessed on 15 May 2023) [29] with a default 97% consistency criterion. Following the guidelines of the Uparse method, the representative sequences for these OTUs were chosen according to sequences that were most frequent within each cluster. The UNITE database [30] and the Qiime programme (Version 1.9.1, http://qiime.org/scripts/assign_taxonomy.htm/ accessed on 15 May 2023) were used for species annotation of the OTU sequences. Furthermore, MUSCLE programme (Version 3.8.31, http://www.drive5.com/muscle/ accessed on 16 May 2023) [31] was followed for quick multi-sequence alignment to determine the evolutionary connections between these OTUs. All sample data were finally normalized and aligned with the smallest dataset to ensure data consistency. To analyze richness and diversity, Rank abundance and dilution curves were drawn with R software (V2.15.3). In the above homogenized dataset, the alpha- and beta-diversities were analyzed with QIIME software V1.7.0. Heatmaps of bacterial and fungal communities were depicted based on those 35 predominant genera by the R package (V2.15.3). Functional enrichment analyses of bacterial and fungal sequences were performed using PICRUSt and FUNGuild databases.
Alpha diversity parameters (Ace and Shannon index) for bacterial and fungal communities of diverse groups were analyzed by the Kruskal-Wallis test, and any significant differences were identified. Tukey’s test (p > 0.05) and analysis of variance (ANOVA) were employed to find significant differences across relatively predominant bacterial and fungal phyla and genera.
3.1 Physicochemical Characteristics
Soil physicochemical properties supplemented with varying levels of nitrogen concentration as a fertilizer (N0: before the start of the experiment, N1: low nitrogen, N2: medium nitrogen, and N3: high nitrogen) taken from 0–20 and 20–40 cm depths were observed and are given in Table 1. The physicochemical parameters were significantly different (p < 0.05) for applied treatments at both depths except for total potassium (TK) at 0-20 cm depth. If being compared with N0, all the parameters remarkably elevated (p < 0.05), while pH declined (p < 0.05) for supplemented N groups (N1, N2, and N3) in the 0–20 cm layer. Similarly, in the 20–40 cm layer, parameters like TK, AK, TP, and AP increased (p < 0.05) for N-supplemented groups (N1, N2, and N3) in comparison with N0, while OM, TN, and AN decreased (p < 0.05). Overall, N application at varying levels had a significant (p < 0.05) effect on soil physicochemical properties, and most of them possessed the highest values at N2 (medium) levels.
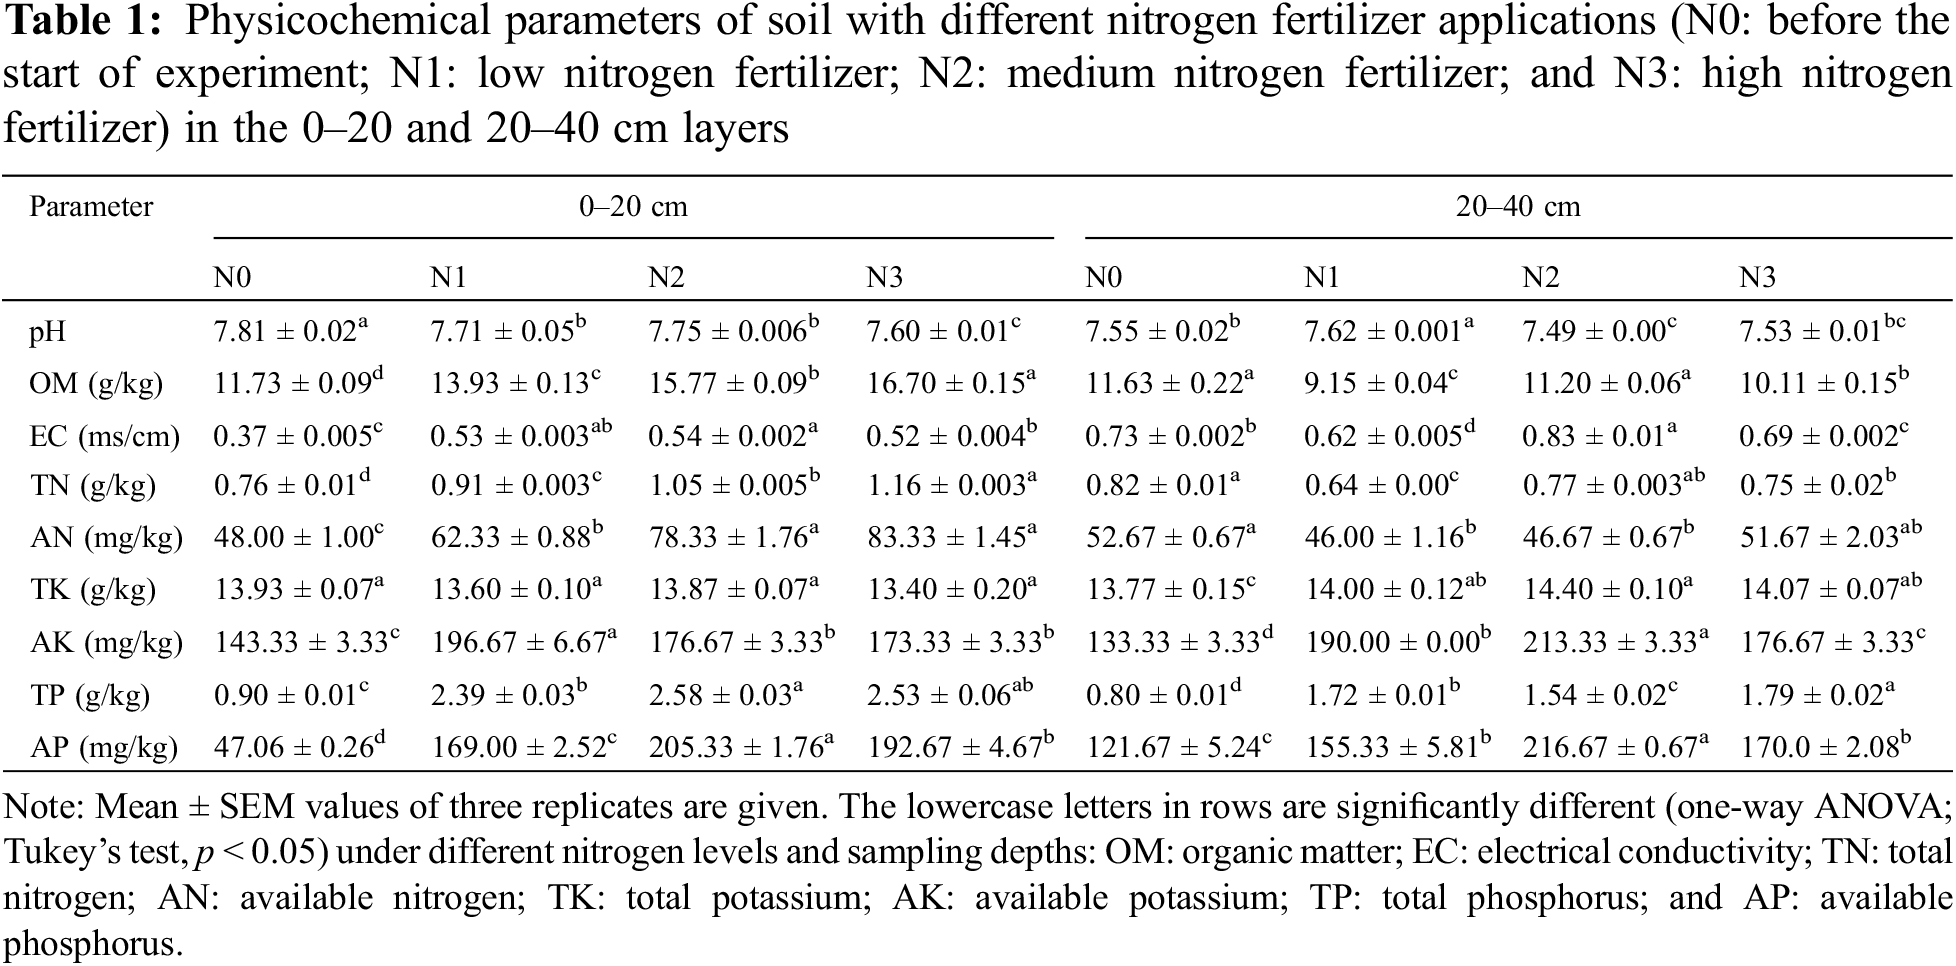
Rarefaction and rank abundance curves were depicted for displaying optimum sequencing depth, diversity, and richness of analyzed sequences of bacterial and fungal communities in 0–20 and 20–40 cm layers (rhizosphere vs. non-rhizosphere soil at each depth) of Goji berry plants supplemented with three different levels of nitrogen (N1: low-level nitrogen; N2 medium level nitrogen; and N3: high-level nitrogen) (Figs. 2A–2D). The smoothness of the curves indicated an even distribution in all samples. The diversity analysis (sample number, abundance, and evenness) justified the sequencing requirements and enough sequences of bacterial and fungal communities for further analyses. Furthermore, the analysis on alpha diversity indices, namely ACE and Shannon of bacterial communities’ sequences revealed that groups N1 (N1R1, N1S1, N1R2, and N1S2), and N3 (N3R1, N3S1, N3R2, and N3S2) were more enriched and diverse than N2 (N2R1, N2S1, N2R2, and N2S2) group samples (Figs. 3A and 3B). However, alpha diversity index ACE and Shannon analyses for fungal communities’ sequences demonstrated that there were not much differences between all groups (Figs. 4A and 4B).
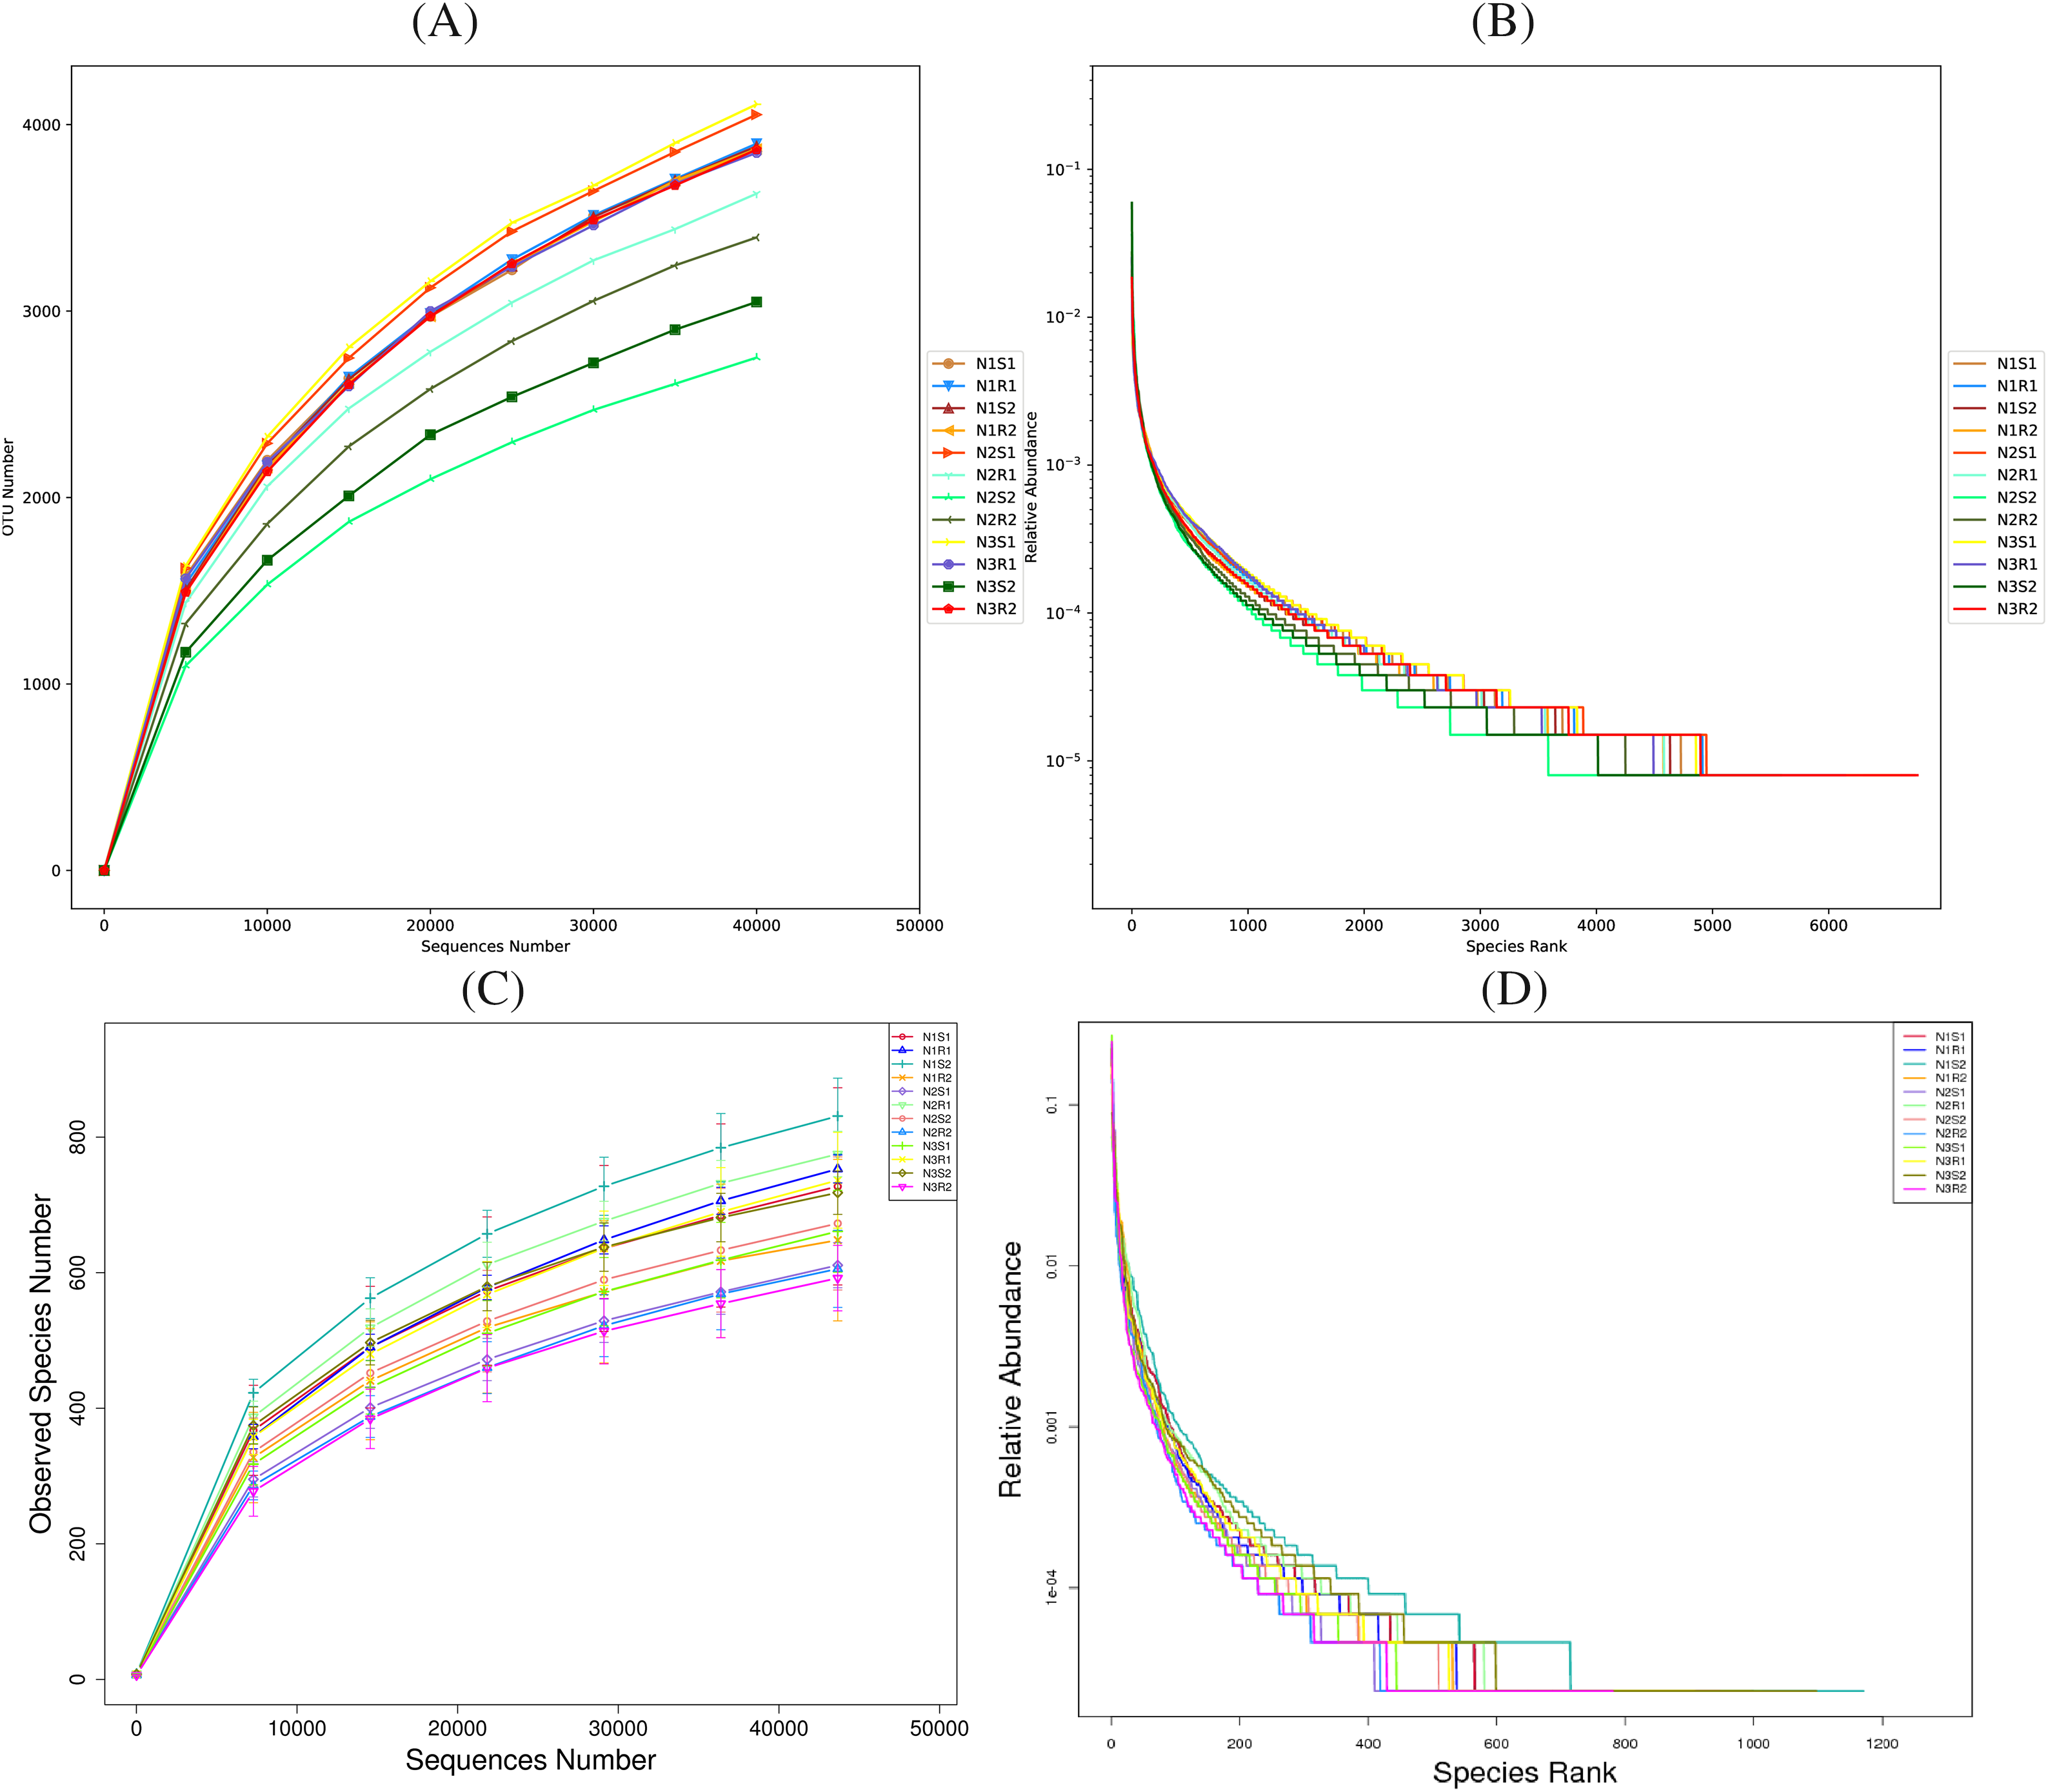
Figure 2: Rarefaction and rank abundance curves of Bacterial communities’ (A) and (B) and fungal communities’ (C) and (D) sequences, respectively taken from Goji berry plants in 0–20 and 20–40 cm layers supplemented with three different levels of nitrogen (low nitrogen rhizosphere and non-rhizosphere samples at 0–20 cm depth: N1R1 and N1S1; low nitrogen rhizosphere and non-rhizosphere samples at 20–40 cm depth: N1R2 and N1S2; medium nitrogen rhizosphere and non-rhizosphere samples at 0-20 cm depth: N2R1 and N2S1; medium nitrogen rhizosphere and non-rhizosphere samples at 20–40 cm depth: N2R2 and N2S2; high nitrogen rhizosphere and non-rhizosphere samples at 0–20 cm depth: N3R1 and N3S1; and high nitrogen rhizosphere and non-rhizosphere samples at 20–40 cm depth: N3R2 and N3S2). The letter R is for rhizosphere and the letter S refers to non-rhizosphere samples
Figure 3: Alpha-diversity indexes (A) ACE and (B) Shannon analyses of bacterial communities’ sequences taken from Goji berry plants in 0–20 and 20–40 cm layers supplemented with three different levels of nitrogen (N1R1 and N1S1; N1R2 and N1S2; N2R1 and N2S1; N2R2 and N2S2; N3R1 and N3S1; and N3R2 and N3S2)
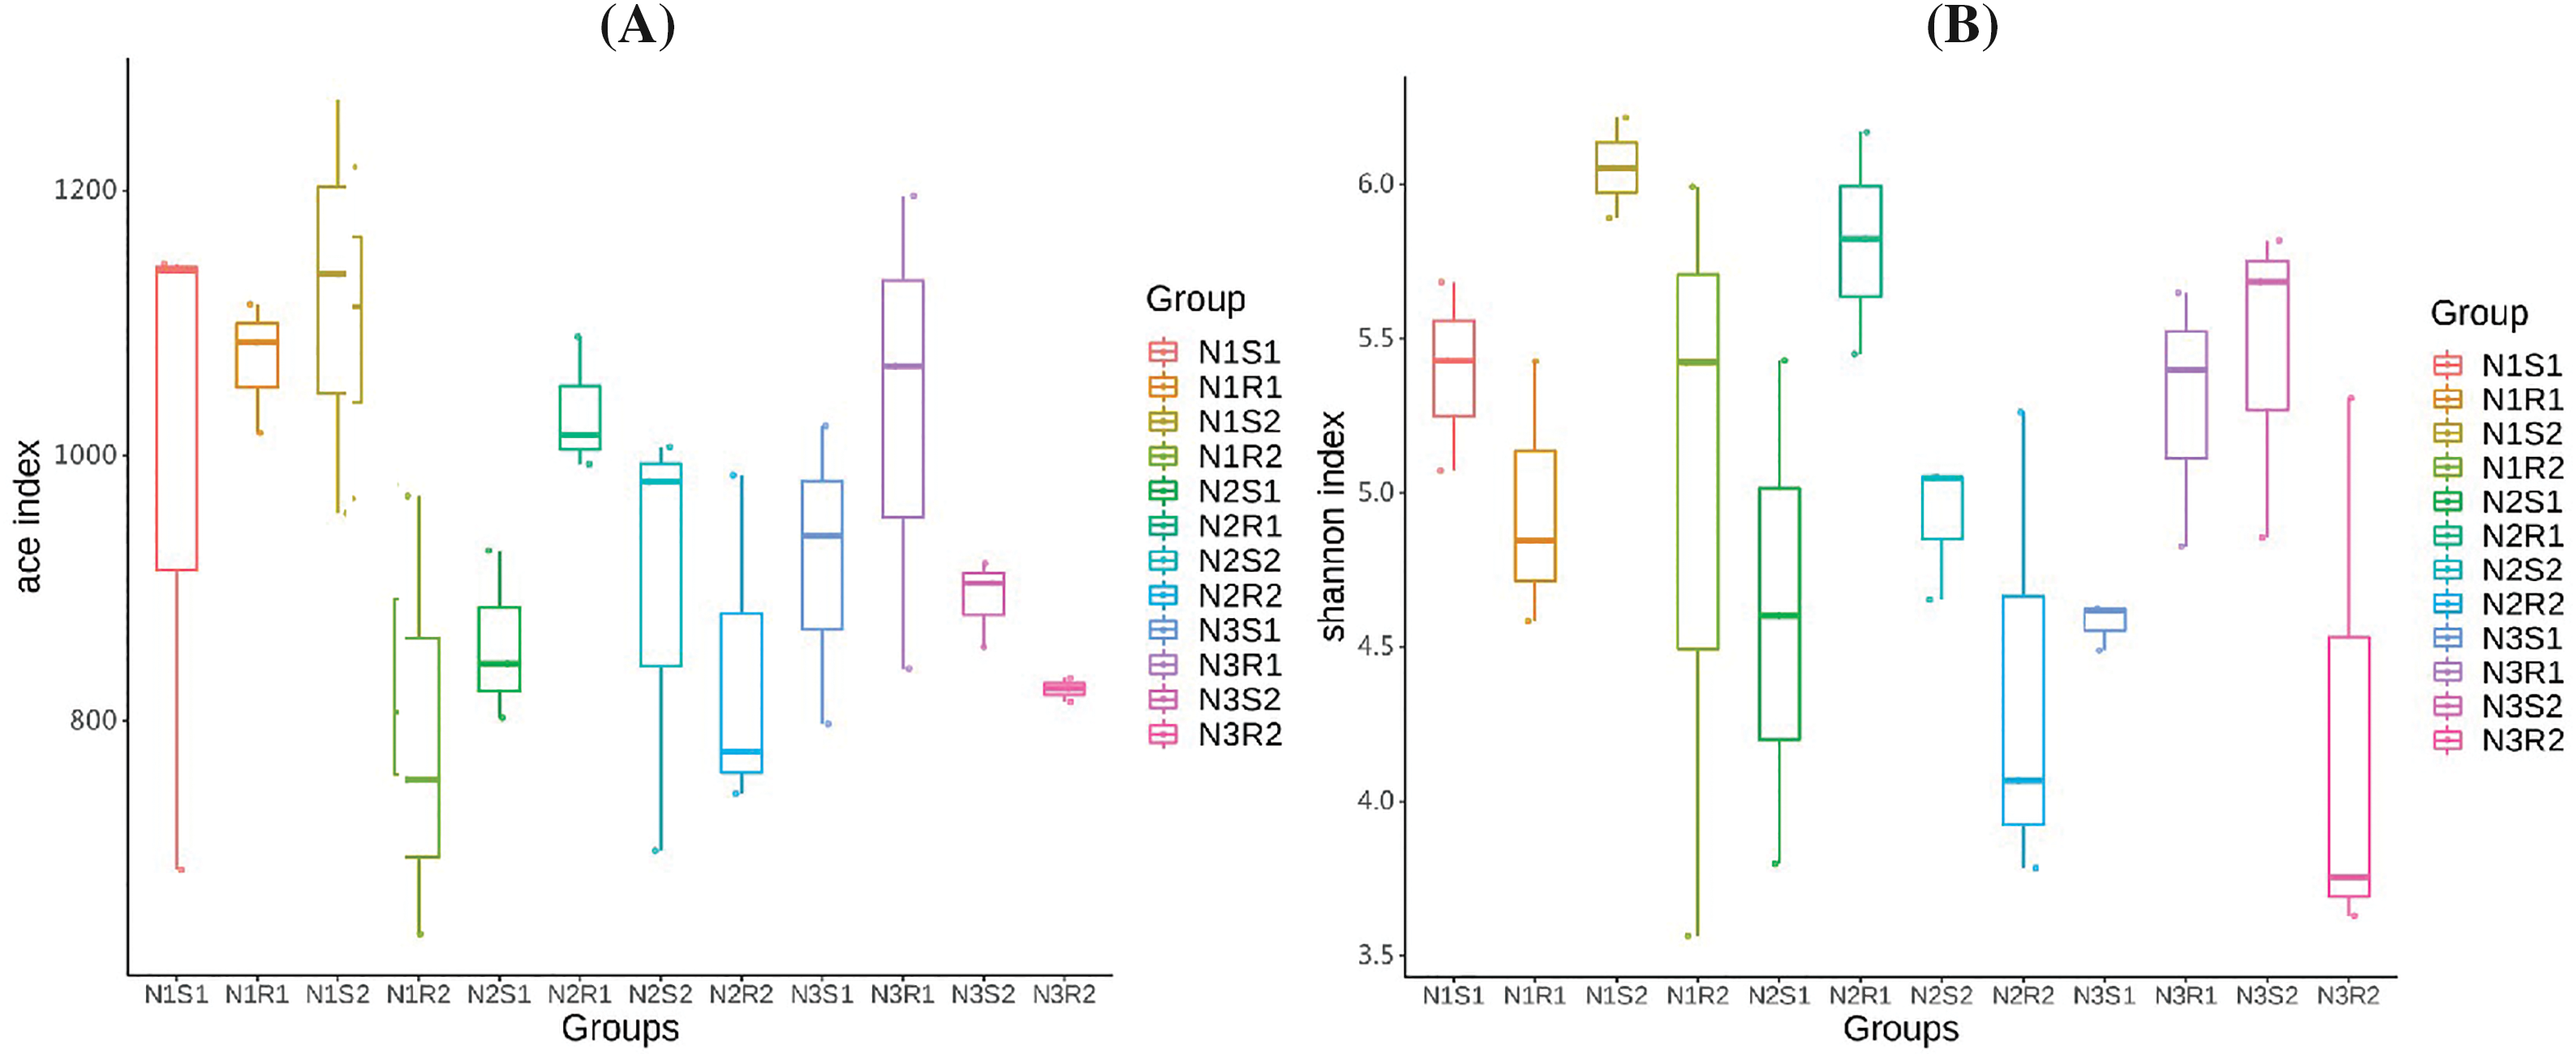
Figure 4: Alpha-diversity indexes (A) ACE and (B) Shannon analyses of fungal communities’ sequences taken from Goji berry plants in 0–20 and 20–40 cm layers supplemented with three different levels of nitrogen (N1R1 and N1S1; N1R2 and N1S2; N2R1 and N2S1; N2R2 and N2S2; N3R1 and N3S1; and N3R2 and N3S2)
3.3 Relative Bacterial and Fungal Taxa Abundances
In this study, the relative abundance histogram was plotted to reveal relatively predominant bacterial and fungal communities (phylum and genera levels) within the rhizosphere and non-rhizosphere soils at 0–20 and 20–40 cm depth each of Goji berry plants supplemented with different levels of nitrogen (N1: low-level nitrogen; N2 medium level nitrogen; and N3: high-level nitrogen). For bacterial communities, Proteobacteria, Actinobacteriota, and Firmicutes were found abundantly in all groups at the phylum level (Fig. 5A), whereas Pseudomonas, unidentified_Acidimicrobiia, and Bacillus were identified abundantly at the genus level (Fig. 5B). Relative abundance of top phyla (Proteobacteria, Actinobacteriota, and Firmicutes) did not vary significantly (p > 0.05) across three treatments (N1, N2, and N3) (Supplementary Table S6). However, Proteobacteria and Actinobacteriota were featured with the highest average number of communities in the N2 group compared to N1 and N3 groups, whereas Firmicutes had the lowest average number of communities in the N2 group. Similarly, the relative abundance of top genera (Pseudomonas, unidentified_Acidimicrobiia, and Bacillus) varied slightly (p > 0.05) across the three group treatments (N1, N2, and N3) (Supplementary Table S7). However, unidentified_Acidimicrobiia and Bacillus had the highest average number of communities in the N2 group compared to the N1 and N3 groups, while Pseudomonas had a lowest average number of communities in the N2 group.
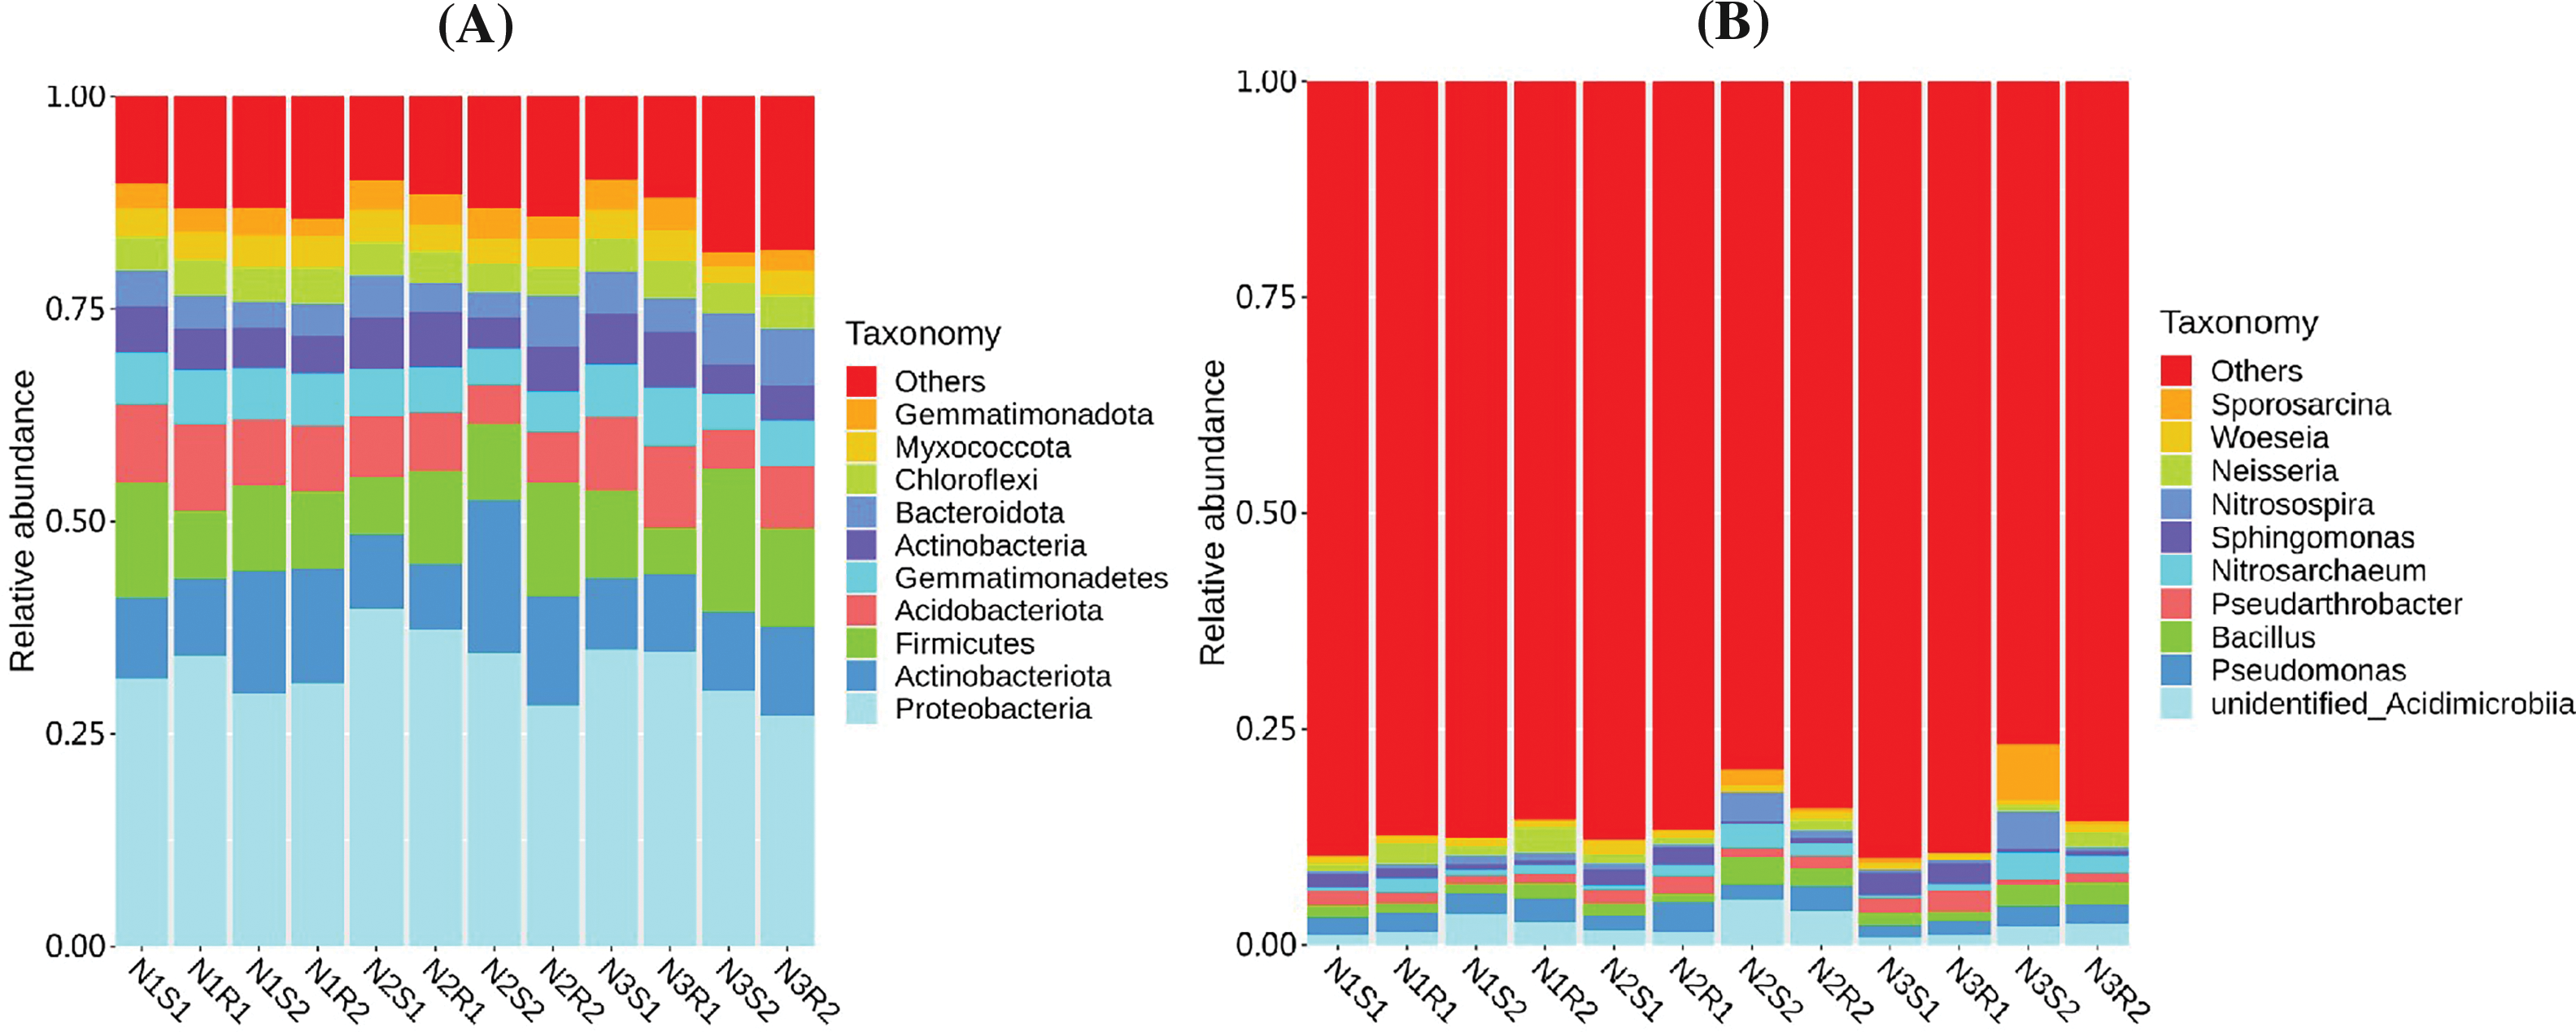
Figure 5: Relative abundances of bacterial communities’ sequences at (A) Phylum and (B) Genus levels taken from Goji berry plants in 0–20 and 20–40 cm layers supplemented with three different levels of nitrogen (N1R1 and N1S1; N1R2 and N1S2; N2R1 and N2S1; N2R2 and N2S2; N3R1 and N3S1; and N3R2 and N3S2)
For the fungal communities, Ascomycota, Mortierellomycota, Chytridiomycota, and Basidiomycota were found abundantly in all groups at the phylum level (Fig. 6A), whereas Mortierella, Acaulium, Monilia, Gibberella, and Fusarium were discovered abundantly at the genus level (Fig. 6B). Relative abundances of top phyla (Ascomycota, Mortierellomycota, Chytridiomycota, and Basidiomycota) showed no significant difference (p > 0.05) across the three group treatments (N1, N2, and N3) (Supplementary Table S8). Nevertheless, Ascomycota experienced a decreasing trend, and Mortierellomycota, Chytridiomycota, and Basidiomycota showed an increasing trend with increased levels of nitrogen. Similarly, the relative abundance of top genera (Mortierella, Acaulium, Monilia, Gibberella, and Fusarium) did not vary dramatically (p > 0.05) across the three group treatments (N1, N2, and N3) (Supplementary Table S9). The genera Mortierella displayed an increasing trend, while Fusarium showed a decreasing trend with increased levels of nitrogen. However, Acaulium, Monilia, and Gibberella witnessed an inconsistent trend.
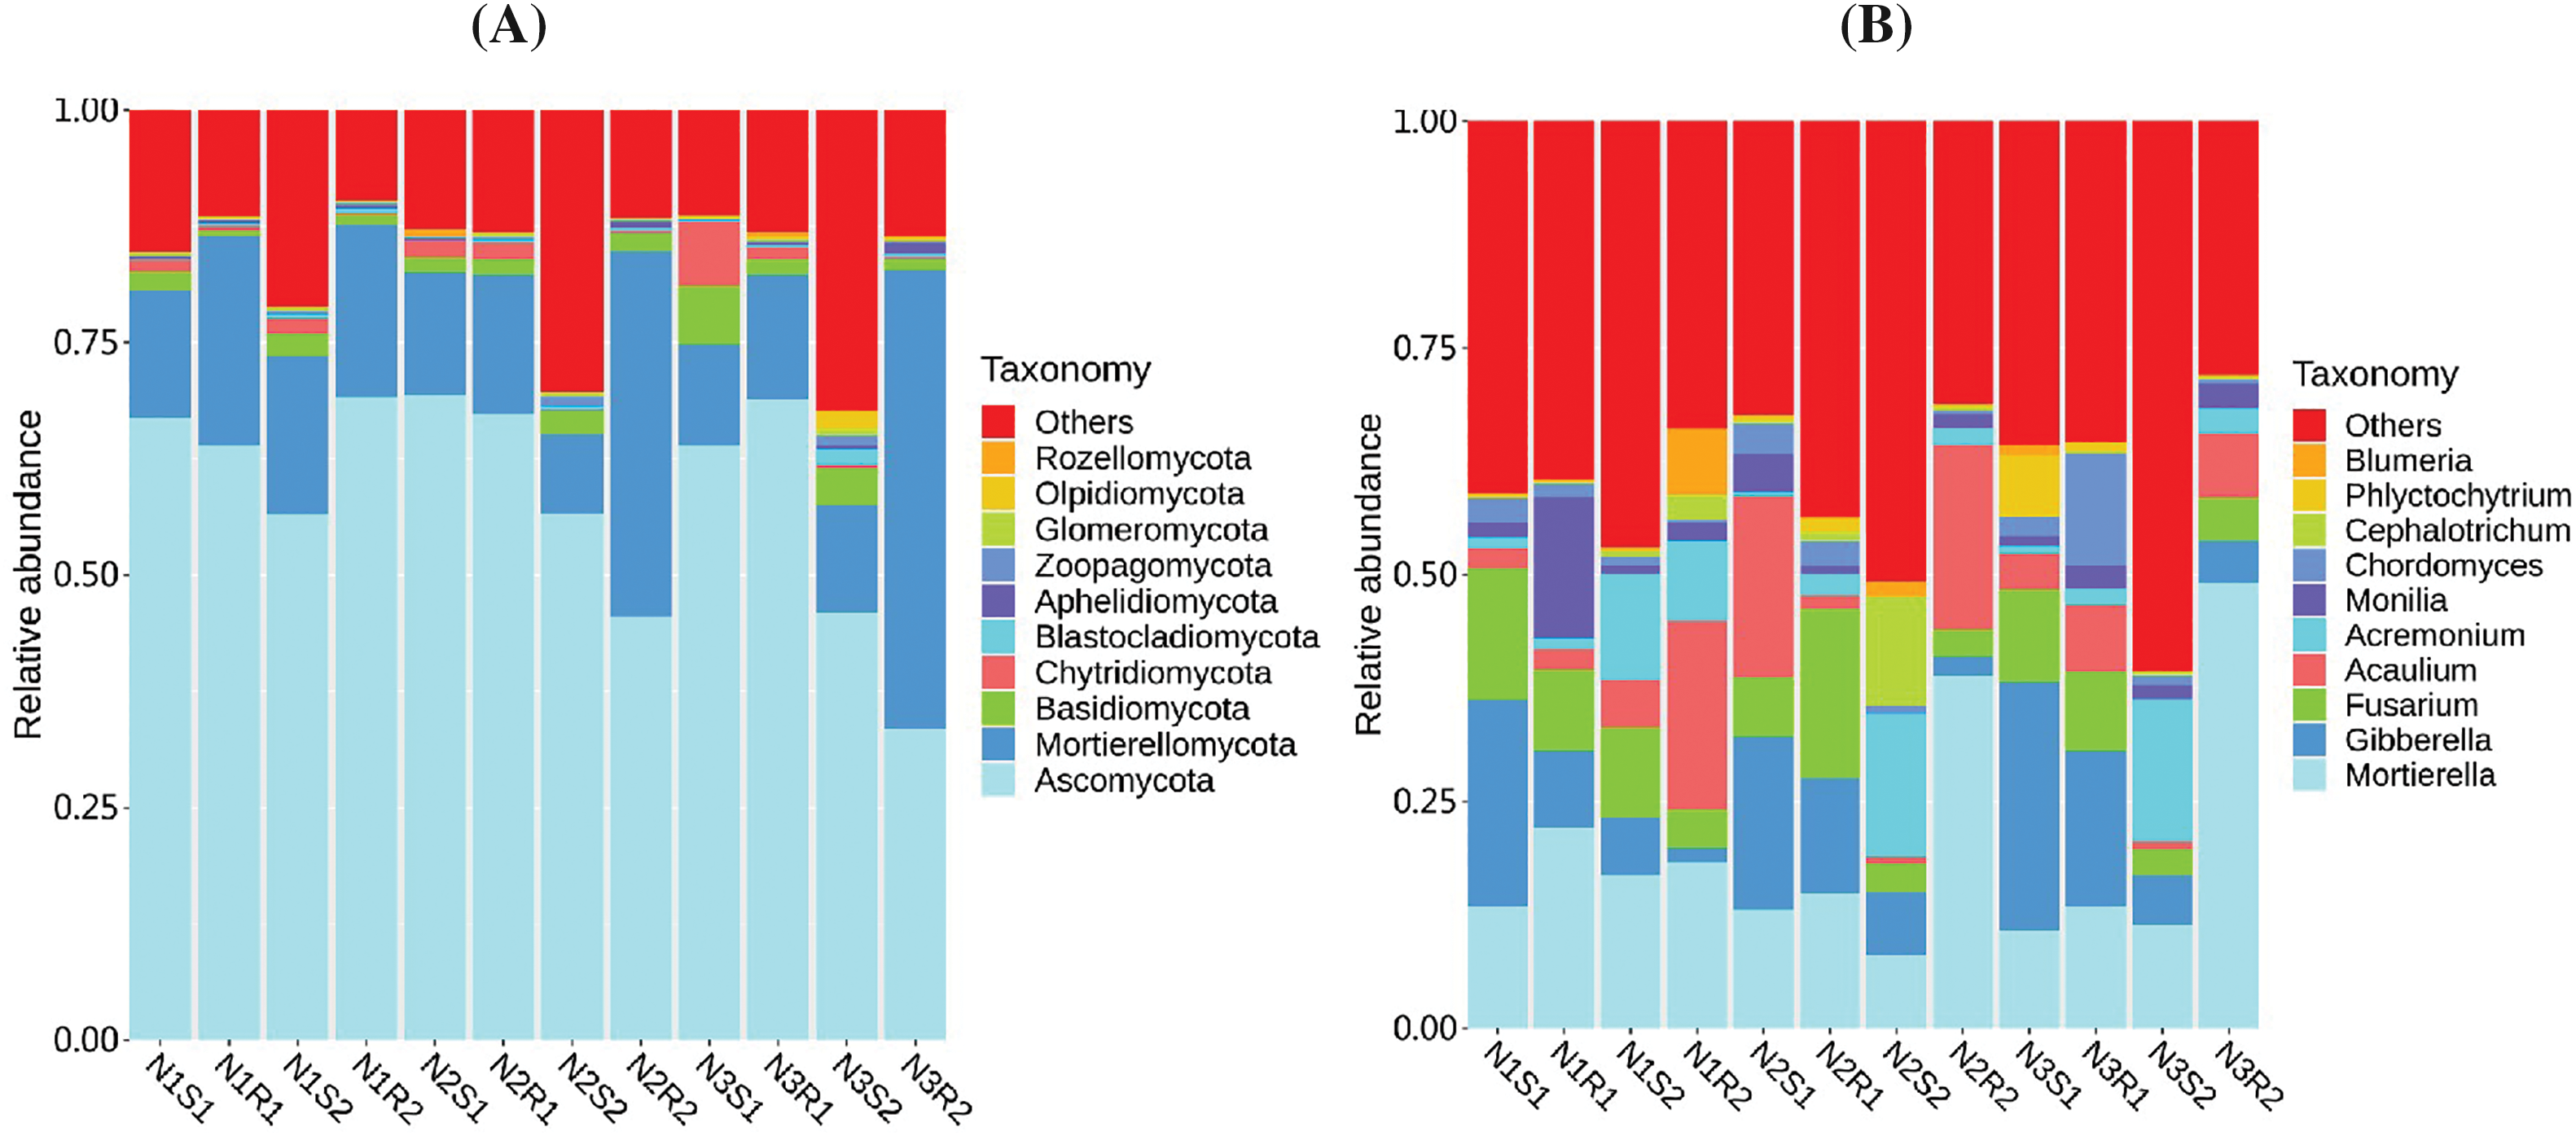
Figure 6: Relative abundance of fungal communities’ sequences at (A) Phylum and (B) Genus levels taken from Goji berry plants in 0–20 and 20–40 cm layers supplemented with three different levels of nitrogen (N1R1 and N1S1; N1R2 and N1S2; N2R1 and N2S1; N2R2 and N2S2; N3R1 and N3S1; and N3R2 and N3S2)
In this study, principal component analysis (PCA) was carried out to analyze the differences and similarities among bacterial and fungal communities of soil samples supplemented with different levels of nitrogen (Figs. 7 and 8). In terms of bacterial communities, PC1 and PC2 showed 7.96% and 6% of the variance, respectively (Fig. 7). The PCA plot revealed more differences within the group than between groups for bacterial communities as samples from the same groups were placed apart. For fungal communities, PC1 and PC2 possessed 6.25% and 5.35% of the variance, respectively (Fig. 8). The PCA plot displayed more similarities between and within the fungal communities’ groups than differences as samples were closely clustered. The heatmap was drawn to look for the significant genera among all groups of bacterial and fungal communities (Figs. 9 and 10). For the bacterial communities, the low nitrogen-supplemented group N1 had significant (p < 0.05) bacterial genera N1S1: Blautia and N1R2: Gaiella (Fig. 9). Similarly, the medium nitrogen-supplemented group N2 had significant (p < 0.05) bacterial genera N2S1: Woeseia and Iodidimonas; N2R2: Corynebacterium and unidentified_Prevotellaceae; and N2S2: unidentified_Sphingomonadacease. The high nitrogen-supplemented group N3 had significant (p < 0.05) fungal genera N3S2: Sporosarcina.
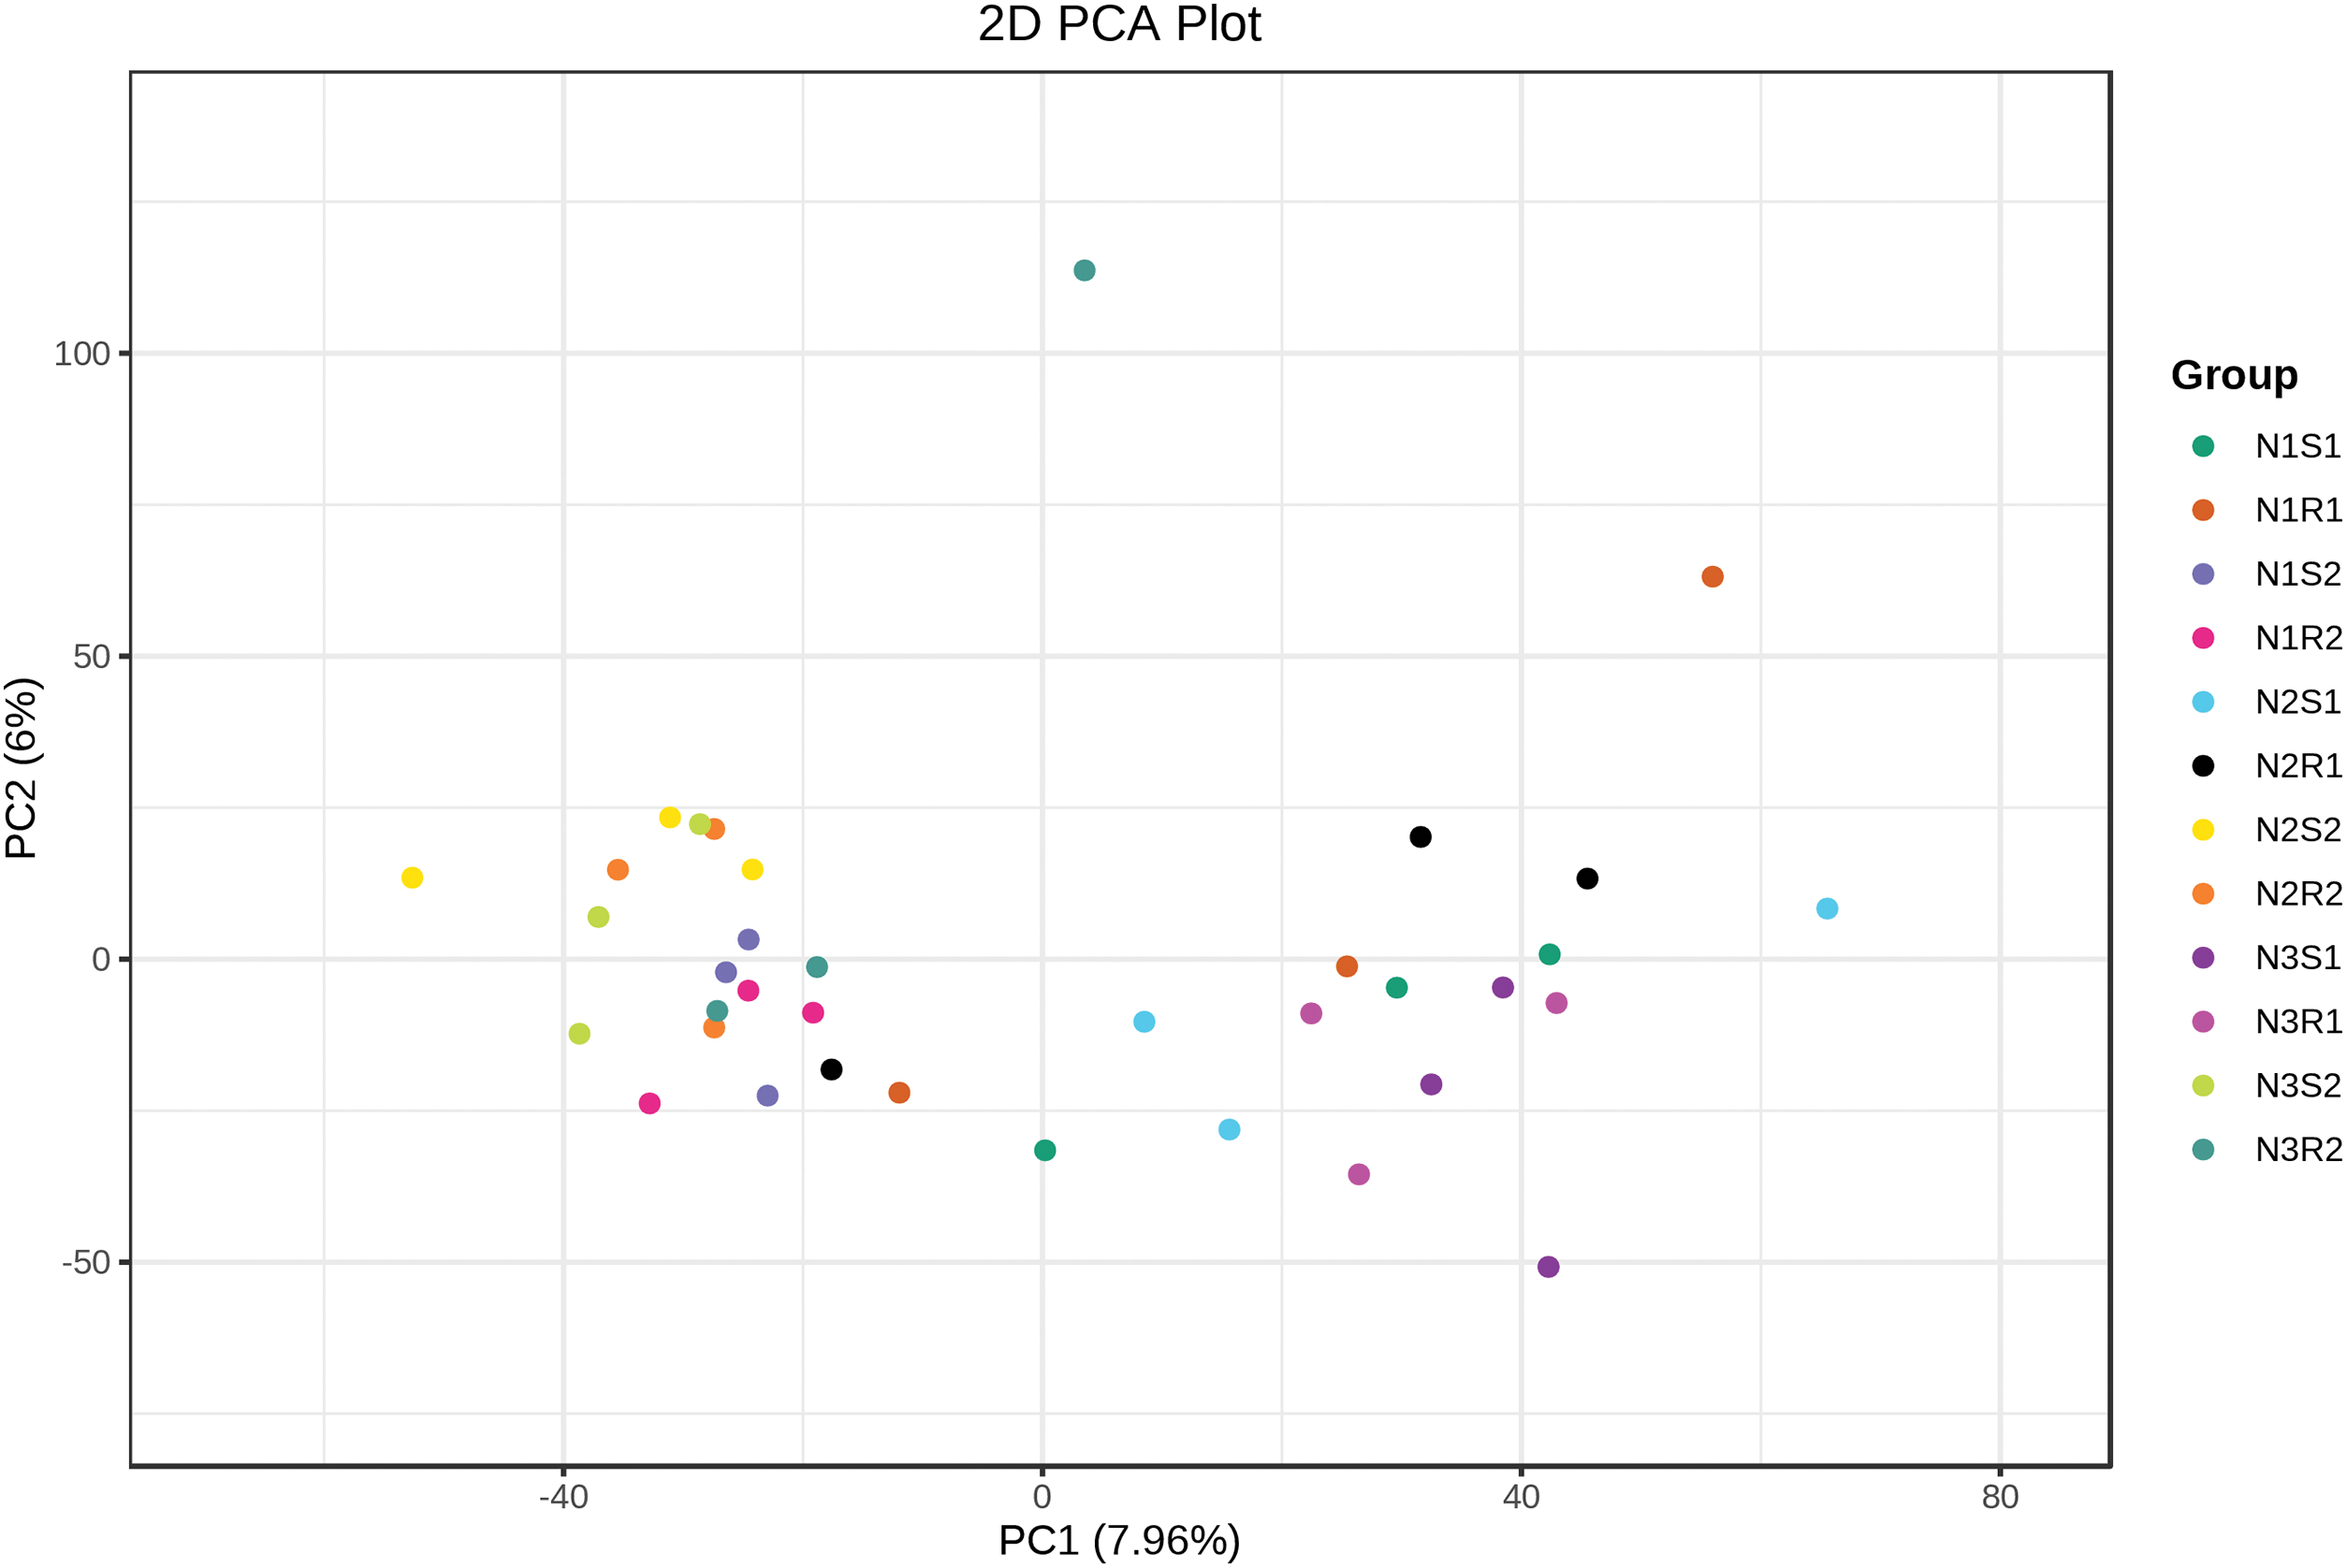
Figure 7: PCA on bacterial communities’ sequences taken from Goji berry plants in 0–20 and 20–40 cm layers supplemented with three different levels of nitrogen (N1R1 and N1S1; N1R2 and N1S2; N2R1 and N2S1; N2R2 and N2S2; N3R1 and N3S1; and N3R2 and N3S2)
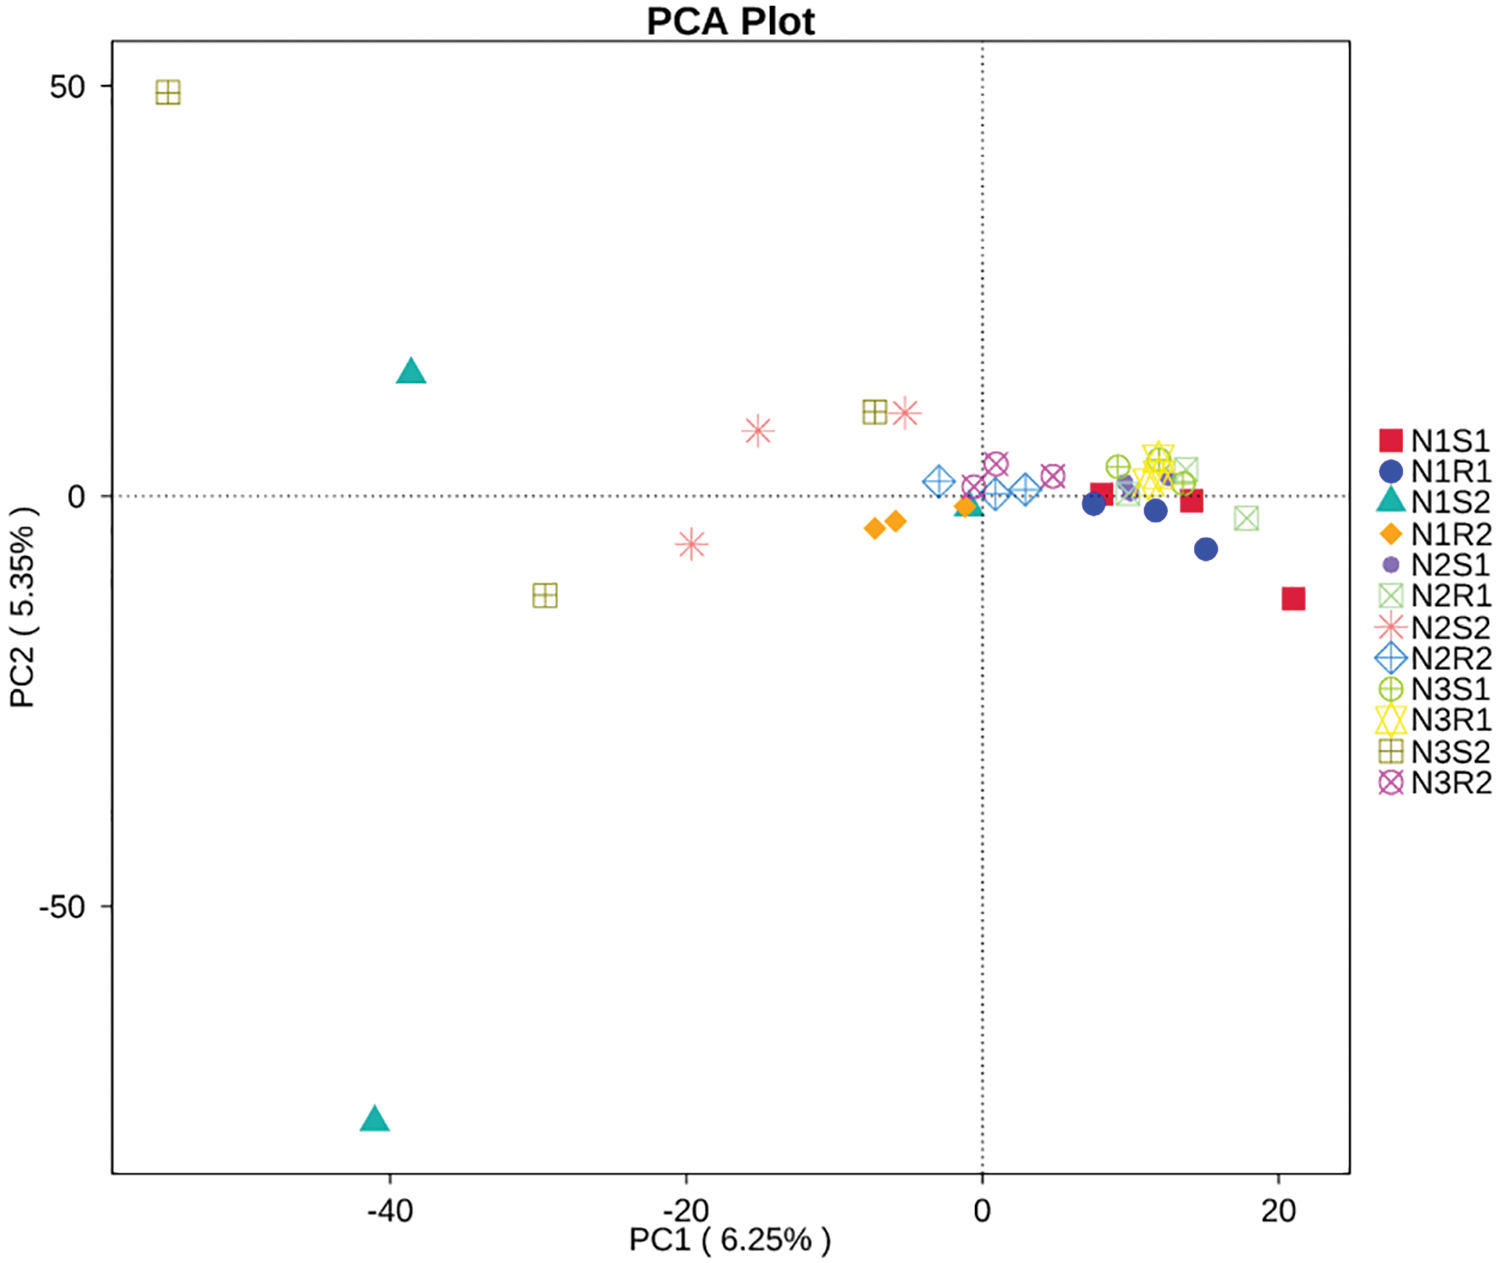
Figure 8: Principal component analysis (PCA) of fungal communities’ sequences taken from Goji berry plants in 0–20 and 20–40 cm layers supplemented with three different levels of nitrogen (N1R1 and N1S1; N1R2 and N1S2; N2R1 and N2S1; N2R2 and N2S2; N3R1 and N3S1; and N3R2 and N3S2)
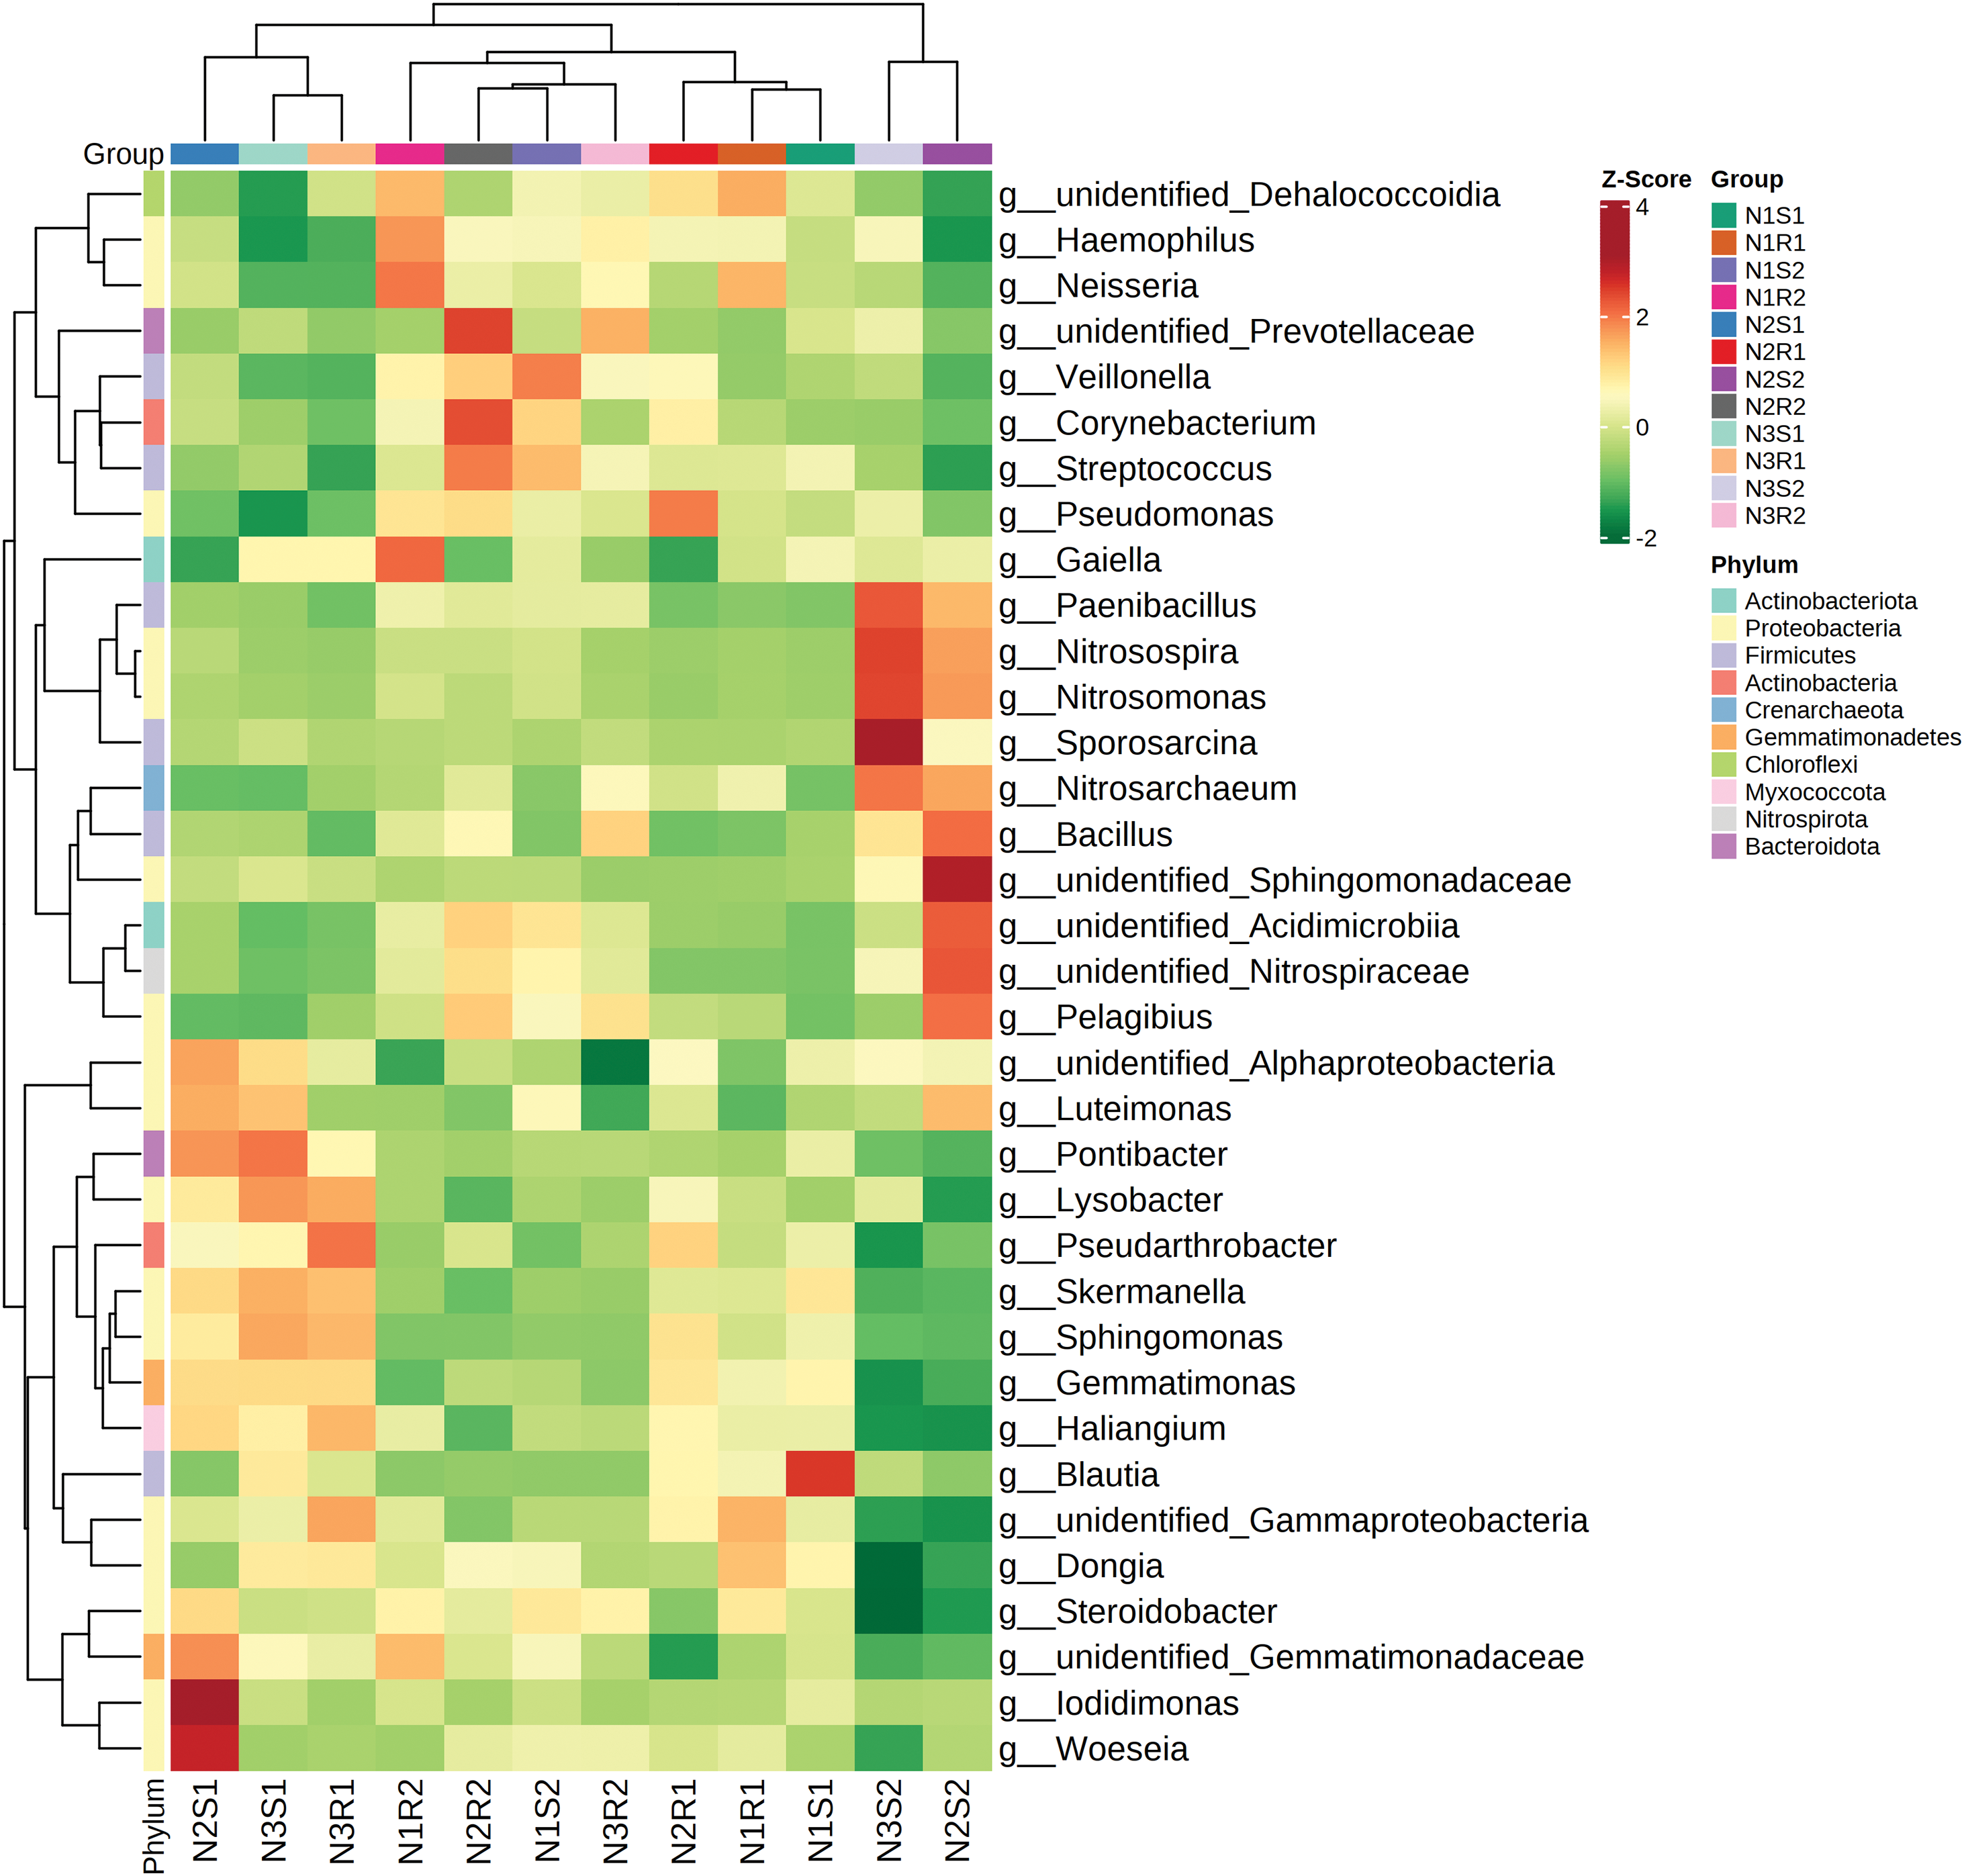
Figure 9: Heatmap of bacterial communities’ sequences at Genus level taken from Goji berry plants in 0–20 and 20–40 cm layers supplemented with three different levels of nitrogen (N1R1 and N1S1; N1R2 and N1S2; N2R1 and N2S1; N2R2 and N2S2; N3R1 and N3S1; and N3R2 and N3S2)
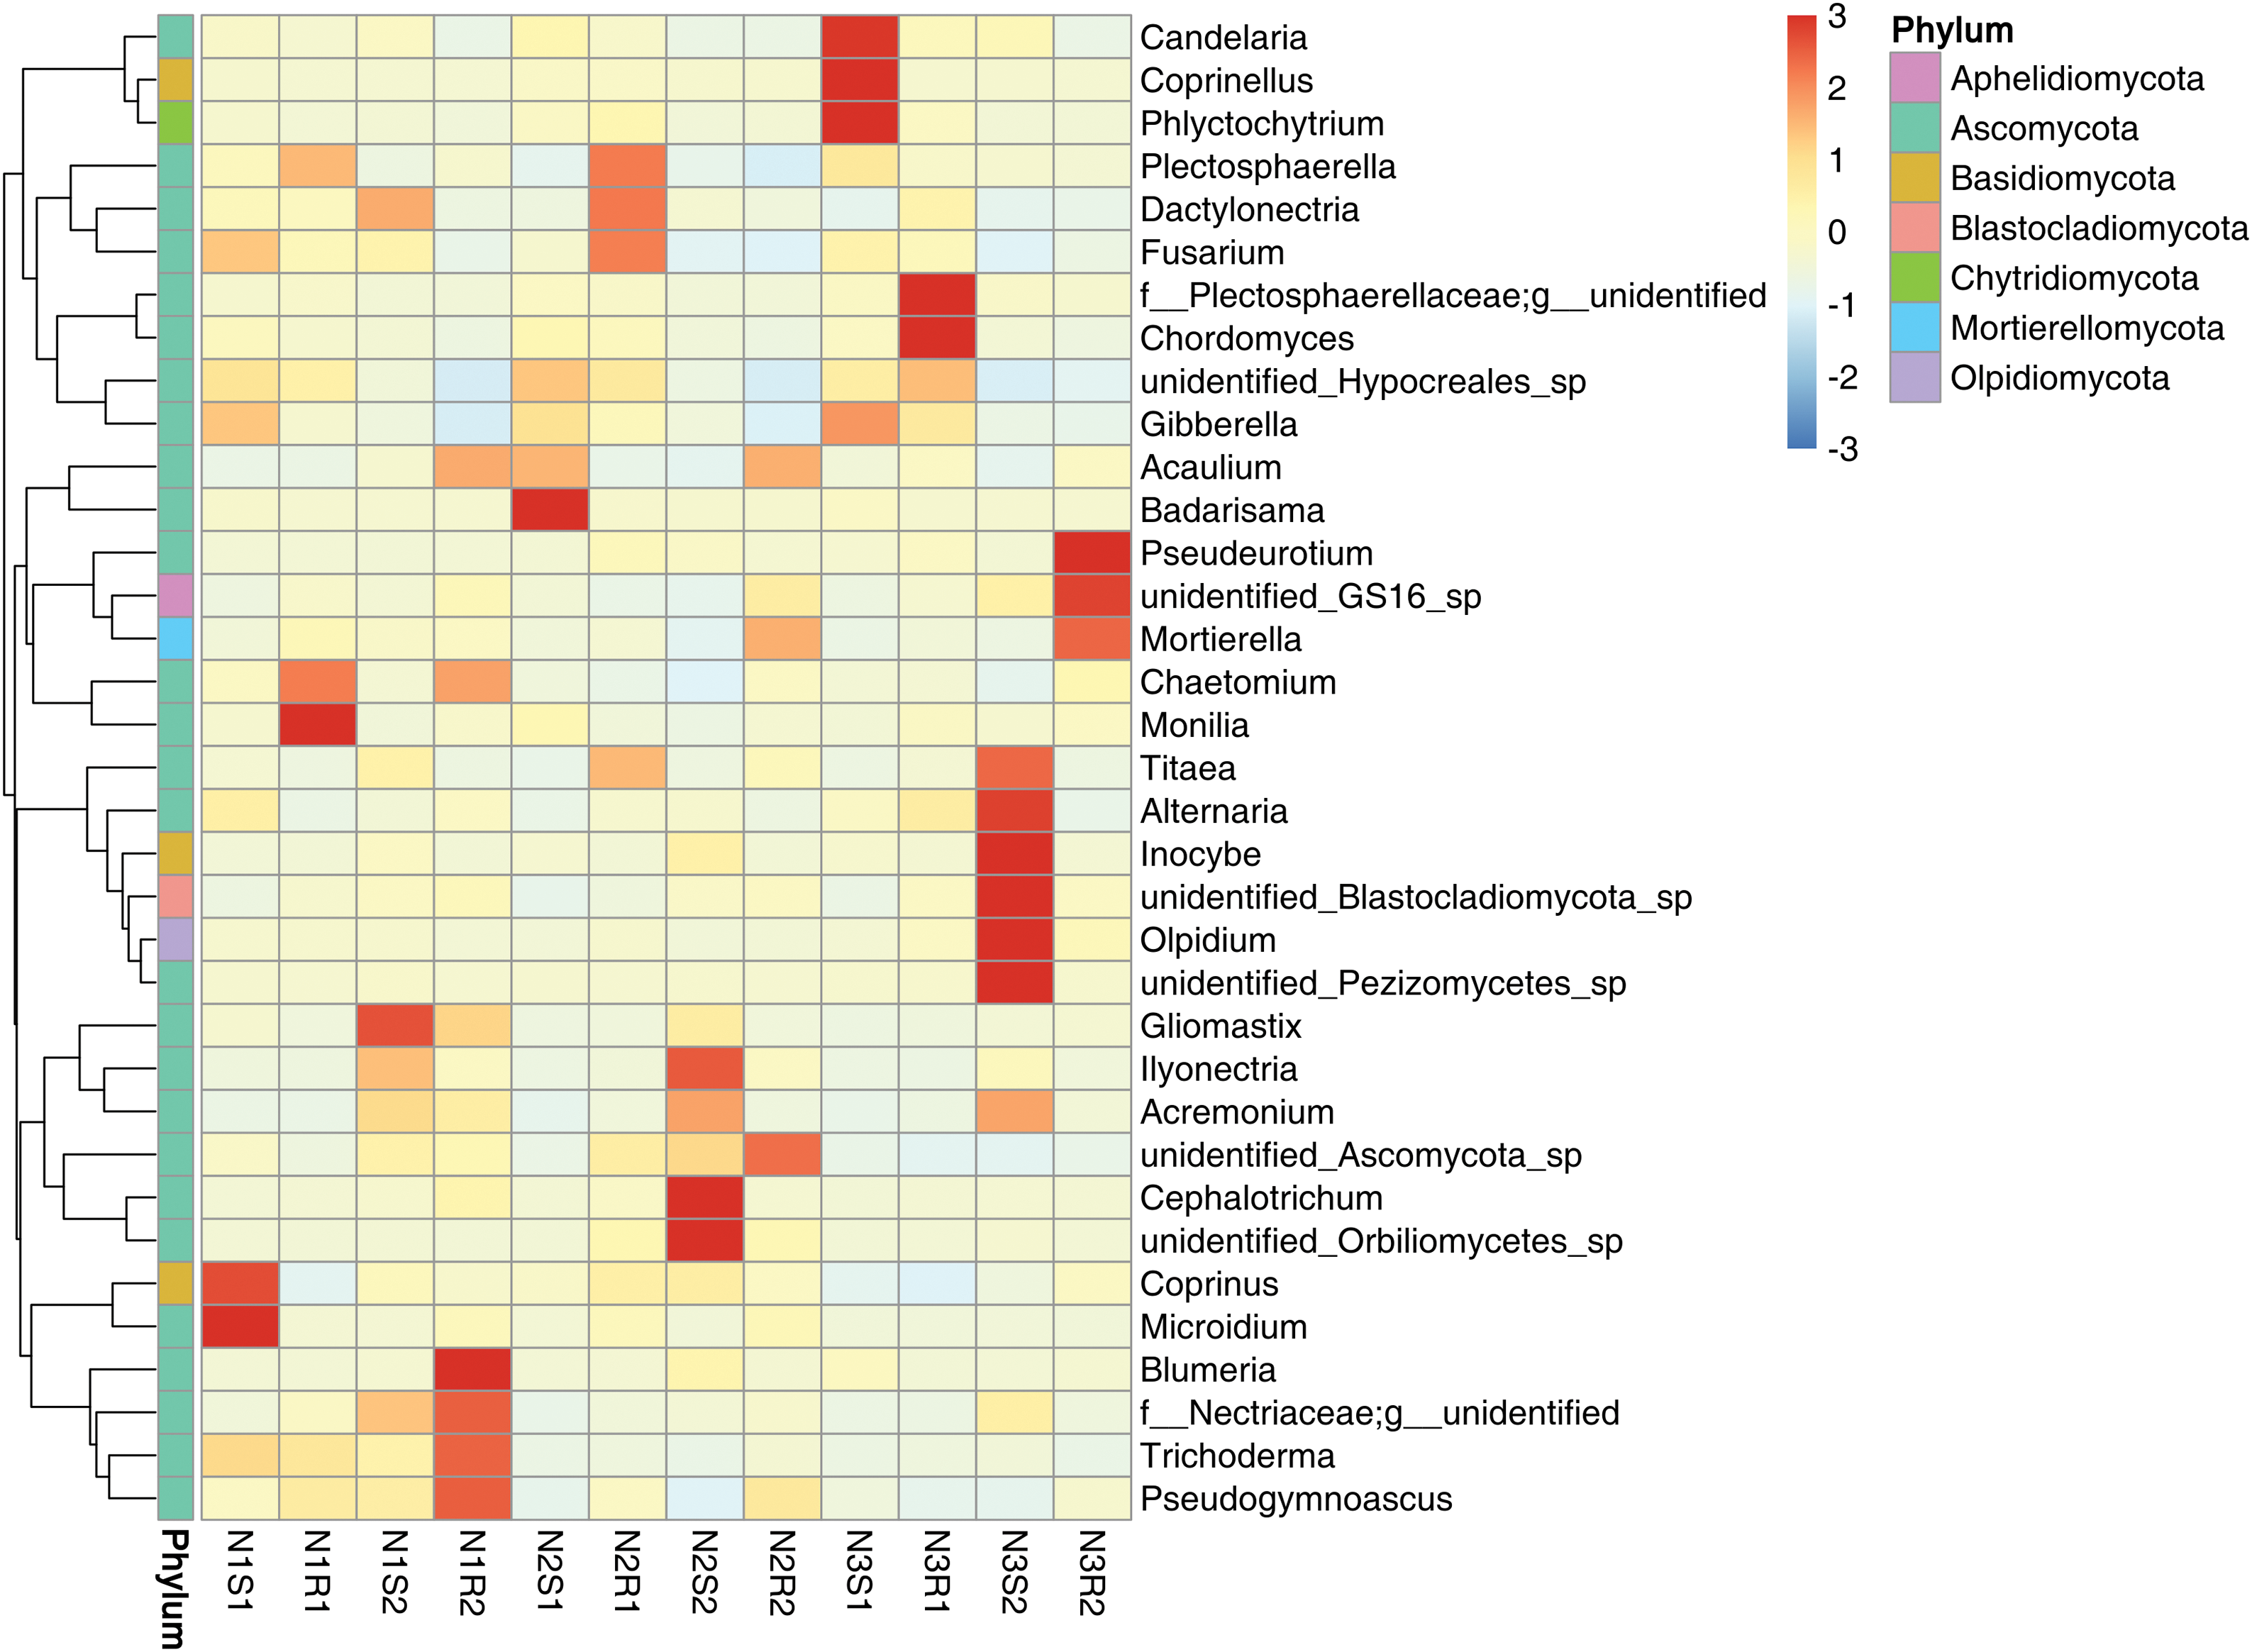
Figure 10: Heatmap of fungal communities’ sequences at genus level taken from Goji berry plants in 0–20 and 20–40 cm layers supplemented with three different levels of nitrogen (N1R1 and N1S1; N1R2 and N1S2; N2R1 and N2S1; N2R2 and N2S2; N3R1 and N3S1; and N3R2 and N3S2)
For fungal communities, the low nitrogen-supplemented group N1 had significant (p < 0.05) fungal genera N1S1: Microidium and Coprinus; N1R1: Monilia; N1R2: Blumeria; and N1S2: and Gliomastix (Fig. 10). Similarly, the medium nitrogen-supplemented group N2 had significant (p < 0.05) fungal genera N2S1: Badarisama; and N2S2: Cephalotrichum, unidentified_Orbiliomycetes_Sp, and llyonecteria. The high nitrogen-supplemented group N3 had significant (p < 0.05) fungal genera N3S1: Candelaria, Coprinellus, and Phlyctochytrium; N3S1: Chordomyces; N3S2: Olipidium, Inocybe, Alternaria; and N3R2: Pseudeurotium.
3.5 Functional Enrichment Analysis on Bacterial and Fungal Communities
Functional enrichment analysis on bacteria and communities was performed using the PICRUSt and FUNGuild databases, and is represented using a heatmap (Figs. 11 and 12). For bacterial communities, the low nitrogen-supplemented group N1 was not found enriched (p > 0.05) with any of the observed functions, whereas the medium nitrogen-supplemented group N2 was enriched (p < 0.05) with function N2S2: quorum sensing (Fig. 11). Similarly, it was found that high nitrogen-supplemented group N3 was enriched (p < 0.05) with different functions N3S2: cysteine and methionine metabolism and transcription machinery.
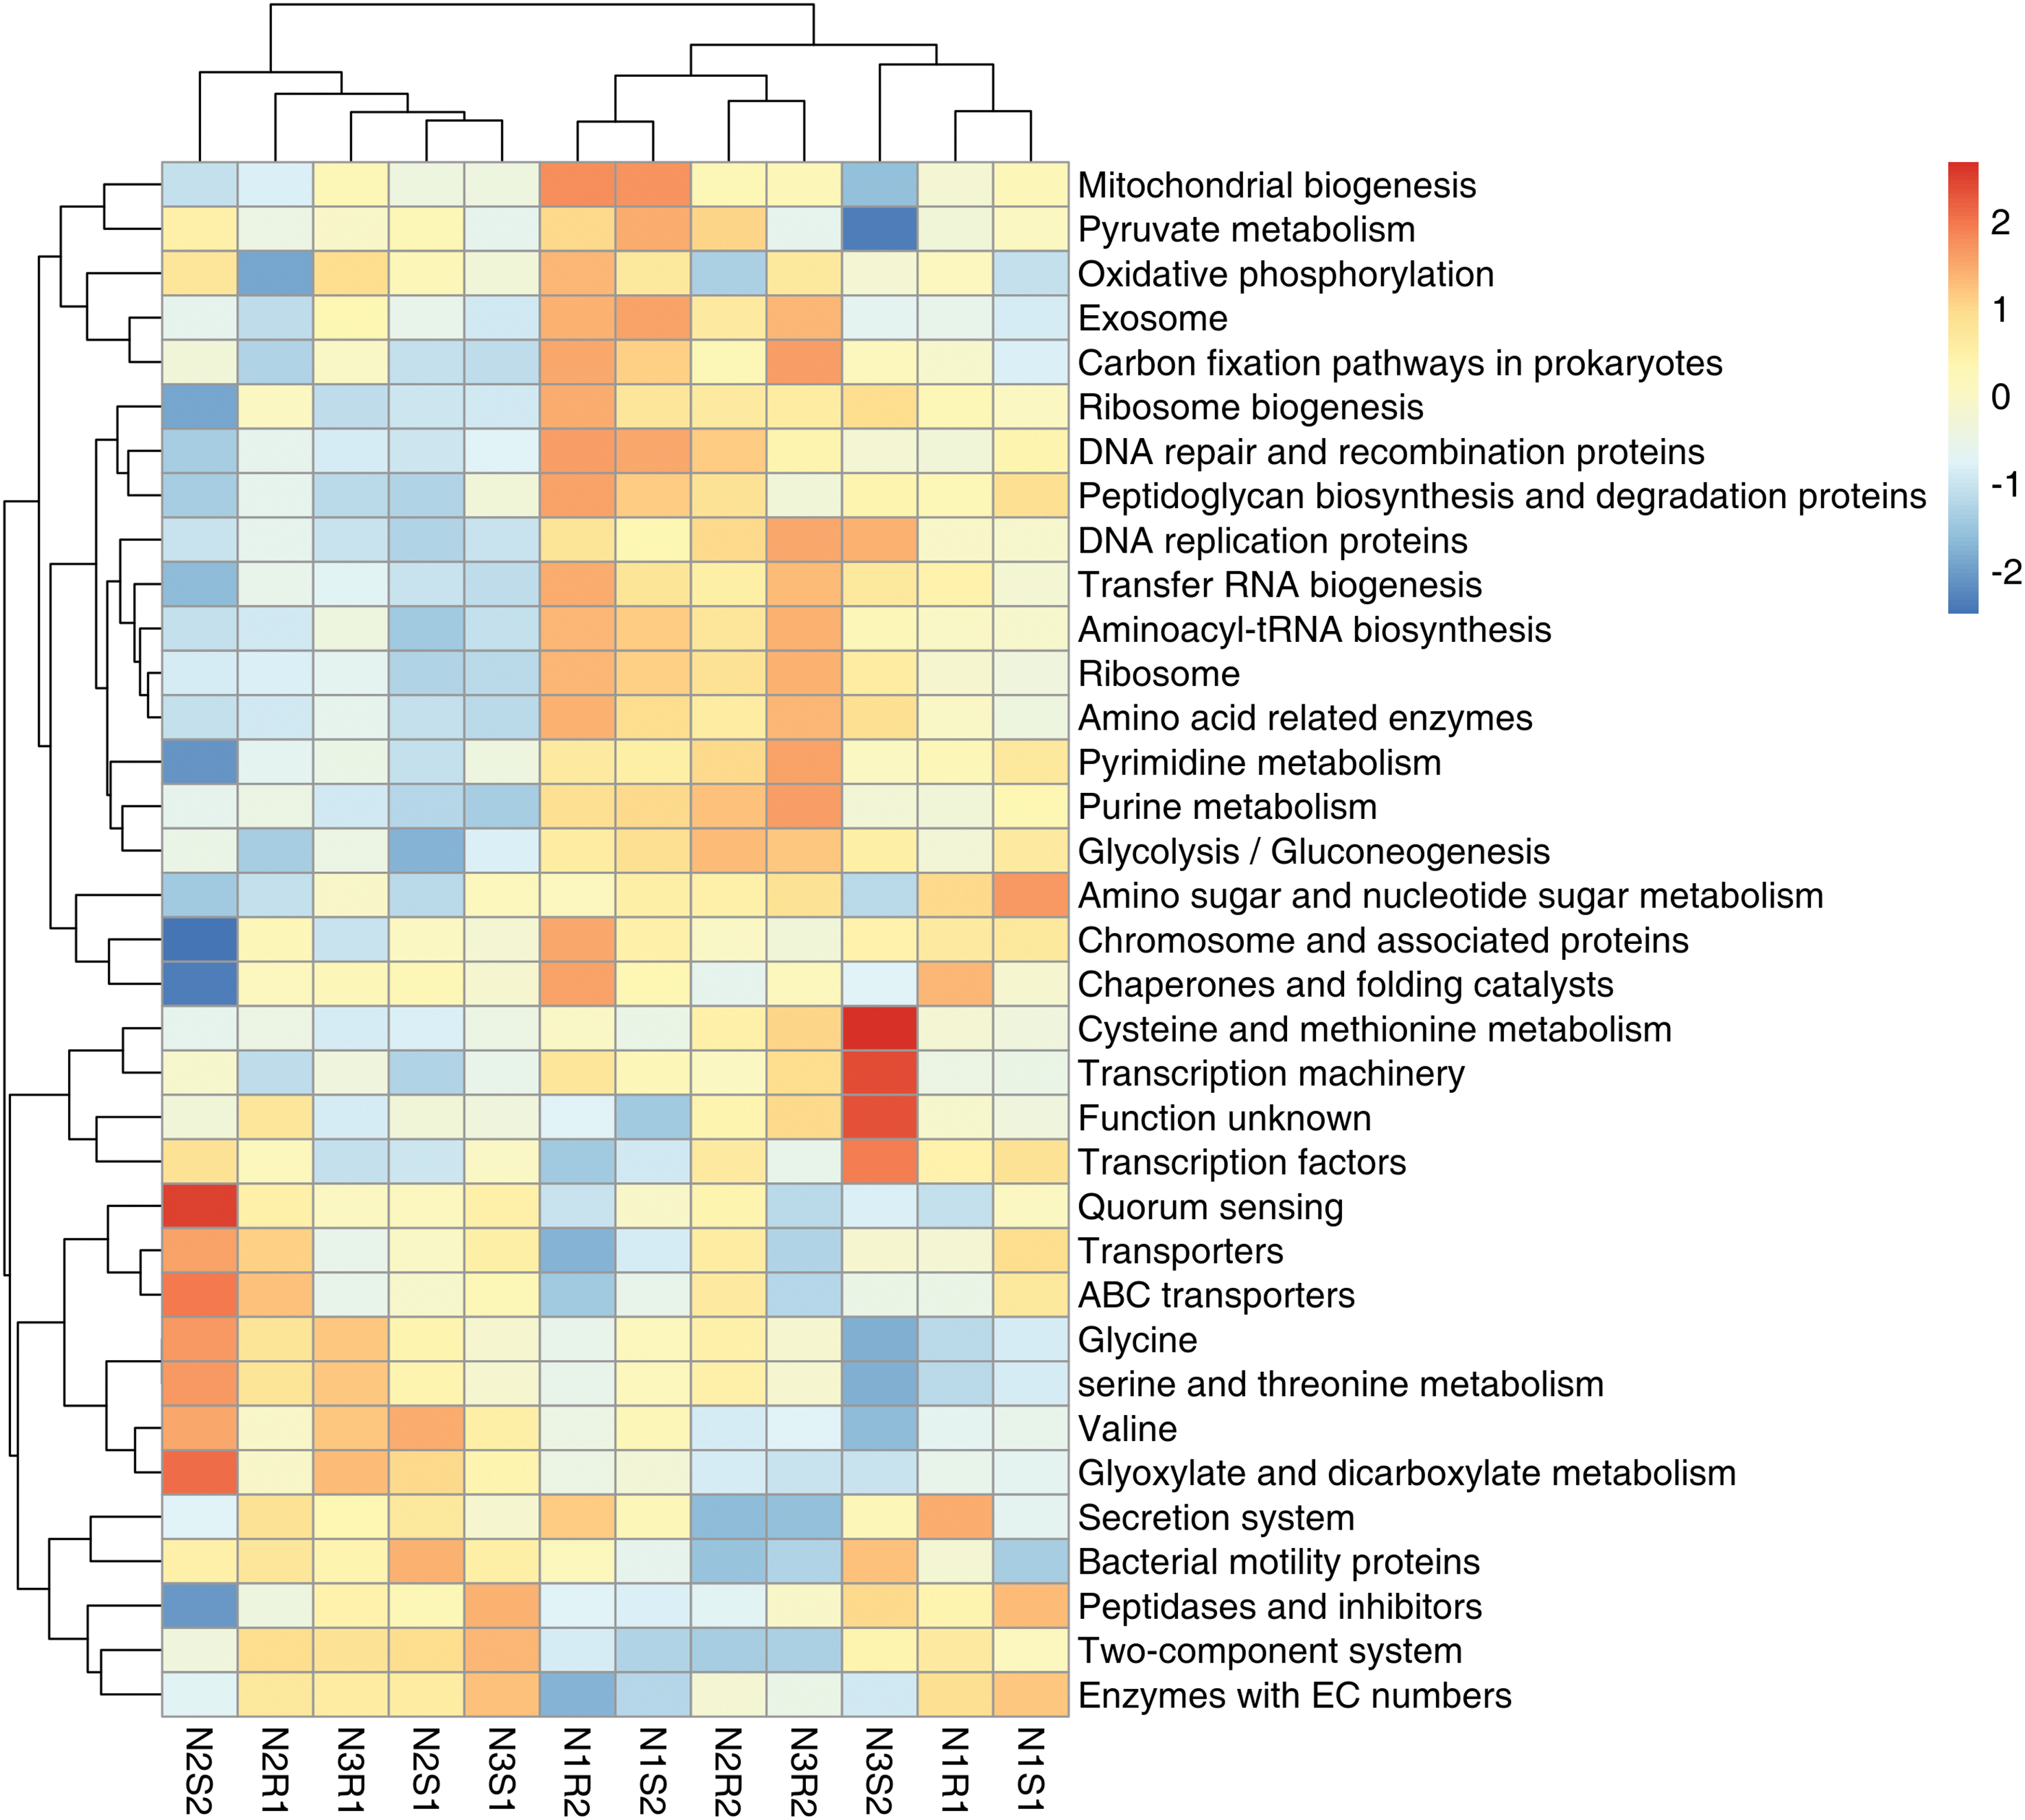
Figure 11: Functional enrichment analysis of bacterial communities’ sequences taken from Goji berry plants in 0–20 and 20–40 cm layers supplemented with three different levels of nitrogen (N1R1 and N1S1; N1R2 and N1S2; N2R1 and N2S1; N2R2 and N2S2; N3R1 and N3S1; and N3R2 and N3S2)
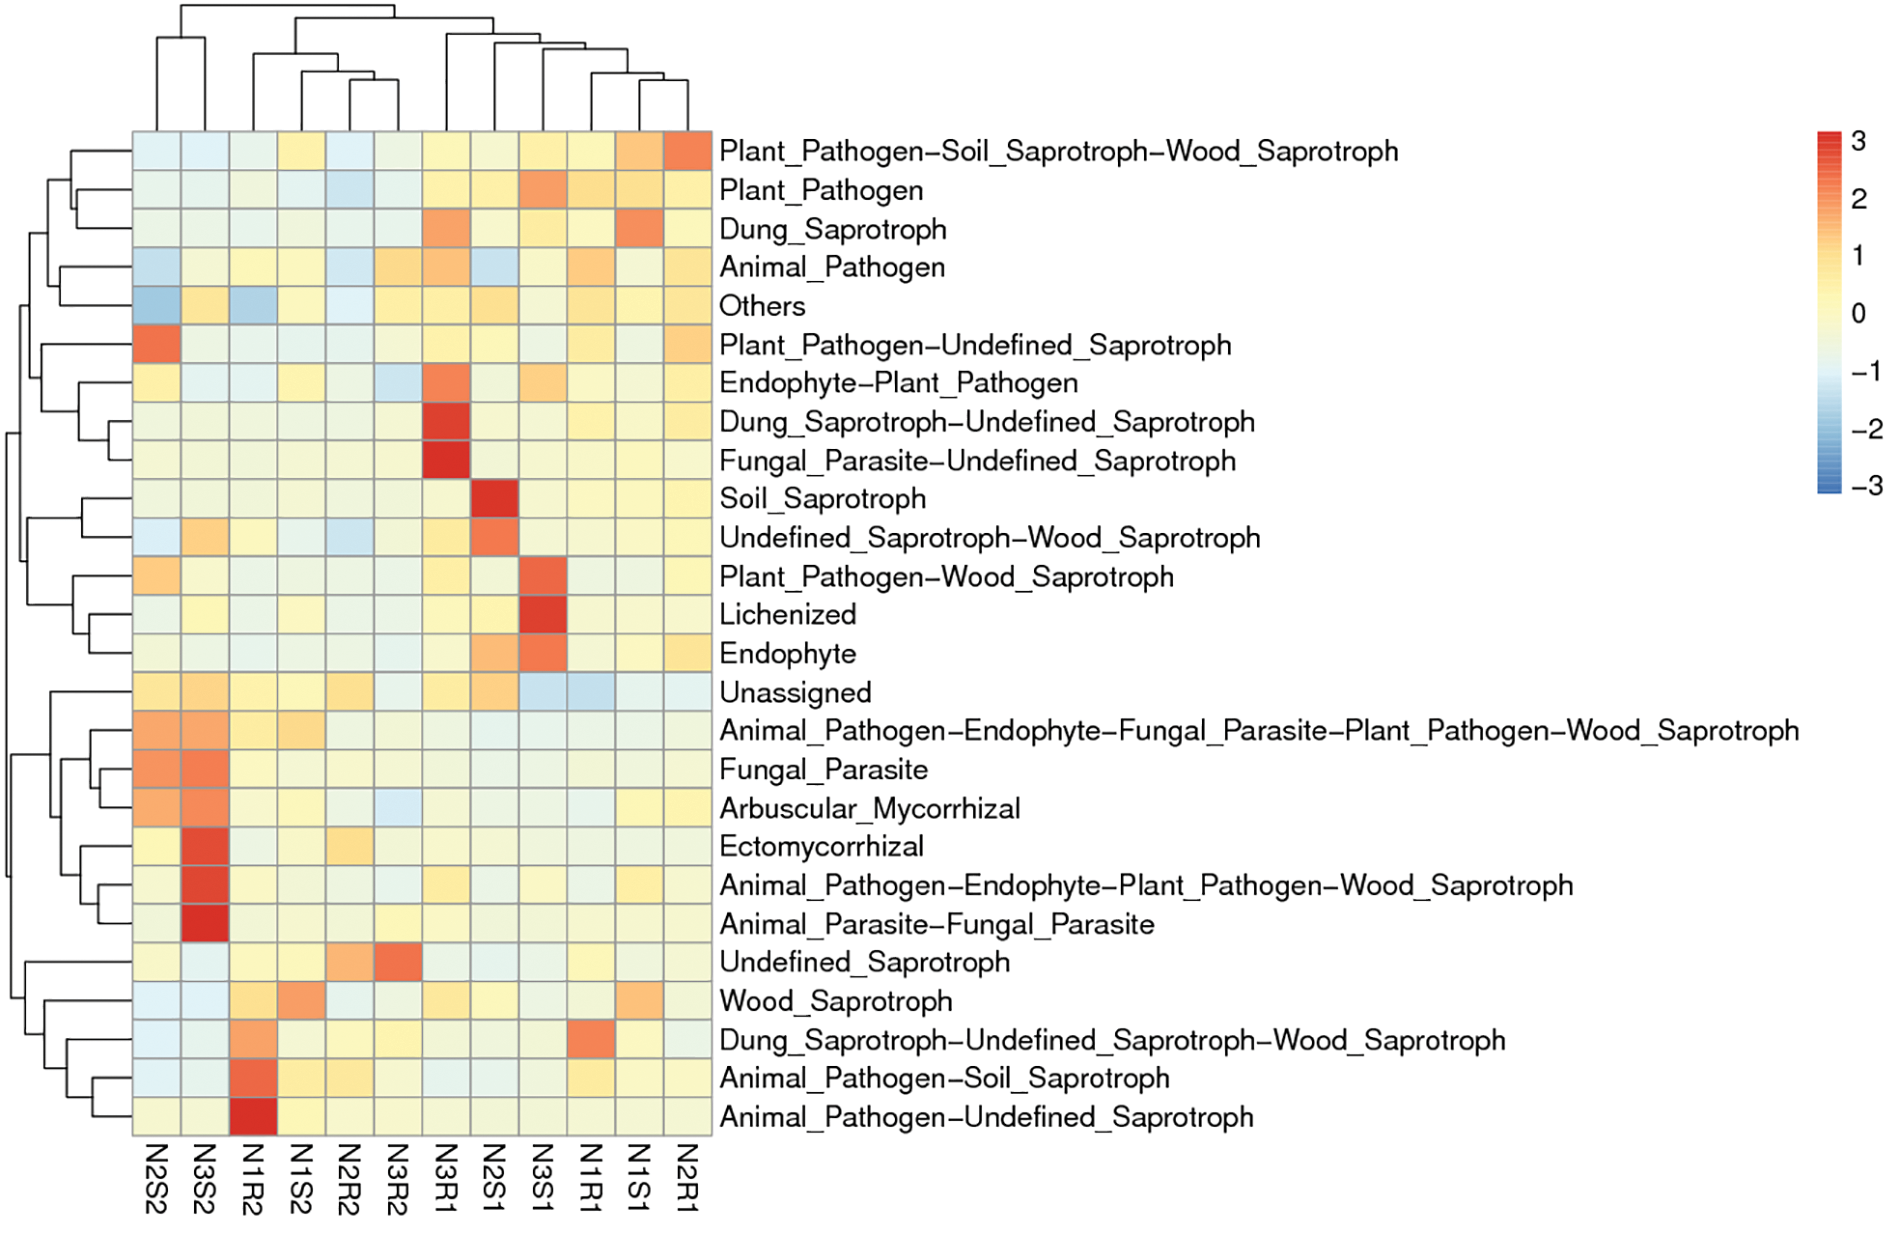
Figure 12: Functional enrichment analysis of fungal communities’ sequences taken from Goji berry plants in 0–20 and 20–40 cm layers supplemented with three different levels of nitrogen (N1R1 and N1S1; N1R2 and N1S2; N2R1 and N2S1; N2R2 and N2S2; N3R1 and N3S1; and N3R2 and N3S2)
For fungal communities, the low nitrogen-supplemented group N1 was enriched (p < 0.05) with function N1R2: Animal_Pathogen-Unidentified_Saprotraphs (Fig. 12). The medium nitrogen-supplemented group N2 was enriched (p < 0.05) with function N2S1: Soil_Saprotroph. Similarly, high nitrogen supplemented group N3 was enriched (p < 0.05) with different functions N3R1: Dung_Saprotroph-Unidentified_Saprotroph, and Fungal_Parasite-Unidentified_Saprotroph; N3S1: Lichenized; and N3S2: Ectomycorrhizal, Animal_Pathogen-Endophyte-Fungal_Parasite-Plant_Pathogen-Wood_Saprotroph, and Animal_Parasite-Fungal_Parasite).
Nitrogen is the key nutrient affecting crop development, production, and product quality [32]. For improved plant development, the nitrogen content of the soil can be raised by properly applying nitrogen fertilizer. In numerous investigations, how nitrogen fertilizer is absorbed and assimilated, and impacts plant growth, was examined [33]. However, excessive N use can cause negative impacts, such as water/soil acidification, contamination of groundwater-surface and additional water mineral resources, and increasing ozone depletion [9]. Previous studies indicate that excess N use can result in soil acidification [34,35]. Our study revealed that after two years of varying N application rates, the soil fertility parameters, including AN, AP, AK, and OM rose, and most of them showed the highest values at medium-level N application than the high-level (conventional rate) N application at both 0–20 and 20–40 cm depths. However, the pH of soil showed a decreasing trend with increased N application rates, and it could result in soil acidification if high N rates are applied for the longer term in the future as described previously [34,35]. Previously, a metanalysis study demonstrated that major soil chemical component causing the soil-borne diseases was a drop in soil pH [34]. The primary causes of the decline in soil pH value were phenolic acid accumulation and available nitrogen (AN) rise due to excessive nitrogen fertilizer application. Previous research has also shown the impacts of simulated N deposition on soil acidification [36,37]. Nevertheless, the degree of acidity varies significantly between case studies and ecosystems [14], probably because experimental durations and N treatments—like N-added dosage and N-fertilizer form—of the research vary. A small amount of N supplementation promotes plant absorption and development [38,39], while a large amount of N supplementation depletes base cations and causes nitrate loss, maybe causing soil acidification [40]. It is indicate that the amount of N added significantly affects soil acidity. In addition, effects of different N fertilizer types on soil acidity may differ. For example, the effects of acidification are anticipated to differ depending on the roles of NH4+ ion and NO3− anion derived from N-fertilizers. Therefore, base cations (Ca2+, Mg2+, K+, and Na+) that are bound to soil surface can be easily displaced by NH4+ ions, which decrease the soil’s ability to act as a buffer against acidification [41]. Furthermore, the H+ ion can be produced in soil solution and result in soil acidification if the NH4+ ion is taken up into plant roots [42]. However, based on charge balance in soil solutions, NO3− anions cause metal cation loss via leaching [43,44]. Based on one latest meta-analysis research, N application decreased soil base cations and had a decreased effect after five years [40]. Therefore, functions of N application in acidification probably change depending on the length of treatment, and appropriately decreasing application of urea or additional N-fertilizers contributes to improving sol N utilization rate as described in a previous study [45].
In agricultural environments, the soil is inhabited by various microorganisms, mainly bacteria, fungi, archaea, protozoa, and viruses [46,47]. These organisms are vital for soil N application and crop N uptake through promoting biogeochemical N cycling and plant N absorption [48]. However, the extensive application of synthetic fertilizers in agriculture can lead to the alteration of the soil microbial community structure [49,50]. In our study, metagenomic results did not indicate any significant alterations in microbial communities’ structure of top abundant phyla and genera. In addition, the heatmap was drawn to assess the significant genera among all groups of bacterial and fungal communities. Considering bacterial communities, low nitrogen-supplemented group N1 had significant bacterial genera N1S1: Blautia and N1R2: Gaiella. The genus, Gaiella is frequently found in a variety of environments, predominating in the rhizosphere, and is potentially involved in the higher nutrient availability, plant development, phytopathogen inhibition, and seed germination [51,52]. The medium nitrogen-supplemented group N2 possessed significant bacterial genera N2S1: Woeseia and Iodidimonas; N2R2: Corynebacterium and unidentified_Prevotellaceae; and N2S2: unidentified_Sphingomonadacease. Woeseia play a dominant role in soil rhizosphere and are involved in various biogeochemical processes [53]. Corynebacterium has been reported to be profoundly involved in nitrogen fixation and make it available to associated plants [54]. The high nitrogen-supplemented group N3 had significant bacterial genera N3S2: Sporosarcina. This specific bacterial genus is significantly efficient in the context of plant-soil interactions and also exhibits PGP (plant growth-promoting) activities [55,56]. For fungal communities, the low nitrogen supplemented group N1 had significant fungal genera N1S1: Microidium and Coprinus; N1R1: Monilia; N1R2: Blumeria; and N1S2: Gliomastix. Similarly, the medium nitrogen-supplemented group N2 had significant fungal genera N2S1: Badarisama; and N2S2: Cephalotrichum, unidentified_Orbiliomycetes_Sp, and llyonecteria. Previous studies showed that Coprinus is positively correlated with nitrogen levels and exerts an important effect on N release and plant growth promotion [57]. Furthermore, the high abundance of the Monilia genus in the rhizosphere has already been revealed in many crops serving as potential biocontrol agents [58,59]. Blumeria species are reported to function critically in the transient production of nitric oxide (NO) that makes plants hypersensitive and induces a defense response [60]. Cephalotrichum and Orbiliomycetes genera were shown to be most abundant in rhizosphere soil which is positively associated with increased nitrogen concentrations, NH4+-N [61,62]. The high nitrogen-supplemented group N3 had significant fungal genera N3S1: Candelaria, Coprinellus, and Phlyctochytrium; N3S1: Chordomyces; N3S2: Olipidium, Inocybe, Alternaria; and N3R2: Pseudeurotium. The significant abundance of Coprinellus genus in soil treated with high nitrogen levels has been in consistence with previous studies and directly influences microbial biomass nitrogen [63]. Inocybe is an important fungal genus that is beneficial for plants, found in nitrogen-enriched soil and generates ectomycorrhizal symbionts that are involved in water and nutrient exposure to plants [64]. The presence of the Alternaria genus in the higher nitrogen level group is also in line with the result reported previously that nitrogen application increases its relative abundance [65].
Functional enrichment analysis of bacterial and fungal communities showed differentially enriched functions that were associated with the above-mentioned differentially enriched genera in different N-supplemented groups. The low nitrogen-supplemented group N1 was not found enriched with any of the observed functions, whereas the medium nitrogen-supplemented group N2 was enriched with function N2S2: quorum sensing. The quorum sensing pathway is of importance for soil health and plant growth. It is involved in microbe-microbe association and also exhibits plant growth-promoting effects [66]. Similarly, high nitrogen-supplemented group N3 was demonstrated to be enriched with different functions N3S2: cysteine and methionine metabolism and transcriptional machinery. Previous studies also validated the cysteine and methionine metabolism enrichment pathway in the rhizosphere microbiome [67]. This pathway participates in amino acid metabolism, which is primarily affected by different nitrogen levels, as nitrogen is an important component of this pathway [68]. For the fungal communities, the low nitrogen-supplemented group N1 was enriched with the function N1R2: Animal_Pathogen-Unidentified_Saprotraphs, while the medium N-supplemented group N2 was enriched with the function N2S1: Soil_Saprotroph. These results confirmed the previously found functionally enriched pathways in the rhizosphere [69]. Saprotrophic fungi have continuous engagement in the search of fresh nutrients and are key agents for soil nutrient redistribution [70].
In our study, it was concluded that the N supplementation at varying levels improved soil physicochemical parameters, and most of them showed the maximum value at a medium level of N application. However, pH decreased gradually, which could result in soil acidification if high levels of N are used for longer periods. The top bacterial and fungal phyla and genera were not affected by increased levels of N; however, it was found that some differentially enriched bacteria and fungi could be involved in metabolism and saprotrophic functions. In brief, appropriately decreasing N-fertilizer application contributes to enhancing soil N utilization rate and can contribute to sustainable agriculture practices through improved soil quality, microbial community structure, and functions.
Acknowledgement: Not applicable.
Funding Statement: This work was funded by Ningxia Hui Autonomous Region Key Research and Development Project (2021BEF02004), Central Finance Forestry Reform and Development Fund “Forest Seed Cultivation”.
Author Contributions: Conceptualization, XL, SS; methodology, XL, WA; software, YL; validation, XL, WA, YL, YW, XQ; investigation, XL, WA, YL, YW, XQ, YC; data curation, XL, WA; writing—original draft preparation, XL; writing—review and editing, SS; visualization, YC; supervision, SS; project administration, SS; funding acquisition, YW, WA. All authors have read and agreed to the published version of the manuscript.
Availability of Data and Materials: All data used for this article are available within the text and its supplementary files.
Ethics Approval: Not applicable.
Conflicts of Interest: The authors declare no conflict of interest.
Supplementary Materials: The supplementary material is available online at https://doi.org/10.32604/phyton.2024.047628.
References
1. Gong H, Rehman F, Ma Y, Zeng S, Yang T, Huang J, et al. Germplasm resources and strategy for genetic breeding of lycium species: a review. Front Plant Sci. 2022;13:802936. [Google Scholar] [PubMed]
2. Amagase H, Farnsworth NR. A review of botanical characteristics, phytochemistry, clinical relevance in efficacy and safety of Lycium Barbarum fruit (Goji). Food Res Int. 2011;44:1702–17. [Google Scholar]
3. Wang F, Li W, Lin Y, Nan X, Yuan J. Soil organic carbon pool and the production of goji berry (Lycium Barbarum L.) as affected by different fertilizer combinations under drip fertigation. Front Environ Sci. 2022;10:933124. [Google Scholar]
4. Li X, Guo H, Zhu Z, Dong H, Yang L, et al. Effects of different straw return modes on contents of soil organic carbon and fractions of soil active carbon. Trans Chin Soc Agric Eng. 2016;32:130–5. [Google Scholar]
5. Waqar A, Hira K, Ullah B, Khan A, Shah Z, Khan FA, et al. Role of nitrogen fertilizer in crop productivity and environmental pollution. Int J Agric For. 2014;4:201–6. [Google Scholar]
6. LeBauer DS, Treseder KK. Nitrogen limitation of net primary productivity in terrestrial ecosystems is globally distributed. Ecology. 2008;89:371–9. [Google Scholar] [PubMed]
7. Cleland EE, Harpole WS. Nitrogen enrichment and plant communities. Ann N Y Acad Sci. 2010;1195:46–61. [Google Scholar] [PubMed]
8. Clark CM, Cleland EE, Collins SL, Fargione JE, Gough L, et al. Environmental and plant community determinants of species loss following nitrogen enrichment. Ecol Lett. 2007;10:596–607. [Google Scholar] [PubMed]
9. Bashir, M. T., Ali, S., Ghauri, M., Adris, A., Harun, R. (2013). Impact of excessive nitrogen fertilizers on the environment and associated mitigation strategies. Asian J Microbiol Biotechnol Environ Sci, 15, 213–21. [Google Scholar]
10. Campbell BJ, Polson SW, Hanson TE, Mack MC, Schuur EA. The effect of nutrient deposition on bacterial communities in arctic tundra soil. Environ Microbiol. 2010;12:1842–54. [Google Scholar] [PubMed]
11. Wessén E, Hallin S, Philippot L. Differential responses of bacterial and archaeal groups at high taxonomical ranks to soil management. Soil Biol Biochem. 2010;42:1759–65. [Google Scholar]
12. Fukami T, Dickie IA, Paula Wilkie J, Paulus BC, Park D, Roberts A, et al. Assembly history dictates ecosystem functioning: evidence from wood decomposer communities. Ecol Lett. 2010;13:675–84. [Google Scholar] [PubMed]
13. Strickland, M. S., Rousk, J. Considering fungal: bacterial dominance in soils-methods, controls, and ecosystem implications. Soil Biol Biochem. 2010;42:1385–95. [Google Scholar]
14. Lu M, Yang Y, Luo Y, Fang C, Zhou X, Chen J, et al. Responses of ecosystem nitrogen cycle to nitrogen addition: a meta-analysis. New Phytol. 2011;189:1040–50. [Google Scholar] [PubMed]
15. Shi Z, Wei F, Wan R, Li Y, Wang Y, et al. Impact of nitrogen fertilizer levels on metabolite profiling of the Lycium barbarum L. Fruit Mol. 2019;24:3879. [Google Scholar]
16. Wang X, Xu X, Lu A, Li X, Zhang F. Cultivation of two barnyard varieties improves physicochemical properties of saline-alkali land through mediating rhizospheric microbiome and metabolome. Agronomy. 2022;12:1322. [Google Scholar]
17. Qin J, Kong H, Liu H. Stoichiometric characteristics of soil C, N, P and K in different Pinus massoniana forests. J Northwest A&F Univ Nat Sci Edition. 2016;44(2):68–82. [Google Scholar]
18. Lu R. Soil agrochemical analysis method. Beijing, China: China Agricultural Science and Technology Press; 1999. [Google Scholar]
19. NY/T 1121.24–2012. Soil testing—part 24: determination of total nitrogen in soil—automatic kjeldahl apparatus method. Beijing, China: Agricultural Industry Standards of People’s Republic of China; 2012. [Google Scholar]
20. Pamberton, H. Estimation of total phosphorus. J Amer Chem Soc. 1945;15:383–95. [Google Scholar]
21. Watanabe FS, Olsen SR. Ascorbic acid method for dertermination of phosphorus in water extracts from soil. Proc Soil Sci Soc Am Proc. 1965;29:677–8. [Google Scholar]
22. Dodor DE, Tabatabai MA. A simple alkaline hydrolysis method for estimating nitrogen mineralization potential of soils. West Afr J Appl Ecol. 2019;27:16–31. [Google Scholar]
23. Fu ZY, Song JC, Jameson PE. A rapid and cost effective protocol for plant genomic DNA isolation using regenerated silica columns in combination with CTAB extraction. J Integr Agric. 2017;16:1682–8. [Google Scholar]
24. Caporaso JG, Lauber CL, Walters WA, Berg-Lyons D, Huntley J, Fierer N, et al. Ultra-high-throughput microbial community analysis on the illumina HiSeq and MiSeq platforms. ISME J. 2012;6:1621–4. [Google Scholar] [PubMed]
25. Gardes M, Bruns TD. ITS primers with enhanced specificity for basidiomycetes-application to the identification of mycorrhizae and rusts. Mol Ecol. 1993;2:113–8. doi:10.1111/j.1365-294x.1993.tb00005.x. [Google Scholar] [PubMed] [CrossRef]
26. Bolger AM, Lohse M, Usadel B. Trimmomatic: a flexible trimmer for illumina sequence data. Bioinform. 2014;30:2114–20. doi:10.1093/bioinformatics/btu170. [Google Scholar] [PubMed] [CrossRef]
27. Magoč T, Salzberg SL. FLASH: fast length adjustment of short reads to improve genome assemblies. Bioinformatics. 2011;27:2957–63. [Google Scholar] [PubMed]
28. Edgar RC, Haas BJ, Clemente JC, Quince C, Knight R. UCHIME improves sensitivity and speed of chimera detection. Bioinformatics. 2011;27:2194–200. doi:10.1093/bioinformatics/btr381. [Google Scholar] [PubMed] [CrossRef]
29. Edga RC. UPARSE: highly accurate OTU sequences from microbial amplicon reads. Nat Methods. 2013;10:996–8. [Google Scholar]
30. Abarenkov K, Nilsson RH, Larsson KH, Alexander IJ, Eberhardt U, et al. The UNITE database for molecular identification of fungi-recent updates and future perspectives. New Phytol. 2010;186:281–5. [Google Scholar] [PubMed]
31. Edgar RC. MUSCLE: multiple sequence alignment with high accuracy and high throughput. Nucleic Acids Res. 2004;32:1792–7. doi:10.1093/nar/gkh340. [Google Scholar] [PubMed] [CrossRef]
32. Chung RS, Chen CC, Ng LT. Nitrogen fertilization affects the growth performance, betaine and polysaccharide concentrations of lycium barbarum. Ind Crops Prod. 2010;32:650–5. [Google Scholar]
33. Kaplan M, Karaman K, Kardes YM, Kale H. Phytic acid content and starch properties of maize (Zea Mays L.effects of irrigation process and nitrogen fertilizer. Food Chem. 2019;283:375–80. [Google Scholar] [PubMed]
34. Zhang Y, Ye C, Su Y, Peng W, Lu R, Liu Y, et al. Soil acidification caused by excessive application of nitrogen fertilizer aggravates soil-borne diseases: evidence from literature review and field trials. Agric Ecosyst Environ. 2022;340:108176. [Google Scholar]
35. Liang LZ, Zhao XQ, Yi XY, Chen ZC, Dong XY, Chen RF, et al. Excessive application of nitrogen and phosphorus fertilizers induces soil acidification and phosphorus enrichment during vegetable production in Yangtze River Delta, China. Soil Use Manag. 2013;29:161–8. [Google Scholar]
36. Horswill P, O’Sullivan O, Phoenix GK, Lee JA, Leake JR. Base cation depletion, eutrophication and acidification of species-rich grasslands in response to long-term simulated nitrogen deposition. Environ Pollut. 2008;155:336–49. [Google Scholar] [PubMed]
37. Hoegberg P, Fan H, Quist M, Binkley DA, Tamm CO. Tree growth and soil acidification in response to 30 years of experimental nitrogen loading on boreal forest. Glob Chang Biol. 2006;12:489–99. [Google Scholar]
38. Nohrstedt HÖ. Response of coniferous forest ecosystems on mineral soils to nutrient additions: a review of swedish experiences. Scand J For Res. 2001;16:555–73. [Google Scholar]
39. Bai Y, Wu J, Clark CM, Naeem S, Pan Q, et al. Tradeoffs and thresholds in the effects of nitrogen addition on biodiversity and ecosystem functioning: evidence from inner mongolia grasslands. Glob Chang Biol. 2010;16:358–72. [Google Scholar]
40. Lucas RW, Klaminder J, Futter MN, Bishop KH, Egnell G, Laudon H, et al. A meta-analysis of the effects of nitrogen additions on base cations: implications for plants, soils, and streams. For Ecol Manage. 2011;262:95–104. [Google Scholar]
41. Matschonat G, Matzne E. Soil chemical properties affecting NH4+ sorption in forest soils. Zeitschrift für Pflanzenernährung und Bodenkd. 1996;159:505–11. [Google Scholar]
42. Smith SE, Read DJ. Mycorrhizal symbiosis. San Diego, CA: Academic; 2008. [Google Scholar]
43. Rothwell JJ, Futter MN, Dise NB. A classification and regression tree model of controls on dissolved inorganic nitrogen leaching from European forests. Environ Pollut. 2008;156:544–52. [Google Scholar] [PubMed]
44. Gundersen P, Schmidt IK, Raulund-Rasmussen K. Leaching of nitrate from temperate forests effects of air pollution and forest management. Environ Rev. 2006;14:1–57. [Google Scholar]
45. Li Y, Zou N, Liang X, Zhou X, Guo S, Wang Y, et al. Effects of nitrogen input on soil bacterial community structure and soil nitrogen cycling in the rhizosphere soil of Lycium Barbarum L. Front Microbiol. 2023;13:1070817. [Google Scholar] [PubMed]
46. Canfield DE, Glazer AN, Falkowski PG. The evolution and future of earth’s nitrogen cycle. Science. 2010;330:192–6. [Google Scholar] [PubMed]
47. Philippot L, Raaijmakers JM, Lemanceau P, van der Putten WH. Going back to the roots: the microbial ecology of the rhizosphere. Nat Rev Microbiol. 2013;11:789–99. [Google Scholar] [PubMed]
48. Peng N, Oladele O, Song X, Ju X, Jia Z, Hu H, et al. Opportunities and approaches for manipulating soil-plant microbiomes for effective crop nitrogen use in agroecosystems. Front Agric Sci Eng. 2022;9:333–43. [Google Scholar]
49. Li BB, Roley SS, Duncan DS, Guo J, Quensen JF, Yu HQ, et al. Excess nitrogen fertilizer increases sensitivity of soil microbial community to seasonal change revealed by ecological network and metagenome analyses. Soil Biol Biochem. 2021;160:108349. [Google Scholar]
50. Wang L, Xin J, Nai H, Zheng X. Effects of different fertilizer applications on nitrogen leaching losses and the response in soil microbial community structure. Environ Technol Innov. 2021;23:101608. [Google Scholar]
51. Lee SA, Kim HS, Sang MK, Song J, Weon HY. Effect of Bacillus mesonae H20-5 treatment on rhizospheric bacterial community of tomato plants under salinity stress. Plant Pathol J. 2021;37:662–72. [Google Scholar] [PubMed]
52. Zhang MX, Zhao LY, Hu JP, Khan A, Yang XX, Dong QM, et al. Different grazers and grazing practices alter the growth, soil properties, and rhizosphere soil bacterial communities of Medicago Ruthenica in the Qinghai-Tibetan plateau grassland. Agric Ecosyst Environ. 2023;352:108522. [Google Scholar]
53. Liu, Y, Guo, Z, Zhang, P, Du, J, Gao, P, Zhang Z, et al. Diversity and structure of vegetation rhizosphere bacterial community in various habitats of Liaohekou coastal wetlands. Sustain. 2022;14:16396. [Google Scholar]
54. Yadav AN, Verma P, Kumar S, Kumar V, Kumar M, Sugitha TC, et al. Actinobacteria from rhizosphere: molecular diversity, distributions, and potential biotechnological applications. In: New and future developments in microbial biotechnology and bioengineering. Netherlands: Elsevier; 2018. p. 13–41. [Google Scholar]
55. Tahtamouni ME, Khresat S, Lucero M, Sigala J, Unc A. Diversity of endophytes across the soil-plant continuum for atriplex spp. in arid environments. J Arid Land. 2016;8:241–53. [Google Scholar]
56. Yadav AN, Verma P, Sachan SG, Kaushik R, Saxena AK. Psychrotrophic microbiomes: molecular diversity and beneficial role in plant growth promotion and soil health. In: Microorganisms for green revolution. Microorganisms for sustainability. Agro-ecosystem. Berlin, Germany: Springer; 2018. p. 197–240. [Google Scholar]
57. Di H, Wang R, Ren X, Deng J, Deng X, et al. Co-composting of fresh tobacco leaves and soil: an exploration on the utilization of fresh tobacco waste in farmland. Environ Sci Pollut Res. 2022;29:8191–204. [Google Scholar]
58. Marfetán JA, Greslebin AG, Taccari LE, Vélez ML. Rhizospheric microorganisms as potential biocontrol agents against phytophthora austrocedri. Eur J Plant Pathol. 2020;158:721–32. [Google Scholar]
59. Abd El-Fattah RI, Abou-Zeid AM, Altalhi AD. Allelopathic effects of artemisia princeps and launae sonchoids on rhizospheric fungi and wheat growth. Afr J Microbiol Res. 2011;5:419–24. [Google Scholar]
60. Shah S, Chen C, Sun Y, Wang D, Nawaz T, et al. Mechanisms of nitric oxide involvement in plant-microbe interaction and its enhancement of stress resistance. Plant Stress. 2023;10(5):100191. [Google Scholar]
61. Zhang L, Su X, Meng H, Men Y, Liu C, et al. Cotton stubble return and subsoiling alter soil microbial community, carbon and nitrogen in coastal saline cotton fields. Soil Tillage Res. 2023;226:105585. [Google Scholar]
62. Zhao C, Ni H, Zhao L, Zhou L, Borrás-Hidalgo O, Cui R. High nitrogen concentration alter microbial community in allium fistulosum rhizosphere. PLoS One. 2020;15:e0241371. [Google Scholar] [PubMed]
63. Yao R, Yang J, Zhu W, Li H, Yin C, Jing Y, et al. Impact of crop cultivation, nitrogen and fulvic acid on soil fungal community structure in salt-affected alluvial fluvo-aquic soil. Plant Soil. 2021;464:539–58. [Google Scholar]
64. Song Y, Sun L, Wang H, Zhang S, Fan K, Mao Y, et al. Enzymatic fermentation of rapeseed cake significantly improved the soil environment of tea rhizosphere. BMC Microbiol. 2023;23:1–17. [Google Scholar]
65. Xing M, Zhang Y, Guan C, Guan M. Effects of nitrogen application rate on rhizosphere microbial diversity in oilseed rape (Brassica Napus L.). Agron. 2021;11:1539. [Google Scholar]
66. Li P, Liu J, Saleem M, Li G, Luan L, Wu M, et al. Reduced chemodiversity suppresses rhizosphere microbiome functioning in the mono-cropped agroecosystems. Microbiome. 2022;10:1–15. [Google Scholar]
67. Tashkandi MA, Jalal RS, Baz L, Refai MY, Shami A, Ashy RA, et al. Functional interpretation of cross-talking pathways with emphasis on amino acid metabolism in rhizosphere microbiome of the wild plant Moringa oleifera. Agric. 2022;12:1814. [Google Scholar]
68. Diao, F., Jia, B., Wang, X., Luo, J., Hou, Y., et al. Proteomic analysis revealed modulations of carbon and nitrogen by arbuscular mycorrhizal fungi associated with the halophyte suaeda salsa in a moderately saline environment. Land Degrad Dev. 2022;33:1933–43. [Google Scholar]
69. Ali A, Ghani MI, Elrys AS, Ding H, Iqbal M, Cheng Z, et al. Different cropping systems regulate the metabolic capabilities and potential ecological functions altered by soil microbiome structure in the plastic shed mono-cropped cucumber rhizosphere. Agric Ecosyst Environ. 2021;318:107486. [Google Scholar]
70. Cairney JW. Basidiomycete mycelia in forest soils: dimensions, dynamics and roles in nutrient distribution. Mycol Res. 2005;109:7–20. [Google Scholar] [PubMed]
Cite This Article
 Copyright © 2024 The Author(s). Published by Tech Science Press.
This work is licensed under a Creative Commons Attribution 4.0 International License , which permits unrestricted use, distribution, and reproduction in any medium, provided the original work is properly cited.
 Downloads
 Citation Tools