
 Submit a Paper
 Propose a Special lssue
 Open Access
ARTICLE

Multi-Environment Evaluation of Soybean Genotypes for Yield, Stability, and Trait Associations in Croatia
1 Department of Plant Varieties and Propagating Material Sector, Ministry of Agriculture, Forestry and Fisheries, Zagreb, 10000, Croatia
2 Department for Plant Varieties, Croatian Agency for Agriculture and Food, Osijek, 31000, Croatia
3 Department of Small Cereal Crops Breeding and Genetics, Agricultural Institute Osijek, Osijek, 31000, Croatia
* Corresponding Author: Valentina Spanic. Email:
(This article belongs to the Special Issue: Influence of Biotic and Abiotic Stresses Signals on Plants and their Performance at Different Environments)
Phyton-International Journal of Experimental Botany 2025, 94(10), 3189-3203. https://doi.org/10.32604/phyton.2025.070489
Received 17 July 2025; Accepted 23 September 2025; Issue published 29 October 2025
 View Full Text
 Download PDF
Abstract
This study evaluated agro-morphological traits, grain quality traits, and phenotypic stability of nine soybean genotypes across four environments over two growing seasons (2022–2023). Traits such as days to flowering, days to maturity, and disease symptoms were monitored throughout the season. At maturity, parameters including grain yield, grain oil and protein content, 1000-seed weight, test weight, scores of lodgings, shattering, plant height, and first pod height were evaluated. In addition, 18 morphological traits were scored, of which eight were sufficiently variable for further analysis. In terms of environmental stability, genotypes 2 and 13 excelled, while genotypes 12 and 14 consistently yielded the maximum grain production regardless of season or location. Through the application of PCA, we observed significant genotypic variance along with distinct clustering patterns based on year and location, with overall higher yields observed in the 2023 season. The 2022 season was marked by uneven rainfall that contributed to greater disease pressure. Grain yield exhibited a positive association with test weight and the timing of flowering/maturity, whereas lodging demonstrated a weak yet positive correlation. Although the lodging ratings were generally modest, there seems to be an indirect association between genotypes with somewhat higher scores and enhanced grain yield. Among morphological traits, the intensity of green leaf color and leaf blistering had the strongest influence on grain yield. This study shed information on key distinctions in characteristics and how they relate to grain yield, which could lead to future improvements in output. Some genotypes demonstrated both high yield potential and stability, which are essential for developing cultivars suitable for diverse environments.Keywords
Supplementary Material
Supplementary Material FileGlycine max (L.) Merr., more often known as soybeans, are legumes that provide a variety of useful nutrients, such as energy, edible oil, and high-quality protein [1]. It was hypothesized that the soybean was domesticated somewhere in Northeast Asia [2]. It is one of the most widely traded agricultural commodities, accounting for more than 10% of the total value of global agricultural trade [3]. It ranks sixth among world crops by tonnage harvested [4]. Croatia is the fourth largest soybean producer in the EU, and planted area and production have continued to increase over the years [5]. Between 2015 and 2024, soybean seed production in Croatia averaged 5630 ha [6]. As the world’s population, disposable income, and meat consumption continue to climb, the demand for soybeans is expected to follow suit [7]. As soybeans are an important source of protein and oil with health benefits, more research is essential to increase soybean yield under different environmental conditions. However, soybeans are temperature-sensitive throughout their growth cycle, particularly during flowering, when they are highly sensitive to low temperatures [8]. Temperatures below 15°C can cause growth retardation and inhibition of new leaf and shoot production. On the other hand, increased temperatures may cause a reduction in the number and weight of seeds per plant, thus decreasing seed yield [9]. For example, it was reported that 35% of the global soybean production deficit in 2012 was due to historic warming in a plus 2°C storyline [10]. Final grain yield is strongly influenced by rainfall during flowering [11].
Furthermore, soybean yield is greatly affected by both genotypes and environments (climate, soil, and management practices, etc.). The same soybean cultivar can produce different yields depending on variations in environmental conditions. This is due to genotype × environment (GxE) interaction effects, which are crucial for identifying cultivars with stable performance across environments [12]. However, the increase in grain yield achieved over time highlights the importance of breeding new soybean cultivars. Previous investigations showed that the newer cultivars had significantly higher grain yields than the older cultivars [7,13–15]. The phenology of soybean cultivars has changed over time, and newer cultivars tend to spend less time in vegetative growth, while time to maturity remains constant [16]. The research of Netto et al. [17] suggested that newer cultivars had higher transpiration rates during high transpiration demand periods. Another study reported that the greater grain yield trend came from grains produced on plant branches [18]. Also, soybean yield response to increased plant density and cumulative intercepted photosynthetically active radiation has not changed over time, but it was obvious that genetic gain from new cultivars is related to more efficient use of light [19]. Previously, increased yield of new cultivars has been related most often with greater dry matter accumulation, as the soybean cultivars that are more efficient in intercepting photosynthetically active radiation inside the vegetative canopy resulted in higher grain yields [20]. According to Kumudini et al. [14], the newer cultivars were different from older cultivars in their ability to accumulate more nitrogen during the seed filling period. Usually, the experiments using older and newer soybean cultivars grown in the same environment offer the opportunity to measure grain yield progress and determine its cause [21].
It was previously reported that in China, grain yield increases of soybeans were primarily associated with increased 100-seed weight and seed number per plant [22]. Results of Ustun et al. [23] showed that cultivar improvement increased soybean yield by 14 kg ha−1 per year when cultivars released between 1940 and the late 1980s were examined. The same authors reported that genetic improvement resulted in shorter plant height and decreased lodging. In Argentina, from 1980 to 2015, one hundred and eighty-one cultivars were evaluated, showing that genetic gain in grain yield was 43 kg ha−1 per year [24]. The lower rate of on-farm yield improvement from 1924 to 2012, in the United States, was 23.3 kg ha−1 per year [25]. In another research in the USA, grain yield increased linearly for all combined experiments by 16.8 kg ha−1 per year [26]. Also, it is important to note that differences in grain yield are the result of environmental conditions, such as irrigation treatment. Egli [27] reported a linear increase in grain yield for most of the mid-western USA, with a mean grain yield gain of 38.3 kg ha−1 per year with irrigation and 23.5 kg ha−1 without irrigation in Nebraska; 21.8 kg ha−1 with irrigation and 15.1 kg ha−1 without irrigation in Arkansas; 27.6 kg ha−1 in Iowa and 26.4 kg ha−1 in Kentucky. In India, the genetic changes in grain yield, agronomic traits, and foliar disease symptoms during 39 years (1969 to 2008) were studied, which revealed 103.5% grain yield improvement over the years [28]. According to Koester et al. [29], the grain yield of soybean increased by 26.5 kg ha−1 per year, and the increase in grain yield was driven by improvements in physiological traits in the efficiencies of intercepted light, converted light energy into biomass, and partitioned biomass into grain. Therefore, it is important to develop cultivars that have high grain yield and good stability with resistance to biotic and abiotic stresses [30]. Given that, the selection of genotypes should be carried out in multiple environments. Also, there is a need to identify traits that will help to determine the performance of the most stable cultivars in different environments [31].
Therefore, the present study aimed to evaluate nine soybean genotypes across multiple environments in Croatia to assess grain yield, yield components, and stability.
The soybean panel used in this study was comprised of nine breeding lines (Nos. 10–16, except 2) and two check varieties (‘Lucija’, No. 1; ‘Ika’, No. 2), where ‘Lucija’ is an early maturing genotype of MG 00 and Ika is a slightly later maturing genotype from MG I.
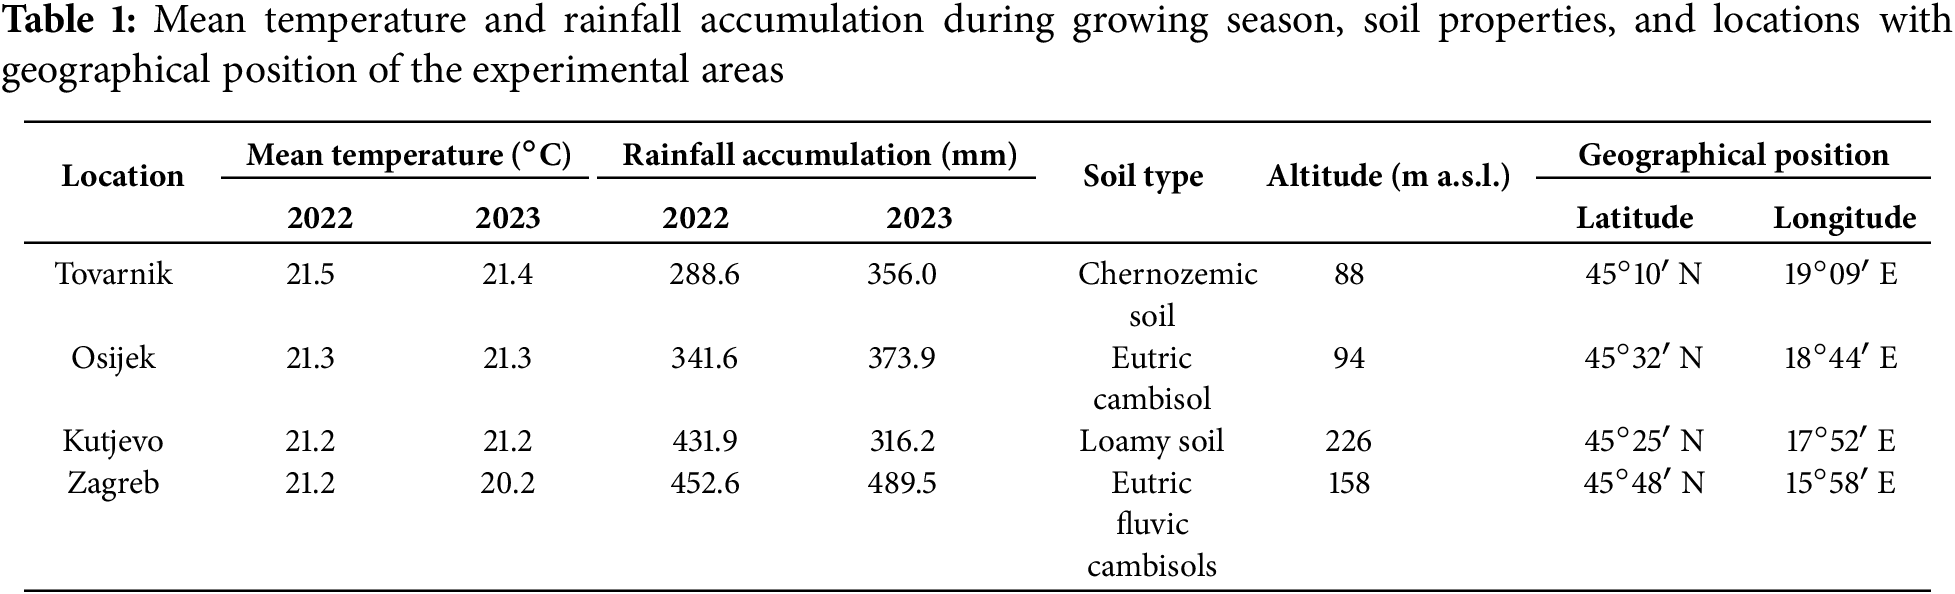
The field experiments were conducted at four different geographical positions in Croatia: (1) Croatian Agency for Agriculture and Food in Osijek; (2) Agro-Tovarnik d.o.o. in Tovarnik; (3) Kutjevo d.d. in Kutjevo; (4) Faculty of Agriculture (Šašinovec location) in Zagreb (Table 1). These experimental locations were chosen because of their contrasting pedo-climatic conditions across Croatia. Overall, four soil types were present: eutric cambisol in Osijek; chernozemic soil in Tovarnik; loamy soil in Kutjevo; and eutric fluvic cambisols in Zagreb.
At the sites in Osijek, Kutjevo, and Zagreb, the pre-crop was maize for each year of testing. At the site in Tovarnik, in the first year of testing, the pre-crop was maize, and sunflower in the second year. The planting of soybean genotypes at the locations Osijek, Tovarnik, Zagreb, and Kutjevo was performed on 3 May, 25 April, 5 May, and 26 April, respectively, in 2022, and on 28 April, 9 May, 2 May, and 10 May, respectively, in 2023. All experiments were arranged in a randomized complete block design (RCBD) with four replications per genotype at each location and year. Row-to-row distance of 25 cm and seed depth of 4–5 cm was maintained for proper emergence. Total plot size was 10 m2, while net plot size was 6 m2.
During crop growth, the mean temperature was similar in the two growing seasons at four locations (Table 1). Cumulative rainfall in Tovarnik, Osijek, Kutjevo, and Zagreb was 288.6 mm in 2022 and 356.0 mm in 2023, 341.6 mm in 2022 and 373.9 mm in 2023, 431.9 mm in 2022 and 316.2 mm in 2023, 452.6 mm in 2022 and 489.5 mm in 2023, respectively. The exact information about rainfall and temperatures for each month at each location can be found in Table S1. The data were obtained from Weather stations (6250EU | Davis Wetterstation, Distrelec, Bremen, Germany).
The agricultural technology was standard for each experimental site. Planting of soybean genotypes was carried out with a Wintersteiger Tool Carrier plot seeder at a seed rate of 110 kg ha−1. Harvesting was carried out with a Wintersteiger Quantum plot harvester in the phase of full ripeness in September.
Data from field conditions were collected for plant height (cm), first pod height (cm), lodging (%), shattering (%), number of days to flowering, and number of days to maturity. In addition, symptom assessment of downy mildew (Peronospora manshurica, %), white mold (Sclerotinia sclerotiorum, %), Diaporthe phaseolorum var. sojae (%), and Diaporthe phaseolorum var. caulivora (%) was performed. After harvest, the grains were collected to determine grain yield (t ha−1), oil content (%), protein content (%), 1000-seed weight (g), and test weight (kg hl−1). At two different locations, twenty randomly selected plants from each plot were used to record the mean data of days to flowering and maturity. Other traits were measured in four replicates at each location. Plant height was measured at maturity from the surface of the soil to the tip of the plant. Total grain yield for each accession was measured after harvesting the whole plot.
Eighteen morphological traits (Hypocotyl: anthocyanin coloration, Leaf: blistering, Leaf: shape of lateral leaflet, Leaf: size of lateral leaflet, Leaf: intensity of green color, Flower: color, Plant: color of hairs of main stem, Plant: growth type, Plant: growth habit, Plant: height, Pod: intensity of brown color, Seed: size, Seed: shape, Seed: ground color of testa, Seed: hilum color, Seed: color of hilum funicle, Plant: time of beginning of flowering, Plant: time of maturity) were evaluated according to CPVO/TP-080/1 protocol of The Community Plant Variety Office [32]. The level of expression in different varieties was visually rated and recorded using a 1–9 scale. Data were recorded for two seasons at two locations—Osijek and Kutjevo—using two replications in each location.
Statistical analyses were conducted using the statistical software package (Statistica 14.0) and online software platform (bioinformatics.com.cn). The statistically significant differences were identified using the LSD test and analysis of variance (ANOVA). The significance of the differences was evaluated at the p ≤ 0.05 level. Figures, including PCA biplots, were derived from the means of four replicates per genotype for grain yield, plant height, first pod height, shattering, lodging, and disease infection. Other traits (protein content, oil content, 1000-seed weight, test weight, days to flowering, and days to maturity) were taken as an average of two locations (Osijek and Kutjevo) at each growing season for correlation analysis. The correlation analysis was performed using https://www.bioinformatics.com.cn/en (accessed on 20 June 2025), a free online platform for data analysis and visualization [33].
A Pareto chart, based on a general regression model, along with multiple regression analysis, was used to analyze the relationship of the morphological (DUS) traits with grain yield. It illustrated the impact of each factor on the response in descending order. Only eight morphological traits were considered due to the low variability of the ten other traits.
3.1 Grain Yield Performance of Soybean Genotypes in Two Growing Seasons at Four Locations
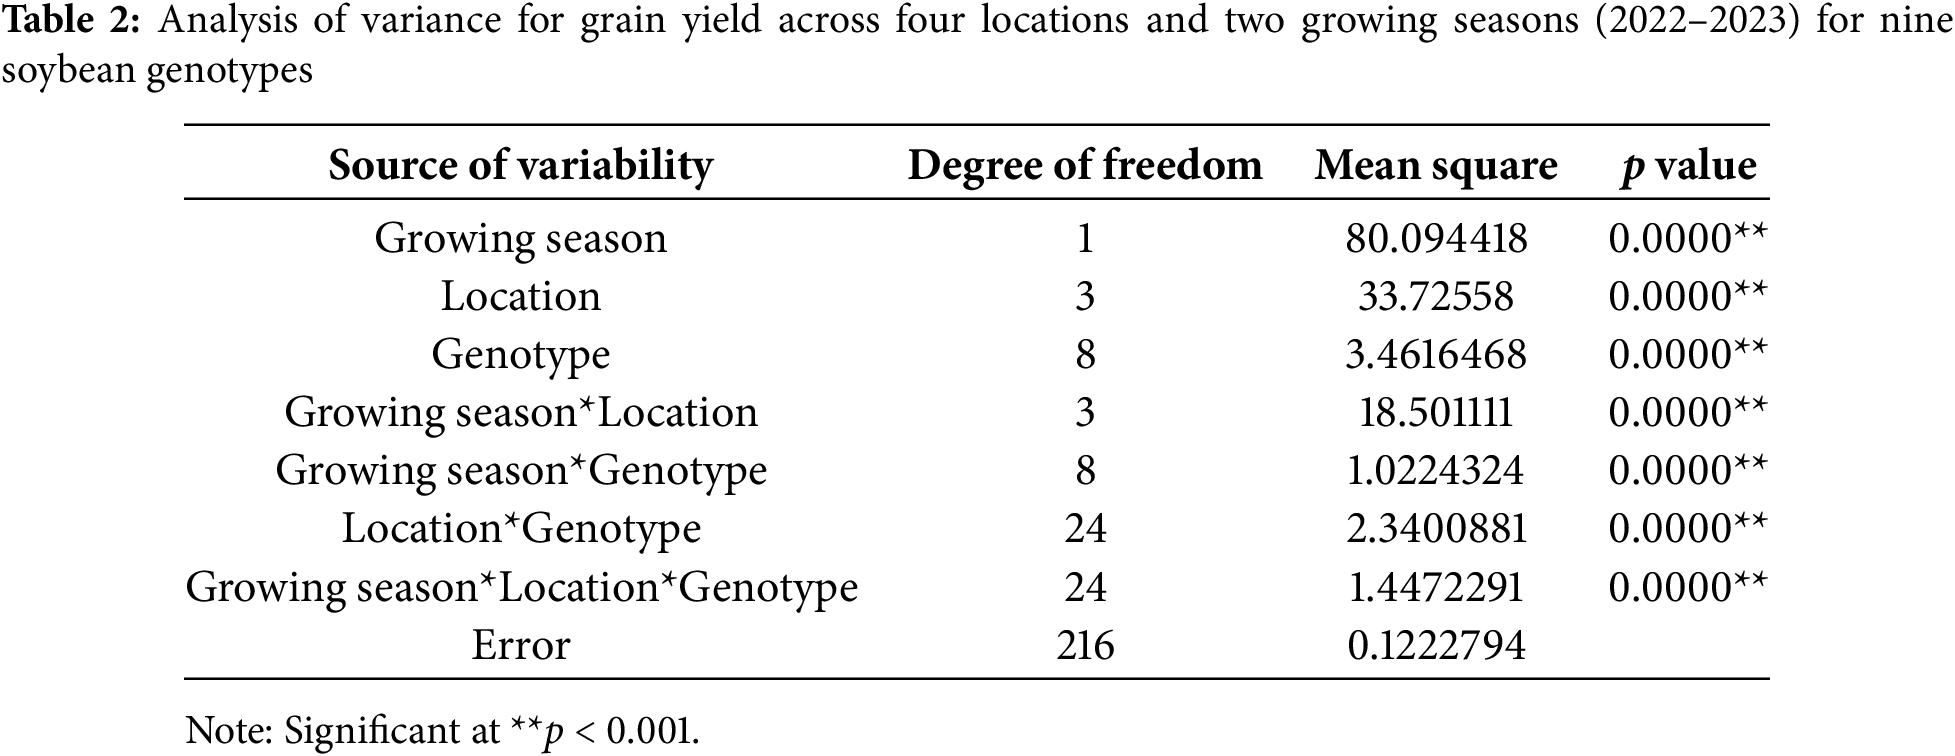
The analysis of variance from factorial design demonstrated that grain yield was significantly influenced by growing season, location, genotype, and their interactions (Table 2). Among these factors, season and location contributed the most to grain yield variation, while genotype effects and interactions contributed less to grain yield variation. Table 1 shows that all main and interaction effects were statistically significant at p < 0.001.
In 2022, grain yield ranged from 1.54 t ha−1 (genotype 15, Osijek) to 4.97 t ha−1 (genotype 2, Kutjevo). At Tovarnik, yields averaged 2.83 t ha−1, ranging from 2.30 t ha−1 (genotype 16) to 3.79 t ha−1 (genotype 2) (Fig. 1A). At Osijek during the same year, genotype 10 produced the highest grain yield (3.14 t ha−1), while genotype 15 had the lowest (1.54 t ha−1), with an overall average of 2.20 t ha−1. At Kutjevo in 2022, the average grain yield was 3.12 t ha−1, with genotype 2 yielding the most (4.97 t ha−1). At Zagreb in 2022, yields ranged from 2.93 t ha−1 (genotype 1) to 4.30 t ha−1 (genotype 12). In 2023, yields ranged from 2.04 t ha−1 (genotype 1 at Tovarnik) to 7.01 t ha−1 (genotype 12 at Zagreb). At Tovarnik in 2023, genotype 12 had the highest grain yield (4.00 t ha−1), while genotype 1 was the lowest (2.04 t ha−1) (Fig. 1B). At Osijek in 2023, genotype 10 yielded 5.29 t ha−1, the highest, while genotype 15 yielded 3.91 t ha−1. Kutjevo in 2023 showed strong results for genotype 13 (4.84 t ha−1), while genotype 10 had the lowest (2.30 t ha−1). At Zagreb in 2023, genotype 12 recorded the highest grain yield (7.01 t ha−1).
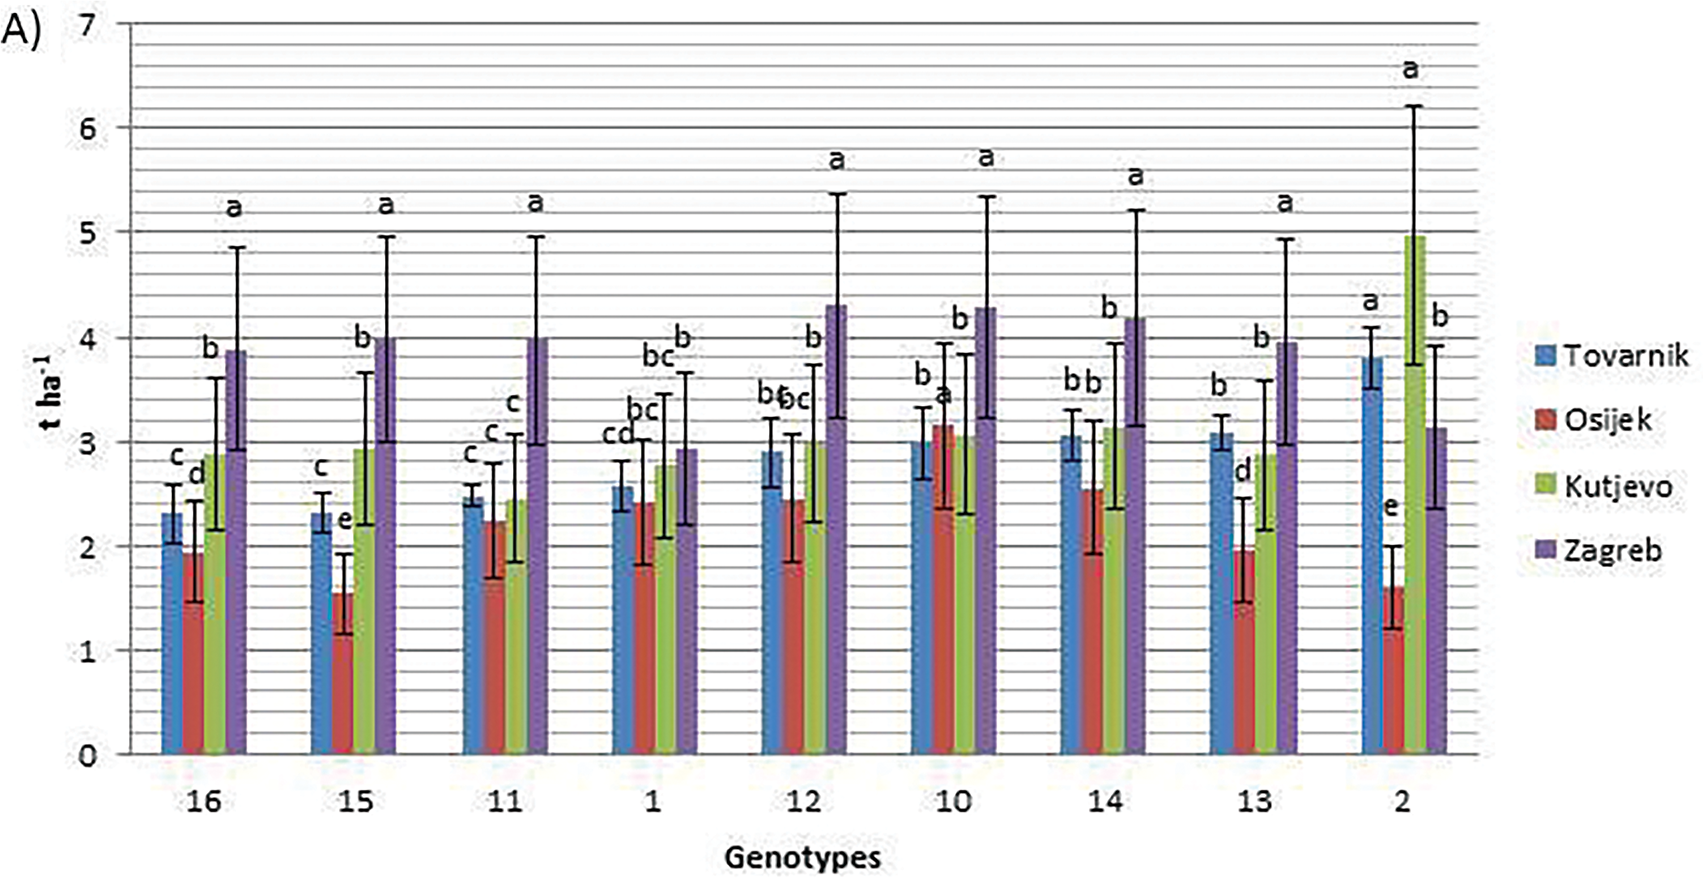
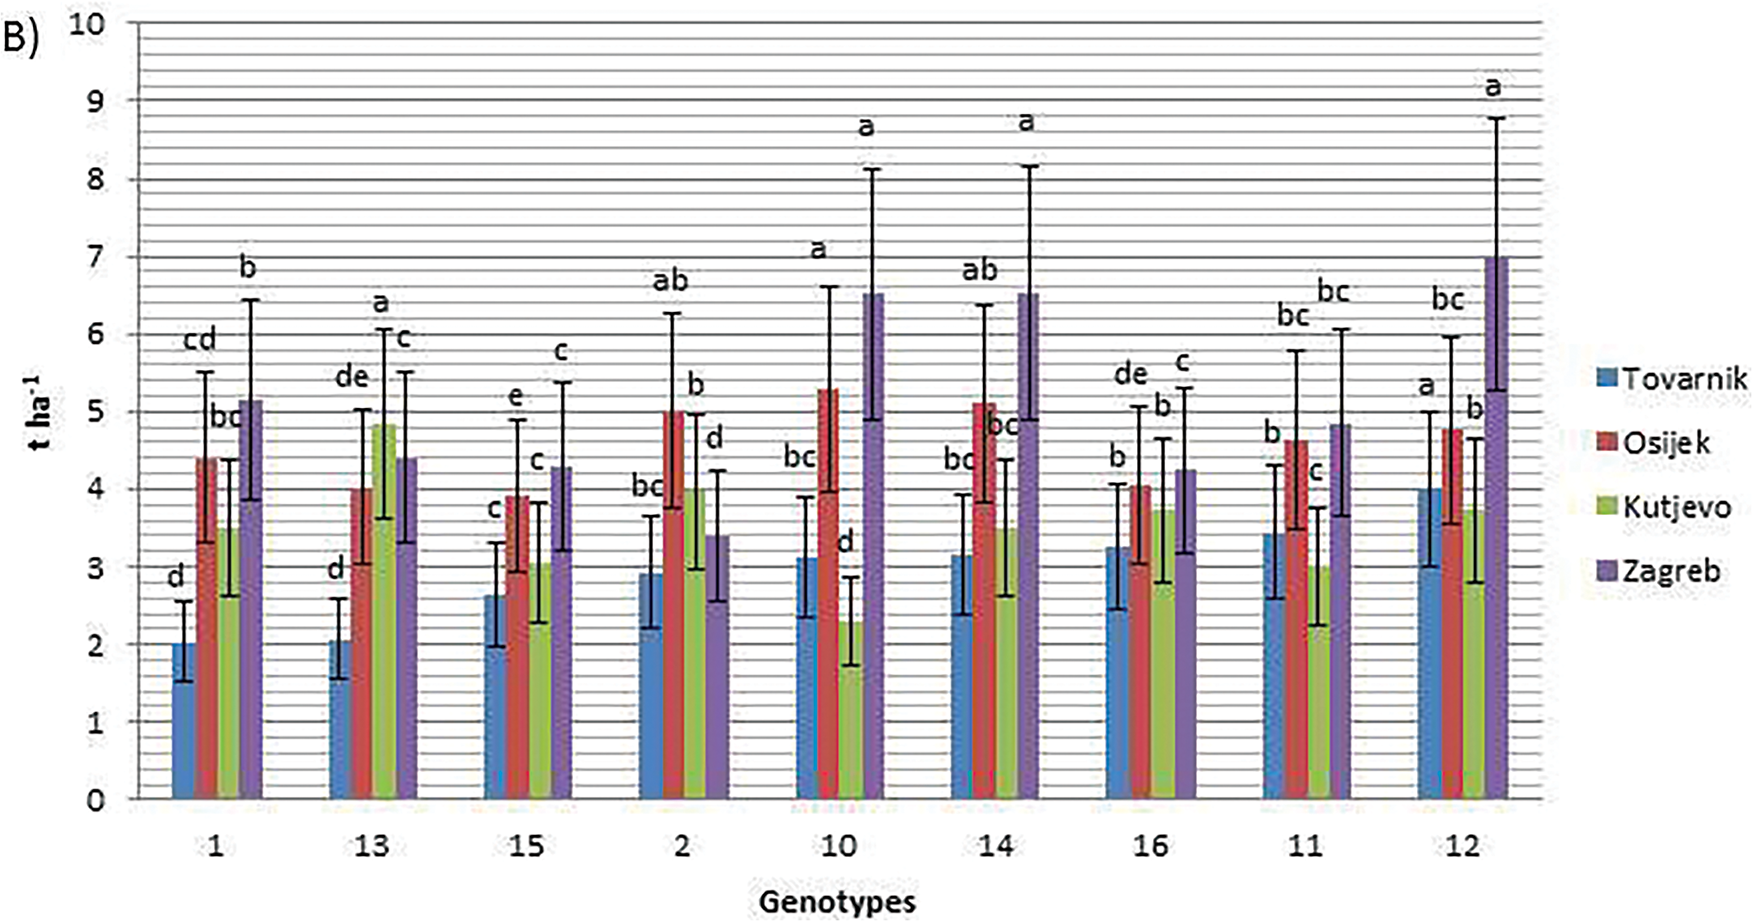
Figure 1: Grain yield of nine soybean genotypes at four locations in the growing seasons of 2022 (A) and 2023 (B). Different letters ‘a–e’ mean different statistical significance (p < 0.05) of grain yield between genotypes at each location. Bars represent mean values of four replicates ± standard error (SE)
3.2 Trait Correlation Analysis between 15 Investigated Traits
The correlation matrix showed that oil content was negatively correlated with protein content, disease symptoms, and first pod height, while protein content was negatively correlated with grain yield, lodging, days to flowering, days to maturity, and test weight (Fig. 2). Further, test weight and days to flowering showed a negative correlation with symptoms of diseases and first pod height. Lodging was negatively correlated with disease symptoms. In addition to the negative correlation with protein content, grain yield was negatively correlated with first pod height and disease symptoms.
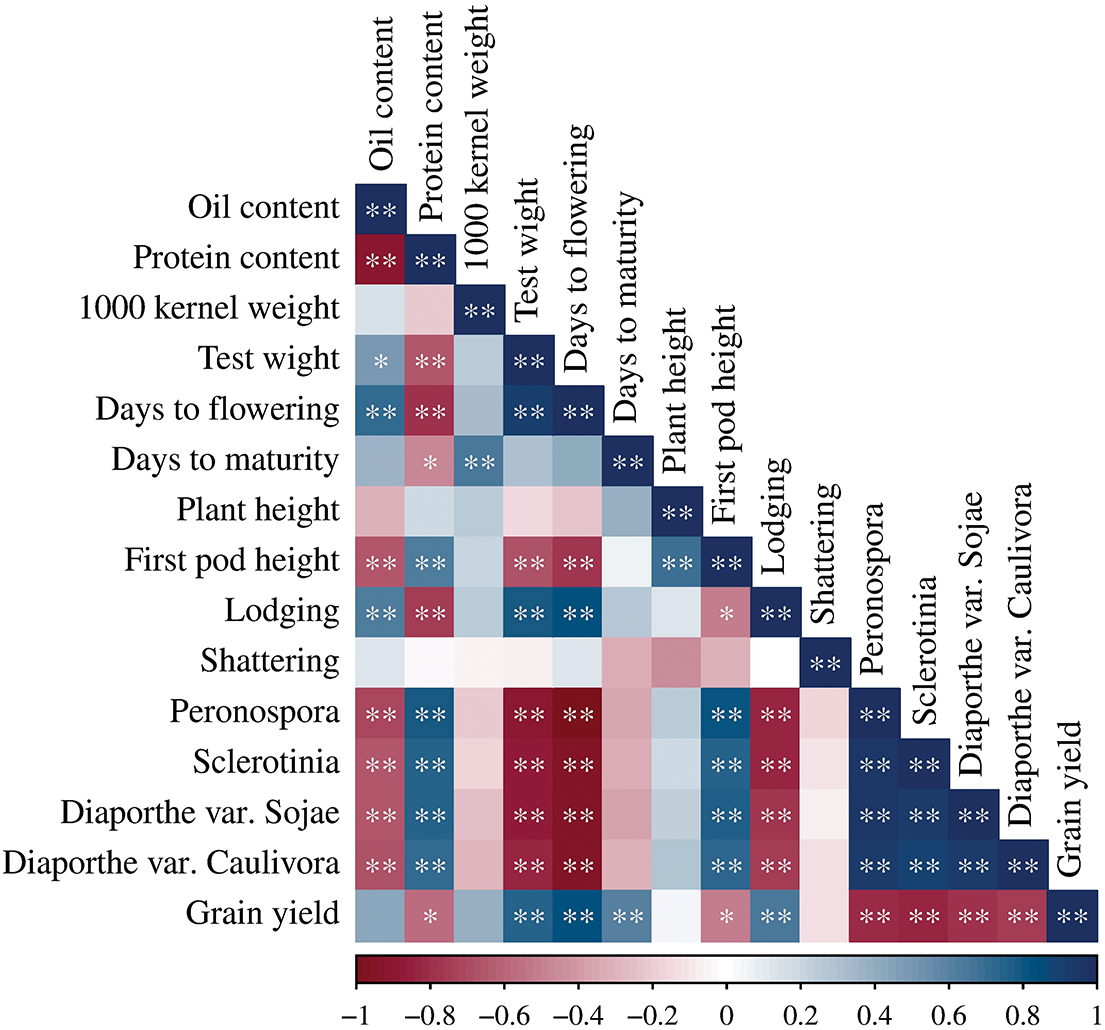
Figure 2: Correlation matrix of 15 agro-morphological and quality traits of nine soybean genotypes. *, **–significant at 0.05 and 0.01, respectively. The colors span from dark blue to dark red, where dark blue denotes positive correlation, and dark red indicates negative correlation
On the other hand, oil content was positively correlated with test weight, days to flowering, and lodging. Protein content was positively correlated with symptoms of four diseases and the first pod height. 1000-seed weight showed a positive correlation with days to maturity. Test weight and days to flowering positively correlated with grain yield and lodging, days to flowering with test weight, and days to maturity with grain yield. The first pod height showed a positive correlation with symptoms of diseases and plant height. Symptoms of four diseases were also positively correlated.
To visualize the relationships between agro-morphological traits and growing seasons of nine soybean genotypes, principal component analysis (PCA) was conducted (Fig. 3). PCA accounted for 63.16% of total trait variability, with PC1 and PC2 contributing 47.04% and 16.12%, respectively.
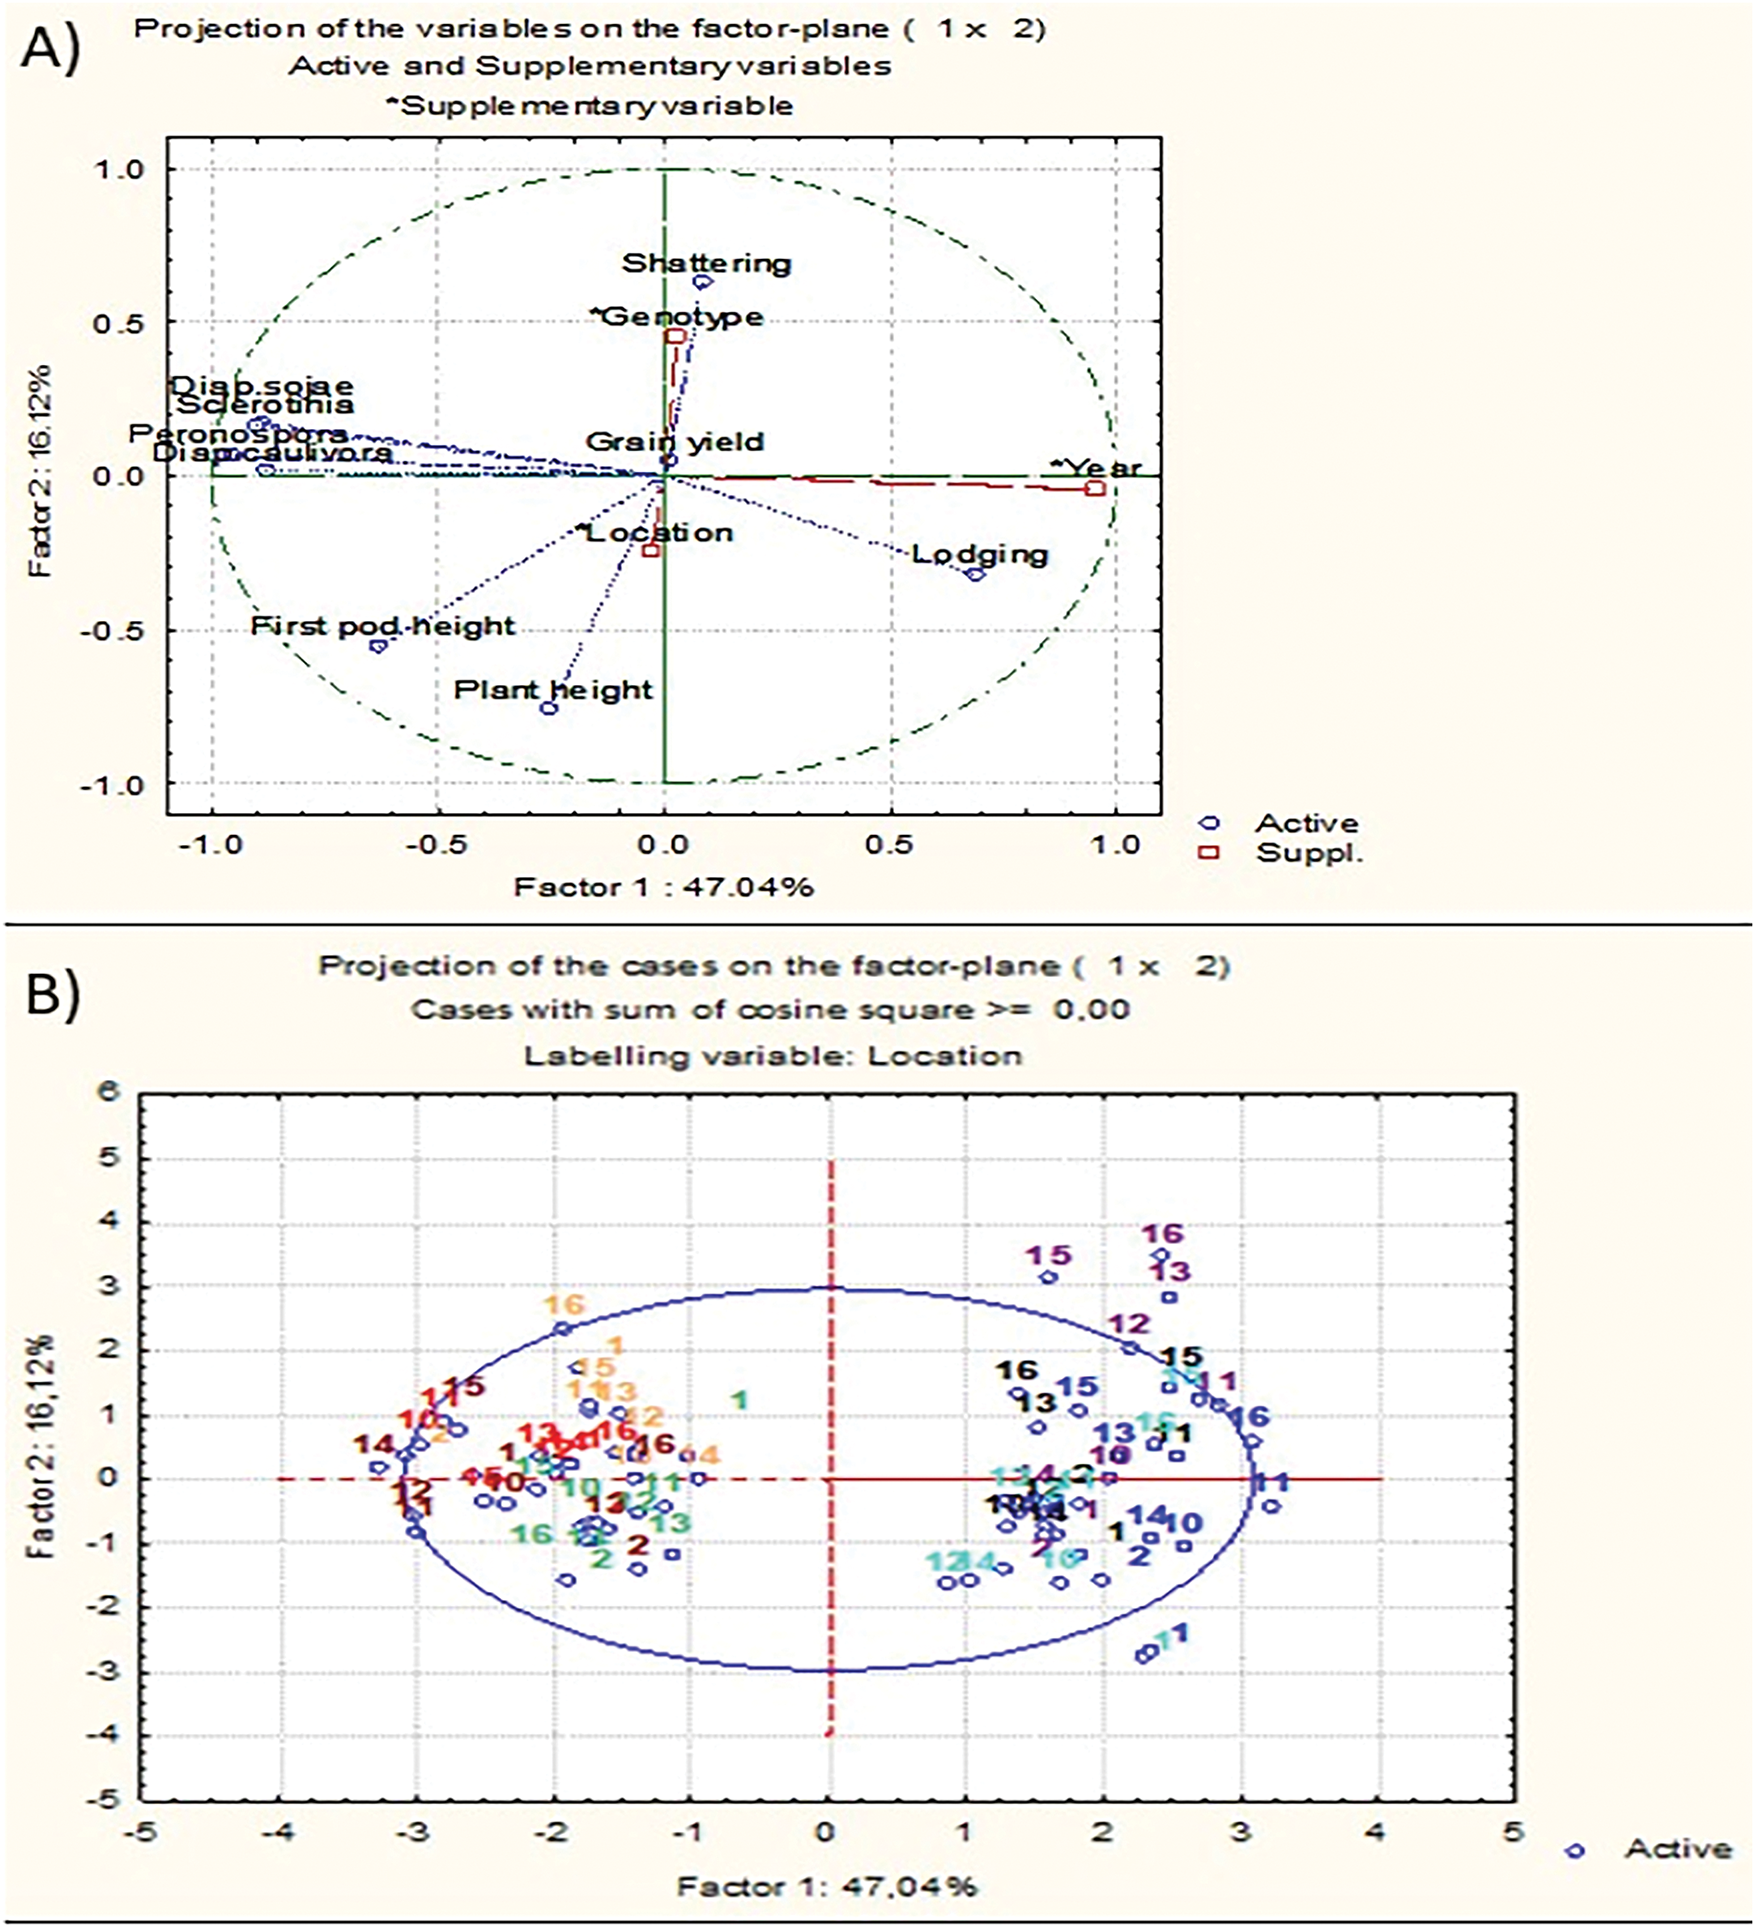
Figure 3: Principal component analysis (PCA) showing the relationship between plant height, first pod height, lodging, shattering, and symptom assessment of Peronospora manshurica, Sclerotinia sclerotiorum, Diaporthe phaseolorum var. sojae, Diaporthe phaseolorum var. caulivora, and grain yield (A) for 2022 and 2023 growing seasons at four locations for nine soybean genotypes (B). Tovarnik2022—dark red; Osijek2022—light red; Kutjevo2022—orange; Zagreb2022—light green; Tovarnik2023—dark blue; Osijek2023—violet; Kutjevo2023—black; Zagreb2023—light blue
Along the positive axis of PC1, genotypes 10–13 (Osijek 2023), 11 and 13 (Kutjevo 2023), 13 (Tovarnik 2023), and 15–16 (all locations, 2023) were clustered. Genotypes positioned on the negative axis of PC2 included genotypes 2, 10, 11, 12, and 13 from location Tovarnik in 2022, and 2, 10, 11, 12, 13, and 16 from location Zagreb in 2022.
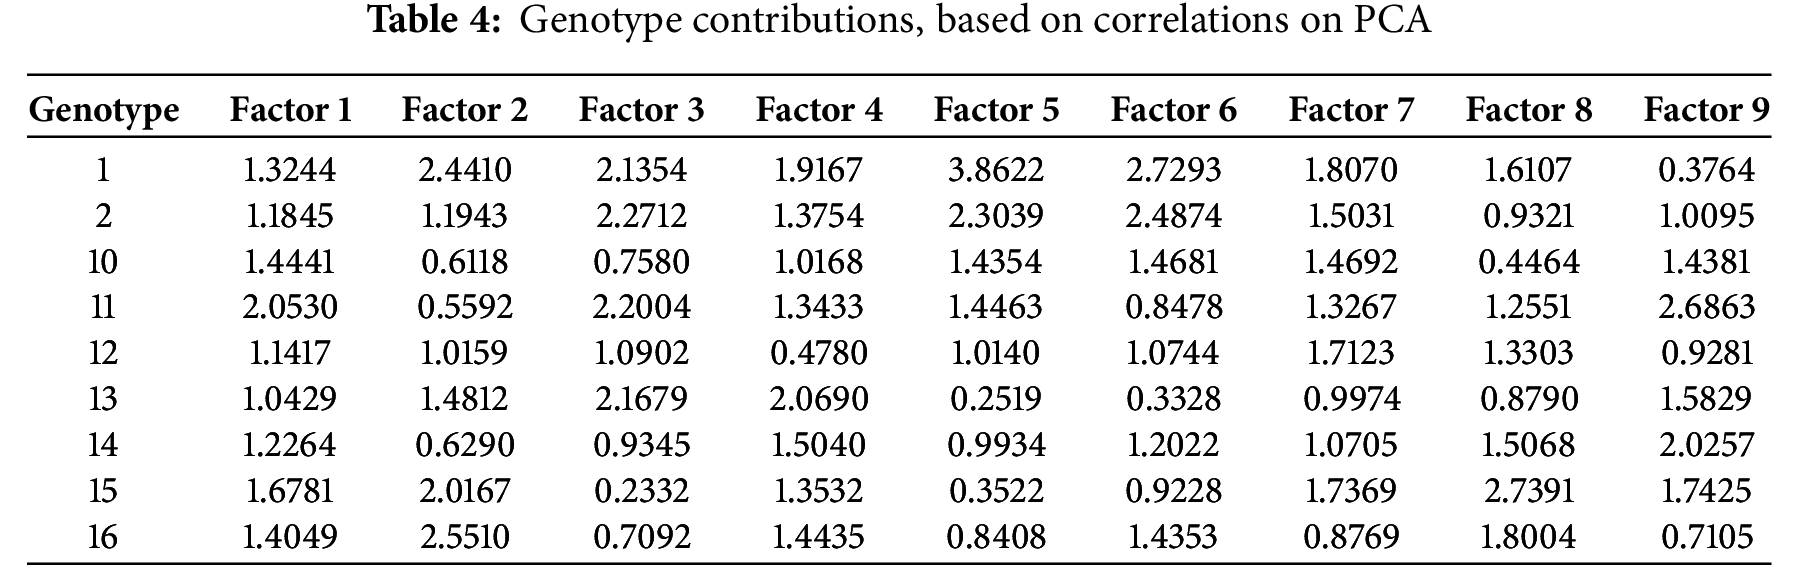
The first pod height and plant height pointed to the lower left quadrant of PCA and were positively correlated. Plant height was negatively correlated with shattering, while disease symptoms were strongly associated with traits loading on PC1. Resistance or susceptibility of genotypes to Peronospora manshurica, Sclerotinia sclerotiorum, Diaporthe phaseolorum var. sojae, and Diaporthe phaseolorum var. caulivora were positively correlated. Among traits, disease symptoms contributed most to PC1, while plant height, resistance to shattering, and first pod height influenced PC2 (Table 3). Genotypes 2, 12, 13, and 14 clustered near the origin, suggesting lower responsiveness to environmental variation (Table 4).

3.3 Associations between Morphological (DUS) Attributes and Grain Yield
The Pareto chart indicated that leaf color intensity and leaf blistering were the most influential morphological traits affecting grain yield, followed by time of plant maturity and plant height (Fig. 4). The Pareto chart ranked the relative influence of morphological traits on grain yield, in descending order of effect size (color of hairs of main stem > time of beginning of flowering > size of lateral leaflet > growth type).
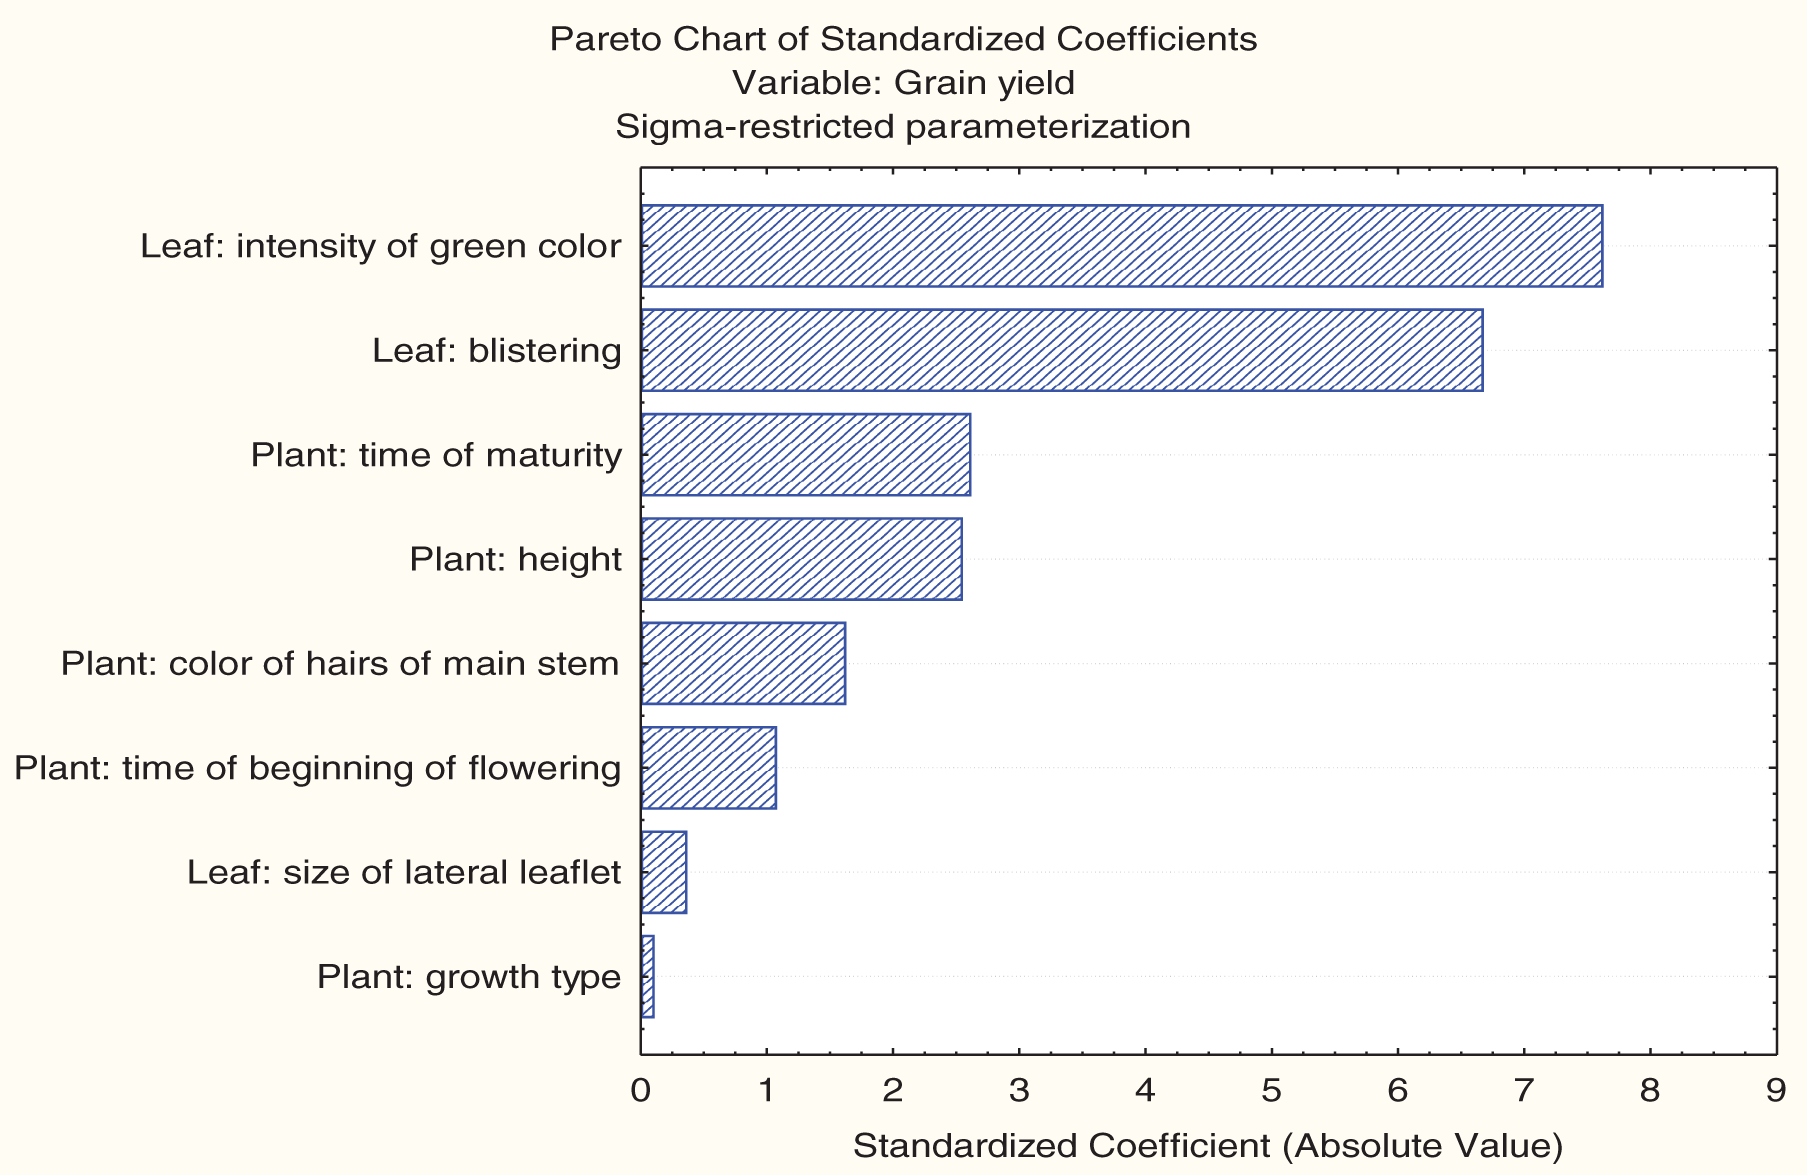
Figure 4: Pareto chart showing the relative influence of morphological (DUS) traits on grain yield of nine soybean genotypes
4.1 Grain Yield of Soybean under Different Environmental Conditions
The yield of soybean grain is a multifaceted quantitative characteristic that is significantly affected by environmental conditions. It is determined by both genetic traits and environmental influences such as climate, soil type, and agronomic practices [34]. Environmental variability strongly affects soybean growth and yield performance across different seasons and regions [35]. In this study, nine genotypes were tested across four Croatian regions over two seasons, and results showed that both location and season had the greatest impact on grain yield variation. This aligns with previous studies reporting that the environment explains most of the variance in soybean traits, followed by genotype-environment interactions and genotype itself. Similarly, the research of Omari et al. [36] reported that the largest part of the total variance in all parameters of soybean genotypes was explained by environment (67.6%–82.8%), followed by genotype-environment interaction (7.7%–14.6%), while a small portion was attributed to genotypes (1.3%–10.5%). In this study, the growing season explained the highest proportion of variance. The variance due to genotype–environment interactions was also highly significant for all the characters of soybean genotypes in the research of Ramteke et al. [28]. This indicates the differential response of genotypes in the expression of the characters to varying seasons. Consequently, the interplay of genotype, environment, and G × E interactions collectively influences grain yield [37].
Further, the results revealed strong genotype-by-environment interaction, confirming the importance of selecting stable cultivars. The mean soybean yields obtained at four locations in Croatia during a two-year study were significantly different between genotypes at each location. Thus, the evaluation of genotypes in different growing seasons and locations showed a substantial amount of genetic diversity for grain yield. In particular, genotypes 2 and 12 performed best in 2022 and 2023, respectively, and genotypes 12 and 14 consistently achieved high yields. However, the 2022 season experienced excessive and uneven rainfall that contributed to higher disease pressure, which negatively affected grain yield. It was previously reported that there is an issue of lower productivity in the crop, which is attributed to both genetic and nongenetic factors like susceptibility to biotic and abiotic stresses [38]. In contrast, the 2023 season had well-distributed rainfall between 316.2 mm at Kutjevo and 489.5 mm at Zagreb, creating favorable conditions for soybean growth. Also, photo-thermal conditions can affect the performance of agronomic traits such as grain yield and quality [39]. The current research indicates that rainfall exerted a significant influence on soybean development, as reflected by the variability in grain yield across locations and growing seasons. These findings highlight the crucial role of rainfall patterns and photo-thermal conditions in determining soybean productivity. That was also previously shown in the research of Egli [27], who reported that average grain yield from 1999 to 2003 was highest in irrigated production in Nebraska (3403 kg ha−1) and lowest in non-irrigated areas in Arkansas (1482 kg ha−1). Other studies showed that contrasting climate conditions resulted in diverse maturity types of soybean cultivars, with grain yield ranging from 1.4 to 4.5 t ha−1 [34]. Some genotypes from the current study showed high genetic potential for grain yield and stability in different environments.
4.2 Relations between Investigated Traits and Soybean Genotypes
Understanding the relationships among key agronomic and quality traits is essential for guiding soybean breeding strategies. For example, negative correlations of oil content with protein content of soybeans have been reported for soybeans since the mid-1960s [40]. A significant decrease in grain protein concentration with year of release was offset by a significant increase in grain oil concentration [21]. In contrast to that, the correlation between protein content and oil content in the research of Sobko et al. [11] was positive, at a highly significant level (p < 0.01). However, negative correlations between oil and protein content have long been observed in soybean breeding and were confirmed in this study. The effects of precipitation on protein and oil content of soybean grains seem to be inconsistent; there is a positive correlation between precipitation during the growing season and oil content, but a negative correlation between precipitation and protein content [41]. From the current research, it was evident that disease symptoms positively correlated with protein content and negatively with oil content. Disease symptoms were more prominent during wetter conditions and were positively correlated with protein content and plant height. Also, a negative correlation of both oil and protein content with precipitation has been reported [42]. Further, it was observed that protein content was negatively correlated with grain yield, test weight, days to flowering and maturity, and lodging. Similarly, the grain protein concentration had a negative relationship with grain yield in the average of growing seasons [43]. Protein concentrations tended to decrease over time, by release date, opposite to grain yield, which increased [26]. The decreases in protein concentration over time were also reported by Ustun et al. [23].
In contrast to negative correlations, this study found grain yield was positively correlated with test weight, days to flowering, days to maturity, and lodging, thus supporting findings that high biomass contributes to higher yield. The genetic improvement of soybean in Croatia appears to have resulted in the development of earlier-maturing genotypes characterized by reduced stature and short to medium plant height. In another research, grain yield was associated with plant height, maturity, seed sugar concentration, seed weight, and lodging [4]. Further, plant height was positively correlated with first pod height, which is further positively related to symptoms of diseases. The production of pods and grains in these first nodes may be necessary for improving grain yield. Soybean cultivars with plant architecture that allow greater light distribution within the canopy have higher grain yield, mainly due to high pod fixation and seed filling rate [44]. In this study, it was not observed that the first pod height exceeded 20 cm, as for some cultivars in other experiments, the height of the lowest pod was around 20 to 30 cm, thus resulting in infertile nodes in these lower canopy layers. However, taller plants may be prone to lodging, which can reduce yield under certain conditions [3]. Further, decreased susceptibility to lodging was observed over time [23,26]. The decrease in plant height was likely due to the selection of shorter soybean plants by breeders to reduce lodging and increase grain yield. However, in this study, high-yielding genotypes tended to lodge due to heavier seed load.
It is important to emphasize, in the case of an effect of the genotype–environment interaction, that the selection of genotypes based on the mean grain yield is inadequate. Due to the significant impact of the environment, using principal component analysis (PCA) allowed a deeper understanding of genotypic stability and adaptability. PCA can fully explore multi-environment trials by partitioning genotype and genotype—environment interaction into principal components through the singular value decomposition of environmentally centered yield data. Based on stability parameters in PCA, genotypes 2, 12, 13, and 14 were selected as closest to the origin of PCA. In the case of the growing season, 2023 is suggested to be a more ideal season as it is plotted in the right quadrants and is very informative for the selection of genotypes with high grain yield. Genotypes from the 2023 season positioned on the positive axis of PC1 exhibited correlations with elevated yield, test weight, and lodging, while demonstrating reduced disease severity. Genotypes from growing season 2022 that were high on PC2 had more disease infections, thus resulting in lower grain yield, and were more susceptible to shattering.
4.3 Morphological (DUS) Traits Influence on Grain Yield
It is known that morphological characteristics are factors that influence the level of soybean productivity [45,46]. The contribution of various morphological traits to grain yield was also examined in nine soybean genotypes. The results revealed distinct patterns of influence among the studied traits, providing important implications for soybean selection.
Leaf color intensity, often linked to chlorophyll concentration, showed the highest contribution to grain yield. Changes in leaf color could be affected by chlorophyll content, physiological characteristics, and variations among different soybean genotypes [47]. Further, chlorophyll content significantly correlates with photosynthetic activity and nitrogen use efficiency of leaves [46], and thus can be an indirect indicator of grain yield potential [48]. The blistering of leaves is related to improved transpiration control or a response to environmental stress. It may be linked to altered mesophyll structure and may indirectly affect gas exchange and photosynthetic efficiency [49]. The above-mentioned traits influence grain yield in soybean genotypes.
Time of maturity and plant height were the third and fourth most influential factors on grain yield. Time of maturity is critical in environments with a short growing season [50] as soybean genotypes are classified as early, medium, and late maturity types. In this study, all genotypes had early maturity, except for genotype 2, which was late in maturity. This suggests that an early maturing variety at one location may be considered a late variety in another region. It was previously stressed that soybean flowering and maturity are often positively correlated with grain yield [51]. Moderate increases in plant height are generally associated with higher grain yield potential in soybean [52]. It was previously reported that the highest positive direct effect on grain yield was recorded in plant height [53]. Moderate contributors to grain yield included stem hair color (pubescence) and flowering time. In the research of Kurosaki et al. [54], it was shown that pubescence color (stem hair color) and flowering time influenced stress tolerance and moderately contributed to grain yield, especially in cooler climates.
The lowest-contributing traits to grain yield were the size of the lateral leaflet of the leaf and the growth type of the plant. Larger leaf area may enhance photosynthetic activity, which in turn supports grain filling and yield [55]. In the research of Kato et al. [56], growth type had a moderate influence on grain yield, where indeterminate and semideterminate soybean lines showed higher seed weight per plant and more seeds per pod compared to determinate types.
Soybean yield across Croatian locations ranged from 2.20 t ha−1 (Osijek, 2022) to 5.55 t ha−1 (Zagreb, 2023), primarily influenced by seasonal water availability and temperature. This study identified key factors influencing grain yield. Grain yield was positively correlated with test weight, flowering, maturity timing, and lodging scores. The PCA showed that 2023 was more favorable for yield, and genotypes from this season clustered together. In contrast, genotypes from 2022 showed higher disease incidence and lower yield performance, confirming the impact of environmental stress on performance. Among the evaluated morphological traits, green leaf color intensity and leaf blistering linked to stress tolerance had the strongest influence on grain yield due to their role in enhancing photosynthetic activity. Genotypes 2, 12, 13, and 14 consistently showed high grain yield and stability across both years and all locations. In addition, genotypes 12 and 14 demonstrated superior performance and broad adaptability. These findings support bolstering breeding initiatives with the goal of enhancing yield stability in the face of anticipated climatic variability.
Acknowledgement: None.
Funding Statement: This research was funded by the Ministry of Agriculture.
Author Contributions: The authors confirm contribution to the paper as follows: Conceptualization, Ivica Delic and Valentina Spanic; methodology, Ivan Varnica and Valentina Spanic; software, Goran Jukic; validation, Ivica Delic and Valentina Spanic; formal analysis, Ivica Delic and Ivan Varnica; investigation, Ivica Delic and Ivan Varnica; resources, Goran Jukic; data curation, Ivan Varnica and Goran Jukic; writing—original draft preparation, Ivica Delic; writing—review and editing, Ivan Varnica, Goran Jukic and Valentina Spanic; visualization, Goran Jukic; supervision, Valentina Spanic; project administration, Goran Jukic; funding acquisition, Goran Jukic. All authors reviewed the results and approved the final version of the manuscript.
Availability of Data and Materials: Data available on request from the authors.
Ethics Approval: Not applicable.
Conflicts of Interest: The authors declare no conflicts of interest to report regarding the present study.
Supplementary Materials: Table S1: The rainfall amount (mm) and average temperature (°C) during two vegetative seasons (2022 and 2023). The supplementary material is available online at https://www.techscience.com/doi/10.32604/phyton.2025.070489/s1.
References
1. James AT, Yang A. Interactions of protein content and globulin subunit composition of soybean proteins in relation to tofu gel properties. Food Chem. 2016;194(5):284–9. doi:10.1016/j.foodchem.2015.08.021. [Google Scholar] [PubMed] [CrossRef]
2. Hymowitz T. Speciation and cytogenetics. In: Boerma HR, Specht JE, editors. Soybeans: improvement, production, and uses. Madison, WI, USA: American Society of Agronomy; 2004. p. 97–136. doi:10.2134/agronmonogr16.3ed.c4. [Google Scholar] [CrossRef]
3. Lee T, Tran A, Hansen J, Ash M. Major factors affecting global soybean and products trade projections. Amber Waves Econ Food Farming Na Resour Rural Am. 2016;4:11. doi:10.22004/ag.econ.244273. [Google Scholar] [CrossRef]
4. Volkova E, Smolyaninova N. Analysis of world trends in soybean production. In: Proceedings of the BIO Web of Conferences; 2024 Jun 13; Stara Zagora, Bulgaria. [Google Scholar]
5. Eurostat. Area under cultivation of soya—Croatia 2025 [Internet]. [cited 2025 May 29]. Available from: https://tradingeconomics.com/croatia/area-under-cultivation-of-soya-eurostat-data.html. [Google Scholar]
6. Jukić G, Varnica I, Šunjić K, Hefer H, Pandžić K, Delić I. Soybean seed sector in the Republic of Croatia in the period 2015–2024. Sjemenarstvo. 2024;35(2):77–86. doi:10.33128/s1.35.2.2. [Google Scholar] [CrossRef]
7. Ainsworth EA, Yendrek CR, Skoneczka JA, Long SP. Accelerating yield potential in soybean: potential targets for biotechnological improvement. Plant Cell Env. 2012;35(1):38–52. doi:10.1111/j.1365-3040.2011.02378.x. [Google Scholar] [PubMed] [CrossRef]
8. Staniak M, Czopek K, Stępień-Warda A, Kocira A, Przybyś M. Cold stress during flowering alters plant structure, yield and seed quality of different soybean genotypes. Agronomy. 2021;11(10):2059. doi:10.3390/agronomy11102059. [Google Scholar] [CrossRef]
9. Wheeler TR, Craufurd PQ, Ellis RH, Porter JR, Prasad PV. Temperature variability and the yield of annual crops. Agric Ecosyst Env. 2000;82(1–3):159–67. doi:10.1016/S0167-8809(00)00224-3. [Google Scholar] [CrossRef]
10. Hamed R, Lesk C, Shepherd TG, Goulart HM, van Garderen L, van den Hurk B, et al. One-third of the global soybean production failure in 2012 is attributable to climate change. Commun Earth Env. 2025;6(1):199. doi:10.1038/s43247-025-02171-x. [Google Scholar] [CrossRef]
11. Sobko O, Stahl A, Hahn V, Zikeli S, Claupein W, Gruber S. Environmental effects on soybean (Glycine max (L.) Merr.) production in central and south Germany. Agronomy. 2020;10(12):1847. doi:10.3390/agronomy10121847. [Google Scholar] [CrossRef]
12. Nguyen VL, Luu HN, Phan THN, Nguyen VL, Chu DH, Bertero D, et al. Genotype by environment interaction across water regimes in relation to cropping season response of quinoa (Chenopodium quinoa). PLoS One. 2024;19(10):e0309777. doi:10.1371/journal.pone.0309777. [Google Scholar] [PubMed] [CrossRef]
13. Specht JE, Hume DJ, Kumudini SV. Soybean yield potential–a genetic and physiological perspective. Crop Sci. 1999;39(6):1560–70. doi:10.2135/cropsci1999.3961560x. [Google Scholar] [CrossRef]
14. Kumudini S, Hume DJ, Chu G. Genetic improvement in short season soybeans: I. Dry matter accumulation, partitioning, and leaf area duration. Crop Sci. 2001;41(2):391–8. doi:10.2135/cropsci2001.412391x. [Google Scholar] [CrossRef]
15. USDA-NASS. National statistics for soybeans [Internet]. Washington, DC, USA: United States Department; 2025 [cited 2025 Jun 5]. Available from: https://www.nass.usda.gov/Statistics_by_Subject/result.php?B69543EC-6199-3B8E-B0BA-85AD269C8504§or=CROPS&group=FIELD. [Google Scholar]
16. Cober ER, Morrison MJ. Soybean yield and seed composition changes in response to increasing atmospheric CO2 concentration in short-season Canada. Plants. 2019;8(8):250. doi:10.3390/plants8080250. [Google Scholar] [PubMed] [CrossRef]
17. Netto JRC, Almtarfi HIT, Li J, Anderson DT, Fritschi FB. Soybean water-use efficiency increased over 80 years of breeding. Crop Sci. 2025;65(1):e21404. doi:10.1002/csc2.21404. [Google Scholar] [CrossRef]
18. Suhre JJ, Weidenbenner NH, Rowntree SC, Wilson EW, Naeve SL, Conley SP, et al. Soybean yield partitioning changes revealed by genetic gain and seeding rate interactions. Agron J. 2014;106(5):1631–42. doi:10.2134/agronj14.0003. [Google Scholar] [CrossRef]
19. De Bruin JL, Pedersen P. New and old soybean cultivar responses to plant density and intercepted light. Crop Ecol Manag Qual. 2009;49(6):2225–32. doi:10.2135/cropsci2009.02.0063. [Google Scholar] [CrossRef]
20. De Bruin JL, Pedersen P. Growth, yield, and yield component changes among old and new soybean cultivars. Agron J. 2009;101(1):124–30. doi:10.1016/S0065-2113(08)00803-1. [Google Scholar] [CrossRef]
21. Morrison MJ, Voldeng HD, Cober ER. Agronomic changes from 58 years of genetic improvement of short-season soybean cultivars in Canada. Agron J. 2000;92(4):780–4. doi:10.2134/agronj2000.924780x. [Google Scholar] [CrossRef]
22. Qin X, Feng F, Li D, Herbert SJ, Liao Y, Siddique KH. Changes in yield and agronomic traits of soybean cultivars released in China in the last 60 years. Crop Pasture Sci. 2017;68(11):973–84. doi:10.1071/CP17002. [Google Scholar] [CrossRef]
23. Ustun A, Allen FL, English BC. Genetic progress in soybean in the U.S. MidSouth. Crop Sci. 2001;41(4):993–8. doi:10.3389/fpls.2021.651241. [Google Scholar] [PubMed] [CrossRef]
24. De Felipe M, Gerde JA, Rotundo JL. Soybean genetic gain in maturity groups III to V in Argentina from 1980 to 2015. Crop Sci. 2016;56(6):3066–77. doi:10.2135/cropsci2016.04.0214. [Google Scholar] [CrossRef]
25. Specht JE, Diers BW, Nelson RL, de Toledo JFF, Torrion JA, Grassini Peditors. Yield gains in major U.S. field crops. Hoboken, NJ, USA: John Wiley Sons; 2014. p. 311–56. [Google Scholar]
26. Rogers J, Chen P, Shi A, Zhang B, Scaboo A, Smith SF, et al. Agronomic performance and genetic progress of selected historical soybean varieties in the southern USA. Plant Breed. 2015;134(1):85–93. doi:10.1111/pbr.12222. [Google Scholar] [CrossRef]
27. Egli DB. Soybean yield trends from 1972 to 2003 in mid-western USA. Field Crops Res. 2008;106(1):53–9. doi:10.1016/j.fcr.2007.10.014. [Google Scholar] [CrossRef]
28. Ramteke R, Gupta GK, Murlidharan P, Sharma SK. Genetic progress of soybean varieties released during 1969 to 2008 in India. Indian J Genet Plant Breed. 2011;71(4):330–40. [Google Scholar]
29. Koester RP, Skoneczka JA, Cary TR, Diers BW, Ainsworth EA. Historical gains in soybean (Glycine max Merr.) seed yield are driven by linear increases in light interception, energy conversion, and partitioning efficiencies. J Exp Bot. 2014;65(12):3311–21. doi:10.1093/jxb/eru187. [Google Scholar] [PubMed] [CrossRef]
30. Eltaher S, Baenziger PS, Belamkar V, Emara HA, Nower AA, Salem KF, et al. GWAS revealed effect of genotype × environment interactions for grain yield of Nebraska winter wheat. BMC Genom. 2021;22(1):2–14. doi:10.1186/s12864-020-07308-0. [Google Scholar] [PubMed] [CrossRef]
31. Li M, Liu Y, Wang C, Yang X, Li D, Zhang X, et al. Identification of traits contributing to high and stable yields in different soybean varieties across three Chinese latitudes. Front Plant Sci. 2020;10:1642. doi:10.3389/fpls.2019.01642. [Google Scholar] [PubMed] [CrossRef]
32. CPVO 2019. [cited 2025 Jun 2]. Available from: https://cpvo.europa.eu/sites/default/files/documents/hordeum_5_2.pdf. [Google Scholar]
33. Tang D, Chen M, Huang X, Zhang G, Zeng L, Zhang G, et al. SRplot: a free online platform for data visualization and graphing. PLoS One. 2023;18(11):e0294236. doi:10.1371/journal.pone.0294236. [Google Scholar] [PubMed] [CrossRef]
34. Wu Y, Wang E, Gong W, Xu L, Zhao Z, He D, et al. Soybean yield variations and the potential of intercropping to increase production in China. Field Crops Res. 2023;291(2):108771. doi:10.1016/j.fcr.2022.108771. [Google Scholar] [CrossRef]
35. Faé GS, Kemanian AR, Roth GW, White C, Watson JE. Soybean yield in relation to environmental and soil properties. Eur J Agron. 2020;118(1):126070. doi:10.1016/j.eja.2020.126070. [Google Scholar] [CrossRef]
36. Omari RA, Halwani M, Reckling M, Hua M, Bellingrath-Kimura SD. Environment and not genotype drives soybean yield stability in Northern Germany. Agron J. 2025;117(2):e70059. doi:10.1002/agj2.70059. [Google Scholar] [CrossRef]
37. Siddquie MNEA, Hoque MA. Genotype × environment interaction on grain yield and yield components in bread wheat. Fundam Appl Agric. 2023;8(1&2):423–34. doi:10.5455/faa.146894. [Google Scholar] [CrossRef]
38. Aondover S, Lekan BL, Terkimbi V. Correlation, path coefficient and principal component analysis of seed yield in soybean genotypes. Int J Adv Res. 2013;1(7):1–5. [Google Scholar]
39. Zhang LX, Liu W, Tsegaw M, Xu X, Qi YP, Sapey E, et al. Principles and practices of the photo-thermal adaptability improvement in soybean. J Integr Agr. 2020;19(2):295–310. doi:10.1016/S2095-3119(19)62850-9. [Google Scholar] [CrossRef]
40. Kurasch AK, Hahn V, Leiser WL, Starck N, Würschum T. Phenotypic analysis of major agronomic traits in 1008 RILs from a diallel of early European soybean varieties. Crop Sci. 2017;57(2):726–38. doi:10.2135/cropsci2016.05.0318. [Google Scholar] [CrossRef]
41. Carrera C, Martínez MJ, Dardanelli J, Balzarini M. Environmental variation and correlation of seed components in nontransgenic soybeans: protein, oil, unsaturated fatty acids, tocopherols, and isoflavones. Crop Sci. 2011;51(2):800–9. doi:10.2135/cropsci2010.06.0314. [Google Scholar] [CrossRef]
42. Maestri DM, Labuckas DO, Meriles JM, Lamarque AL, Zygadlo JA, Guzmán CA. Seed composition of soybean cultivars evaluated in different environmental regions. J Sci Food Agric. 1998;77(4):494–8. doi:10.1002/(SICI)1097-0010(199808)77:4<494::AID-JSFA69>3.0.CO;2-B. [Google Scholar] [CrossRef]
43. Rincker K, Nelson R, Specht J, Sleper D, Cary T, Cianzio SR, et al. Genetic improvement of US soybean in maturity groups II, III, and IV. Crop Sci. 2014;54(4):1419–32. doi:10.2135/cropsci2013.10.0665. [Google Scholar] [CrossRef]
44. Müller M, Rakocevic M, Caverzan A, Chavarria G. Grain yield differences of soybean cultivars due to solar radiation interception. Am J Plant Sci. 2017;8(11):2795. doi:10.4236/ajps.2017.811189. [Google Scholar] [CrossRef]
45. Udensi O, Ikpeme EV, Markson AA, Edu EAB, Umana EJ, Urua IS. Selection of soybean genotypes using morphological markers. Int J Curr Res. 2010;7:5–8. doi:10.18805/lr.v0iOF.3769. [Google Scholar] [CrossRef]
46. Fattah A, Yasin M, Suriani S, Nappu MB, Mulia S, Hannan MFI, et al. Performance and morphology of several soybean varieties and responses to pests and disease symptoms in South Sulawesi. Heliyon. 2024;10(5):e25507. doi:10.1016/j.heliyon.2024.e25507. [Google Scholar] [PubMed] [CrossRef]
47. Alfiah LN, Abdillah K, Zaimah Z. Morphological characteristics of leaf color and leaf shape of soybean variety Anjasmoro (Glycine max (L.) Merril) under water stress. J Agron Tanam Trop. 2025;7(1):67–70. doi:10.36378/juatika.v7i1.3988. [Google Scholar] [CrossRef]
48. Parry MAJ, Reynolds M, Salvucci ME, Raines C, Andralojc PJ, Zhu XG, et al. Raising yield potential of wheat. II. increasing photosynthetic capacity and efficiency. J Exp Bot. 2011;62(2):453–67. doi:10.1093/jxb/erq304. [Google Scholar] [PubMed] [CrossRef]
49. Momayyezi M, Borsuk AM, Brodersen CR, Gilbert ME, Théroux-Rancourt G, Kluepfel DA, et al. Desiccation of the leaf mesophyll and its implications for CO2 diffusion and light processing. Plant Cell Env. 2022;45(5):1362–81. doi:10.1111/pce.14287. [Google Scholar] [PubMed] [CrossRef]
50. Dashiell K. Soybeans: improvement, production, and uses. Madison, WI, USA: American Society of Agronomy; 2004. [Google Scholar]
51. Cober ER, Morrison MJ. Regulation of seed yield and agronomic characters by photoperiod sensitivity and growth habit genes in soybean. Theor Appl Genet. 2010;120(5):1005–12. doi:10.1007/s00122-009-1228-6. [Google Scholar] [PubMed] [CrossRef]
52. Yang Q, Lin G, Lv H, Wang C, Yang Y, Liao H. Environmental and genetic regulation of plant height in soybean. BMC Plant Biol. 2021;21(1):63. doi:10.1186/s12870-021-02836-7. [Google Scholar] [PubMed] [CrossRef]
53. Ene CO, Anyim A, Chukwudi U, Okechukwu E, Ikeogu U. Growth and yield response of selected improved soybean (Glycine max [L.] Merrill) varieties to varying weeding regimes under a tropical condition. J Cent Eur Agric. 2019;20(1):157–78. doi:10.5513/JCEA01/20.1.2142. [Google Scholar] [CrossRef]
54. Kurosaki H, Yumoto S, Matsukawa I. Correlation of cold-weather tolerance with pubescence color and flowering time in yellow hilum soybeans. Breed Sci. 2004;54(4):303–11. doi:10.1270/jsbbs.54.303. [Google Scholar] [CrossRef]
55. Djanaguiraman M, Prasad PVV, Boyle DL, Schapaugh WT. Soybean pollen anatomy, viability and pod set under high temperature stress. J Agron Crop Sci. 2013;199(3):171–7. doi:10.1111/jac.12005. [Google Scholar] [CrossRef]
56. Kato S, Fujii K, Yumoto S, Ishimoto M, Shiraiwa T, Sayama T, et al. Seed yield and its components of indeterminate and determinate lines in recombinant inbred lines of soybean. Breed Sci. 2015;65(2):154–60. doi:10.1270/jsbbs.65.154. [Google Scholar] [PubMed] [CrossRef]
Cite This Article
 Copyright © 2025 The Author(s). Published by Tech Science Press.
This work is licensed under a Creative Commons Attribution 4.0 International License , which permits unrestricted use, distribution, and reproduction in any medium, provided the original work is properly cited.
 Downloads
 Citation Tools