
 Submit a Paper
 Propose a Special lssue
 Open Access
ARTICLE

Tritipyrum Aux/IAA13L Increases Chlorophyll Content and Yield in Wheat
1 College of Agricultural, Guizhou University, Guiyang, 550025, China
2 Guizhou Subcenter of National Wheat Improvement Center, Guiyang, 550025, China
* Corresponding Authors: Suqin Zhang. Email: ; Guangdong Geng. Email:
# These authors contributed equally to this work as the first author
Phyton-International Journal of Experimental Botany 2025, 94(10), 3175-3188. https://doi.org/10.32604/phyton.2025.070731
Received 22 July 2025; Accepted 22 September 2025; Issue published 29 October 2025
 View Full Text
 Download PDF
Abstract
Wheat yield mainly depends on leaf photosynthesis and grain carbohydrate accumulation. The aux/indole-3-acetic acid 13-like (Aux/IAA13L) gene was successfully cloned from Tritipyrum ‘Y1805’ and transformed into common wheat. A bioinformatics analysis showed that the TtAux/IAA13L protein, encoding 232 amino acids, was hydrophilic and unstable. TtAux/IAA13L and Tel5E01G609500 were grouped together in a phylogenetic tree. The TtAux/IAA13L expression levels in the overexpression lines were higher than in the wild-type (WT) plants at five developmental stages: tillering, elongation, heading, flowering, and grain-filling. The expression levels in the overexpression lines first increased, peaked at the flowering stage, and then decreased. However, the expression level in WT plants changed little among the five stages. The chlorophyll contents, net photosynthetic rates, stomatal conductances, and transpiration rates of the overexpression lines were higher than in the WT plants. Compared with WT plants, plant height in the overexpression lines decreased, whereas stem diameter, flag leaf area, grain number per spike, 1000-grain weight, and grain yield per plant increased. The average grain yield per plant of two overexpression lines increased by 24.56% and 23.46%, compared with those of WT plants, in 2024 and 2025, respectively. In brief, the TtAux/IAA13L gene enhanced the chlorophyll content and flag leaf area, thereby increasing the net photosynthetic rate and grain yield per plant. Consequently, it could be used to breed high-yield wheat cultivars.Keywords
Supplementary Material
Supplementary Material FileCommon wheat (Triticum aestivum L.) is a widely cultivated and consumed crop, providing a staple food for millions of people worldwide. Wheat plays a crucial role in food security, social stability, and economic development in China [1]. Wheat yield mainly depends on leaf photosynthesis and grain carbohydrate accumulation. Photosynthesis utilizes the sun’s energy, and it absorbs carbon dioxide from the atmosphere and convert it into soluble carbohydrates. These carbohydrates are then used for plant growth and have a direct impact on crop yields [2,3]. By improving light collection and effective utilization, the photosynthetic process can be regulated, thereby enhancing plant productivity. Photosynthetic pigments, including chlorophyll and carotenoids, play crucial roles in the capture of light energy and protection of photosynthetic organisms. Therefore, they are of vital importance for improving plant productivity [4]. Chlorophylls are important photosynthetic pigments, which absorb, transfer, and convert light energy into electrical energy, thereby facilitating the smooth progress of photosynthesis. They are indispensable in plant growth and development [5]. Thus, increases in crop chlorophyll contents and photosynthetic rates are beneficial for enhancing the crop yield [6].
Plant hormones play crucial roles in regulating various physiological processes and are indispensable in growth and development. They are widely involved in responses to environmental stress [7,8]. Auxin (Aux) plays key regulatory roles in plant growth and development, including promoting cell elongation growth, vascular tissue development, apical dominance, and tropism [9–11], and it can also regulate plant responses to stresses [12]. The Aux signal transduction requires the cooperation of Aux TIR1/AFB receptors, transcriptional repressor factor Aux/indole-3-acetic acid (IAA) family members, and Aux response factors (ARFs) [13]. The Aux/IAA protein family is the core component of Aux signal transduction pathway. The family members usually contain four conserved characteristic domains: I, II, III, and IV [14]. When the Aux level is low, Aux/IAA proteins combine with ARF transcription factors, thereby inhibiting their function. Conversely, if the Aux concentration is high, then the TIR1/AFB receptor protein mediates the degradation of Aux/IAA proteins, ARF transcription factors are no longer inhibited. In this manner, the Aux response gene expression level is regulated [15]. The changes in wheat Aux/IAA expression level can be beneficial for the plant to adapt to alkaline stresses [16]. Apple Aux/IAA gene IAA9 overexpression in tobacco significantly increases plant tolerance to osmotic stress [17]. In rice, IAA18 and IAA20 overexpression can enhance salt and drought tolerance [18,19].
Currently, plant Aux/IAA genes research mainly focuses on tolerance to abiotic stresses [16–19]. There are limited reports on the Tritipyrum Aux/IAA gene related to chloroplast content and photosynthesis. Here, the Aux/IAA13L gene was successfully cloned from Tritipyrum. Using bioinformatics analyses, phenotypic identification, and physiological–biochemical determinations of transgenic wheat lines, the characteristics and functions of the TtAux/IAA13L gene were investigated for breeding high-yield wheat.
The main plant materials were salt-tolerant octoploid Tritipyrum ‘Y1805’ (AABBDDEE) and salt-sensitive common wheat ‘1718’. The former is a stable progeny from a wide cross between T. aestivum and Thinopyrum elongatum that contains not only A, B, and D chromosomes from wheat parent but also a set of E group chromosomes originating from Th. elongatum. After cloning the TtAux/IAA13L gene from ‘Y1805’, it was transformed into salt-sensitive ‘1718’ wheat using the coleoptile method [20], and TtAux/IAA13L overexpression (OE) T3 pure lines were selected. All the materials were conserved in Guizhou Subcenter of National Wheat Improvement Center.
2.2 RNA Reverse Transcription, TtAux/IAA13L Amplification, and Plasmid Construction
Total RNA was extracted from ‘Y1805’ young leaves using a plant RNA extraction kit (Omega Bio-Tek, Norcross, GA, USA). RNA quality was detected using 1.0% agarose gel electrophoresis and a NanoDrop One spectrophotometer (Thermo Fisher Scientific, Carlsbad, CA, USA). Total RNA was reverse-transcribed into cDNA using a PrimeScript RT kit (Takara, Dalian, China). The TtAux/IAA13L full-length coding sequence was amplified from ‘Y1805’ cDNA using primers containing BsaI restriction sites at the 5′ and 3′ ends of the amplified fragment (Table S1). The amplified fragment was inserted into the pEGOEPubi-H OE vector using T4-DNA ligase (Takara) following the manufacturer’s protocol. This vector was modified to include a green fluorescence protein (GFP) gene. The inserted sequence was driven by a corn ubiquitin promoter.
2.3 TtAux/IAA13L Bioinformatics Analysis
The amino acid sequences of TtAux/IAA13L homologous proteins in the NBCI database were compared using Snapgene software. TtAux/IAA13L open reading frames (ORFs) were predicted and analyzed using the online software ORF Finder (https://www.ncbi.nlm.nih.gov/gorf/gorf.html (accessed on 22 September 2025)). The hydrophilicity/hydrophobicity of TtAux/IAA13L was predicted using the Expasy−ProtScale software (https://web.expasy.org/protscale/ (accessed on 22 September 2025)), and its signal peptide was predicted using the Signal5.0 software (https://services.healthtech.dtu.dk/services/SignalP-5.0/ (accessed on 22 September 2025)). Additionally, the phosphorylation sites were predicted using the NetPhos software (https://services.healthtech.dtu.dk/services/NetPhos-3.1/ (accessed on 22 September 2025)), and the conserved domains were predicted using the Conserved Domain Search of the NCBI database. The tertiary structure of TtAux/IAA13L was predicted using the online software SWISS-Model (https://swissmodel.expasy.org/ (accessed on 22 September 2025)). Its homologous sequences were retrieved using BLAST, and a phylogenetic tree was constructed using the Neighbor-joining method with MEGA7.0 software. The bootstrap test value was set to 1000.
2.4 TtAUX/IAA13L Subcellular Localization
The TtAUX/IAA13L gene was transiently introduced into the leaves of 4-week-old tobacco using Agrobacterium transformation. The transformed tobaccos were cultured at 28°C for 3 d in dark. The GFP fluorescence in the transformed tobacco mesophyll was observed by a confocal laser scanning microscope (FV1000 Olympus Corp., Tokyo, Japan). Leaf transformation with the 1300-GFP vector without the target gene was used as the control.
2.5 TtAux/IAA13L Transformation and Screening
The TtAux/IAA13L gene was transformed into common wheat ‘1718’ using the coleoptile method [20]. Briefly, the apical meristem of each approximately 2-cm-length coleoptile was cut and placed in Agrobacterium (containing the TtAux/IAA13L gene) solution under 15 KPa vacuum pressure for 5 min for infection. When the transformed seedlings grew to the two-leaf stage, positive transgenic plants were first screened using a LUYOR-3415RG lamp (LUYOR Corporation, Shanghai, China) and then verified by PCR.
2.6 Determination of TtAux/IAA13L Copy Number
The genomic DNAs of the wild-type (WT) plant and the plasmid containing TtAux/IAA13L gene were independently diluted to different concentrations. Quantitative real-time PCR (qPCR) was used to amplify the Pinb-D1 (single-copy) and TtAux/IAA13L genes. qPCR standard curves were used as reference [21]. Then, the DNAs of the TtAux/IAA13L OE T3 lines were extracted and subjected to qPCR. The TtAux/IAA13L copy number in each OE line was determined.
2.7 Analysis of TtAux/IAA13L Gene Expression Characteristics
Total RNA was extracted from tender leaves of TtAux/IAA13L OE lines at the tillering (T1), elongation (T2), heading (T3), flowering (T4), and grain-filling (T5) stages, and then RNA purity and concentration were determined using the methods described in Section 2.2. The qPCR primers were designed based on the sequence of the TtAux/IAA13L gene to detect TtAux/IAA13L expression (Table S1). 18S and β-actin was used as the internal reference. The gene relative expression level was calculated using the 2−ΔΔCt method [22], with three biological replications and three technical replications.
2.8 Measurement of Physiological–Biochemical Indicators
Wheat leaf samples of TtAux/IAA13L OE lines and WT plants were collected from the T1 to T5 stages. The contents of chlorophyll a and chlorophyll b in the leaves were determined using Dudek et al.’s method [23]. Three photosynthetic parameters, net photosynthetic rate (Pn), stomatal conductance (Gs), and transpiration rate (Tr), were measured using a LI-6400 portable photosynthesis system (Li-Cor, Lincoln, NE, USA). The experiment included three biological replicates, with each replicate containing 10 plants of uniform size.
2.9 Agronomic Trait Determination
When TtAux/IAA13L OE lines and WT plants became ripe in May 2024 and 2025, 10 plants were selected for agronomic trait determination. Plant height, stem diameter, flag leaf length, flag leaf width, grain number per spike, 1000-grain weight, and grain yield per plant were measured, and then, flag leaf area was calculated following the method of Liu et al. [24].
A variance analysis of the experiment data was performed using SPSS 20.0 (IBM Corp., Armonk, NY, USA), with p < 0.05 indicating a significant difference between sample means. Charts were constructed using Origin 2021 (OriginLab, Northampton, MA, USA).
Using ‘Y1805’ cDNA as a template, a 696-bp target fragment was amplified with Tel5E01G609500-specific primers (Fig. 1A) and named TtAux/IAA13L. The TtAux/IAA13L sequence was similar to that of the Tel5E01G609500 reference gene, with a homology of 96.85% (Fig. 1B).
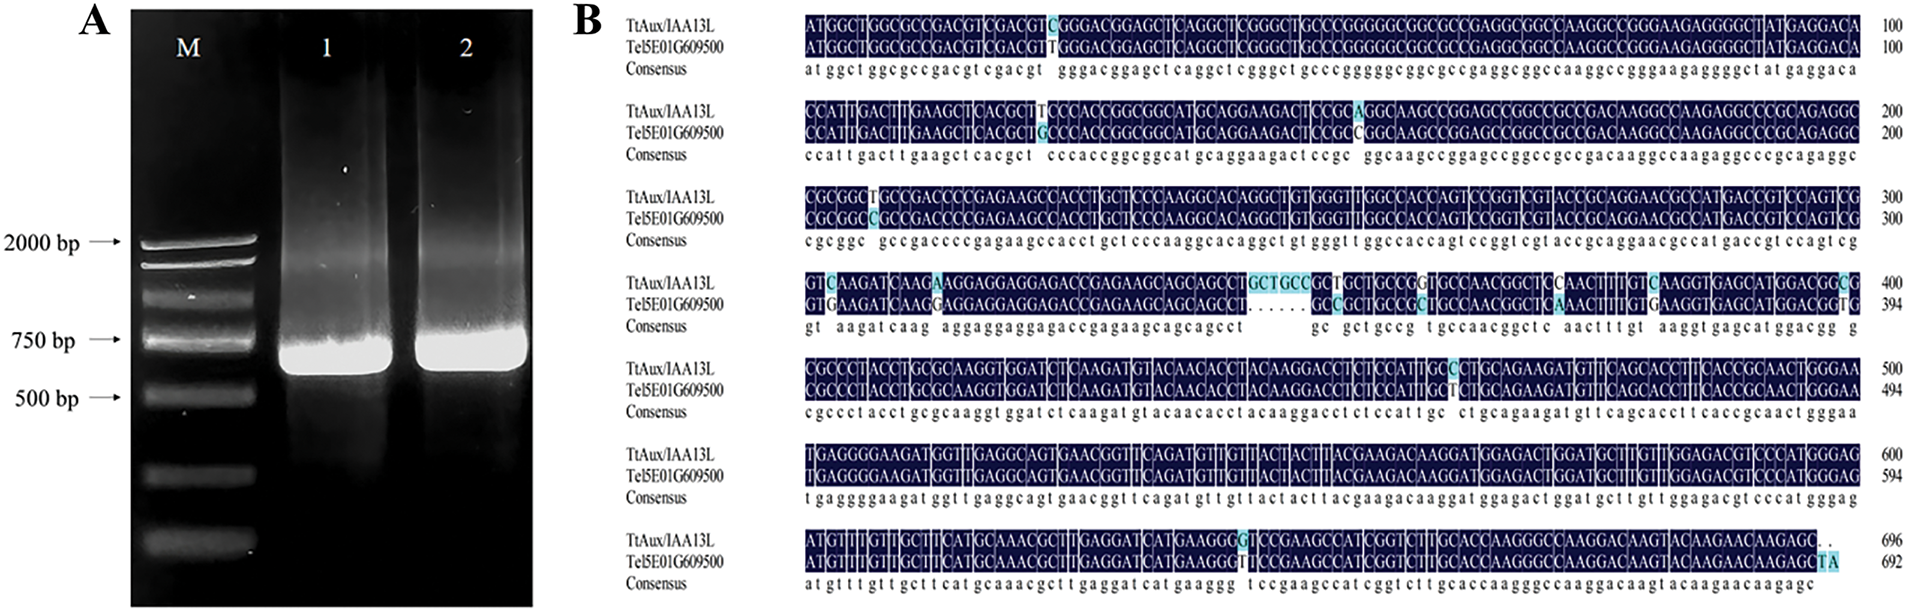
Figure 1: Cloning and alignment of the Aux/IAA13L gene from Tritipyrum ‘Y1805’. (A) 1, 2: Bands amplified from template ‘Y1805’ cDNA; M, D2000 marker. (B) Alignment of TtAux/IAA13L and Tel5E01G609500 from Th. elongatum. Blue gaps indicate different bases
3.2 TtAux/IAA13L Bioinformatics Analysis
The bioinformatics analysis indicated that the TtAux/IAA13L protein encoded 232 amino acids. The protein’s molecular formula was C1082H1738N302O342S11, with a molecular weight of 24.80 kDa, and a theoretical isoelectric point of 7.67. Among the amino acids, the alanine content was highest (13.8%), followed by lysine (10.3%), glycine (9.9%), and glutamic acid (7.3%). Its total average hydrophilicity was –0.57 (Fig. 2A), making it a hydrophilic protein. Its signal peptide value was 0.45 (Fig. 2B), indicating that it had no signal peptide and was a non-secretory protein. Its instability coefficient was 42.27, suggesting that it might be unstable. TtAux/IAA13L contained 21 kinase phosphorylation sites (9 serines, 9 threonines, and 3 tyrosines) (Fig. 2C). The homology modeling prediction result showed that the compatibility of this model with B8A2Y3.1.A (auxin-responsive protein, AUX33) was 83.55% (Fig. 2D), which conformed to the model standard. The protein contained a conserved PB1 domain at 124–214 amino acids (Fig. 2E), making it a member of the Aux/IAA family. In the phylogenetic tree, TtAux/IAA13L and Tel5E01G609500 grouped together (Fig. 2F), indicating that they have similar sequences and functions.
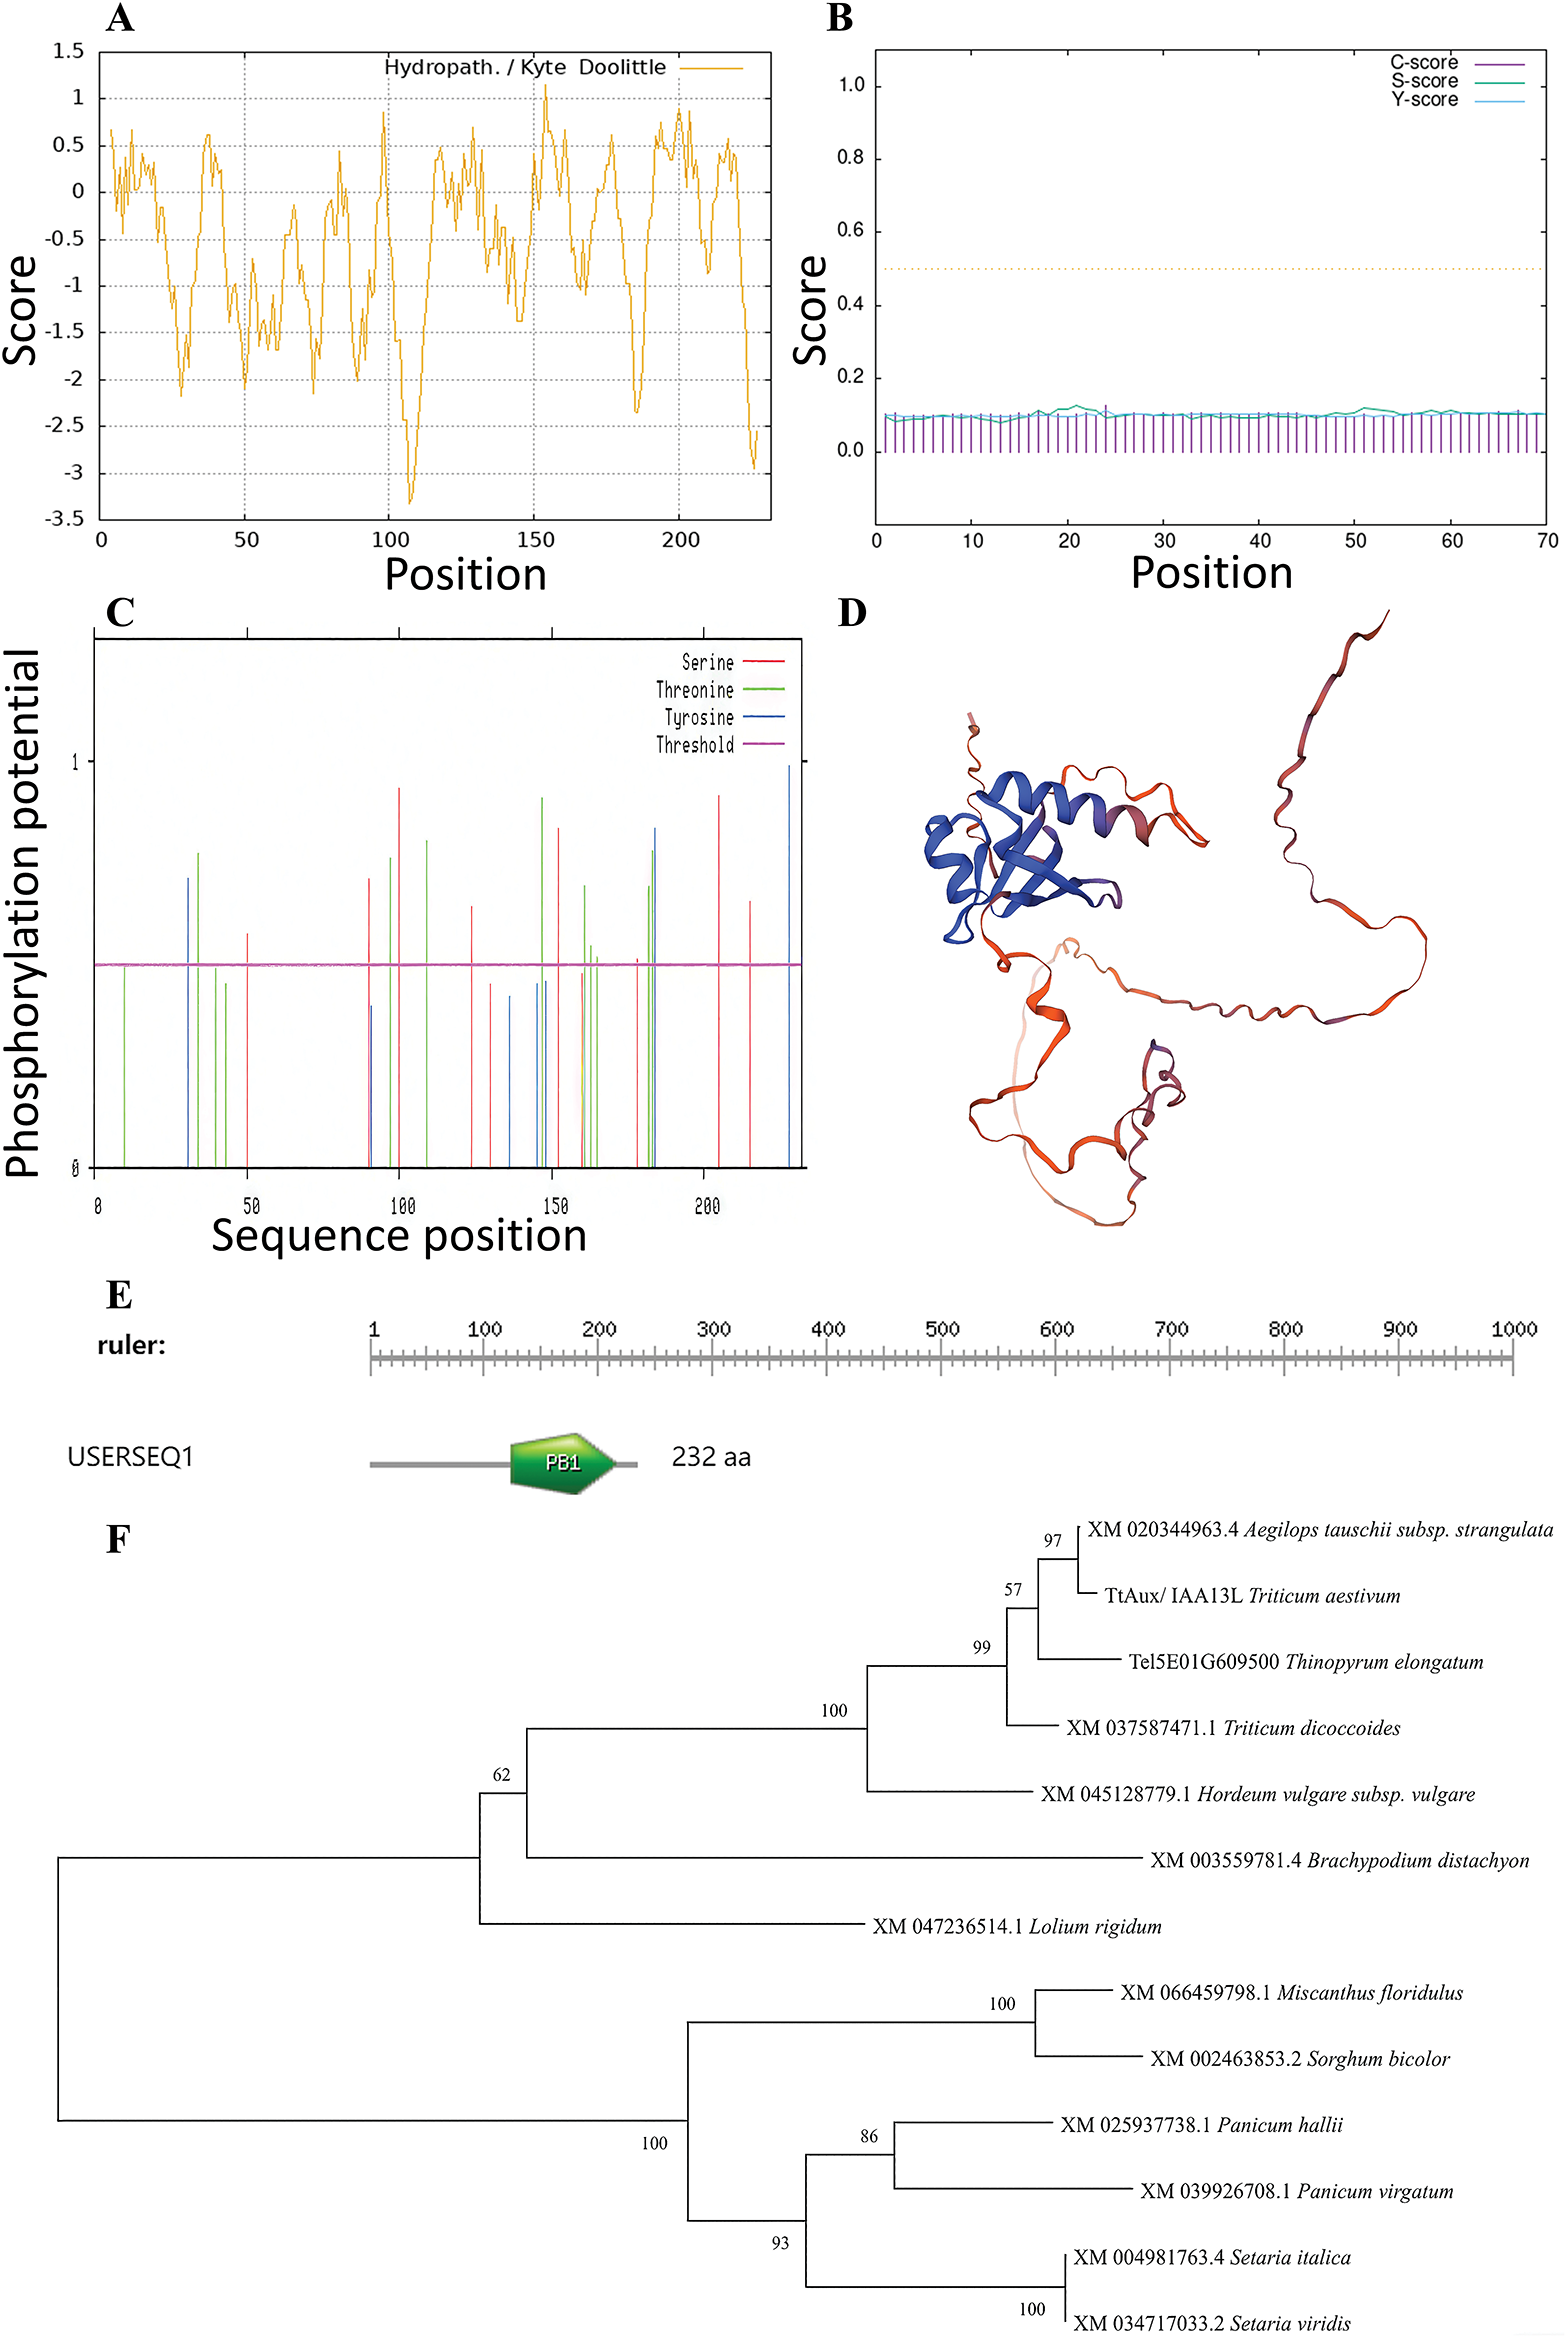
Figure 2: Bioinformatics analysis of the TtAux/IAA13L protein. (A) Hydrophilicity. (B) Signal peptide. (C) Phosphorylation sites. (D) Homology modeling. (E) Protein structural domain (aa, amino acid residue number). (F) Phylogenetic tree of Aux/IAA13 proteins from different species
3.3 TtAUX/IAA13L Subcellular Localization
To determine TtAUX/IAA13L subcellular localization, a fusion protein was constructed and transiently expressed as TtAUX/IAA13L-GFP in tobacco mesophyll. It was observed that the fluorescence emitted from this fusion protein was closely overlapped with red nuclear mCherry signals and localized in the nucleus (Fig. 3), which should participate in gene transcriptional regulation in the nucleus.
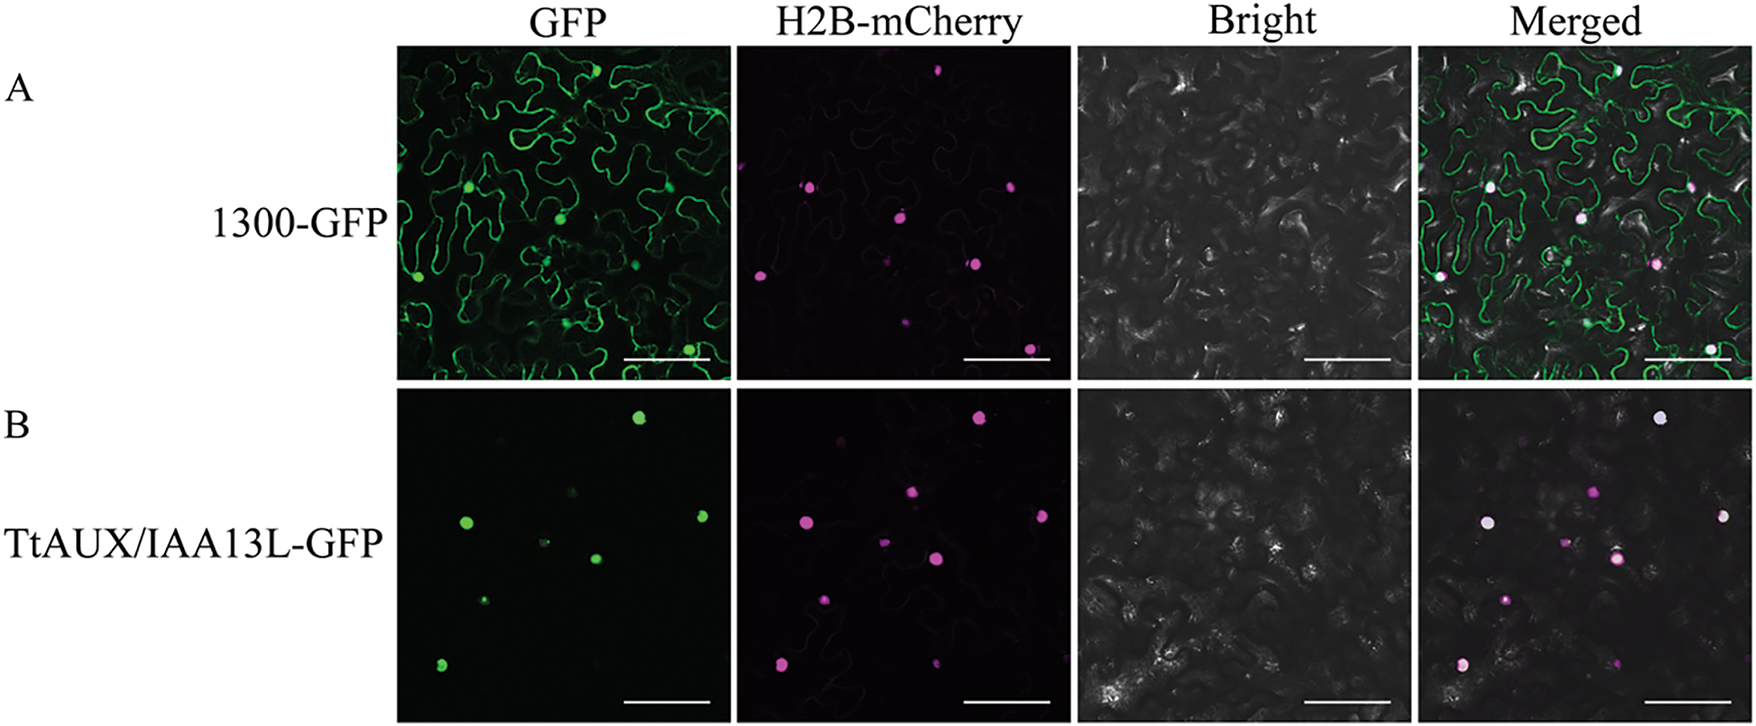
Figure 3: Subcellular localization of TtAUX/IAA13L protein in tobacco mesophyll cells. (A) The vector control 1300-GFP was transferred into tobacco mesophyll cells. (B) Fusion protein vector TtAUX/IAA13L-GFP was transferred into tobacco mesophyll cells. Nuclei in tobacco leaf cells were marked by co-expressed H2B-mCherry. Bar = 25 μm
3.4 Determination of TtAux/IAA13L Copy Number in the OE Lines
Based on the linear relationship between the logarithmic values of different initial template concentrations and their corresponding Ct values, the standard curves for Pinb-D1 and TtAux/IAA13L genes were obtained (Fig. 4). The standard curve for TtAux/IAA13L was y = −2.9236x + 32.285 (R2 = 0.9961), and the standard curve for Pinb-D1 was y = −2.9299x + 31.763 (R2 = 0.9909). The correlation coefficients of the two standard curves were both close to 1, indicating that the standard curves could be used to detect gene copy numbers of transgenic plants. The TtAux/IAA13L copy number in each OE line was determined by referencing the standard curve and Ct values of Pinb-D1 and TtAux/IAA13L genes. The two OE lines were determined to be single-copy (Table S2). The phenotypic traits, like plant height, stem diameter, and leaf color, of the two OE T3 lines were stable and did not segregate. Thus, the two OE lines used in this experiment were single-copy and homozygous.
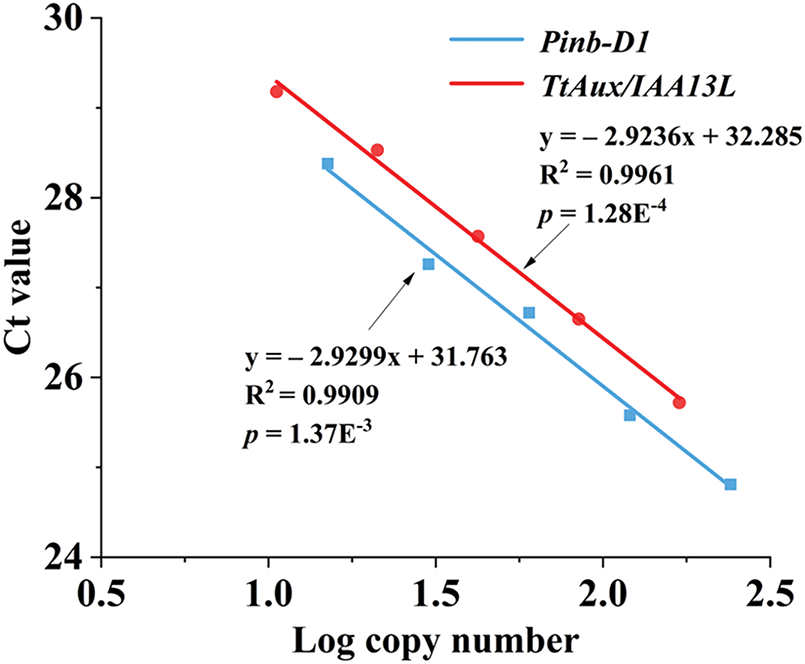
Figure 4: Standard curves of the TtAux/IAA13L and reference genes. The logarithm of the initial template copy number are presented on the x-axis and the CT value on the y-axis
3.5 TtAux/IAA13L Wheat Transformation and Positive Plant Identification
Using the method of Yang et al. (2022), the TtAux/IAA13L gene was transformed into common wheat ‘1718’. DNA was extracted from tender leaves of transformed plants, and the presence of the gene was determined using PCR. The target band was amplified in Lanes 1, 3, 4, and 7 (Fig. 5), indicating that these were transgenic plants. The TtAux/IAA13L transgenic T3 lines were used for subsequent experiments.
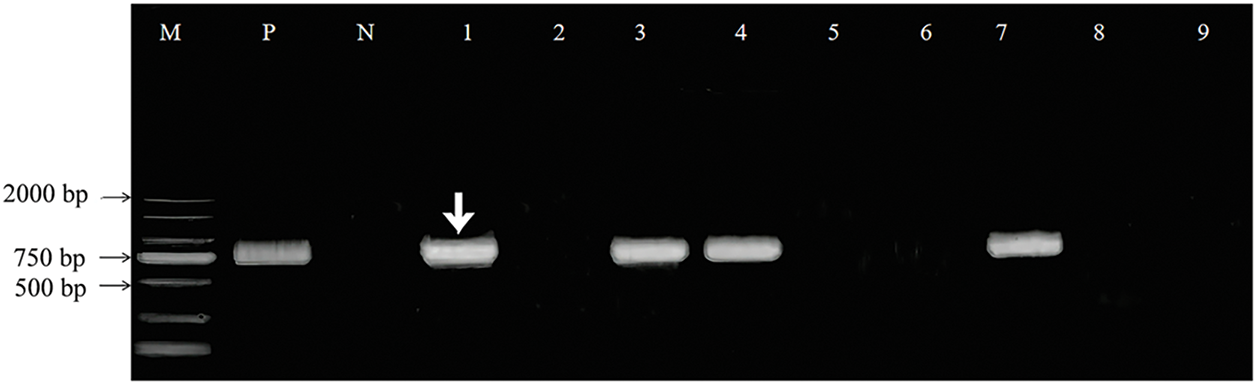
Figure 5: PCR identification of TtAux/IAA13L transgenic plants. The white arrow indicates the amplified target TtAux/IAA13L fragment. M: 2000-bp DNA marker, Lanes 1, 3, 4, and 7: transgenic plants, Lanes 2, 5, 6, 8, and 9: non-transgenic plants, P: positive control (recombinant plasmid), N: negative control (wild-type DNA)
3.6 TtAux/IAA13L Expression Feature in the OE Line
To understand TtAux/IAA13L expression characteristics, qPCR was conducted to analyze its relative expression levels in OE plants’ leaves at five stages. The qPCR results showed that TtAux/IAA13L expression levels in the OE line were higher than in the WT plants for all five stages. Compared with the WT plants, the expression levels of the OE line increased by 1.76-, 9.00-, 12.34-, 14.73-, and 1.42-fold at the T1, T2, T3, T4, and T5 stages, respectively (Fig. 6). From the T1 to T4 stages, the expression levels in this OE line increased, peaking at the T4 stage, but then, they decreased at the T5 stage. However, the expression levels in WT plant changed little among the five stages.
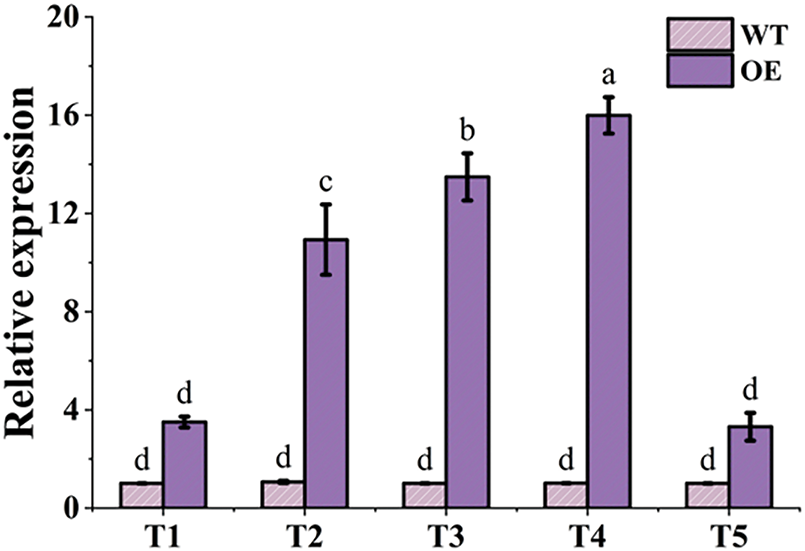
Figure 6: The relative expression level of the TtAux/IAA13L gene in leaves was detected at five developmental stages by qPCR. T1, T2, T3, T4, and T5 represent the tillering, elongation, heading, flowering, and grain-filling stages, respectively. Bars indicate means with standard deviations (n = 3). Values with different letters are significantly different at p < 0.05
3.7 TtAux/IAA13L Overexpression Effect on Chlorophyll Contents
Chlorophylls are photosynthetic pigments that play key roles in photosynthesis. The leaves of the OE lines were greener than those of the WT plants (Fig. 7A). The contents of leaf chlorophyll a and chlorophyll b showed a trend of increasing first, peaking at the T4 stage, and then decreasing in two wheat varieties (Fig. 7B,C). In the T1 to T5 period, the contents of chlorophyll a and chlorophyll b in the OE lines were higher than in the WT plants. The differences were greatest in the T2 stage. As a consequence, TtAux/IAA13L overexpression increased the wheat chlorophyll contents and maintained a high chlorophyll level during reproductive period, which is beneficial for grain filling and yield.
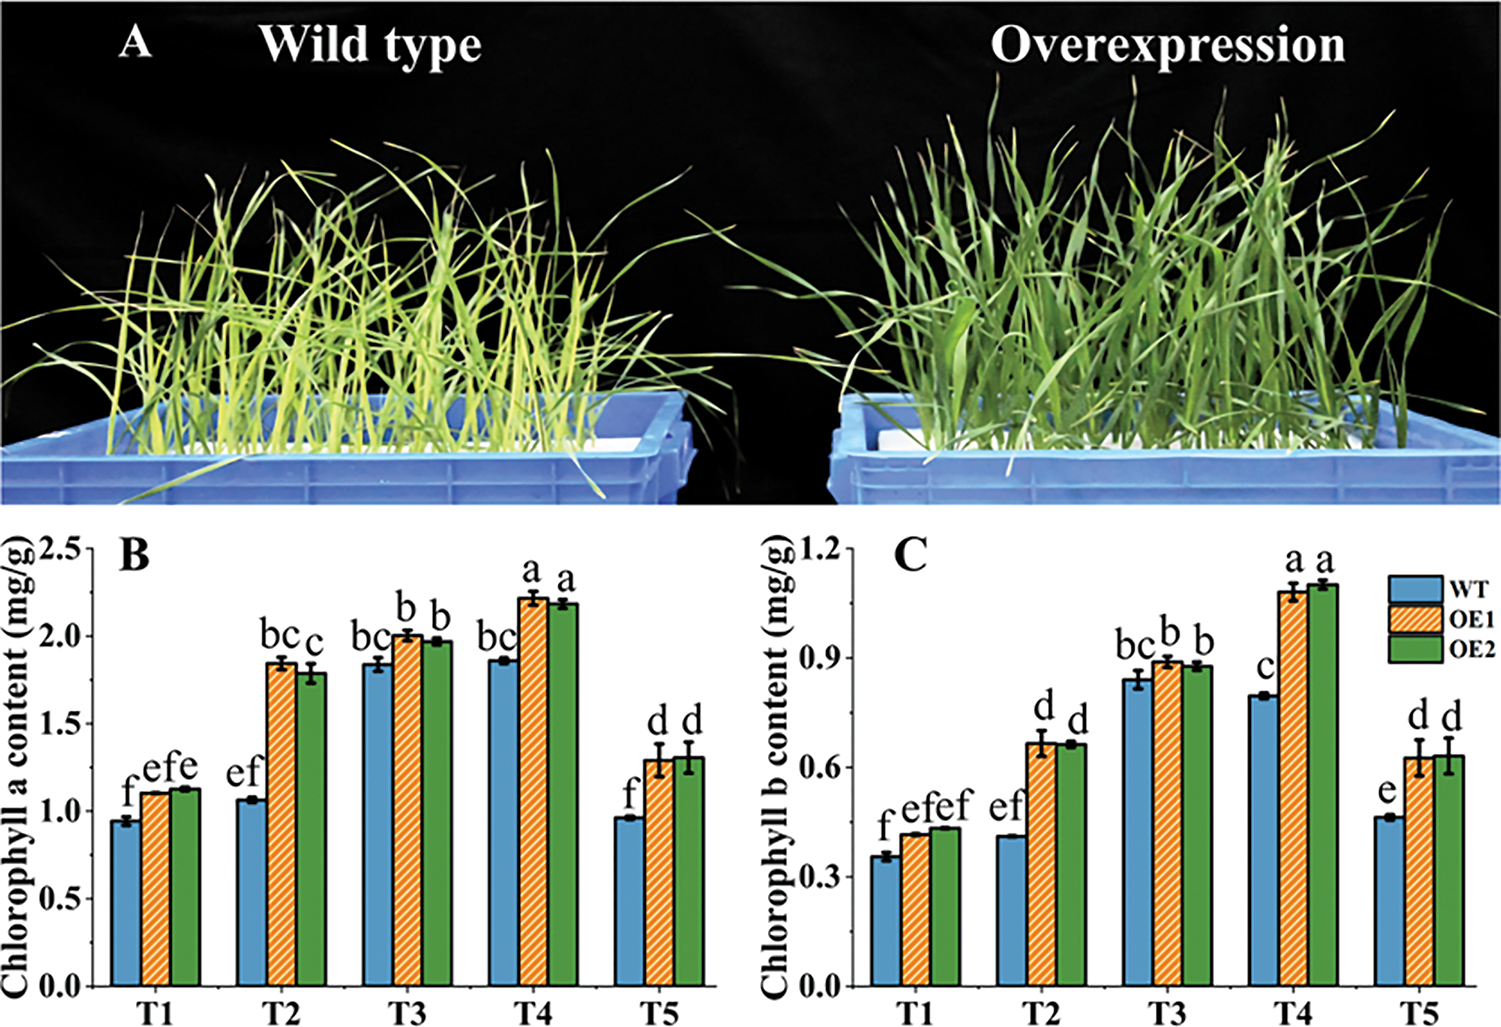
Figure 7: TtAux/IAA13L overexpression effect on chlorophyll contents. (A) Images of wild-type and TtAux/IAA13L OE line at the tillering stage. (B) Chlorophyll a contents. (C) Chlorophyll b contents. T1, T2, T3, T4, and T5 represent the tillering, elongation, heading, flowering, and grain-filling stages, respectively. Bars indicate means with standard deviations (n = 3). Values with different letters are significantly different at p < 0.05
3.8 TtAux/IAA13L Overexpression Effects on Photosynthetic Parameters
Plant growth and crop yield are essentially determined by photosynthesis [25]. The Pn values of the OE lines and WT plants increased first, peaked at the T4 stage, and then decreased (Fig. 8A). The Pn values of the OE lines were significantly higher than those of the WT plants at five developmental stages, with the greatest difference at the T2 stage. The mean Pn of the OE lines was 35.91% greater than that the WT plants at the T2 stage. The mean Pn increase of two OE lines was greatest (33.18%) from the T1 to T2 stages, while that of the WT plants only increased by 13.19%. The changes in Gs and Tr values were consistent with those of the Pn in the OE lines and WT plants (Fig. 8B,C). TtAux/IAA13L overexpression contributed to photosynthesis and enhanced the Pn, indicating that it may improve wheat growth and yield.
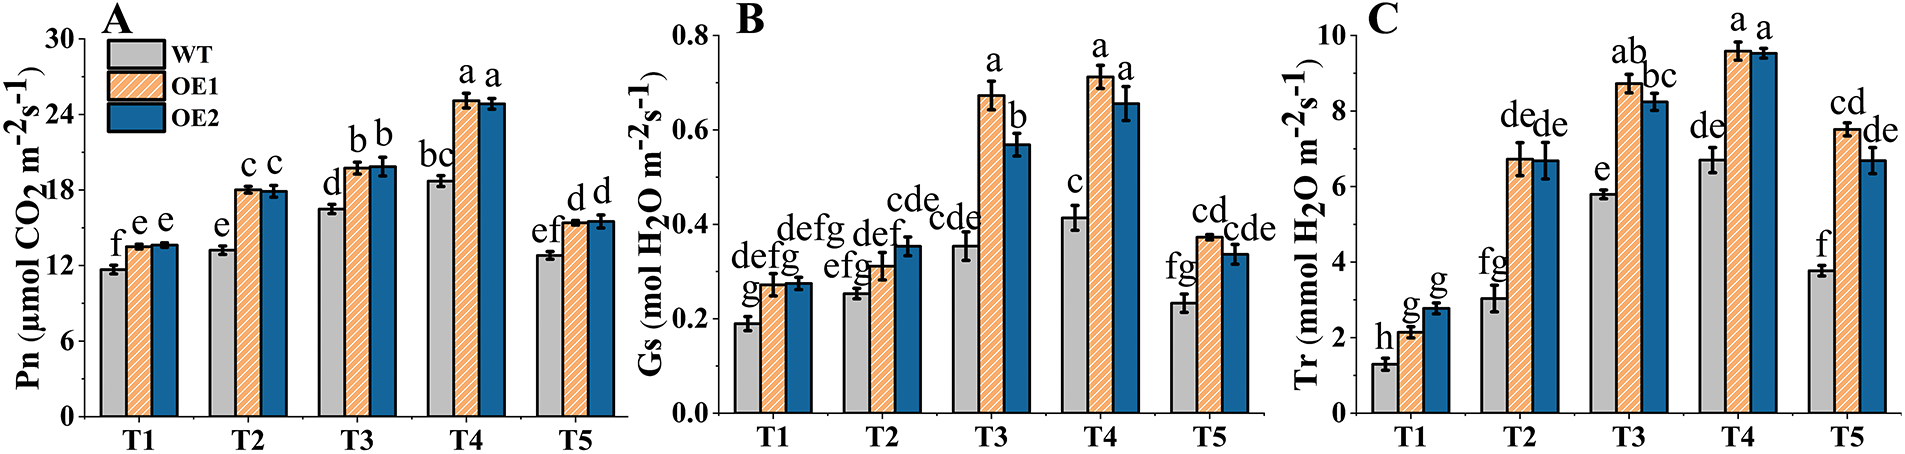
Figure 8: The effects of TtAux/IAA13L gene overexpression on photosynthetic parameter. (A) Net photosynthetic rate. (B) Stomatal conductance. (C) Transpiration rate. T1, T2, T3, T4, and T5 represent the tillering, elongation, heading, flowering, and grain-filling stages, respectively. Bars indicate means with standard deviations (n = 3). Values with different letters are significantly different at p < 0.05
3.9 TtAux/IAA13L Overexpression Effect on Yield and Other Related Traits
The OE lines’ plants were significantly shorter than those of the WT plants in 2024 and 2025 (Fig. 9A). However, the stem diameters and flag leaf areas of the OE plants were significantly greater than those of the WT plants (Fig. 9B,C). Thus, TtAux/IAA13L overexpression reduced plant height and increased stem diameter, thereby enhancing the plants’ lodging resistance. The OE lines had larger flag leaf areas compared to WT plants, allowing the former to synthesize more photosynthetic products for seed growth.
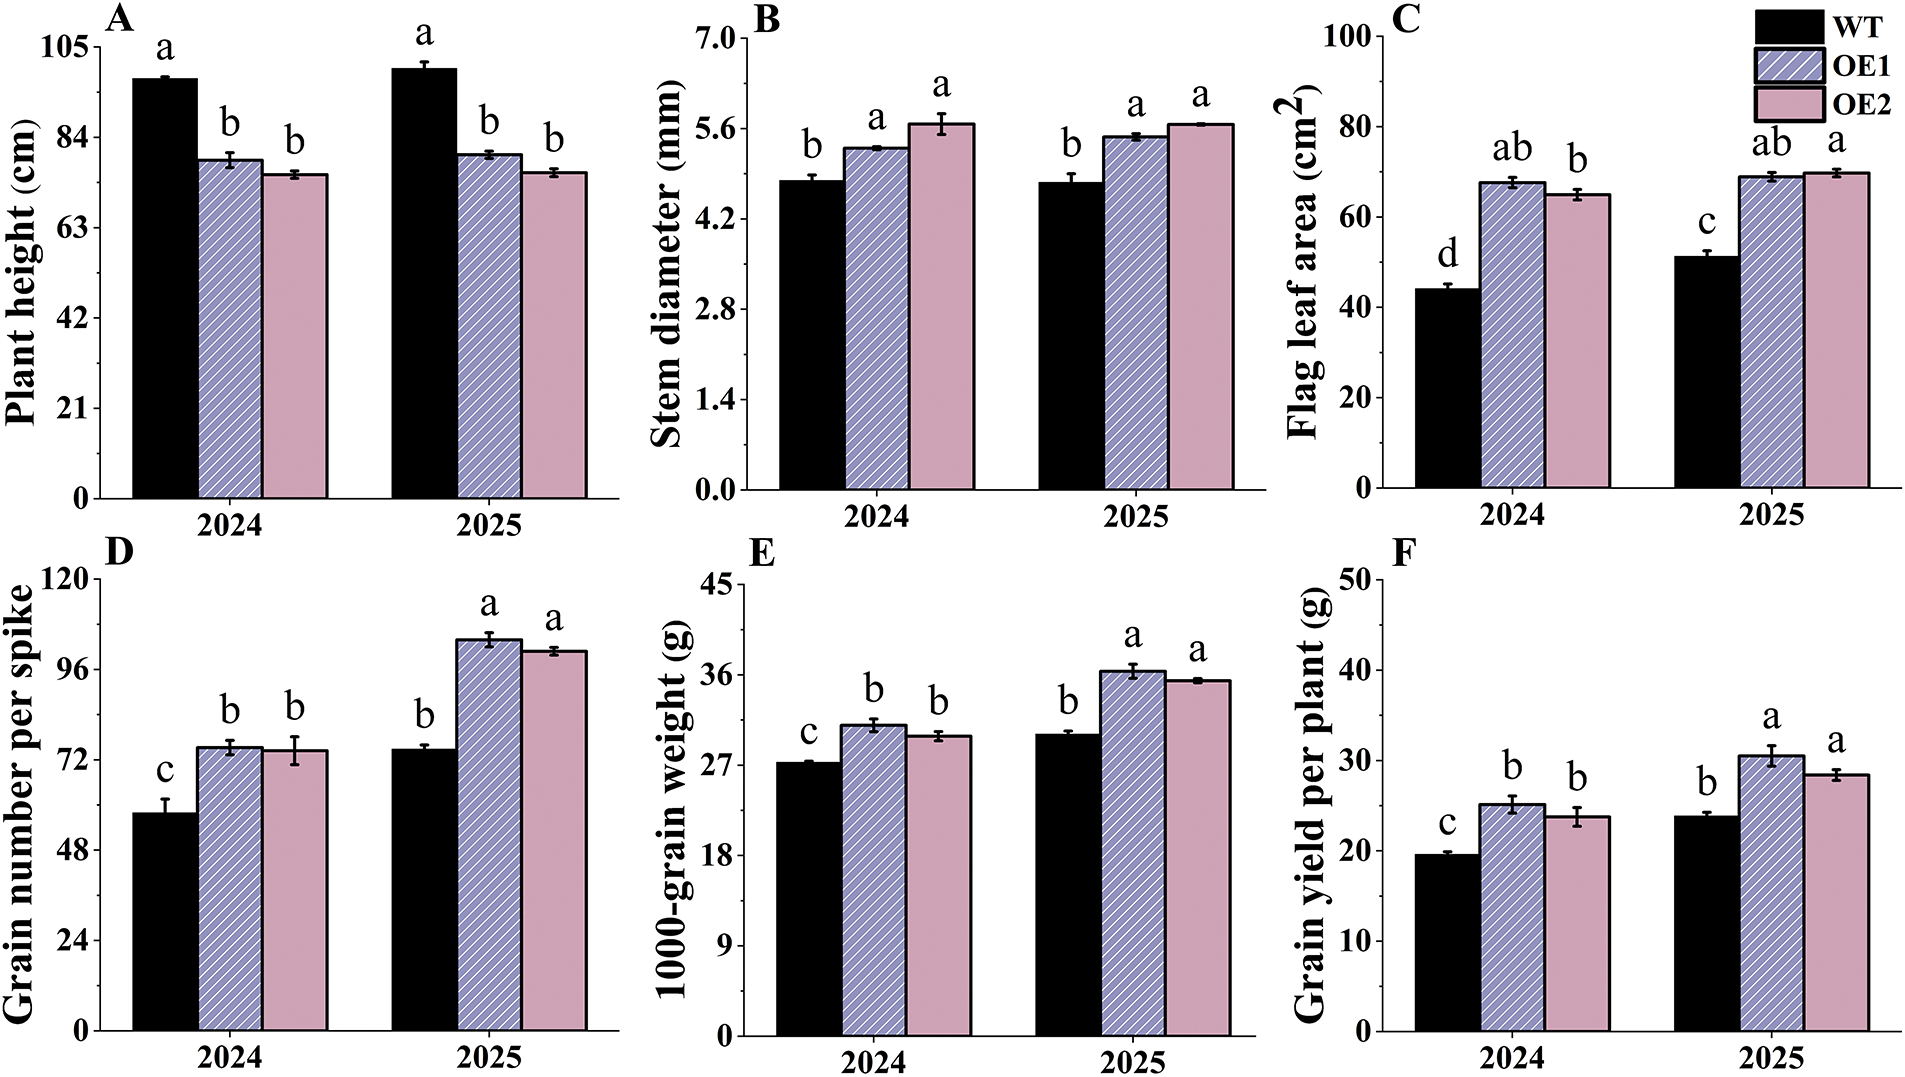
Figure 9: The effects of the TtAux/IAA13L overexpression on agronomic traits. (A) Plant height. (B) Stem diameter. (C) Flag leaf area. (D) Grain number per spike. (E) 1000-grain weight. (F) Grain yield per plant. Bars indicate means with standard deviations (n = 3). Values with different letters are significantly different at p < 0.05
Grain numbers per spike and 1000-grain weights of the OE lines significantly increased compared with those of WT plants in 2024 and 2025 (Fig. 9D,E). The average grain yields per plant of the two OE lines were 24.56% and 23.46% greater than those of WT plants in 2024 and 2025, respectively (Fig. 9F), indicating TtAux/IAA13L overexpression enhanced grain yield per plant and played an important role in regulating yield components.
Auxins regulate many plant developmental processes, such as cell division, enlargement and differentiation, and flower and fruit development [26,27]. Plant Aux/IAA is a member of the Aux response gene family and is a key component of Aux signal transduction. Current research on AUX/IAA is mostly performed in rice [28,29], Brachypodium distachyon [30], and Arabidopsis [31,32], while research in wheat is limited. TtAux/IAA13L was localized in the nucleus, and its stability was low, which agreed with its regulatory function. TtAux/IAA13L and Tel5E01G609500 clustered together in the phylogenetic tree, indicating similar sequences and functions (Fig. 2F). Protein-protein interaction analysis between TtAUX/IAA13 and ARF proteins showed that TtAUX/IAA13L interacted with many ARF transcription factors (Fig. S1).
Chlorophylls are essential pigments for plant photosynthesis. In this study, the chlorophyll contents of the OE lines were greater than those of WT plants at five developmental stages. The chlorophyll contents of the OE lines peaked during the reproductive period, thereby promoting grain growth and filling. Additionally, the chlorophyll contents of the OE lines showed rapid increases during the T1 to T2 stages, whereas those of the WT plants increased during the T2 to T3 stages (Fig. 7B,C). This may indicate that the OE lines entered the growth active stage early, accelerating the accumulation of photosynthetic products for the following reproductive growth.
Plant leaves are principal photosynthetic organs. When plant leaf area increases, crop biomass and grain yield also increase [33]. During plant growth and development processes, the photosynthesis of the flag leaves plays the most crucial role in grain growth [34]. After the spike emerges, the photosynthetic activities of flag leaves are the highest in crop canopy, resulting in a significant impact on crop yield [35,36]. In Arabidopsis thaliana, IAA27 participates in regulating plant growth and development, and its constitutive overexpression significantly increases leaf length and leaf width [31]. In this study, the mean flag leaf areas of two OE lines increased by 40.21% and 35.12% over those of the WT plants in 2024 and 2025, respectively (Fig. 9C), resulting in positive impacts on wheat yield.
Photosynthesis produces carbohydrates that are used for plant growth and development [37], thereby having direct impacts on crop yield. There is a positive correlation between crop grain yield and the Pn. A Pn increase can lead to an increase in biomass, thereby enhancing grain yield [38,39]. Stomata can exchange water and gases with the external environment, affecting plant photosynthesis, transpiration, and respiration. In this study, the Pn, Gs, and Tr values of the OE lines were higher than those of the WT plants at the five developmental stages. Consequently, the photosynthetic features of the OE lines showed an advantage over those of the WT plants. The average grain yields per plant of two OE lines increased by 24.56% and 23.46% over those of WT plants in 2024 and 2025, respectively (Fig. 9F). The theoretical grain yield per 667 m2 of the OE lines reached as high as 545.43 kg (Fig. S2).
A plant’s height is closely related to its biomass and lodging resistance, and it is an important trait that affects grain yield and quality [40]. Reducing plant height and increasing stem thickness can reduce crop lodging, thereby increasing crop yield [40,41]. Rice IAA1 overexpression results in a decrease in plant height [34,42], and apple IAA19 regulates plant dwarfing [43]. Here, the plant heights of the TtAux/IAA13L OE lines were significantly reduced, but stem diameters significantly increased, compared with those of WT plants (Fig. 9A,B), indicating that TtAux/IAA13L could enhance wheat lodging resistance. Additionally, the OE lines began to head earlier than the WT plants, which could distribute more nutrients to wheat grains rather than to vegetative organs. As a result, the overexpression of the TtAux/IAA13L gene promoted grain filling and increased 1000-grain weight and grain yield per plant.
TtAUX/IAA13L expression level was significantly correlated with plant height, stem diameter, flag leaf area, grain number per spike, 1000-grain weight, and grain yield per plant as determined by a Pearson’s correlation analysis. This indicated that TtAUX/IAA13L OE had a significant impact on wheat phenotypic traits, especially yield. However, since there is no empty vector control lines in this study, it couldn’t exclude general effects from Agrobacterium transformation, vector elements, or transgene insertional mutagenesis. Therefore, empty vector control lines would be included for achieving reliable results in further experiments.
The TtAux/IAA13L gene was successfully cloned and transformed into common wheat. Flag leaf area, chlorophyll contents, Pn, Gs, Tr, grains per spike, and grain yield per plant values of the OE lines were greater than those of the WT plants. TtAux/IAA13L overexpression increased wheat chlorophyll content, Pn, and grain yield per plant. Thus, it may be useful in breeding new high-yield wheat cultivars.
Acknowledgement: Not applicable.
Funding Statement: This work was funded by the National Natural Science Foundation of China (32160442 and 32560458).
Author Contributions: Study conception and design: Mutong Li, Suqin Zhang; data collection: Mutong Li, Xiaolian Yang, Zhishun Yu, Tingting Yuan, Wenjie Wang; analysis and interpretation of results: Mutong Li; draft manuscript preparation: Mutong Li, Suqin Zhang, Guangdong Geng. All authors reviewed the results and approved the final version of the manuscript.
Availability of Data and Materials: All data generated or analyzed during this study are provided in this published article and its supplementary data files.
Ethics Approval: Not applicable.
Conflicts of Interest: The authors declare no conflicts of interest to report regarding the present study.
Supplementary Materials: Figure S1: Protein-protein interaction network of TtAux/IAA13L protein. Figure S2: The effects of the TtAux/IAA13L overexpression on the theoretical grain yield per 667 m2. Bars indicate means with standard deviations (n = 3). Values with different letters are significantly different at p < 0.05. Table S1: The primers used in the experiment. Table S2: TtAUX/IAA13L copy number in the overexpression lines. Table S3: Pearson correlation analysis between TtAUX/IAA13L expression levels and phenotypic traits. The supplementary material is available online at https://www.techscience.com/doi/10.32604/phyton.2025.070731/s1.
References
1. You L, Rosegrant MW, Wood S, Sun D. Impact of growing season temperature on wheat productivity in China. Agric For Meteorol. 2008;149(6–7):1009–14. doi:10.1016/j.agrformet.2008.12.004. [Google Scholar] [CrossRef]
2. Biel K, Fomina I. Benson-Bassham-Calvin cycle contribution to the organic life on our planet. Photosynthetica. 2015;53(2):161–7. doi:10.1007/s11099-015-0112-7. [Google Scholar] [CrossRef]
3. Simkin AJ, Kapoor L, Doss CG, Hofmann TA, Lawson T, Ramamoorthy S. The role of photosynthesis related pigments in light harvesting, photoprotection and enhancement of photosynthetic yield in planta. Photosynth Res. 2022;152(1):1–20. doi:10.1007/s11120-021-00892-6. [Google Scholar] [PubMed] [CrossRef]
4. Mirkovic T, Ostroumov EE, Anna JM, van Grondelle R, Govindjee, Scholes GD. Light absorption and energy transfer in the antenna complexes of photosynthetic organisms. Chem Rev. 2017;117(2):249–93. doi:10.1021/acs.chemrev.6b00002. [Google Scholar] [PubMed] [CrossRef]
5. Li Y, Cao T, Guo Y, Grimm B, Li X, Duanmu D, et al. Regulatory and retrograde signaling networks in the chlorophyll biosynthetic pathway. J Integr Plant Biol. 2025;67(4):887–911. doi:10.1111/jipb.13837. [Google Scholar] [PubMed] [CrossRef]
6. Shen BR, Wang LM, Lin XL, Yao Z, Xu HW, Zhu CH, et al. Engineering a new chloroplastic photorespiratory bypass to increase photosynthetic efficiency and productivity in rice. Mol Plant. 2019;12(2):199–214. doi:10.1016/j.molp.2018.11.013. [Google Scholar] [PubMed] [CrossRef]
7. Peleg Z, Blumwald E. Hormone balance and abiotic stress tolerance in crop plants. Curr Opin Plant Biol. 2011;14(3):290–5. doi:10.1016/j.pbi.2011.02.001. [Google Scholar] [PubMed] [CrossRef]
8. Ali J, Mukarram M, Ojo J, Dawam N, Riyazuddin R, Ghramh HA, et al. Harnessing phytohormones: advancing plant growth and defence strategies for sustainable agriculture. Physiol Plant. 2024;176(3):e14307. doi:10.1111/ppl.14307. [Google Scholar] [PubMed] [CrossRef]
9. Liu C, Yao Z, Jiang B, Yu W, Wang Y, Dong W, et al. Effects of exogenous auxin on mesocotyl elongation of sorghum. Plants. 2023;12(4):944. doi:10.3390/plants12040944. [Google Scholar] [PubMed] [CrossRef]
10. Su J, Cui W, Zhu L, Li B, Ma F, Li M. Response of carbohydrate metabolism-mediated sink strength to auxin in shoot tips of apple plants. J Integr Agric. 2022;21(2):422–33. doi:10.1016/s2095-3119(20)63593-6. [Google Scholar] [CrossRef]
11. Iacona C, Medori G, Thomas B, Roncasaglia R, Dradi G, Radicetti E, et al. Apical dominance and branching in plantlets of colt cherry lines expressing different light and auxin signalling sensitivities. Agronomy. 2023;13(8):13–8. doi:10.3390/agronomy13082018 2018. [Google Scholar] [CrossRef]
12. Zhuang Z, Bian J, Ren Z, Ta W, Peng Y. Plant Aux/IAA gene family: significance in growth, development and stress responses. Agronomy. 2025;15(5):1228. doi:10.3390/agronomy15051228. [Google Scholar] [CrossRef]
13. Chen Y, Yang QF, Sang SH, Wei ZY, Wang P. Rice inositol polyphosphate kinase (OsIPK2) directly interacts with OsIAA11 to regulate lateral root formation. Plant Cell Physiol. 2017;58(11):1891–900. doi:10.1093/pcp/pcx125. [Google Scholar] [PubMed] [CrossRef]
14. Luo J, Zhou JJ, Zhang JZ. Aux/IAA gene family in plants: molecular structure, regulation, and function. Int J Mol Sci. 2018;19(1):259. doi:10.3390/ijms19010259. [Google Scholar] [PubMed] [CrossRef]
15. Jing H, Yang X, Zhang J, Liu X, Zheng H, Dong G, et al. Peptidyl-prolyl isomerization targets rice Aux/IAAs for proteasomal degradation during auxin signalling. Nat Commun. 2015;6(1):7395. doi:10.1038/ncomms8395. [Google Scholar] [PubMed] [CrossRef]
16. Xiao B, Lu H, Li C, Bhanbhro N, Cui X, Yang C. Carbohydrate and plant hormone regulate the alkali stress response of hexaploid wheat (Triticum aestivum L.). Environ Exp Bot. 2020;175:104053. doi:10.1016/j.envexpbot.2020.104053. [Google Scholar] [CrossRef]
17. Huang D, Wang Q, Duan D, Dong Q, Zhao S, Zhang M, et al. Overexpression of MdIAA9 confers high tolerance to osmotic stress in transgenic tobacco. PeerJ. 2019;7(1):7935. doi:10.7717/peerj.7935. [Google Scholar] [PubMed] [CrossRef]
18. Zhang A, Yang X, Lu J, Song F, Sun J, Wang C, et al. OsIAA20, an Aux/IAA protein, mediates abiotic stress tolerance in rice through an ABA pathway. Plant Sci. 2021;308:110903. doi:10.1016/j.plantsci.2021.110903. [Google Scholar] [PubMed] [CrossRef]
19. Wang F, Niu H, Xin D, Long Y, Wang P, Liu Z, et al. OsIAA18, an Aux/IAA transcription factor gene, is involved in salt and drought tolerance in rice. Front Plant Sci. 2021;12:738660. doi:10.3389/fpls.2021.738660. [Google Scholar] [PubMed] [CrossRef]
20. Yang Z, Mu Y, Wang Y, He F, Shi L, Fang Z, et al. Characterization of a novel TtLEA2 gene from Tritipyrum and its transformation in wheat to enhance salt tolerance. Front Plant Sci. 2022;13:830848. doi:10.3389/fpls.2022.830848. [Google Scholar] [PubMed] [CrossRef]
21. Weng H, Pan A, Yang L, Zhang C, Liu Z, Zhang D. Estimating number of transgene copies in transgenic rapeseed by real-time PCR assay with HMG I/Y as an endogenous reference gene. Plant Mol Biol Rep. 2004;22(3):289–300. doi:10.1007/bf02773139. [Google Scholar] [CrossRef]
22. Schmittgen TD, Livak KJ. Analyzing real-time PCR data by the comparative CT method. Nat Protoc. 2008;3(6):1101–8. doi:10.1038/nprot.2008.73. [Google Scholar] [PubMed] [CrossRef]
23. Dudek G, Strzelewicz A, Krasowska M, Rybak A, Turczyn R. A spectrophotometric method for plant pigments determination and herbs classification. Chem Pap. 2014;68(5):579–83. doi:10.2478/s11696-013-0502-x. [Google Scholar] [CrossRef]
24. Liu F, Gao M, Zhang H, Yuan H, Hu B, Zong R, et al. Synergistic impact of various straw-return methods and irrigation regimes on winter wheat physiological growth and yield. Field Crops Res. 2024;316:11. doi:10.1016/j.fcr.2024.109516. [Google Scholar] [CrossRef]
25. He Y, Duan W, Xue B, Cong X, Sun P, Hou X, et al. OsαCA1 affects photosynthesis, yield potential, and water use efficiency in rice. Int J Mol Sci. 2023;24(6):5560. doi:10.3390/ijms24065560. [Google Scholar] [PubMed] [CrossRef]
26. Liu L, Yahaya BS, Li J, Wu F. Enigmatic role of auxin response factors in plant growth and stress tolerance. Front Plant Sci. 2024;15:24. doi:10.3389/fpls.2024.1398818. [Google Scholar] [PubMed] [CrossRef]
27. Aloni R. Overall explanation of auxin mechanisms that control vascular differentiation in leaves and organ development in flowers. Planta. 2025;261(6):140. doi:10.1007/s00425-025-04716-y. [Google Scholar] [PubMed] [CrossRef]
28. Qiu R, Yao P, Yang J, Hou J, Xiao H, Wu Y, et al. OsIAA7 enhances heat stress tolerance by inhibiting the activity of OsARF6 in rice. Int J Biol Macromol. 2024;288(8):138746. doi:10.1016/j.ijbiomac.2024.138746. [Google Scholar] [PubMed] [CrossRef]
29. Jia SS, Ren XY, Tong MN, Jiang SY, Zhang CQ, Liu QQ, et al. OsIAA19, an Aux/IAA family gene, involved in the regulation of seed-specific traits in rice. Plants. 2024;13(24):3538. doi:10.3390/plants13243538. [Google Scholar] [PubMed] [CrossRef]
30. Su P, Sui C, Li J, Wan K, Sun H, Wang S, et al. The Aux/IAA protein TaIAA15-1A confers drought tolerance in Brachypodium by regulating abscisic acid signal pathway. Plant Cell Rep. 2023;42(2):385–94. doi:10.1007/s00299-022-02965-9. [Google Scholar] [PubMed] [CrossRef]
31. Iqbal MZ, Liang Y, Anwar M, Fatima A, Hassan MJ, Ali A, et al. Overexpression of auxin/indole-3-acetic acid gene TrIAA27 enhances biomass, drought, and salt tolerance in Arabidopsis thaliana. Plants. 2024;13(19):2684. doi:10.3390/plants13192684. [Google Scholar] [CrossRef]
32. Kim SH, Bahk S, An J, Hussain S, Nguyen NT, Do HL, et al. A gain-of-function mutant of IAA15 inhibits lateral root development by transcriptional repression of LBD genes in Arabidopsis. Front Plant Sci. 2020;11:1239. doi:10.3389/fpls.2020.01239. [Google Scholar] [PubMed] [CrossRef]
33. Oner F. Effects of nitrogen doses on stomatal characteristics, chlorophyll content, and agronomic traits in wheat (Triticum aestivum L.). PeerJ. 2024;12(9):e18792. doi:10.7717/peerj.18792. [Google Scholar] [PubMed] [CrossRef]
34. Tanaka M, Keira M, Yoon DK, Mae T, Ishida H, Makino A, et al. Photosynthetic enhancement, lifespan extension, and leaf area enlargement in flag leaves increased the yield of transgenic rice plants overproducing rubisco under sufficient N fertilization. Rice. 2022;15(1):10. doi:10.21203/rs.3.rs-1139533/v1. [Google Scholar] [CrossRef]
35. Honda S, Ohkubo S, San NS, Nakkasame A, Tomisawa K, Katsura K, et al. Maintaining higher leaf photosynthesis after heading stage could promote biomass accumulation in rice. Sci Rep. 2021;11(1):7579. doi:10.1038/s41598-021-86983-9. [Google Scholar] [PubMed] [CrossRef]
36. Carmo-Silva E, Andralojc PJ, Scales JC, Driever SM, Mead MA, Lawson T, et al. Phenotyping of field-grown wheat in the UK highlights contribution of light response of photosynthesis and flag leaf longevity to grain yield. J Exp Bot. 2017;68(13):3473–86. doi:10.1093/jxb/erx169. [Google Scholar] [PubMed] [CrossRef]
37. Julius BT, Slewinski TL, Baker RF, Tzin V, Zhou S, Bihmidine S, et al. Maize carbohydrate partitioning defective1 impacts carbohydrate distribution, callose accumulation, and phloem function. J Exp Bot. 2018;69(16):3917–31. doi:10.1093/jxb/ery203. [Google Scholar] [PubMed] [CrossRef]
38. Croce R, Carmo-Silva E, Cho YB, Ermakova M, Harbinson J, Lawson T, et al. Perspectives on improving photosynthesis to increase crop yield. Plant Cell. 2024;36(10):3944–73. doi:10.1093/plcell/koae132. [Google Scholar] [PubMed] [CrossRef]
39. Parry MA, Reynolds M, Salvucci ME, Raines C, Andralojc PJ, Zhu XG, et al. Raising yield potential of wheat. II. Increasing photosynthetic capacity and efficiency. J Exp Bot. 2011;62(2):453–67. doi:10.1093/jxb/erq304. [Google Scholar] [PubMed] [CrossRef]
40. Zhou X, Wang Q, Guo H, Xie Y, Zhao L, Gu J, et al. Identification of Rht1 for plant height reduction in two wheat mutants and the effects on yield components. J Plant Physiol. 2025;305:15442. doi:10.1016/j.jplph.2025.154420. [Google Scholar] [PubMed] [CrossRef]
41. Yan Y, Gong W, Yang W, Wan Y, Chen X, Chen Z, et al. Seed treatment with uniconazole powder improves soybean seedling growth under shading by corn in relay strip intercropping system. Plant Prod Sci. 2010;13(4):367–74. doi:10.1626/pps.13.367. [Google Scholar] [CrossRef]
42. Song Y, You J, Xiong L. Characterization of OsIAA1 gene, a member of rice Aux/IAA family involved in auxin and brassinosteroid hormone responses and plant morphogenesis. Plant Mol Biol. 2009;70(3):297–309. doi:10.1007/s11103-009-9474-1. [Google Scholar] [PubMed] [CrossRef]
43. Wang J, Xue L, Zhang X, Hou Y, Zheng K, Fu D, et al. A new function of MbIAA19 identified to modulate malus plants dwarfing growth. Plants. 2023;12(17):3097. doi:10.3390/plants12173097. [Google Scholar] [PubMed] [CrossRef]
Cite This Article
 Copyright © 2025 The Author(s). Published by Tech Science Press.
This work is licensed under a Creative Commons Attribution 4.0 International License , which permits unrestricted use, distribution, and reproduction in any medium, provided the original work is properly cited.
 Downloads
 Citation Tools