
 Submit a Paper
 Propose a Special lssue
 Open Access
ARTICLE

Survival Status and Trend Prediction of the Endangered Plant Cupressus gigantea Populations in Tibet Plateau
1 Institute for Forest Resources & Environment of Guizhou/Guizhou Key Laboratory of Forest Cultivation in Plateau Mountain/College of Forestry, Guizhou University, Guiyang, 550025, China
2 Institute of Tibet Plateau Ecology, Tibet Agriculture and Animal Husbandry University, Nyingchi, Tibet, 860000, China
* Corresponding Authors: Qiqiang Guo. Email: ; Weilie Zheng. Email:
Phyton-International Journal of Experimental Botany 2025, 94(11), 3633-3652. https://doi.org/10.32604/phyton.2025.072725
Received 02 September 2025; Accepted 31 October 2025; Issue published 01 December 2025
 View Full Text
 Download PDF
Abstract
Cupressus gigantea is an endemic endangered tree species in the Tibet Plateau, and studying the survival status of the different C. gigantea populations and revealing the main environmental factors that affect the population survival are particularly significant for the conservation and sustainable development of endangered species. Based on the 28 sample plots, the Hierarchical Cluster Method was used to classify the C. gigantea populations into four community types. Age structure diagrams were drawn based on the structure of each community, static life tables and survival curves were compiled, and the future development trends of each age group in each population were predicted. Additionally, principal component analysis was used to preliminarily explore the mutual relationship between C. gigantea populations and the environment. The results indicated that C. gigantea is the primary dominant species in the four populations, and their survival curves generally conform to the Deevey-III. This is characterized by high mortality rates among the young and middle-aged individuals, as well as the insufficient replenishment of young individuals, and a severe shortage of elderly individuals. Specifically, generational gaps frequently occur within populations. As time goes on, ageing will become increasingly severe. Furthermore, soil organic matter, thickness, and moisture contents, and altitude significantly influence the growth and expansion of C. gigantea populations. This study suggests that timely replanting and transplanting of young trees should be carried out for Population A, while management and protection of Populations B and C should be strengthened to prevent further decline of middle-aged and older individuals. Appropriate transplantation should be conducted for individuals of Population D growing at extremely high and low altitudes. Additionally, protection of C. gigantea individuals (especially juvenile-stage individuals) and their native habitats should be strengthened. Research on germplasm resources and cultivation management techniques should be intensified to enhance the stress tolerance of C. gigantea, thereby alleviating the generational gap phenomenon across all populations, and to promote population renewal and expansion.Keywords
Population structure not only reflects the distribution and configuration of the number of individuals of different sizes within the species, but also reflects the fitness between the population and the environment, which is an important indicator of the characteristics and survival of the population [1]. Among them, the static life table reflects the configuration of individuals of different ages within the population and the degree of adaptation of the population to the environment. Time series analysis can predict the future development trend of the population, which in turn can provide a basis for conservation strategies [2–4]. Population dynamics responds to the growth, decrease, or stabilization of the population size over time. Therefore, the study of age structure, survival curves, and life tables of plant populations in different habitats can not only reflect the reality of the populations but also show the results of the adaptations of plant populations to the environment. It is of important significance for the conservation and sustainable development of endangered plants [5–9].
Cupressus gigantea, as a Tibetan endemic species, is distributed in the Yarlung Zangbo River basin along the valley areas at an altitude of 3000–3400 m in Nyingchi City, Tibet Autonomous Region of China. It is mainly distributed in Milin County and Lang County [10,11]. It is classified as ‘vulnerable’ in the IUCN Red List [12] and ‘national-level wild plant’ in the Chinese rare species list [13]. Mature individuals of C. gigantea are 30–45 m tall and 3–6 m in diameter, and are usually the main community builders with high ecological, economic, and cultural values. Because of the low fruiting rates, habitat loss, and extensive human activities, such as artificial construction, religious culture [10,14,15], the wild C. gigantea population individuals have shrunk in recent years, resulting in population disproportions and difficulties in renewal and expansion. At present, it has been in an endangered state [16]. Therefore, the endangered C. gigantea has attracted the attention of many scholars, and their studies mainly focused on the extraction of total proteins, whole-genome determination, and comprehensive transcriptome characterization of growth properties [11,13,17,18]. However, the survival dynamics of the C. gigantea population and the causes of its endangerment are still unclear.
In this study, we aimed to elucidate the population dynamics and develop trends of C. gigantea populations in different habitats, as well as to analyze the relationship between C. gigantea populations and environmental factors. Finally, the conservation strategies and restoration advice will be proposed in order to efficiently protect the endangered species.
The study was conducted in the middle and lower reaches of the Yarlung Zangbo River in Nyingchi City (93°4′25.3″~94°23′1.5″E, 20°0′14.1″~39°0′14.6″N), Tibet Autonomous Region, China, from Lang County to Milin County, with an elevation of 2991~3156 m Fig. 1. It has a temperate semi-humid monsoon climate, with abundant sunshine and average annual precipitation of more than 8°C, and the annual rainfall is about 600 mm which are known to contain high populations of C. gigantea. The other sub-counties regularly experience harsh natural habitat, making survival of C. gigantea a challenge. By conducting a belt survey of C. gigantea plant communities along the Yarlung Zangbo River from Lang County to Milin County, a total of 76 species of 36 families and 68 genera of plants were recorded.
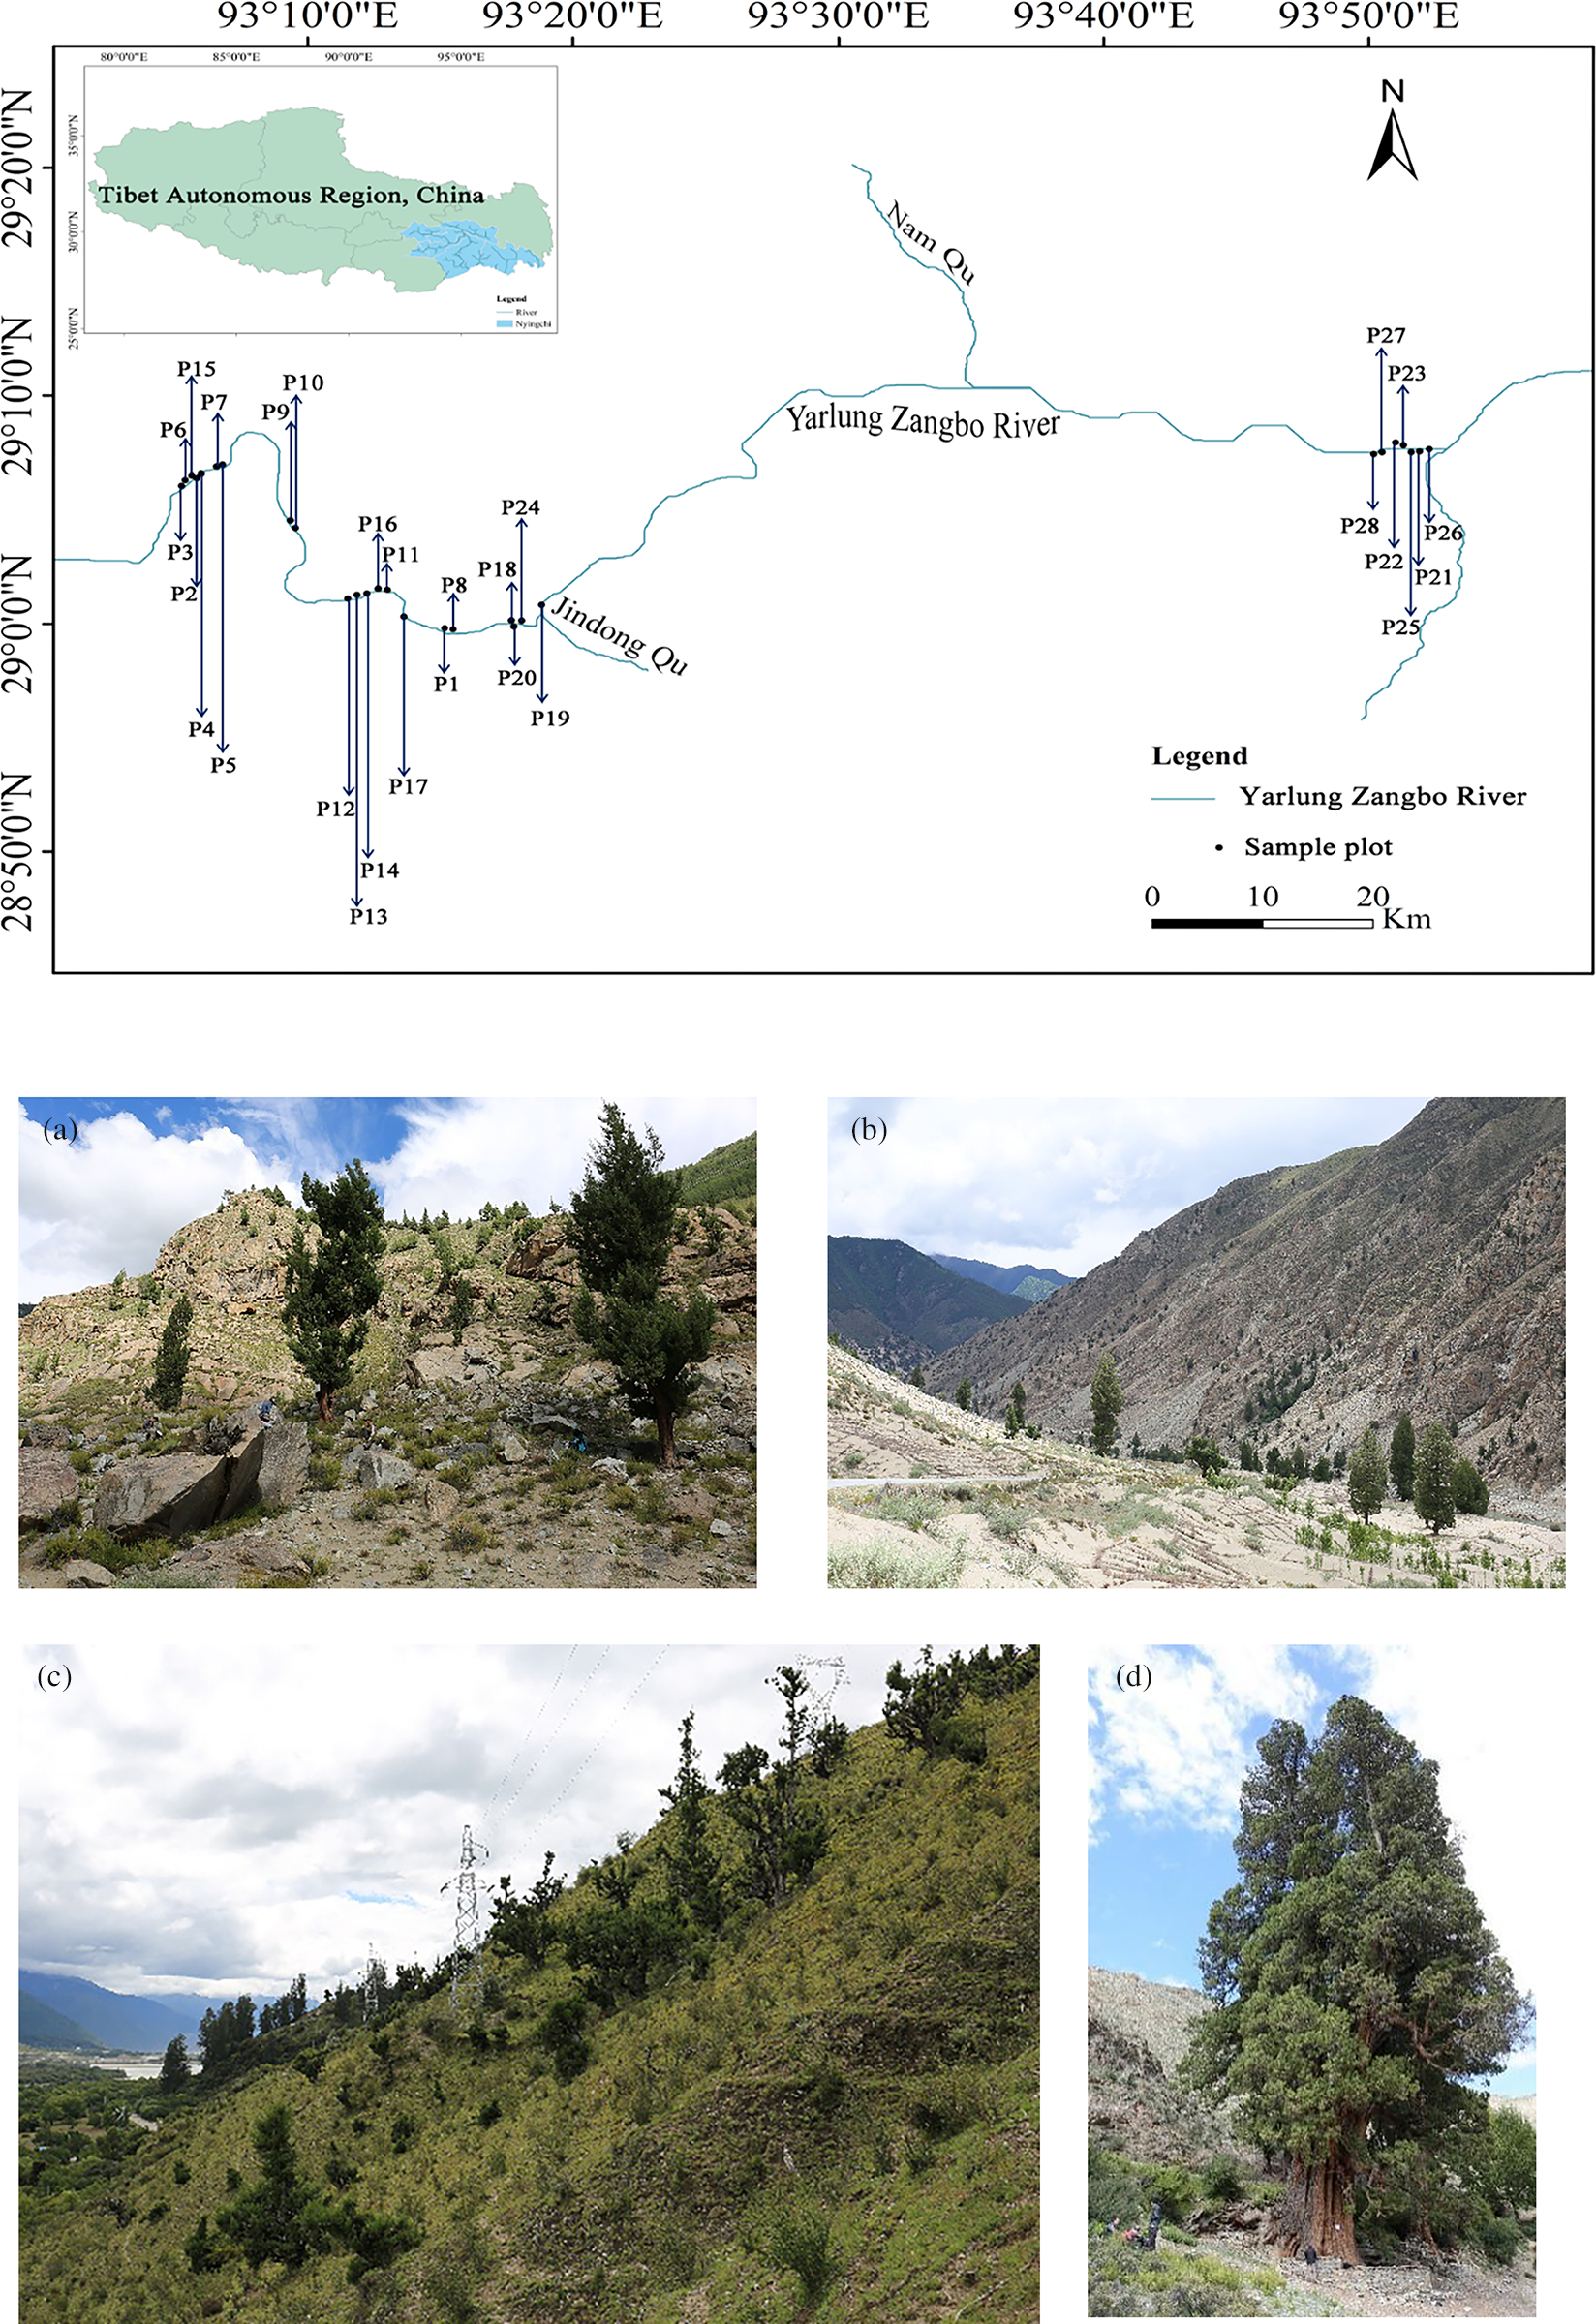
Figure 1: Geographic location of the plots in the study area: (a) Population A, (b) Population B, (c) Population C, (d) Population D
A reconnaissance survey was carried out in September 2015 to identify key areas where C. gigantea grows within the Yarlung Zangbo River area, Tibet Autonomous Region, China, as well as for the natural habitat study. It was found that the C. gigantea grew majorly in the highest densities in the middle and lower reaches of the Yarlung Zangbo River in Nyingchi City, from Lang County to Milin County, which formed the basis for selecting the area for this study. Representative sites of the growth points of each C. gigantea from Lang County to Milin County were selected through a desktop study using Google Maps, which were later verified on the ground to be true.
According to the topography and the survival status of C. gigantea, the overall 28 typical sample plots (20 m × 20 m) were investigated. In each plot, the first corner was established using a Global Positioning System (GPS), and the other three corners were laid using bearings in the four cardinal directions orientation. A total of 28 plots, respectively, three shrub sample plots (5 m × 5 m) and three herb sample plots (1 m × 1 m) were set up along the diagonal of each sample plot.
2.3 Estimation of C. gigantea Population, Size Classes and Distribution
In every plot, measure the base diameter (tree height ≤ 1.5 m) with a vernier caliper or measure the diameter at breast height (DBH) of the stem (tree height > 1.5 m) with a tape measure [19]. Record the number of plants in each plot and their crown diameter measured with a linear tape.
C. gigantea were divided into seedlings (tree height ≤ 1.3 m), juveniles (1.3 m < tree height ≤ 1.5 m), and mature (tree height > 1.5 m) as the survey results. The breast height diameter age (y) of each C. gigantea (tree height > 1.5 m) was calculated using the equation y = 58.143e0.026x [20]. In every plot, C. gigantea trees were classified into the following 10 age classes using the height plus diameter at breast height method. (1) Class Ⅰ is for seedlings, with tree height ≤ 1.3 m, (2) Class II is for juveniles, with 1.3 m < tree height ≤ 1.5 m, (3) For trees with tree height > 1.5 m, 8 age classes were divided into 20 years as one age class. Class III is for the breast diameter ages of 50–70, Class IV is for the breast diameter ages of 70–90, Class V is for the breast diameter ages of 90–110, Class VI is for the breast diameter ages of 110–130, Class VII is for the breast diameter ages of 130–150, Class VIII is for the breast diameter ages of 150–170, Class IX is for the breast diameter ages of 170–190, Class X is for the breast diameter ages of 190–210. For age class distribution graphs, count the number of trees of each age class in each plot separately. Combine the trees of each age class from all plots within the same population to form the basic age structure data for each population. Plot an age structure diagram with age class as the x-axis and trees/hm2 as the y-axis.
Drawing on the method of Guo et al. (2019) [21], the importance values of species in the tree, shrub, and grass layers of the C. gigantea plant community were calculated according to the importance value = (relative multiplicity + relative height + relative cover)/3, respectively. The community species importance value matrix was constructed, and the systematic cluster method (Hierarchical cluster method) was used for the classification of community types. Referencing the method of Wang et al. (2016) [22], the Species with >15% of the species importance value of each layer in the community is the dominant species of the layer for community naming [21].
2.4 Stock Static Life Tables and Survival Curves and Time Series Prediction Model of Population Dynamics
Static life tables and survival curves were developed based on age-structured data for each population [23]. According to the following equations, the future development trend of C. gigantea populations was predicted for the next 20, 40, and 80 years, respectively [24].
2.5 Measurement and Analysis of Environmental Factors
To determine the impact of natural environmental conditions on C. gigantea growth, we conducted separate surveys of the environmental conditions of various populations [25]. Soil sampling and vegetation surveys were conducted simultaneously. During the reconnaissance survey, record the basic information of the sample plots and randomly collect three soil samples from each sample plot at a depth of 0–20 cm to analyse their physical and chemical properties (Fig. 2). At the same time, information on the species composition, height, and cover of shrubs and herbaceous plants in each sample plot was also obtained. To quantify the relative importance of the eight largely independent environmental variables depicted in Fig. 2 for the renewal and expansion of C. gigantea populations, and to visualize their inter-correlations within the study area, principal component analysis (PCA) was performed on the environmental data set using Origin 2024.
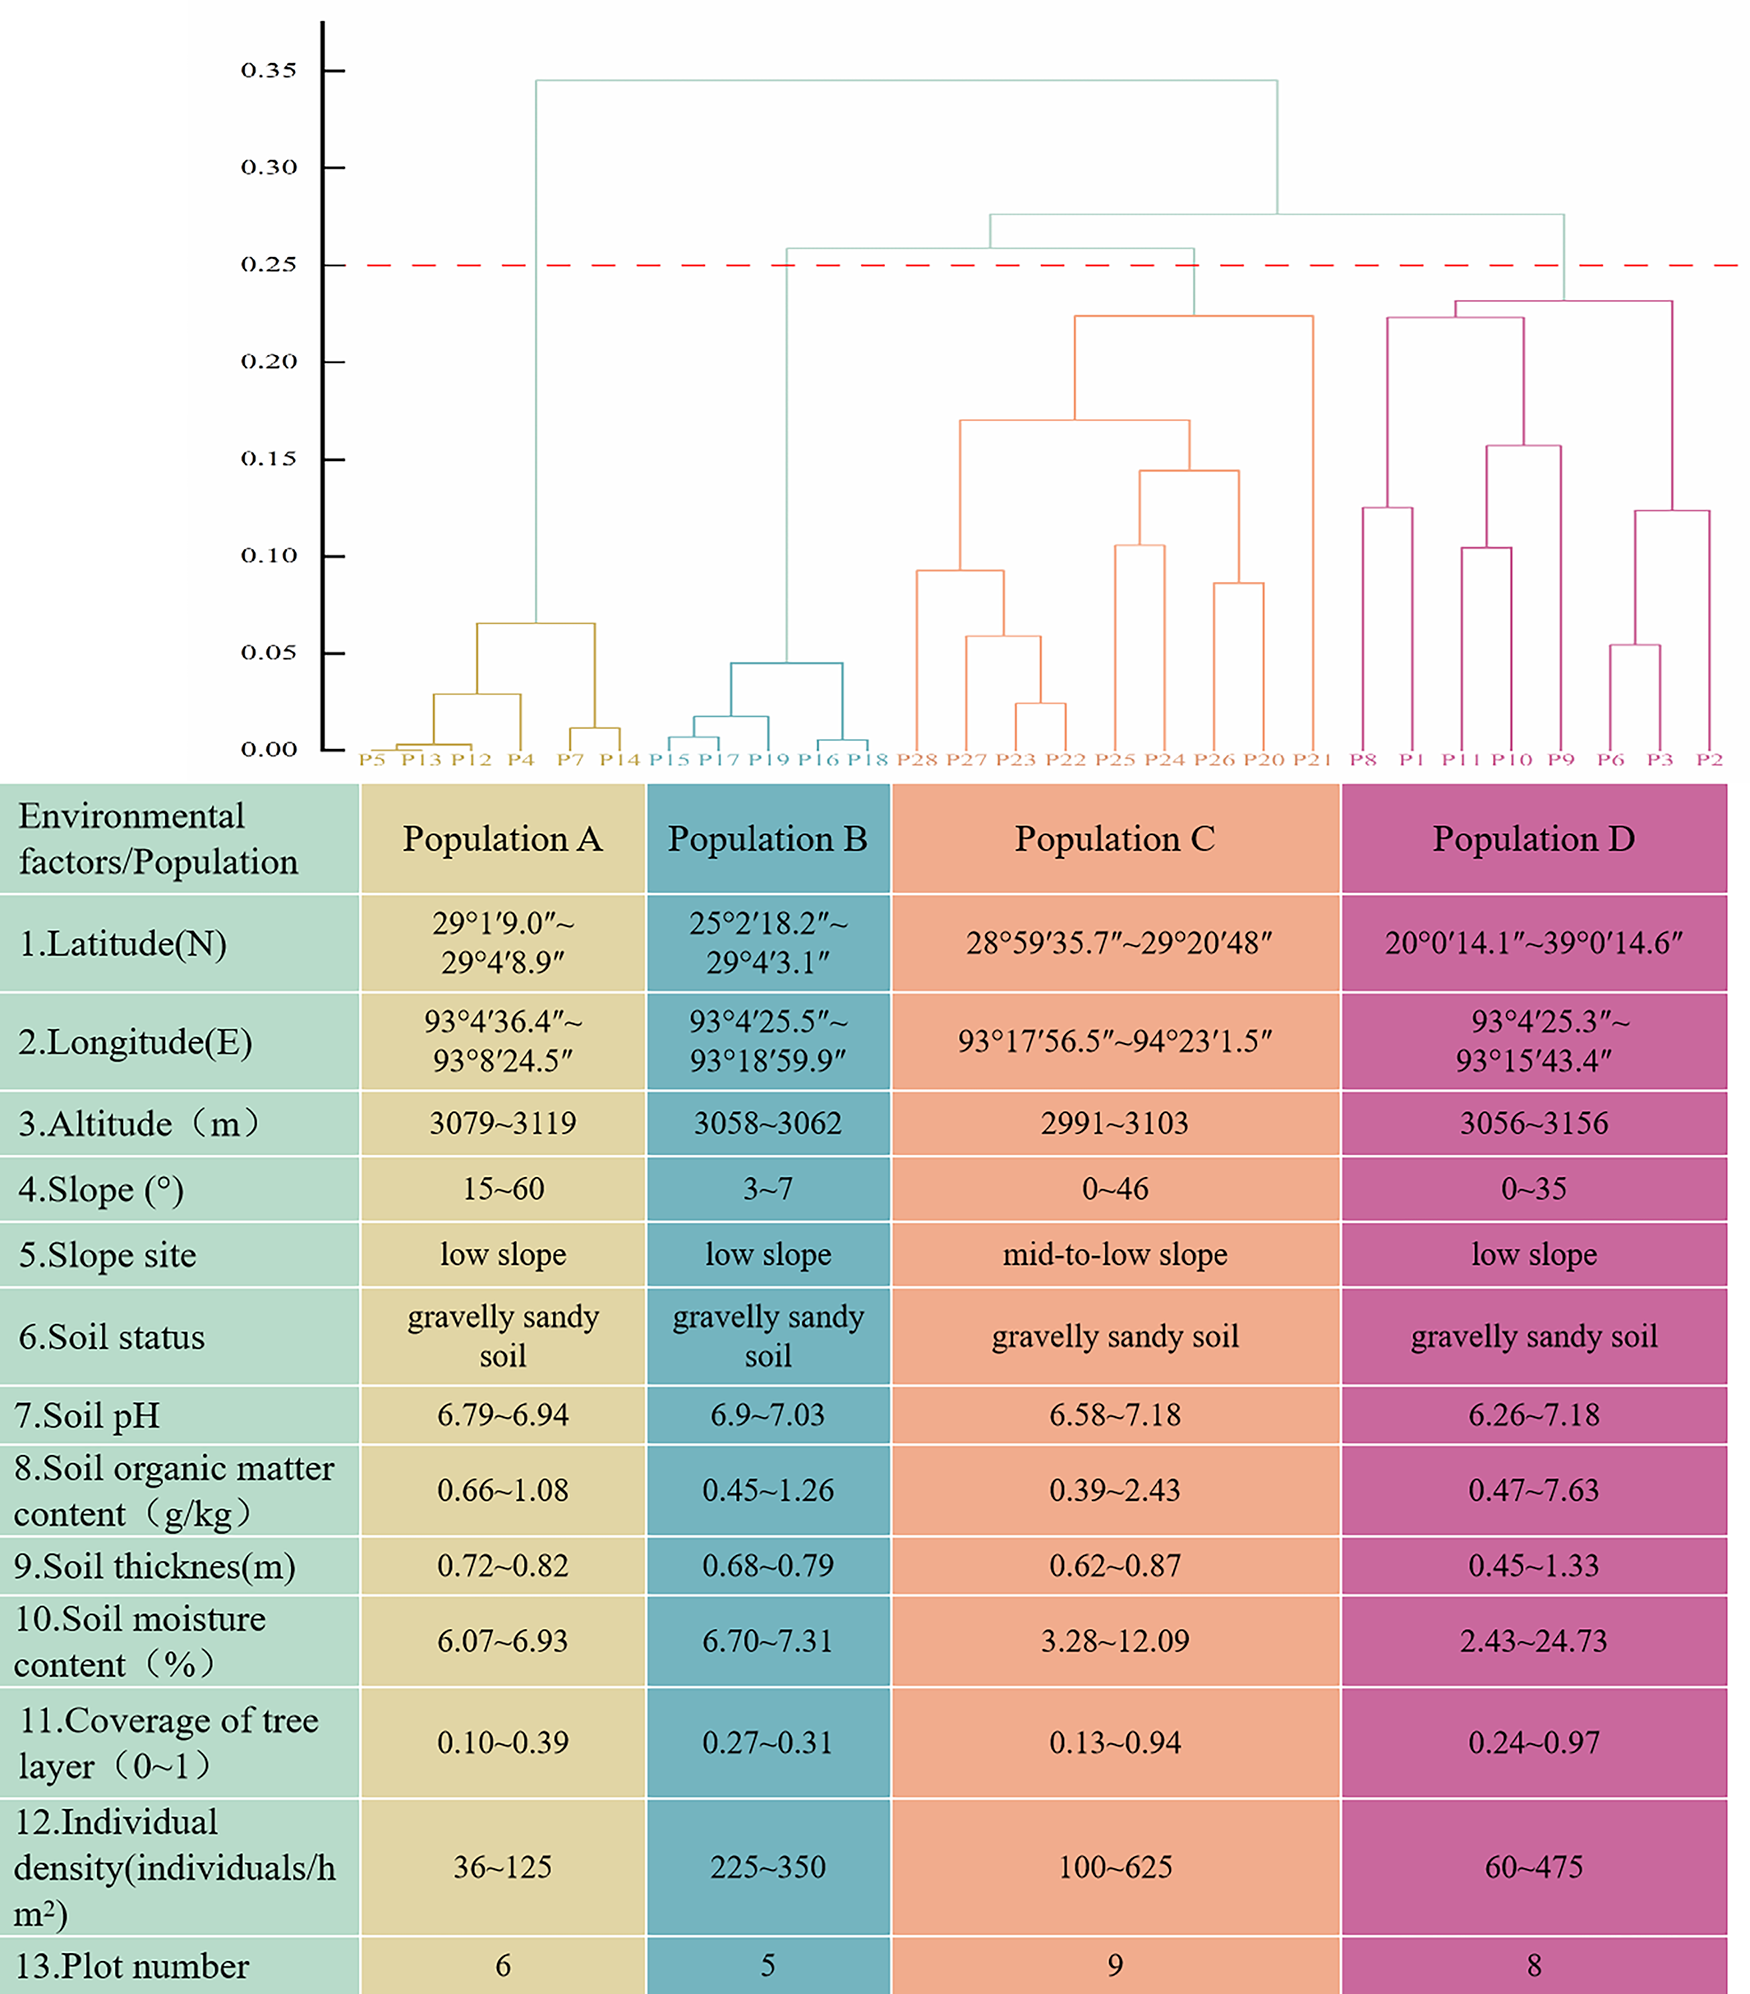
Figure 2: Delineation of C. gigantea community types and their habitat characteristics
Data entry was performed using Microsoft Excel 2019, analyzed using SPSS 27, and plotted using Origin 2024. The hierarchical cluster method was used to classify community types. Principal component analysis (PCA) was used to explore the relationship between natural growth environments and various populations of C. gigantea. Mapping the geographical distribution of C. gigantea using ArcGIS 10.8.
3.1 Community Structure of Different C. gigantea Populations
The species composition is relatively complex, with few tree and shrub species. Among them, C. gigantea is the main species in the tree layer. Through the systematic cluster analysis, integrated C. gigantea habitat conditions, the survey sample site was divided into four populations with C. gigantea as the main species, respectively: Population A (C. gigantea − Ceratostigma minus − Cymbopogon distans + Artemisia wellbyi + Tribulus terrestris), Population B (C. gigantea − Sophora moorcroftiana + Ceratostigma minus − Orinus thoroldii + Artemisia wellbyi), Population C (C. gigantea + Pinus densata − Leptodermis xizangensis + Sophora moorcroftiana − Orinus thoroldii + Artemisia wellbyi), and Population D (C. gigantea − Isodon oresbius + Leptodermis xizangensis + Ceratostigma minus − Artemisia wellbyi) clusters. The importance values for the tree layer, shrub layer, and herb layer are shown in Table 1. The structure of the communities is detailed in Fig. 2.
Population A included six sample plots, with elevations ranging from 3070 to 3181.47 m, C. gigantea plant densities ranging from 36 to 125 individuals/hm2, and C. gigantea seedlings were missing individuals, and there were fewer plant species with lower importance values. Population B had five sample plots, mainly located at an elevation of 3060 m, and 58.3% of plants in the sample plots had importance values lower than 10%. Population C contains 9 sample plots, mainly distributed at the altitude of 2991~3103 m, with rich species composition, among which there are two kinds of trees, C. gigantea and Pinus densata, but the importance value of Pinus densata is only 3.87%, and both of them show that there are more young individuals and fewer middle-aged and old individuals. Population D had 8 sample plots, mainly located at 3056~3156 m above sea level, with C. gigantea plant density of 60~475 individuals/hm2, and a rich species composition of 63 species, including 48 species in the herb layer, but only Artemisia wellbyi had an importance value greater than 15%. The environmental factors of the community are shown in Fig. 2.
3.2 Age Structure of Different C. gigantea Populations
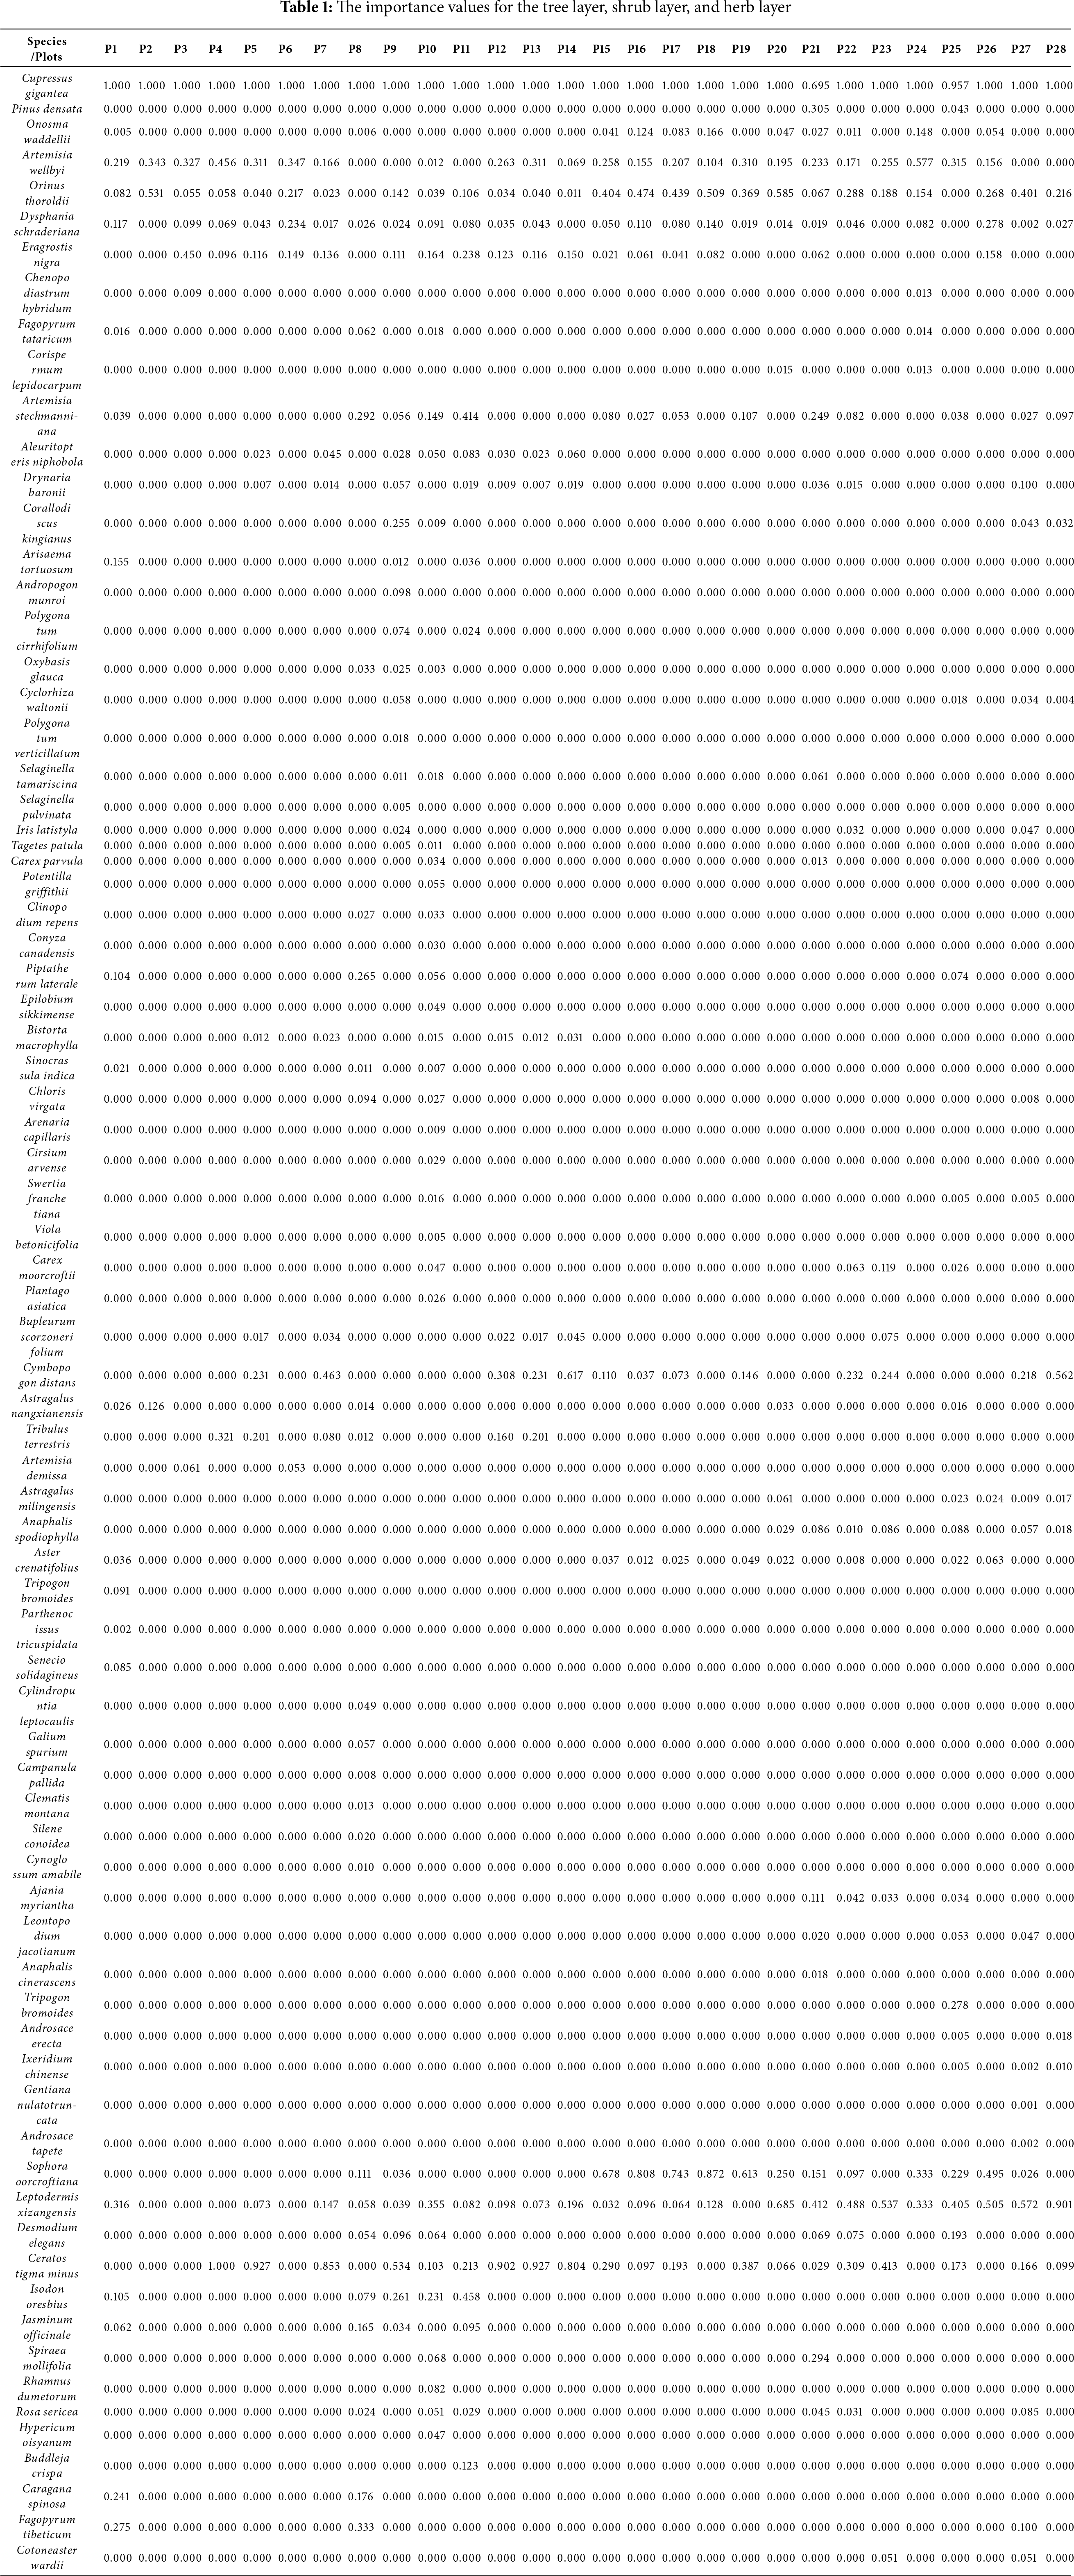
The age structure of populations can objectively reflect the survival status of populations as well as renewal strategies [26]. Fig. 3 shows that the age structures of different C. gigantea populations are basically more young and middle-aged plants and less old-aged plants, with an overall declining trend. Both population A and population B exhibit generational gaps, with a lack of middle-aged and elderly individuals. Population A also exhibits a lack of young individuals. Population C and Population D have C. gigantea individuals of all ages, with more young and middle-aged individuals and fewer old individuals, with Population C having the youngest individuals. It is foreseeable that after 80 years, the current young and middle-aged individuals will enter the middle and old ages, respectively. If there are not enough young individuals to replenish them, the overall stability of the basic populations will be seriously undermined.
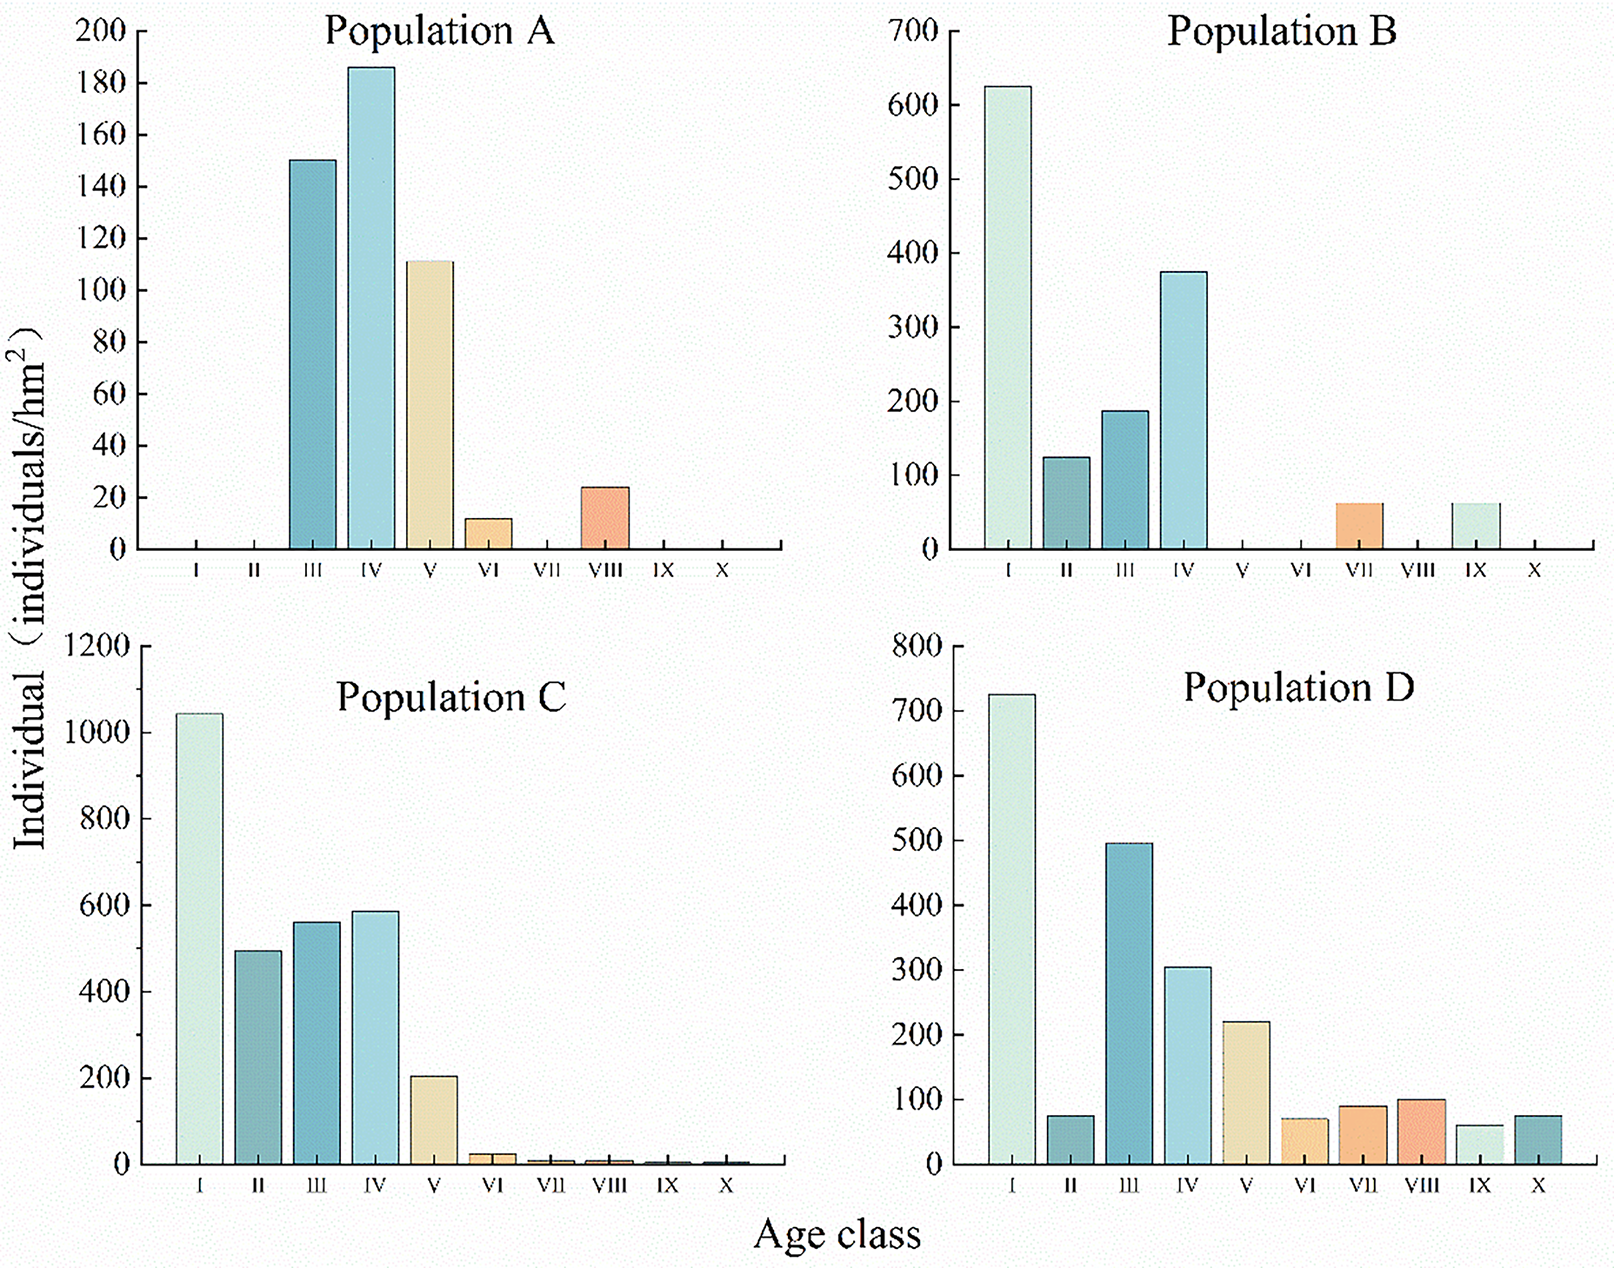
Figure 3: Age structures of different C. gigantea populations. I. Age class I; II. Age class II; III. Age class III; IV. Age class IV; V. Age class V; VI. Age class VI; VII. Age class VII; VIII. Age class VIII; IX. Age class IX; X. Age class X
3.3 Static Life Tables and Survival Curves for C. gigantea Populations
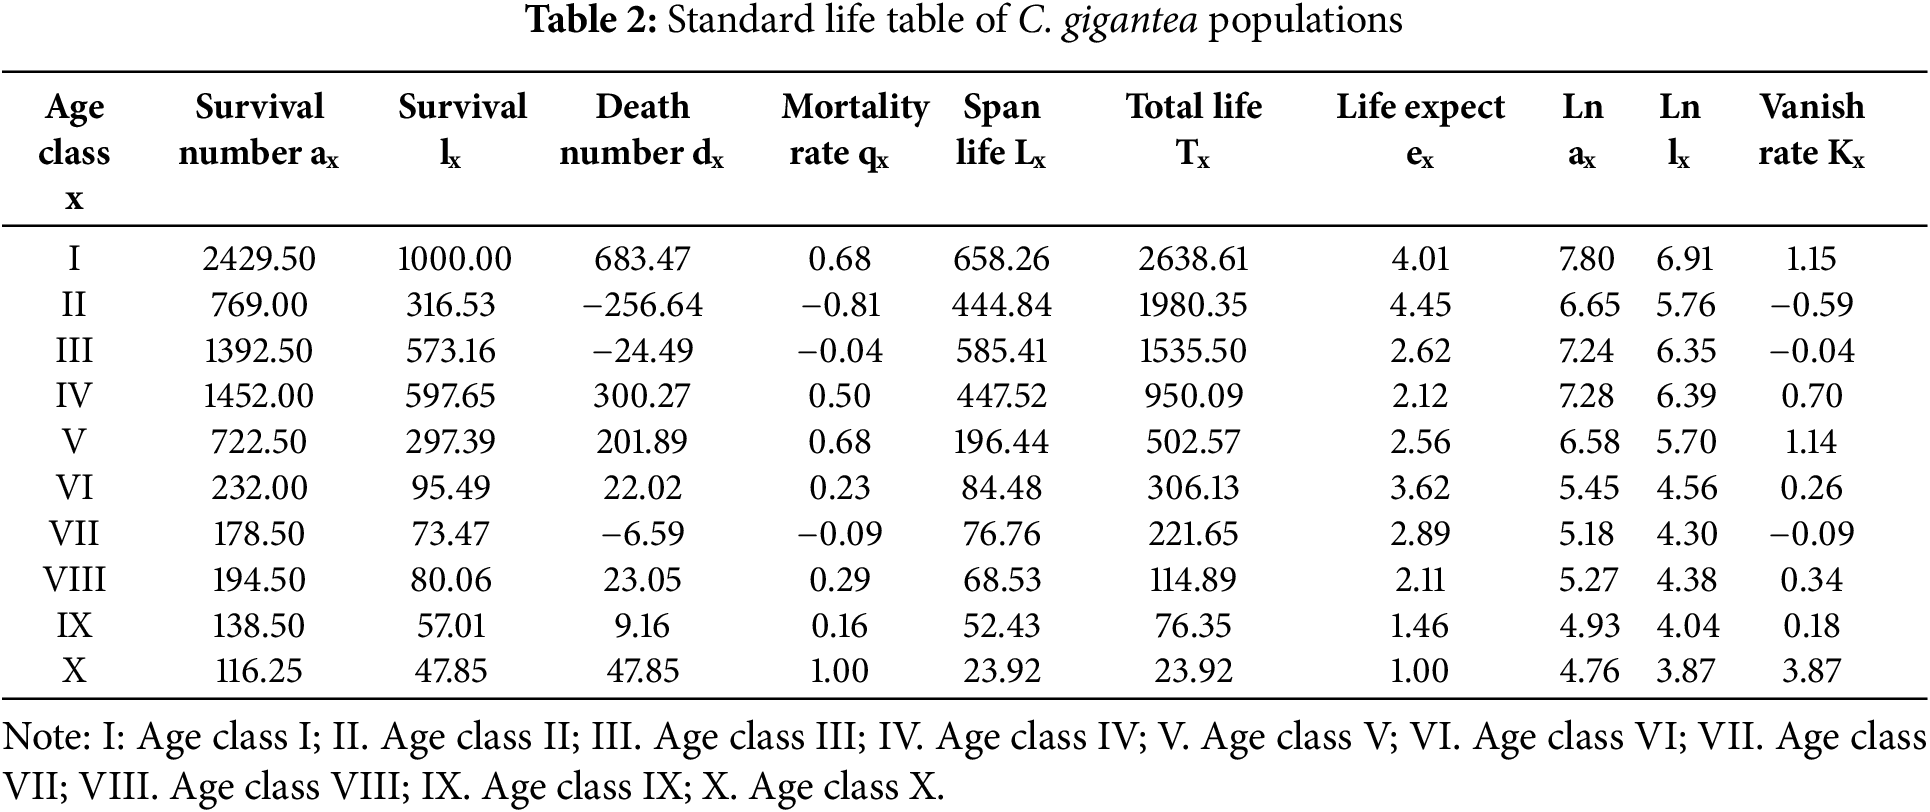
3.3.1 Standard Life Table for the C. gigantea Stock
Table 2 showed that the greatest life expectancy was found in age classes I, II, and VI, indicating that individuals of these age classes were vigorous. The trends in mortality and disappearance rates are basically consistent. The highest mortality rate was in the X age group, with relatively high rates in the I, IV, and V age groups. The disappearance rate was highest among individuals of age class X, followed by those of age classes I and V. At age X, the peak of disappearance and death is reached. The mortality and disappearance rates for age groups II, III, and VII are all negative, which may indicate that the number of plants is insufficient, resulting in a generational gap.
3.3.2 Survival Curves for Various Populations of C. gigantea
Fig. 4 reflects the dynamic characteristics of the C. gigantea population size. In different habitats, the survival curves of populations B, C, and D were close to Deevey-III, and the survival curve of population A was between Deevey-I and Deevey-III [27,28]. The mortality rates for age class I were highest in populations B, C, and D. In age groups IV–VII, the mortality rate in population B is relatively high. In age groups IV–VI, the mortality rate in population C is relatively high. In age groups III–VI, the mortality rate of population D is relatively high. The highest mortality rate in population A was observed in age class V, followed by age class IV. Subsequently, mortality rates across all age groups showed a downward trend and stabilised at relatively stable levels. Although trees of different ages in different C. gigantea populations show certain differences, they generally exhibit a declining trend. At the same time, although individuals aged VI–X are few in number, this also indicates that C. gigantea has a long lifespan.
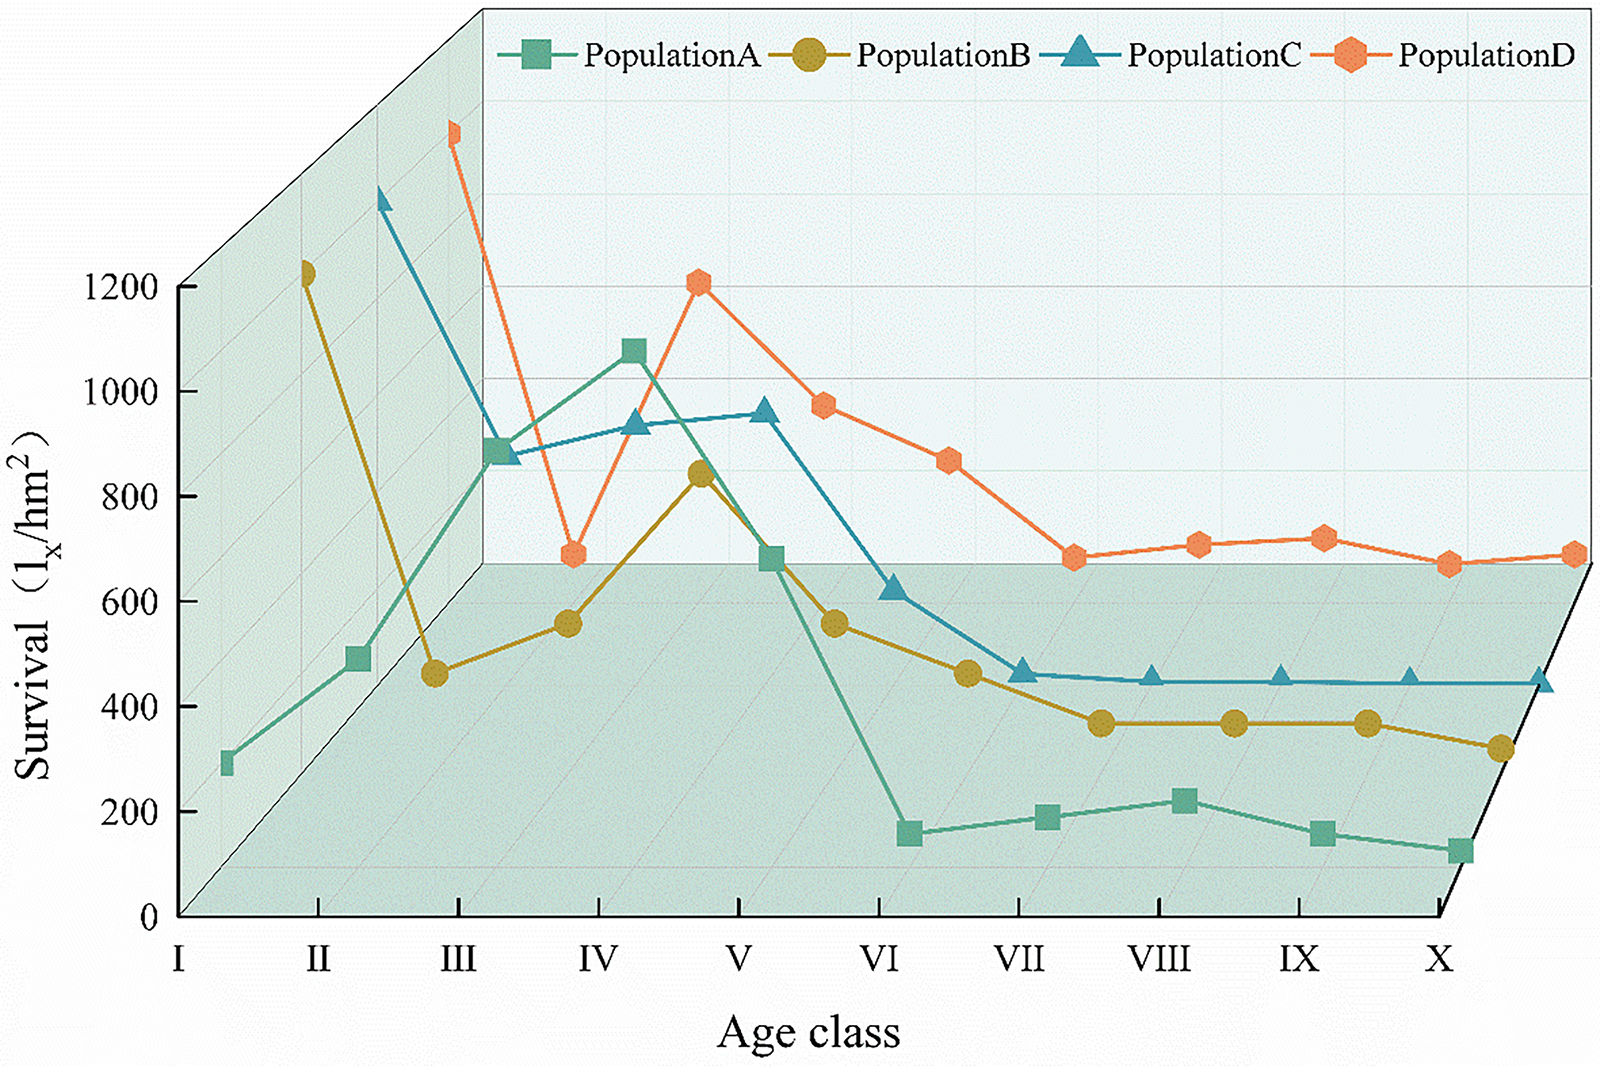
Figure 4: Survival curves of different C. gigantea populations. I. Age class I; II. Age class II; III. Age class III; IV. Age class IV; V. Age class V; VI. Age class VI; VII. Age class VII; VIII. Age class VIII; IX. Age class IX; X. Age class X
3.4 Time-Series Prediction of Population Dynamics in C. gigantea Populations
Fig. 5 shows that the maximum value of strain trees of each age class of various groups of C. gigantea shifted backward sequentially in the predicted sequence, and the older individuals increased in comparison. However, the number of elderly individuals remains relatively small, and the overall trend continues to show a decline [24].
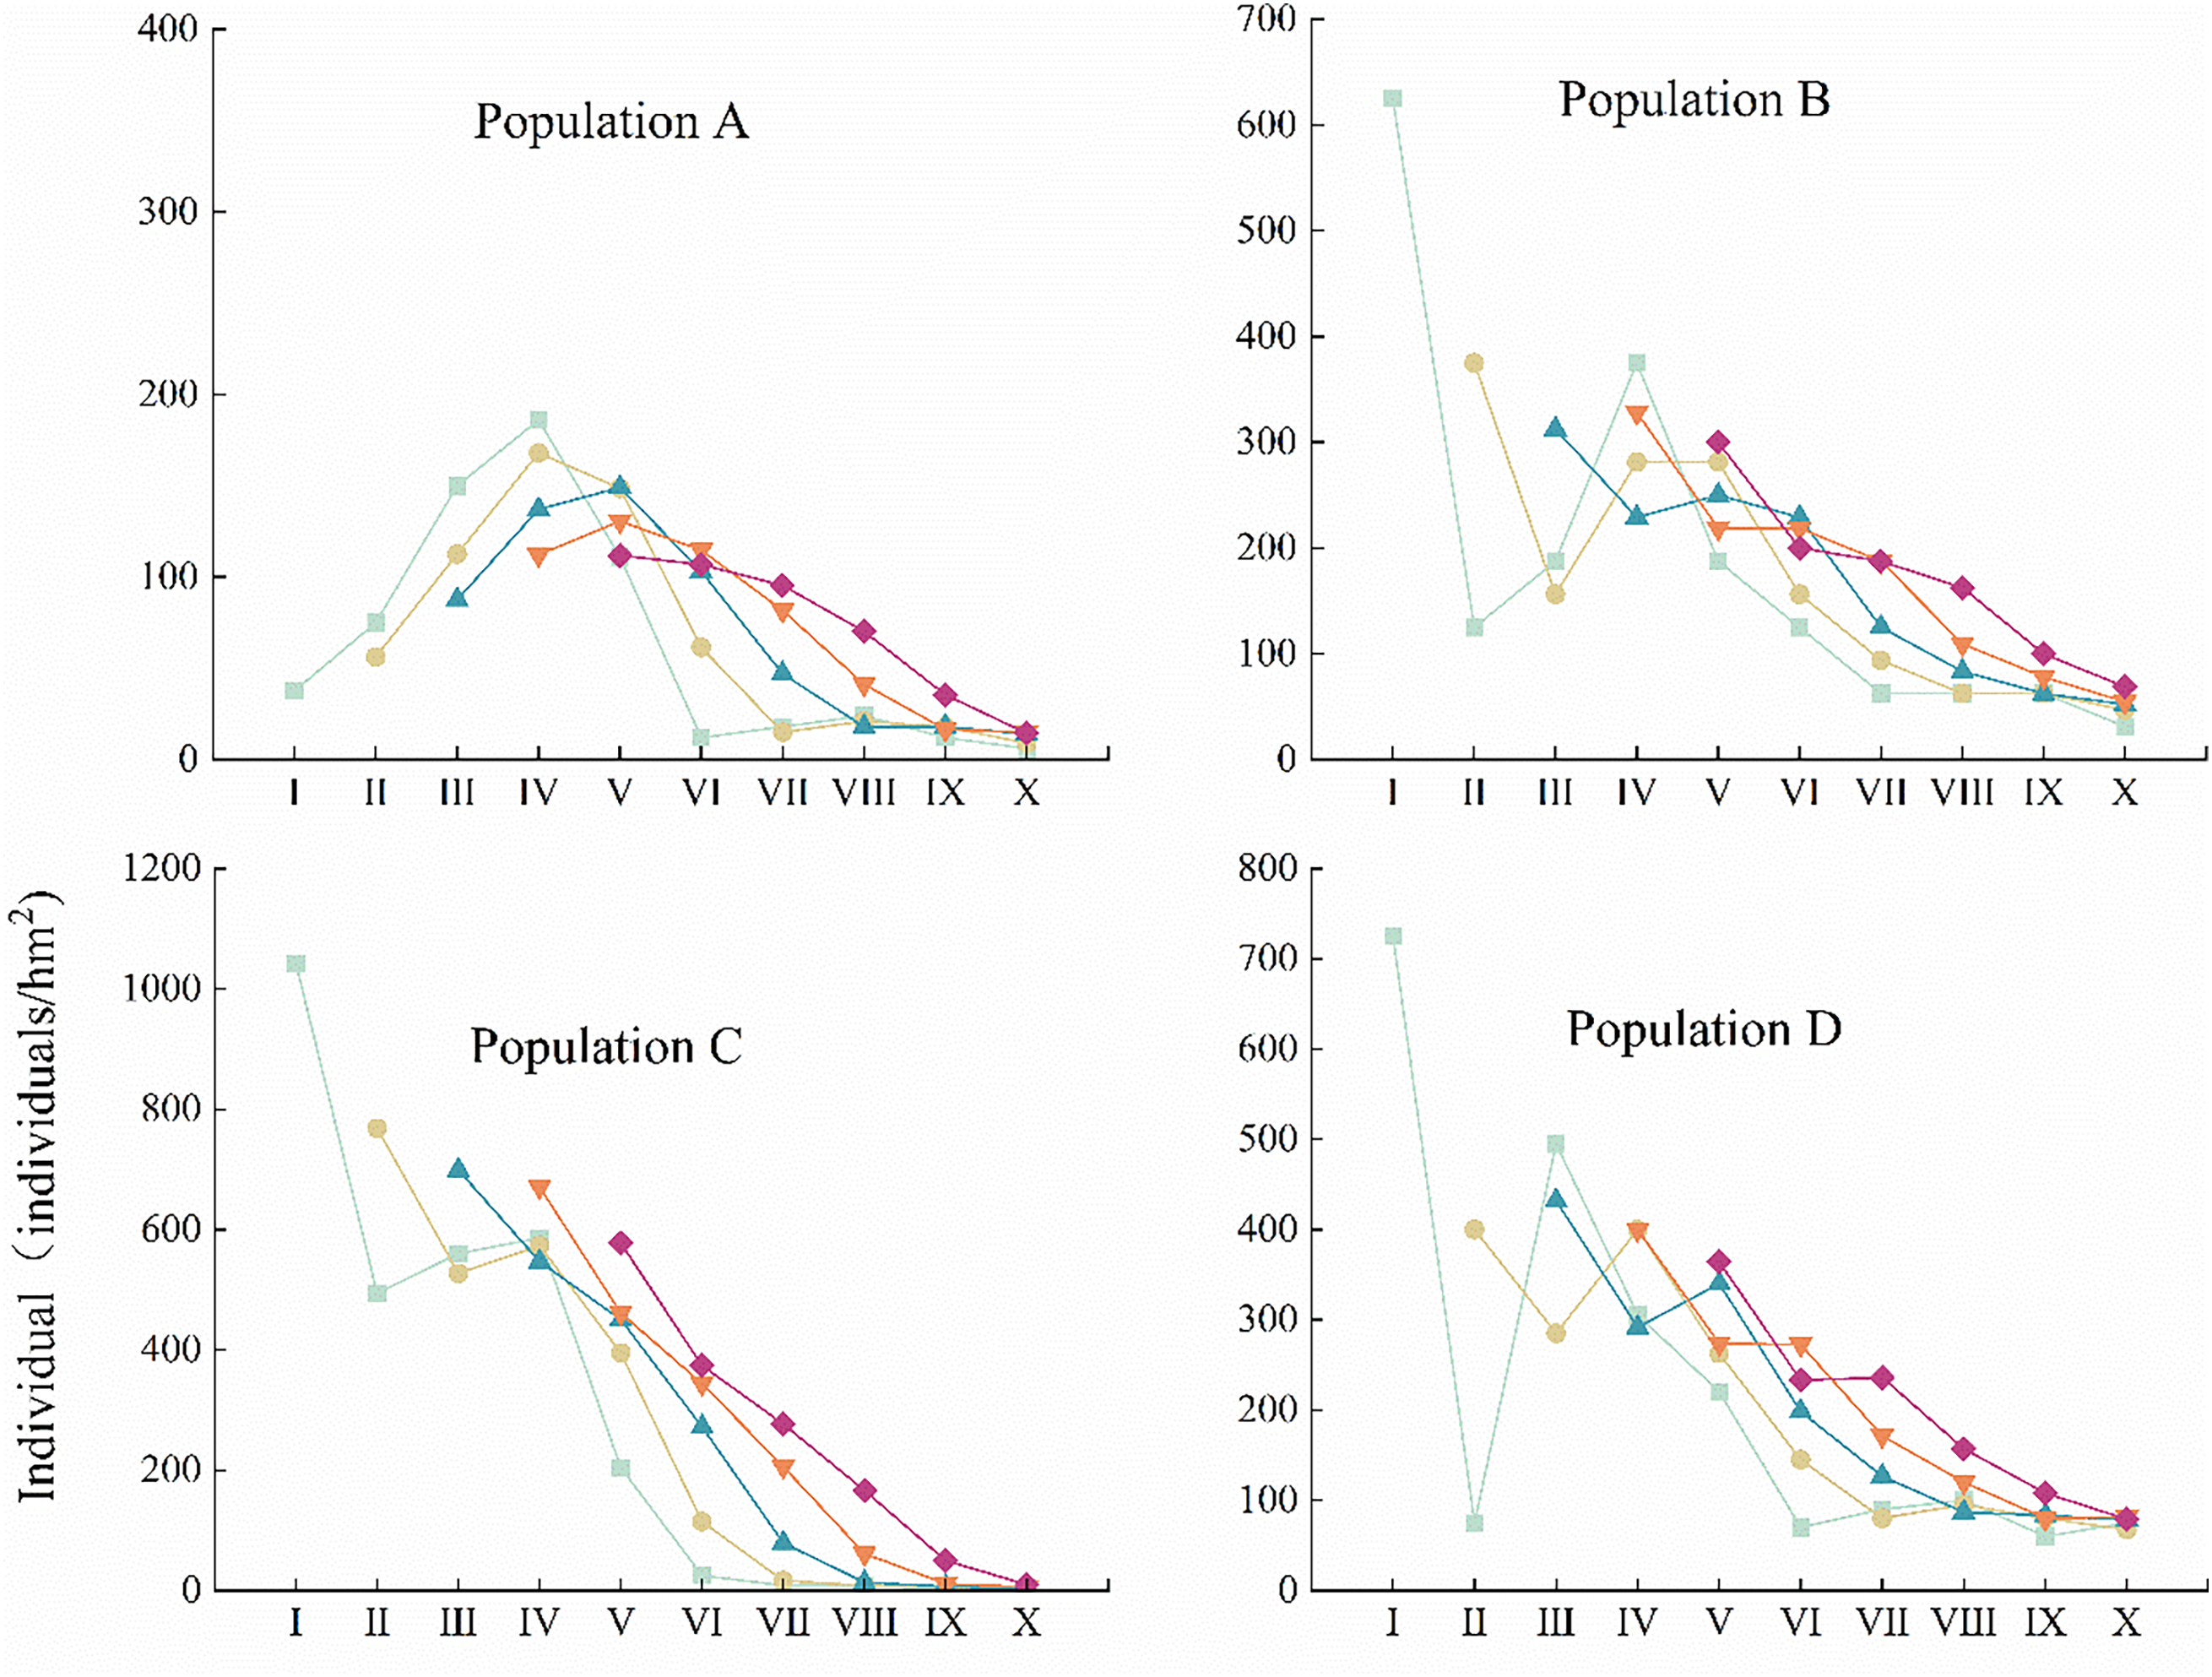
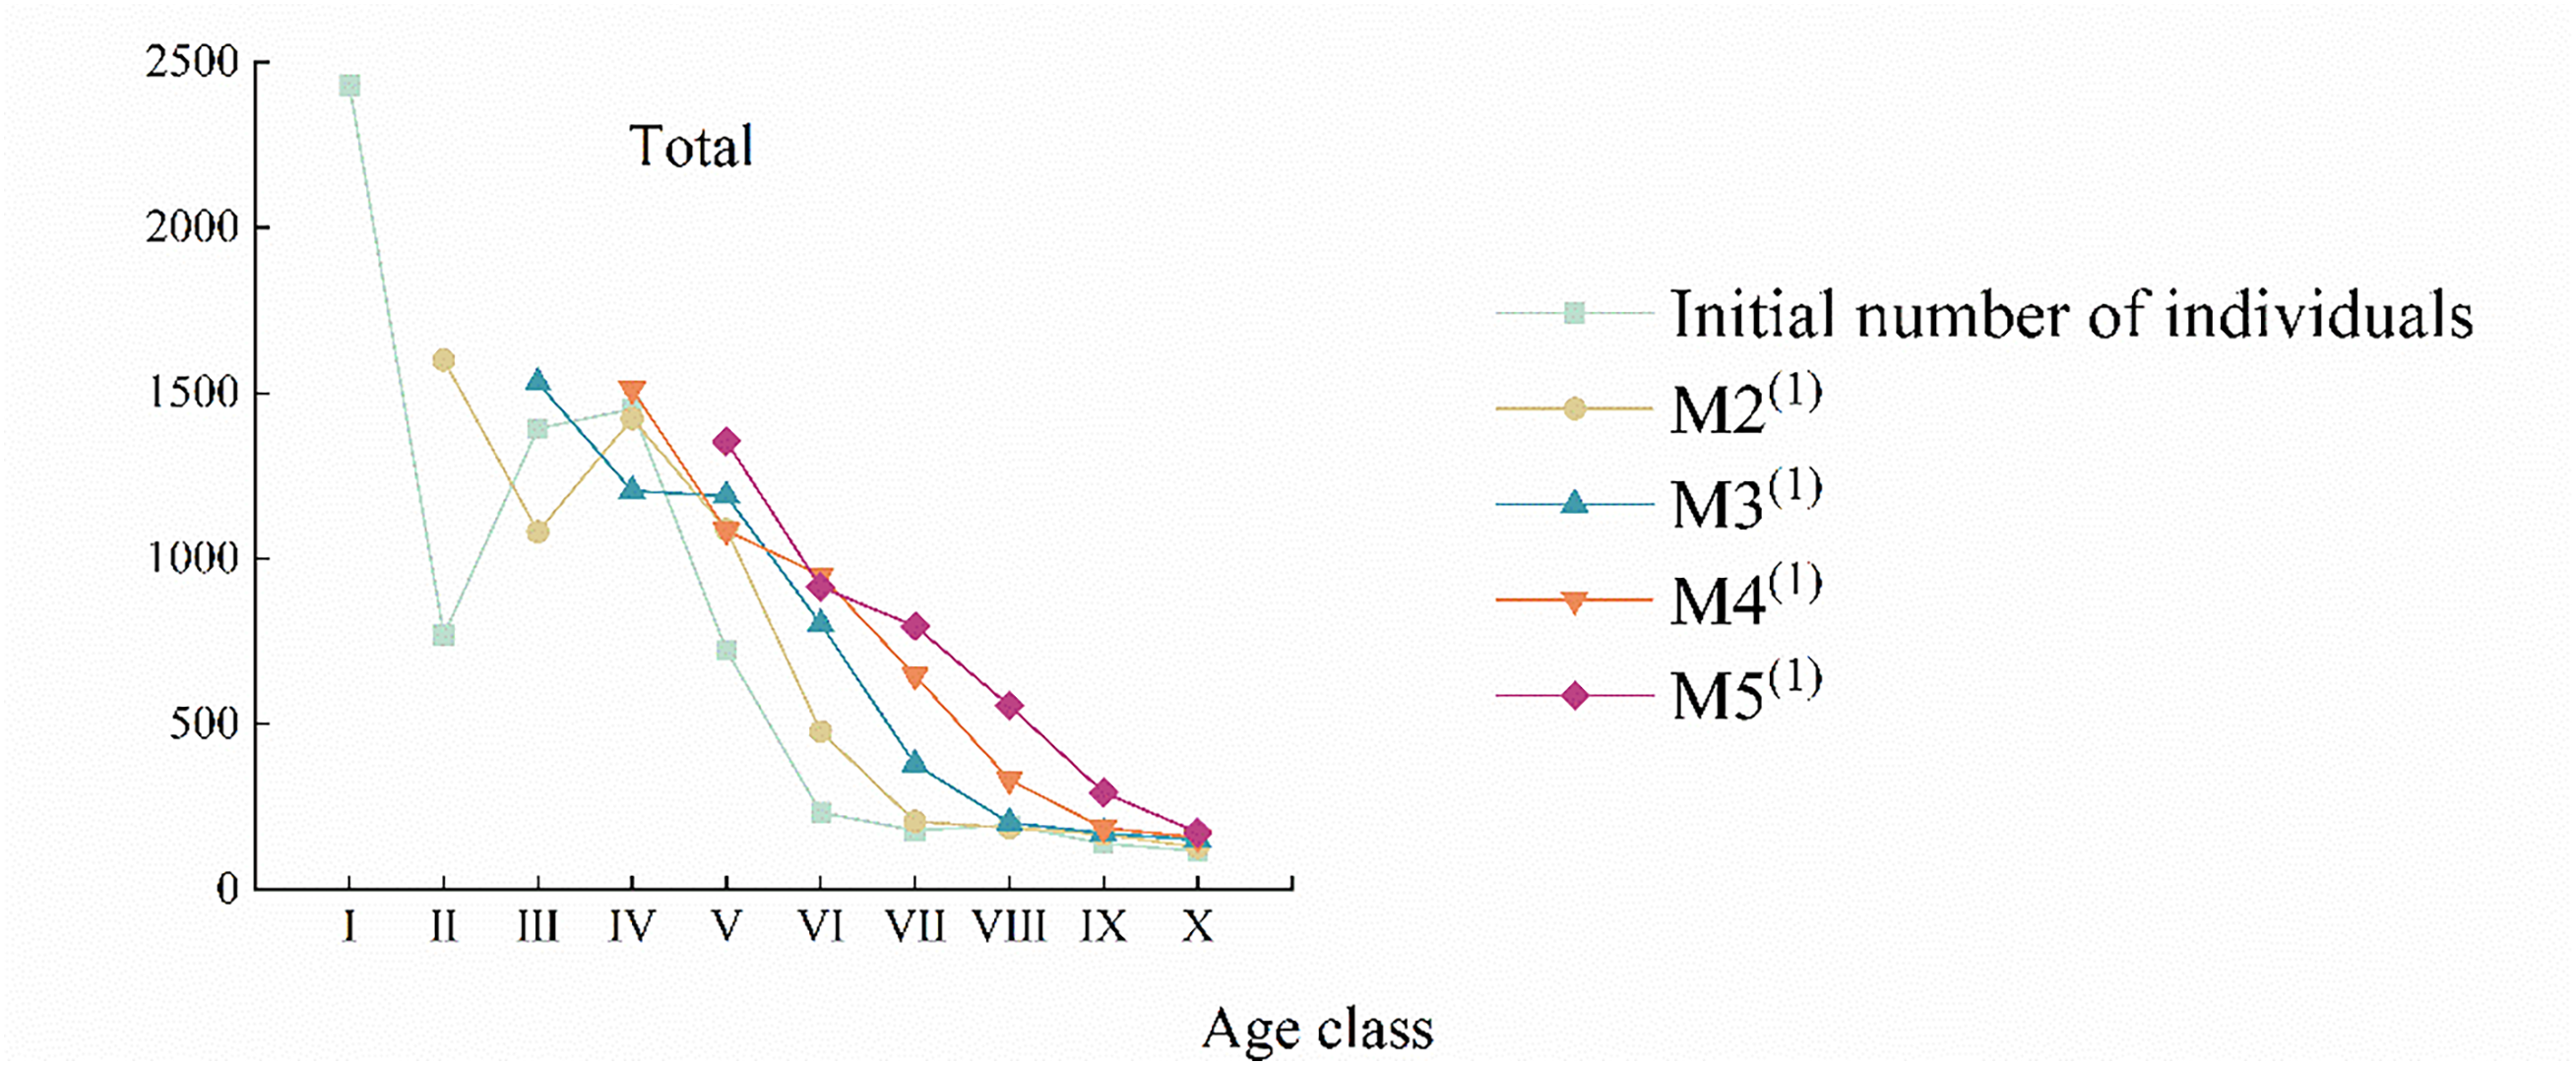
Figure 5: Time sequence prediction of number dynamics of different C. gigantea populations. M2(1). 20 years after; M3(1). 40 years after; M4(1). 60 years after; M5(1). 80 years after. I. Age class I; II. Age class II; III. Age class III; IV. Age class IV; V. Age class V; VI. Age class VI; VII. Age class VII; VIII. Age class VIII; IX. Age class IX; X. Age class X
3.5 Effects of Environmental Factors on Population Growth of C. gigantea
As shown in Table 3, PC1 contributes more to the variance among the two principal components, reaching 24.8%, with the main significantly correlated indicators being soil organic matter content and soil moisture content. PC2 accounts for 22.9% of the variance. Altitude and soil thickness were the main significantly correlated indicators, with factor loadings of 0.870 and 0.619, respectively. Indicating that altitude and soil thickness were also dominant factors affecting the renewal and expansion of the C. gigantea population.
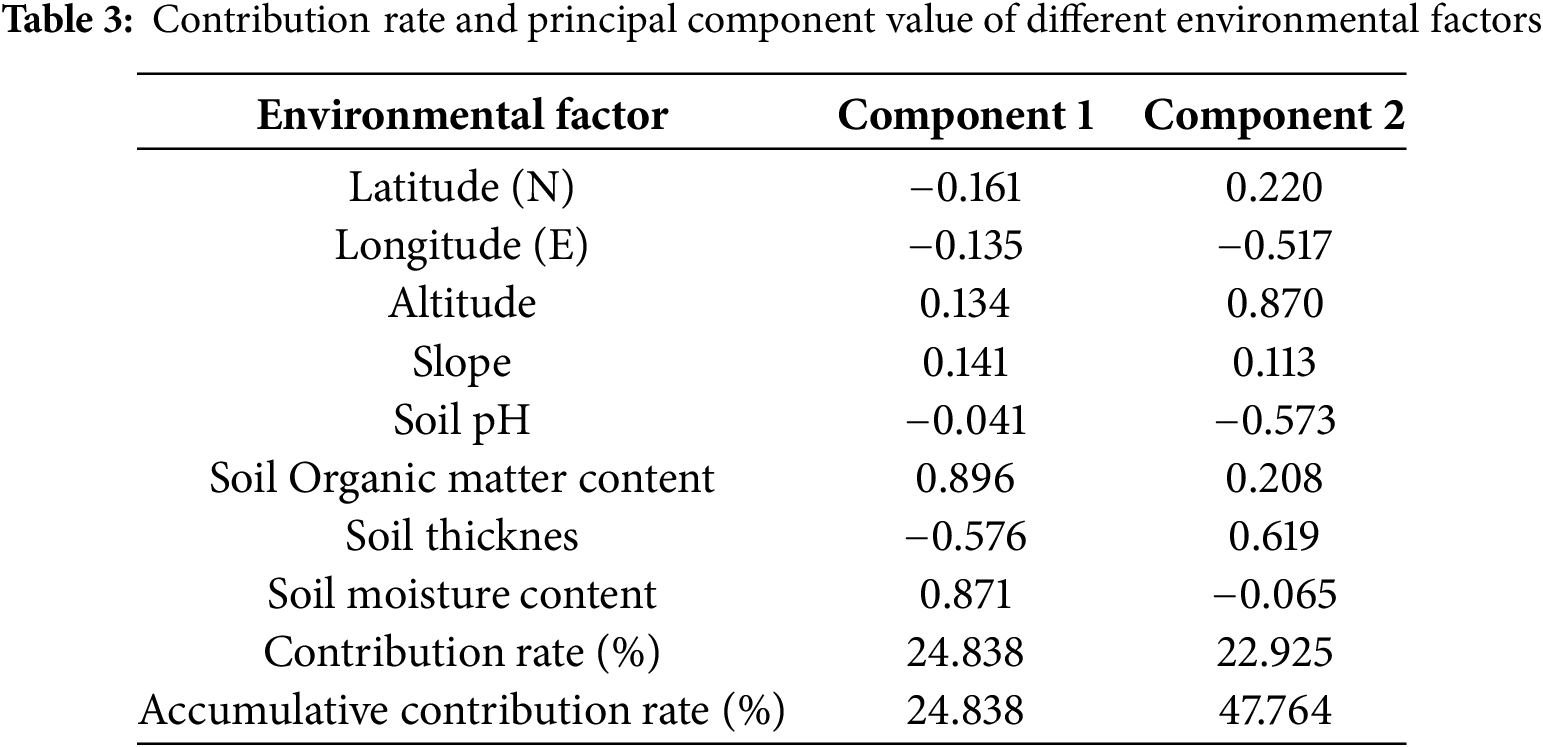
As shown in Fig. 6, the factors with longer indicator arrows include soil organic matter content, soil moisture content, altitude, and soil thickness. Indicating that these four factors have high loadings and significantly contribute to the ranking. In PC1, Soil Organic Matter Content and Soil Moisture Content have the greatest influence on the C. gigantea population in the study area, and the angle between them is small, indicating a strong correlation between the two. In PC2, Altitude and Soil Thickness also have a significant influence on the C. gigantea population.
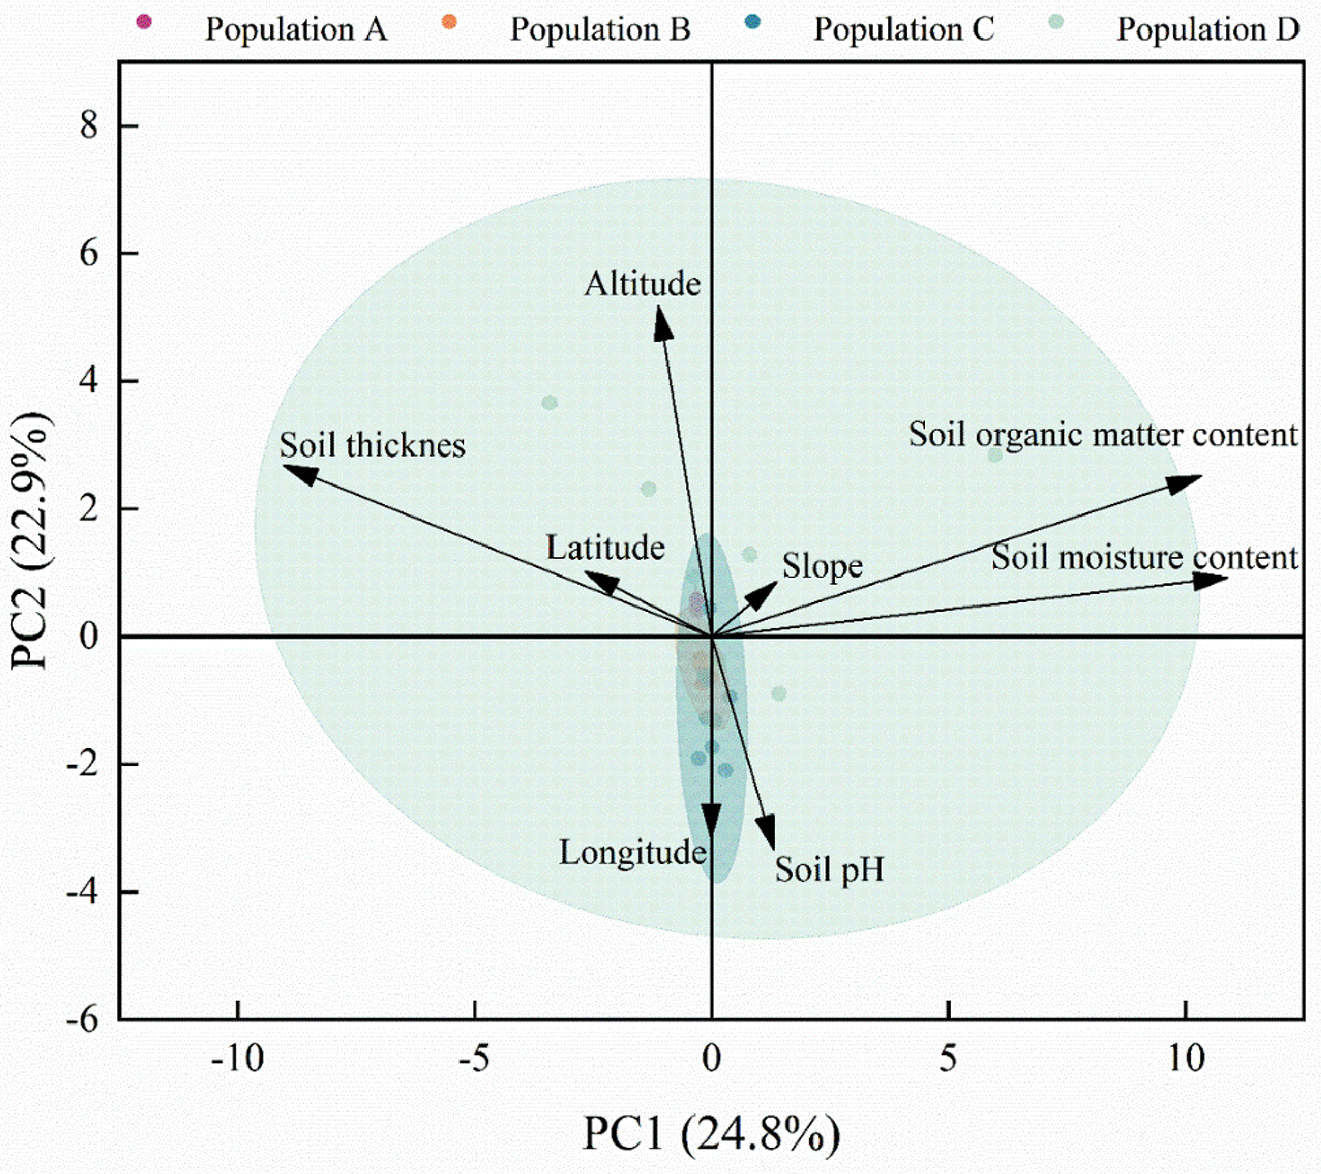
Figure 6: Results of principal component analysis of different environmental factors
4.1 Analyses of Population Dynamics under Endangerment
C. gigantea is widely used in afforestation, medicine, construction, and the production of Tibetan incense for religious and cultural activities [29]. But it is endangered due to geographic isolation, extreme climates, anthropogenic disturbances, and difficulties in natural regeneration [30,31]. C. gigantea seeds lack powerful dispersers. It has a low reproductive rate, with male and female plants flowering at different times, low seed germination rates, and cones that are susceptible to insect damage. At the same time, the rapid climate change induced by human activities warrants close attention as well [32].
Yang et al.’s [33] survey of the Milin County–Lang County section of the Yarlung Zangbo River revealed that the arid-hot valley characteristics result in overall low species diversity throughout this stretch. Microclimate conditions transition from arid-hot to humid-cold with increasing elevation, while soil types gradually shift from sandy to loamy. Among these factors, influenced by altitude, slope aspect, soil moisture content, soil nutrients, and soil density, C. gigantea is predominantly distributed within the 0–200 m elevation range above the river surface, at an altitude of 3000–3400 m [33]. In this paper, we investigated the relationship between the distribution of C. gigantea communities and environmental factors. The results also showed that the environmental factors affecting the process of renewal and expansion of C. gigantea populations mainly include soil organic matter content, soil moisture content, altitude, and soil thickness, etc.
Moreover, for plants, the root system plays a pivotal role in the uptake and transport of soil moisture and mineral nutrients. It influences plant growth by extracting soil moisture, thereby sustaining transpiration and maintaining the plant’s hydration status, which in turn supports growth and physiological responses [34–37]. Simulation studies indicate that surface soil moisture will decrease significantly in certain regions, whilst deep-seated (or even bedrock) moisture levels will show a lesser decline or even a slight increase. This pattern of shallow dryness and deep moisture is driving plants to extend their water-absorption depth to greater depths during drought periods, thereby maintaining transpiration and water balance [38–42]. However, for C. gigantea seedlings, this strategy may prove counterproductive. As key nutrients such as nitrogen and phosphorus are predominantly concentrated in the topsoil layer, their availability is highly dependent on diffusion and mass transport processes driven by soil moisture [43]. Should the upper layers become water-deficient, nutrient migration is impeded, leading to a concurrent decline in mineralisation, litter decomposition, and mycorrhizal activity. Nutrients become “locked” within the parched topsoil, rendering them inaccessible to seedlings with shallow root systems [44–46]. Although deep roots can alleviate water stress, they cannot compensate for the disruption of nutrient supply in the upper layers. Consequently, seedlings face nutrient deficiency even when water remains accessible, thereby inhibiting their early growth and survival. Therefore, the redistribution of soil moisture from shallow aridity to deep hydration may become a critical bottleneck limiting seedling establishment and population renewal by diminishing the availability of nutrients in the topsoil.
At the same time, although certain higher-altitude regions possess suitable soil depth to provide C. gigantea with a stable growing medium, high elevations are susceptible to environmental fluctuations. This results in shallow soil layers with limited water retention capacity, causing fertility to plummet abruptly with shifts in moisture levels. Naturally regenerated C. gigantea seedlings are predominantly concentrated in areas adjacent to rivers. Although low-altitude regions readily accumulate thick soil layers with abundant water retention and high organic matter content, they are frequently subjected to erosion through surface runoff and lateral scouring by river currents. This process carries away C. gigantea seedlings along with surface nutrients, encompassing individuals of all age classes within the species, and has led to frequent generational gaps within the population. Of course, the occurrence of generational gaps within populations of C. gigantea may be attributable to a variety of complex factors, including human and livestock disturbance, natural disasters, and other such circumstances.
Subsequent research may investigate the root systems of C. gigantea across different age classes in relation to the physicochemical properties of soil at various depths. Further studies may also explore the effects of light, temperature, heat, and human and livestock disturbance on the survival and reproduction of C. gigantea populations.
4.2 Protection Measures and Recovery Strategy
Research findings indicate that among the various populations of C. gigantea, the number of extant individuals is greater in the juvenile and subadult age classes, with fewer individuals in the adult and old age classes. Research findings also indicate that populations of C. gigantea possess the capacity to attain considerable longevity. However, frequent generational gaps occur within various C. gigantea populations, accompanied by high mortality rates during the transition from juvenile to middle-aged and elderly stages. Overall, these populations exhibit a severe trend towards ageing and have even reached a critically endangered state. Therefore, given the unique habitat requirements of C. gigantea, it is imperative to implement corresponding conservation measures and restoration strategies. (1) Enclose the natural habitats of all populations of C. gigantea to eliminate threats from humans and livestock, thereby restoring its natural ecosystem. (2) Establish an artificial breeding research base to enhance studies on the resistance of C. gigantea across all age groups, alongside breeding and domestication efforts. (3) Implement appropriate relocation conservation measures to seek environments more suitable for the survival of C. gigantea. (4) Strengthen management and conservation awareness campaigns, and undertake the collection and preservation of germplasm resources. (5) Conduct timely and appropriately scaled replanting in populations lacking seedlings, while strengthening protection for individuals of all age classes within C. gigantea, particularly those of middle to advanced age.
Research indicates that the 28 survey sites of C. gigantea along the Yarlung Zangbo River from Lang County to Milin County can be divided into four communities. Population A and Population B are mainly distributed along the Yarlung Zangbo River. The scarcity of C. gigantea individuals is mainly attributed to river erosion or the washing away of seedlings and saplings by the river. The high-altitude areas of population D have higher soil thickness, but lower soil organic matter content and soil moisture content, while the low-altitude areas have lower soil thickness, and both areas have fewer C. gigantea individuals and lack young individuals. The soil physical and chemical properties in the low-altitude areas of population C are relatively advantageous to survival, but the number of individuals remains low, and there is a severe lack of older individuals, which may be due to human destruction or natural disasters. The survey found that only a small number of Pinus densata seedlings were in population C. In addition, C. gigantea is the main species in each population. The results of the study show that all populations generally exhibit high mortality rates among young individuals, relatively high mortality rates among middle-aged individuals, insufficient replenishment of young individuals, and a severe shortage of elderly individuals. Intra-population age gaps occur frequently, especially in population A, which severely lacks young individuals, and population B, which severely lacks middle-aged and older individuals. Furthermore, as time goes on, ageing will become increasingly severe. We recommend that effective conservation measures for C. gigantea populations be implemented as soon as possible. First, replant and transplant seedlings and juveniles as appropriate in population A. Second, strengthen the management and protection of populations B and C to prevent the further decline of middle-aged and older individuals. Third, appropriately transplant individuals growing at extremely high and extremely low altitudes in population D. At the same time, efforts should be strengthened to protect individuals of C. gigantea, especially juveniles, and to protect their native habitats. Research on germplasm resources and cultivation management techniques should also be intensified to enhance the stress tolerance of C. gigantea and mitigate the generational gap phenomenon across various populations. By combining these measures, we can effectively promote the renewal and expansion of C. gigantea.
Acknowledgement: Not applicable.
Funding Statement: This research was supported by the National Natural Science Foundation of China (32260262) and the Talent Project of Xizang Agricultural and Husbandry University (XZNMXYZFYC–2024–06).
Author Contributions: Manzhu Liao: Data Curation, Formal Analysis, Writing—Original Draft, Writing—Review & Editing. Lan Yang: Investigation. Liehua Tie: Conceptualization, Funding Acquisition, Resources, Supervision. Qiqiang Guo: Conceptualization, Funding Acquisition, Methodology, Investigation, Supervision, Writing—Review & Editing. Weilie Zheng: Data Curation, Investigation. Jiangrong Li: Investigation. Yongxia Li: Data Curation, Investigation. All authors reviewed the results and approved the final version of the manuscript.
Availability of Data and Materials: The data that support the findings of this study are available from the corresponding authors, [Qiqiang Guo, Weilie Zheng], upon reasonable request.
Ethics Approval: Not applicable.
Conflicts of Interest: The authors declare no conflicts of interest to report regarding the present study.
References
1. Mehrhoff LA. The dynamics of declining populations of an endangered orchid, isotoria medeoloides. Ecology. 1989;70(3):783–6. doi:10.2307/1940229. [Google Scholar] [CrossRef]
2. Wang B, Chen T, Xu G, Liu X, Wang W, Wu G, et al. Alpine timberline population dynamics under climate change: a comparison between Qilian juniper and Qinghai spruce tree species in the middle Qilian Mountains of northeast Tibetan Plateau. Boreas. 2016;45(3):411–22. doi:10.1111/bor.12161. [Google Scholar] [CrossRef]
3. Neher DA, Augspurger CK, Wilkinson HT. Influence of age structure of plant populations on damping-off epidemics. Oecologia. 1987;74(3):419–24. doi:10.1007/BF00378939. [Google Scholar] [PubMed] [CrossRef]
4. Miyadokoro T, Nishimura N, Yamamoto S. Population structure and spatial patterns of major trees in a subalpine old-growth coniferous forest, central Japan. For Ecol Manag. 2003;182(1–3):259–72. doi:10.1016/s0378-1127(03)00045-8. [Google Scholar] [CrossRef]
5. Nakashizuka T. Population dynamics of coniferous and broad-leaved trees in a Japanese temperate mixed forest. J Veg Sci. 1991;2(3):413–8. doi:10.2307/3235934. [Google Scholar] [CrossRef]
6. Li W, Zhang GF. Population structure and spatial pattern of the endemic and endangered subtropical tree Parrotia subaequalis (Hamamelidaceae). Flora Morphol Distrib Funct Ecol Plants. 2015;212(Suppl):10–8. doi:10.1016/j.flora.2015.02.002. [Google Scholar] [CrossRef]
7. Farahat EA. Age structure and static life tables of the endangered Juniperus phoenicea L. in North Sinai Mountains, Egypt: implication for conservation. J Mt Sci. 2020;17(9):2170–8. doi:10.1007/s11629-020-6123-2. [Google Scholar] [CrossRef]
8. Zhang J, Hull V, Ouyang Z, He L, Connor T, Yang H, et al. Modeling activity patterns of wildlife using time-series analysis. Ecol Evol. 2017;7(8):2575–84. doi:10.1002/ece3.2873. [Google Scholar] [PubMed] [CrossRef]
9. Li W, Li H, Gan X, Zhang X, Fan Z. Population structure and dynamics of the endangered tree Tetracentron sinense Oliver. Pak J Bot. 2020;52(2):613–9. doi:10.30848/pjb2020-2(4). [Google Scholar] [CrossRef]
10. Fu Y, Li S, Guo Q, Zheng W, Yang R, Li H. Genetic diversity and population structure of two endemic Cupressus (Cupressaceae) species on the Qinghai-Tibetan Plateau. J Genet. 2019;98(1):14. doi:10.1007/s12041-019-1059-4. [Google Scholar] [CrossRef]
11. Zhang H, Wei Y, Yue J, Wang Z, Zou H, Ji X, et al. Prediction of potential suitable areas and priority protection for Cupressus gigantea on the Tibetan Plateau. Plants. 2024;13(6):896. doi:10.3390/plants13060896. [Google Scholar] [PubMed] [CrossRef]
12. Wang Y, Yang Y, Han Z, Li J, Luo J, Yang H, et al. Efficient purging of deleterious mutations contributes to the survival of a rare conifer. Hortic Res. 2024;11(6):uhae108. doi:10.1093/hr/uhae108. [Google Scholar] [PubMed] [CrossRef]
13. Lei P, Liu Z, Li J, Jin G, Xu L, Ji X, et al. Integration of the physiology, transcriptome and proteome reveals the molecular mechanism of drought tolerance in Cupressus gigantea. Forests. 2022;13(3):401. doi:10.3390/f13030401. [Google Scholar] [CrossRef]
14. Miehe G, Miehe S, Schlütz F, Kaiser K, Duo L. Palaeoecological and experimental evidence of former forests and woodlands in the treeless desert pastures of Southern Tibet (Lhasa, A.R. Xizang, China). Palaeogeogr Palaeoclimatol Palaeoecol. 2006;242(1–2):54–67. doi:10.1016/j.palaeo.2006.05.010. [Google Scholar] [CrossRef]
15. Ling Z, Yang X, Wang Y, Wang Y, Jin J, Zhang D, et al. OSL chronology of the Liena archeological site in the Yarlung Tsangpo valley throws new light on human occupation of the Tibetan Plateau. Holocene. 2020;30(7):1043–52. doi:10.1177/0959683620908643. [Google Scholar] [CrossRef]
16. Ji X, Jiang Y, Li J, Lei P, Meng F. Genetic diversity assessment of Cupressus gigantea W. C. Cheng & L. K. Fu using inter-simple sequence repeat technique. Agronomy. 2024;14(5):970. doi:10.3390/agronomy14050970. [Google Scholar] [CrossRef]
17. Liu CS, Li T, Zhang RW, Wang C, Qu XL, Luo DQ. Growth characteristics and biomass model of Cupressus gigantea sapling. Trees. 2024;38(1):27–35. doi:10.1007/s00468-023-02461-x. [Google Scholar] [CrossRef]
18. Li H, Guo Q, Zheng W. The complete chloroplast genome of Cupressus gigantea, an endemic conifer species to Qinghai-Tibetan Plateau. Mitochondrial DNA A DNA Mapp Seq Anal. 2016;27(5):3743–4. doi:10.3109/19401736.2015.1079885. [Google Scholar] [PubMed] [CrossRef]
19. Williams VL, Witkowski ETF, Balkwill K. Relationship between bark thickness and diameter at breast height for six tree species used medicinally in South Africa. S Afr N J Bot. 2007;73(3):449–65. doi:10.1016/j.sajb.2007.04.001. [Google Scholar] [CrossRef]
20. Li ZH, Yang XL, Yang WJ, Liu F. Relationship between diameter at breast height (d1.3 < 1 m) and age of Cupressus gigantea. J Plateau Agric. 2023;7(3):273–7. (In Chinese). [Google Scholar]
21. Guo QQ, Chi X, Wang SL, Ren YH, Zheng WL. Types and species diversity of Cupressus communities in Southeast Tibet, China. J Appli Ecol. 2019;30(3):735–42. (In Chinese). doi:10.13287/j.1001-9332.201903.002. [Google Scholar] [PubMed] [CrossRef]
22. Wang X, Tie J, Li YF, Liu ZY. Interspecific association of dominant species in Taxus chinensis var. mairei community of Lingchuan in Shanxi. Chin J Ecol. 2016;35(10):2575–82. (In Chinese). [Google Scholar]
23. Yuan GY, Guo QQ, Xie N, Zhang YQ, Luo SQ, Gui Q, et al. Population dynamics and protection strategies of Litsea coreana Levl. var. sinensis with Guizhou Province in China as an example. J Mt Sci. 2023;20(4):1090–101. doi:10.1007/s11629-022-7429-z. [Google Scholar] [CrossRef]
24. Crawley MJ. The population dynamics of plants. Phil Trans R Soc Lond B. 1990;330(1257):125–40. doi:10.1098/rstb.1990.0187. [Google Scholar] [CrossRef]
25. Xie L, Peng P, Wang H, Chen S. Environmental drivers and spatial prediction of the critically endangered species Thuja sutchuenensis in Sichuan-Chongqing, China. Phyton-Int J Exp Bot. 2022;91(9):2069–86. doi:10.32604/phyton.2022.018807. [Google Scholar] [CrossRef]
26. Menges ES. Population viability analyses in plants: challenges and opportunities. Trends Ecol Evol. 2000;15(2):51–6. doi:10.1016/s0169-5347(99)01763-2. [Google Scholar] [PubMed] [CrossRef]
27. Fuchs MA, Krannitz PG, Harestad AS. Factors affecting emergence and first-year survival of seedlings of Garry oaks (Quercus garryana) in British Columbia, Canada. For Ecol Manag. 2000;137(1–3):209–19. doi:10.1016/s0378-1127(99)00329-1. [Google Scholar] [CrossRef]
28. Xie Y, Li J, Zhao L, Liu W, Gong Q, Deng M, et al. Naturalization of an alien ancient fruit tree at a fine scale: community structure and population dynamics of Cydonia oblonga in China. Ecol Evol. 2023;13(1):e9703. doi:10.1002/ece3.9703. [Google Scholar] [PubMed] [CrossRef]
29. Malizia RA, Cardell DA, Molli JS, González S, Guerra PE, Grau RJ. Volatile constituents of leaf oils from the Cupressacea family: part I. Cupressus macrocarpa Hartw., C. arizonica Greene and C. torulosa Don species growing in Argentina. J Essent Oil Res. 2000;12:59–63. doi:10.1080/10412905.2000.9712042. [Google Scholar] [CrossRef]
30. Hao B, Wang L, Mu L, Yao L, Zhang R, Tang M, et al. A study of conservation genetics in Cupressus chengiana, an endangered endemic of China, using ISSR markers. Biochem Genet. 2006;44(1–2):31–45. doi:10.1007/s10528-006-9011-8. [Google Scholar] [PubMed] [CrossRef]
31. Xue T, Gadagkar SR, Albright TP, Yang X, Li J, Xia C, et al. Prioritizing conservation of biodiversity in an alpine region: distribution pattern and conservation status of seed plants in the Qinghai-Tibetan Plateau. Glob Ecol Conserv. 2021;32:e01885. doi:10.1016/j.gecco.2021.e01885. [Google Scholar] [CrossRef]
32. Thomas CD, Cameron A, Green RE, Bakkenes M, Beaumont LJ, Collingham YC, et al. Extinction risk from climate change. Nature. 2004;427(6970):145–8. doi:10.1038/nature02121. [Google Scholar] [PubMed] [CrossRef]
33. Yang GG, Hao HX, Yue YP, Zhou JH, Lai LM, Zheng YR. Community characteristics, distribution and environment interpretation of Cupressus gigantea along Yarlung Zangbo River in Tibet. J Beijing Norm Univ Nat Sci. 2023;59(1):156–62. (In Chinese). [Google Scholar]
34. Nazir F, Peter P, Gupta R, Kumari S, Nawaz K, Khan MIR. Plant hormone ethylene: a leading edge in conferring drought stress tolerance. Physiol Plant. 2024;176(1):e14151. doi:10.1111/ppl.14151. [Google Scholar] [CrossRef]
35. Ranjan A, Sinha R, Singla-Pareek SL, Pareek A, Singh AK. Shaping the root system architecture in plants for adaptation to drought stress. Physiol Plant. 2022;174(2):e13651. doi:10.1111/ppl.13651. [Google Scholar] [PubMed] [CrossRef]
36. Hammer GL, Dong Z, McLean G, Doherty A, Messina C, Schussler J, et al. Can changes in canopy and/or root system architecture explain historical maize yield trends in the U.S. corn belt? Crop Sci. 2009;49(1):299–312. doi:10.2135/cropsci2008.03.0152. [Google Scholar] [CrossRef]
37. Hasan M, Naushin F, Shaher H, Bagyaraj DJ. Influence of sewage sludge, Rhizobium and arbuscular mycorrhizal fungi on nutrient uptake, growth, photosynthetic and biochemical attributes in Cicer arietinum L. Braz J Bot. 2023;46(4):1161–76. doi:10.1007/s40415-023-00934-4. [Google Scholar] [CrossRef]
38. Querejeta JI, Ren W, Prieto I. Vertical decoupling of soil nutrients and water under climate warming reduces plant cumulative nutrient uptake, water-use efficiency and productivity. New Phytol. 2021;230(4):1378–93. doi:10.1111/nph.17258. [Google Scholar] [PubMed] [CrossRef]
39. Querejeta JI, Estrada-Medina H, Allen MF, Jiménez-Osornio JJ. Water source partitioning among trees growing on shallow karst soils in a seasonally dry tropical climate. Oecologia. 2007;152(1):26–36. doi:10.1007/s00442-006-0629-3. [Google Scholar] [PubMed] [CrossRef]
40. Voltas J, Lucabaugh D, Chambel MR, Ferrio JP. Intraspecific variation in the use of water sources by the circum-Mediterranean conifer Pinus halepensis. New Phytol. 2015;208(4):1031–41. doi:10.1111/nph.13569. [Google Scholar] [PubMed] [CrossRef]
41. Jobbágy EG, Jackson RB. The distribution of soil nutrients with depth: global patterns and the imprint of plants. Biogeochemistry. 2001;53(1):51–77. doi:10.1023/A:1010760720215. [Google Scholar] [CrossRef]
42. Barbeta A, Mejía-Chang M, Ogaya R, Voltas J, Dawson TE, Peñuelas J. The combined effects of a long-term experimental drought and an extreme drought on the use of plant-water sources in a Mediterranean forest. Glob Chang Biol. 2015;21(3):1213–25. doi:10.1111/gcb.12785. [Google Scholar] [PubMed] [CrossRef]
43. Schlesinger WH, Dietze MC, Jackson RB, Phillips RP, Rhoades CC, Rustad LE, et al. Forest biogeochemistry in response to drought. Glob Change Biol. 2016;22(7):2318–28. doi:10.1111/gcb.13105. [Google Scholar] [PubMed] [CrossRef]
44. León-Sánchez L, Nicolás E, Goberna M, Prieto I, Maestre FT, Querejeta JI. Poor plant performance under simulated climate change is linked to mycorrhizal responses in a semiarid shrubland. J Ecol. 2018;106(3):960–76. doi:10.1111/1365-2745.12888. [Google Scholar] [PubMed] [CrossRef]
45. León-Sánchez L, Nicolás E, Prieto I, Nortes P, Maestre FT, Querejeta JI. Altered leaf elemental composition with climate change is linked to reductions in photosynthesis, growth and survival in a semi-arid shrubland. J Ecol. 2020;108(1):47–60. doi:10.1111/1365-2745.13259. [Google Scholar] [CrossRef]
46. Prieto I, Almagro M, Bastida F, Querejeta JI. Altered leaf litter quality exacerbates the negative impact of climate change on decomposition. J Ecol. 2019;107(5):2364–82. doi:10.1111/1365-2745.13168. [Google Scholar] [CrossRef]
Cite This Article
 Copyright © 2025 The Author(s). Published by Tech Science Press.
This work is licensed under a Creative Commons Attribution 4.0 International License , which permits unrestricted use, distribution, and reproduction in any medium, provided the original work is properly cited.
 Downloads
 Citation Tools