
 Submit a Paper
 Propose a Special lssue
 Open Access
ARTICLE

Impact of Drought, Salinity, and Waterlogging on Wheat: Physiological, Biochemical Responses, and Yield Implications
1 Mona Reclamation Experimental Project (MREP), WAPDA, Bhalwal, Sargodha, 40410, Pakistan
2 Department of Entomology, PMAS-Arid Agriculture University, Rawalpindi, 46300, Pakistan
3 Shenzhen Key Laboratory of Marine Bioresource & Eco-Environmental Sciences, College of Life Sciences and Oceanography, Shenzhen University, Shenzhen, 51807, China
4 Provincial Reference Fertilizer Testing Laboratory Raiwind, Lahore, 55150, Pakistan
5 Department of Zoology, College of Science, King Saud University, Riyadh, 11451, Saudi Arabia
6 Center for Global Health Research, Saveetha Medical College, Saveetha Institute of Medical and Technical Sciences, Chennai, 602105, India
7 Faculty of Health and Life Sciences, INTI International University, Nilai, 71800, Malaysia
* Corresponding Author: Mudasser Mehmood. Email:
(This article belongs to the Special Issue: Abiotic Stress Tolerance in Crop Plants: Physio-biochemical and Molecular Mechanisms)
Phyton-International Journal of Experimental Botany 2025, 94(4), 1111-1135. https://doi.org/10.32604/phyton.2025.059812
Received 17 October 2024; Accepted 08 February 2025; Issue published 30 April 2025
 View Full Text
 Download PDF
Abstract
Wheat (Triticum aestivum L.) is a staple crop critical for global food security, yet its productivity is significantly affected by abiotic stresses such as drought, salinity, and waterlogging, which are exacerbated by climate change. This study evaluated the effects of these stresses on vegetative growth, physiological responses, and yield. Field experiments were conducted using a Randomized Complete Block Design (RCBD) at the Mona Reclamation Experimental Project (MREP), WAPDA, Bhalwal, Sargodha, Punjab Pakistan. Stress treatments included three levels of drought (25%, 50%, and 75% field capacity), salinity (4, 8, and 12 dS/m), and waterlogging (24, 48, and 72 h). Key parameters measured included plant height, leaf area, tiller number, stomatal conductance, chlorophyll content, and antioxidant enzyme activities. The results revealed that drought stress caused a 46% reduction in yield, while salinity and waterlogging reduced yield by 54% and 35%, respectively, with statistically significant differences (p < 0.05). Key physiological changes included a significant reduction in stomatal conductance (from 0.55 to 0.15 mmol m²/s under drought stress, p < 0.01) and chlorophyll content (from 48 to 28 SPAD units under drought, p < 0.01). Biochemical responses indicated elevated levels of malondialdehyde (MDA) and hydrogen peroxide (H₂O₂), with significant increases in antioxidant enzyme activities, particularly superoxide dismutase (SOD) and catalase (CAT). These findings underscore the need for developing stress-tolerant wheat varieties and implementing agronomic practices to mitigate the impact of abiotic stresses on wheat yield.Keywords
Wheat (Triticum aestivum L.) is among the most popular staple crops in the world, which offers the human body nutrients and energy in the form of calories. It spans approximately 225 million hectares and contributes to a global production of 750 million tons of yield [1]. From the time it was domesticated around 10,000 years ago, wheat has played a pivotal role in safeguarding global food and nutrition security [2,3]. In addition to its global significance, wheat plays a vital role in Pakistan’s agricultural economy, serving as a key component of the national food basket. Wheat is not only a staple food crop but also a vital raw material for the food processing industry, used in products like bread, pasta, and confectionery [4]. Beyond food, wheat contributes to bioethanol production and industrial applications, such as paper manufacturing and bio-composites [5]. These versatile uses highlight wheat’s economic and industrial significance globally. It is grown across some 9 million hectares of area and yields about 25 million MT per annum, thus ranking Pakistan as the eighth largest world producer of wheat [6]. Population growth, urbanization, and shifting dietary patterns continue to drive an ever-increasing demand for wheat, necessitating the adoption of sustainable and efficient production methods to meet global food security challenges [7].
Given its critical role in food security, wheat faces complex challenges posed by abiotic stresses such as salinity and drought that affect wheat growth and productivity. Muhammad et al. (2023) emphasized the critical impact of soil salinity and drought on plant productivity and microbial diversity while outlining potential amelioration strategies [8]. Similarly, Li et al. (2024) demonstrated the involvement of the ABA- and H₂O₂-mediated ascorbate–glutathione cycle in drought stress responses in wheat roots, providing valuable insights into the biochemical mechanisms underlying stress tolerance [9]. These findings underline the importance of understanding and mitigating these stresses to ensure sustainable wheat production [10–12]. These stresses reduce wheat productivity by stunting plant growth and lowering yields. Among these stresses, drought emerges as the most pervasive challenge, with its impacts being further amplified by global warming [13]. One of the greatest threats to food production is posed by drought [14]. It is observed in almost all climatic areas [15]. Indeed, the impact of this phenomenon on the plant is significant, as it can deeply influence the chemical composition, morphology, and physiological processes. Consequently, it leads to a substantial reduction in crop productivity [16]. Drought disrupts water relations in plants at the molecular, cellular, organ, and whole-plant levels. Reduced soil moisture limits nutrient uptake, impairing germination and plant establishment [17,18]. Global warming could worsen wheat production, with yields dropping by up to 6.4% for each 1°C rise in temperature [19]. It is projected that the potential for wheat production loss resulting from drought-induced stress would witness an approximate 12% escalation by the end of the 21st century [20].
While drought takes precedence, salinity also significantly impacts wheat productivity, affecting approximately 20% of the total cultivated land worldwide and resulting in yield reductions of around 20% [21,22]. Soil salinization is being accelerated on a global scale as a result of climate change, intensive agricultural practices, inadequate land drainage systems, and the utilization of contaminated or substandard irrigation water [21,22]. The efficiency of plant photosynthesis is greatly reduced under salt stress conditions, mainly as a result of the presence of sodium (Na+) and chloride (Cl−) ions [23]. The initial impact of salinity stress on plants manifests as osmotic stress, followed by subsequent ionic stress. Consequently, plants respond by closing their stomata, reducing the rate of transpiration, and experiencing a loss of turgor pressure. These physiological adjustments impede both root expansion and shoot cell growth [24].
In addition to drought and salinity, waterlogging is another critical factor having a significant impact on around 10 to 15 million hectares of cultivated land dedicated to wheat production, resulting in annual reductions in crop yield ranging from 20% to 50% [25]. In recent decades, climate change has caused an increase in the frequency of flooding due to more intense and erratic precipitation [26]. In an environment characterized by excessive water saturation, oxygen availability may become limited, impeding root growth and ultimately leading to their demise. Under such circumstances, physiological processes that rely on energy, such as the absorption and transportation of water and nutrients to the plant’s above ground parts, are hindered. This impediment negatively impacts plant growth, development, and ultimately, the overall yield [27,28].
To address these multifaceted challenges, it is essential to understand the physiological and biochemical mechanisms by which wheat responds to these stresses, paving the way for improved management strategies. This knowledge is essential in crafting countermeasures to minimize the negative impact of said stresses on wheat production for sustainable convolutions [29]. The present investigation primarily focuses on determining the effects of drought, salinity, and waterlogging stress factors on selected vegetative and physiological attributes of wheat in a controlled environment in Pakistan.
To achieve this objective, this work aims to establish the following: the effects of drought, salinity, and waterlogging on the vegetative growth and physiology of wheat. To this end, the study will have an evaluation of the imposed abiotic stresses on the growth parameters that include plant height, leaf area, stem diameter, and number of tillers, including other statistic coefficients, which include stomatal conductance, chlorophyll, relative water, and rate of photosynthesis among others. Moreover, proposed biochemical alterations caused by stress on wheat are described, and some of them are as follows; Ion leakage, Malondialdehyde (MDA), Hydrogen peroxide (H2O2), Superoxide anions, Superoxide dismutase (SOD), Peroxidase (POD), Catalase (CAT), Ascorbate peroxidase (APX). A Randomized Complete Block Design (RCBD) design at multiple levels of stress treatment is adopted for this study in a bid to explain the variations in wheat stress responses due to drought, salinity, and waterlogging. The specific contributions of this research are anticipated as follows: This information will help in the breeding of wheat varieties with improved tolerance to the above-mentioned abiotic stresses that can create a solid foundation for sustainable agriculture and food security in stress-affected areas.
2.1 Study Area and Experimental Design
The research was carried out in the research fields Mona Reclamation Experimental Project (MREP), WAPDA, Bhalwal, Sargodha, Punjab, Pakistan (32.2751° N, 72.9047° E), one of the major agricultural belts of Punjab, Pakistan. The experimental plot was one-acre size, and natural environmental conditions were utilized throughout the study. Daytime temperatures ranged from 22°C to 30°C, while nighttime temperatures varied between 15°C and 20°C. The crops received approximately 12 h of sunlight per day, with relative humidity fluctuating between 50% and 70%, typical of the region during the wheat season. The research was conducted during the wheat growing season from November up to April of 2022–2023 and 2023–2024, the common wheat season in this region. The experiment was done following RCBD due to its effectiveness in the management of treatments, block variability, and precision. The experiment included four treatments: Control, Drought, Salinity, and Waterlogging. Each of them is replicated three times, making a total of twelve experimental units. While the study area was selected for its uniform soil type and topography, proximity to adjacent fields might have influenced the results due to potential cross-contamination from neighboring agricultural practices, such as irrigation runoff or fertilizer application. Efforts were made to minimize these effects by maintaining clear boundaries and ensuring consistent management within the experimental site.
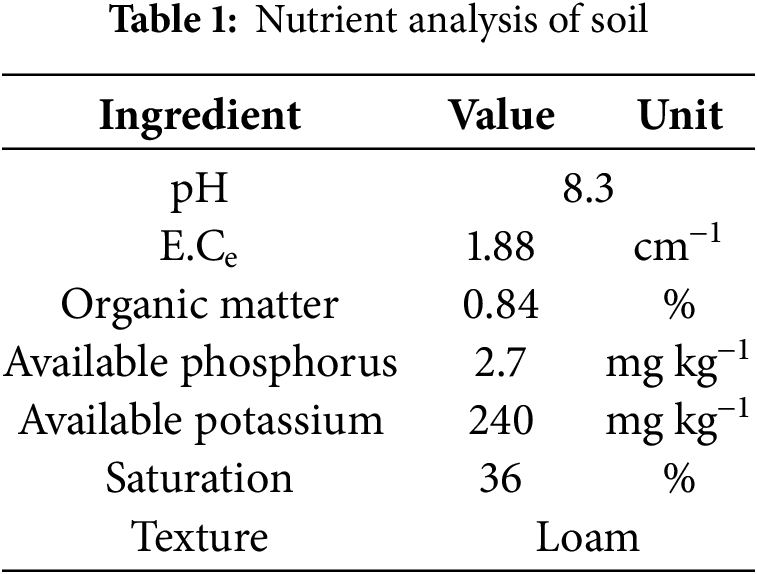
Samples were gathered from the MREP land study area using a random sampling method. An AMS soil sampling augur (AMS Inc., Model: 400.48, American Falls, ID, USA) was used to collect samples at a depth of 15 cm from each designated sampling zone. Rigorous adherence to random sampling protocols was maintained to ensure the acquisition of representative soil samples from the selected site. To prevent contamination, the collected soil samples were placed in clean, labeled, sealed containers. Subsequently, the soil samples underwent testing for various parameters, including nutrient content, pH, organic matter, etc., to comprehensively assess the soil characteristics. Table 1 shows the outcome of the analysis.
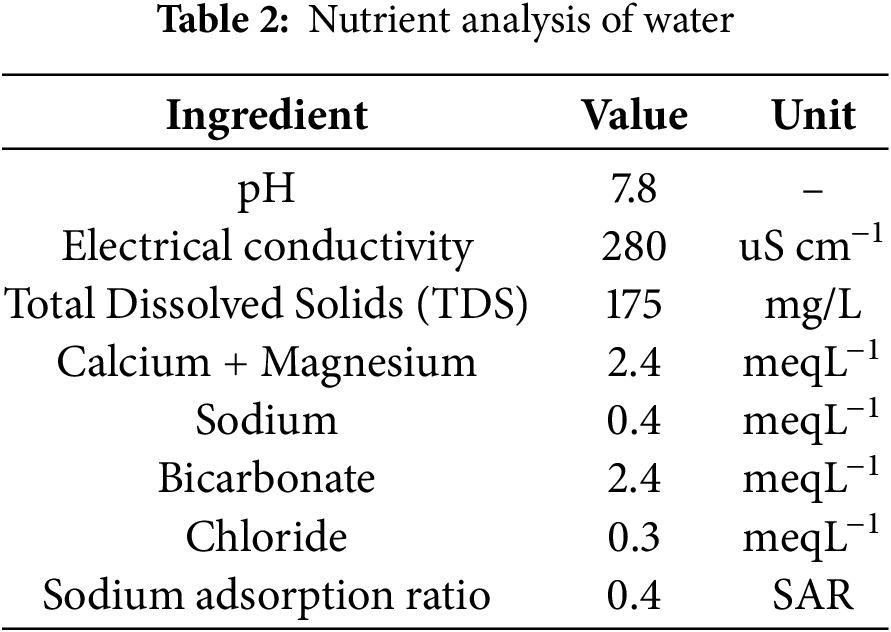
Canal water served as the primary source of irrigation. Samples were systematically collected at various locations along the water channel to assess variations in water quality. Potential errors, such as contamination during handling, were minimized by using sterilized bottles, sealing samples immediately after collection, and transporting them in a temperature-controlled environment. These samples were meticulously labeled and stored for analysis. The collected water samples were analyzed for pH, Electrical Conductivity (EC), Total Dissolved Solids (TDS), and concentrations of key ions, such as calcium, magnesium, and bicarbonate, to comprehensively assess the chemical composition and suitability of water for irrigation. Water analysis results are given in Table 2.
2.4 Land Preparation and Sowing
The study area underwent a preparatory phase involving the removal of debris and previous crop residues. Subsequently, the land was ploughed to an appropriate depth to break up compacted soil and enhance the aeration. Farm machinery was employed to level the field, ensuring uniform water distribution during irrigation. In accordance with the results of soil analysis, soil amendments, such as NaCl, were evenly broadcasted across the field and incorporated into the soil using a rotary tiller. The process was carried out over two days to ensure thorough mixing and equilibration before proceeding to sow.
Premium-quality wheat seeds, specifically the chosen variety Dilkash (Fig. S1), were sown in alignment with the research objectives and prevailing climate conditions. The wheat variety is a commonly grown cultivar in Pakistan, known for its moderate resistance to environmental stresses. The seedbed was thoroughly harrowed to facilitate optimal seed-to-soil contact. Throughout the germination phase, environmental conditions were closely monitored to ensure favorable conditions for seedling emergence. Detailed records, including the date of sowing, seed rate, and other pertinent information, were documented for each treatment plot.
To assess the impact of abiotic stress in wheat, we implemented three levels of each stress factor. The water reduction applied the assessment of drought treatment to 75%, 50%, and 25% of field capacity corresponding to mild (Level-1), moderate (Level-2), and severe degree (Level-3) of drought stress, respectively. To simulate salinity stress, sodium chloride (NaCl) was evenly broadcast onto the soil surface and incorporated into the topsoil using a rotary tiller before sowing. In the later stages of crop growth, salinity levels were maintained by dissolving NaCl in the irrigation water to achieve the electrical conductivity (EC) levels of 4, 8, and 12 dS/m for low (Level-1), medium (Level-2), and high (Level-3) levels, respectively. The water used for irrigation was monitored for electrical conductivity (EC) to ensure the salinity levels were consistent with the experimental treatments. EC was measured regularly using a portable conductivity meter at different points in the irrigation system. The amount of NaCl applied was adjusted as needed to keep the EC within the specified ranges throughout the study period, accounting for evaporation and dilution from rainfall or irrigation. The waterlogging treatments were kept at poorly drained (Level-3), imperfectly drained (Level-2), and moderately drained (Level-1) [30]. The stresses (drought, salinity, and waterlogging) were applied at key stages of wheat growth rather than continuously throughout the entire study period. For drought stress, the irrigation was withheld at different growth stages, specifically during the vegetative and reproductive phases (from December to February), to simulate water scarcity conditions. Salinity stress was applied during the same period by irrigating with saline water to achieve the desired EC levels (4, 8, and 12 dS/m). Waterlogging stress was imposed during the reproductive phase (from February to March), with controlled flooding of the soil to simulate waterlogged conditions. These specific stress levels were chosen to simulate conditions commonly encountered in stress-prone agricultural regions. For example, drought levels correspond to reductions in soil moisture frequently observed during prolonged dry spells, while salinity levels reflect the range of saline conditions in irrigation-dependent areas. Similarly, waterlogging levels replicate durations of soil saturation experienced in regions with poor drainage or excessive rainfall [31,32]. The field images for wheat seeds, control, and stress treatments are given in Fig. S2. Data collection focused on a comprehensive set of vegetative, physiological, and biochemical parameters to capture the full impact of stress treatments.
Measurements were taken for plant height, leaf area, stem diameter, and tiller number. Plant height was measured from the base to the tip of the mother tiller, and leaf area was determined by measuring the length and width of the flag leaf at three distinct points (base, midsection, and tip). The average width was then used in conjunction with the length to calculate the leaf area using a leaf area meter, stem diameter was measured with the help of a vernier caliper at the base of the stem, and the number of tillers per plant was counted manually (Fig. S3).
2.5.2 Physiological Parameters
Stomatal conductance was measured using “Delta-T porometer AP4 (Delta-T Devices Ltd., Burwell, Cambs., UK), chlorophyll content was assessed with a Minolta SPAD-502 chlorophyll meter, and relative water content (RWC) was calculated using the formula:
The photosynthetic rate was determined using a portable photosynthesis system available at the Institute of Biological Sciences, Khwaja Fareed University of Engineering and Information Technology, Rahim Yar Khan, which provided real-time data on the net photosynthesis rate.
The biochemical parameters were measured using standard protocols described in the literature. Malondialdehyde (MDA) content, which is an indicator of lipid peroxidation, was measured according to the method of Heath et al. [33]. The tissue samples were homogenized in trichloroacetic acid (TCA), and the MDA content was determined by measuring the absorbance at 532 nm. Hydrogen peroxide (H2O2) content was quantified by the method of Perez et al. [34], using a spectrophotometric assay based on the reaction between H2O2 and titanium sulfate, with absorbance measured at 410 nm.
For antioxidant enzyme activities, Superoxide dismutase (SOD), Peroxidase (POD), and Catalase (CAT) were measured following the protocols outlined by Beauchamp et al. [35], Kar et al. [36], and Aebi [37], respectively. SOD activity was determined by the inhibition of photochemical reduction of nitro blue tetrazolium (NBT). In contrast, POD and CAT activities were measured by their ability to decompose hydrogen peroxide, with absorbances read at 470 and 240 nm, respectively.
The physiological and biochemical parameters were measured at three key stages: vegetative growth, flowering, and grain filling. Measurements for physiological parameters such as stomatal conductance, chlorophyll content, and photosynthetic rate were taken at 30, 60, and 90 days after sowing (DAS), corresponding to the vegetative, reproductive, and grain-filling stages, respectively. Biochemical parameters, including antioxidant enzyme activities (SOD, POD, CAT), MDA, and H2O2 content, were measured at similar intervals to assess the stress-induced oxidative damage and the plant’s biochemical responses at each critical growth stage.
The final yield was calculated by harvesting and weighing the grains from each plot, while spike length was measured from the base to the tip of the spike (Fig. S3).
The results obtained in this study were analyzed through analysis of variance or ANOVA to assess the level of the treatment’s efficacy. The treatment means were compared using the Least Significant Difference (LSD) test at the 5% probability level to determine significant differences within the treatment means. Statistical analysis was performed using Statistix 8.1 software. The homoscedasticity was analyzed using Levene’s test, normality test (Shapiro-Wilk test), and Box-cox; square root transformation was used depending on the results of the test. Also, correlation analyses were performed to compare the interconnection of the various physiological and biochemical indexes under stress treatment.
The vegetative parameters of wheat, including plant height, leaf area, stem diameter, and tiller number, were significantly affected by the applied abiotic stress treatments. These parameters were analyzed to assess the impact of drought, salinity, and waterlogging on wheat growth, and the results were statistically significant, indicating the robustness of the findings.
The control group exhibited an average plant height of 140 ± 5 cm. In contrast, drought stress significantly reduced plant height (p < 0.01), with the severe drought condition (Level-3) yielding an average height of 85 ± 4 cm. This reduction highlights the critical impact of water deficit on cellular processes essential for elongation growth. Similarly, salinity stress resulted in a significant decrease (p < 0.05) in plant height, with the highest salinity level (12 dS/m) producing an average height of 100 ± 3 cm. The ionic and osmotic stresses under saline conditions limit water uptake and nutrient availability, thereby stunting growth. Waterlogging also significantly reduced plant height (p < 0.05), with the longest duration (72 h) causing an average reduction of 95 ± 3 cm. The anaerobic soil conditions induced by waterlogging restrict root respiration and nutrient absorption, impeding overall growth (Fig. 1).
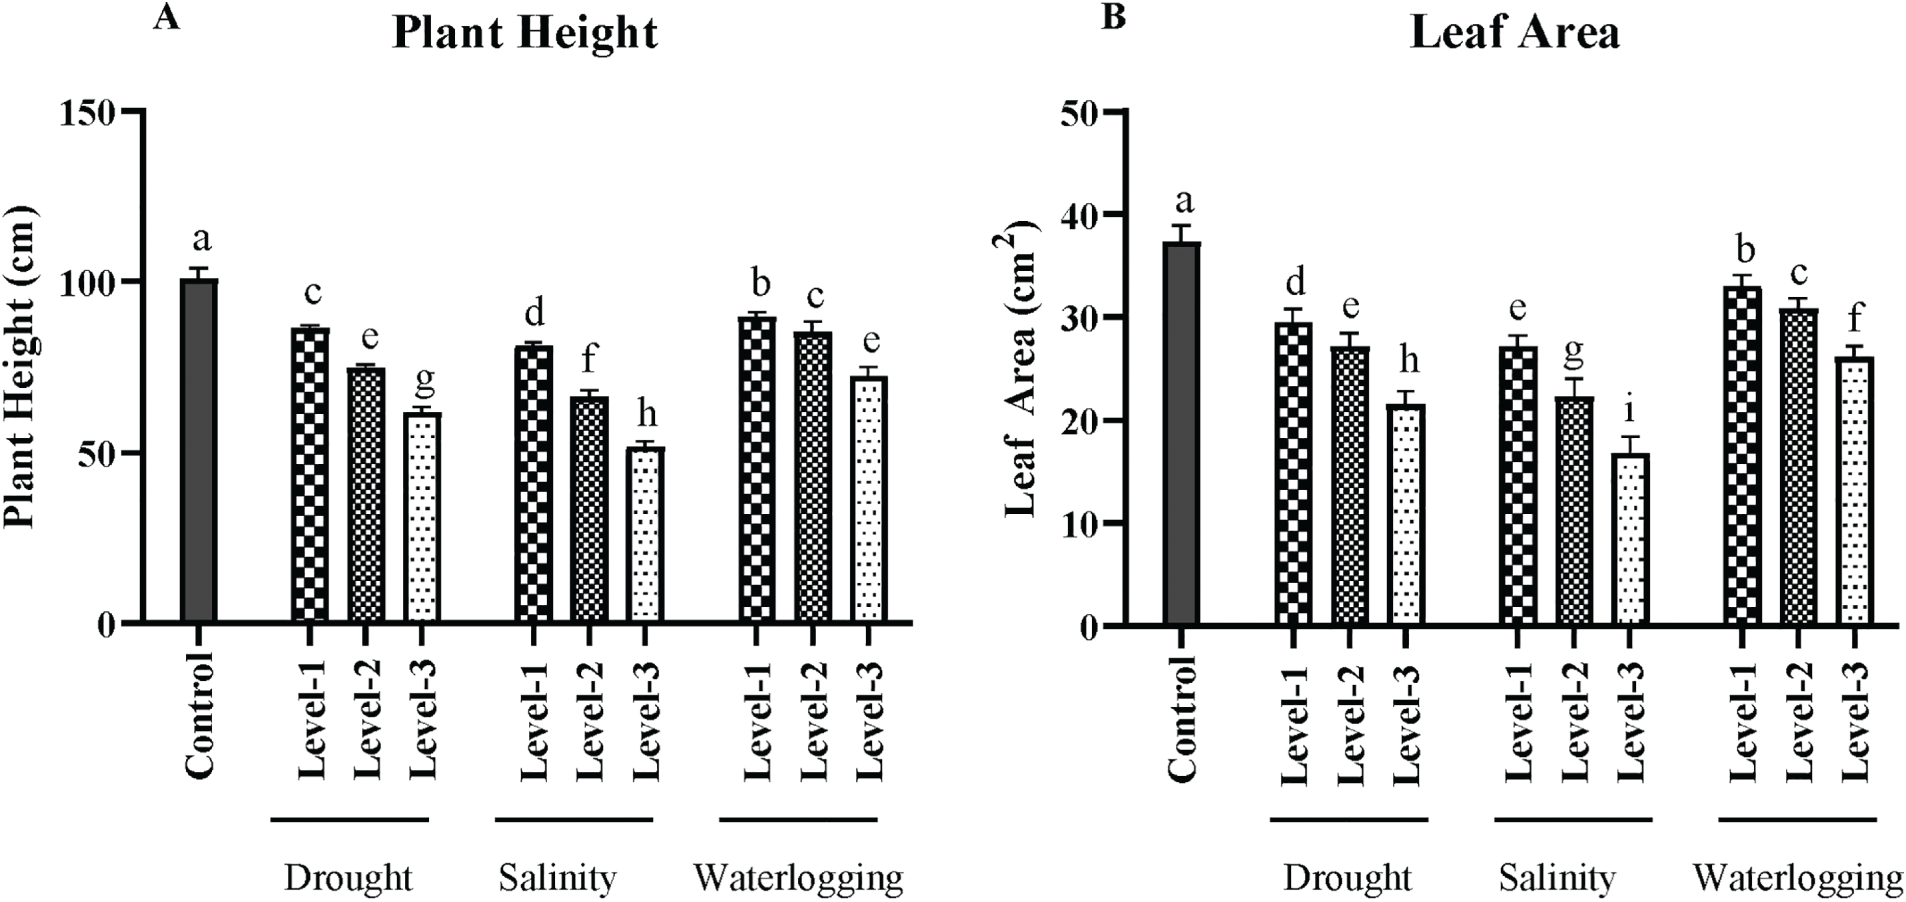
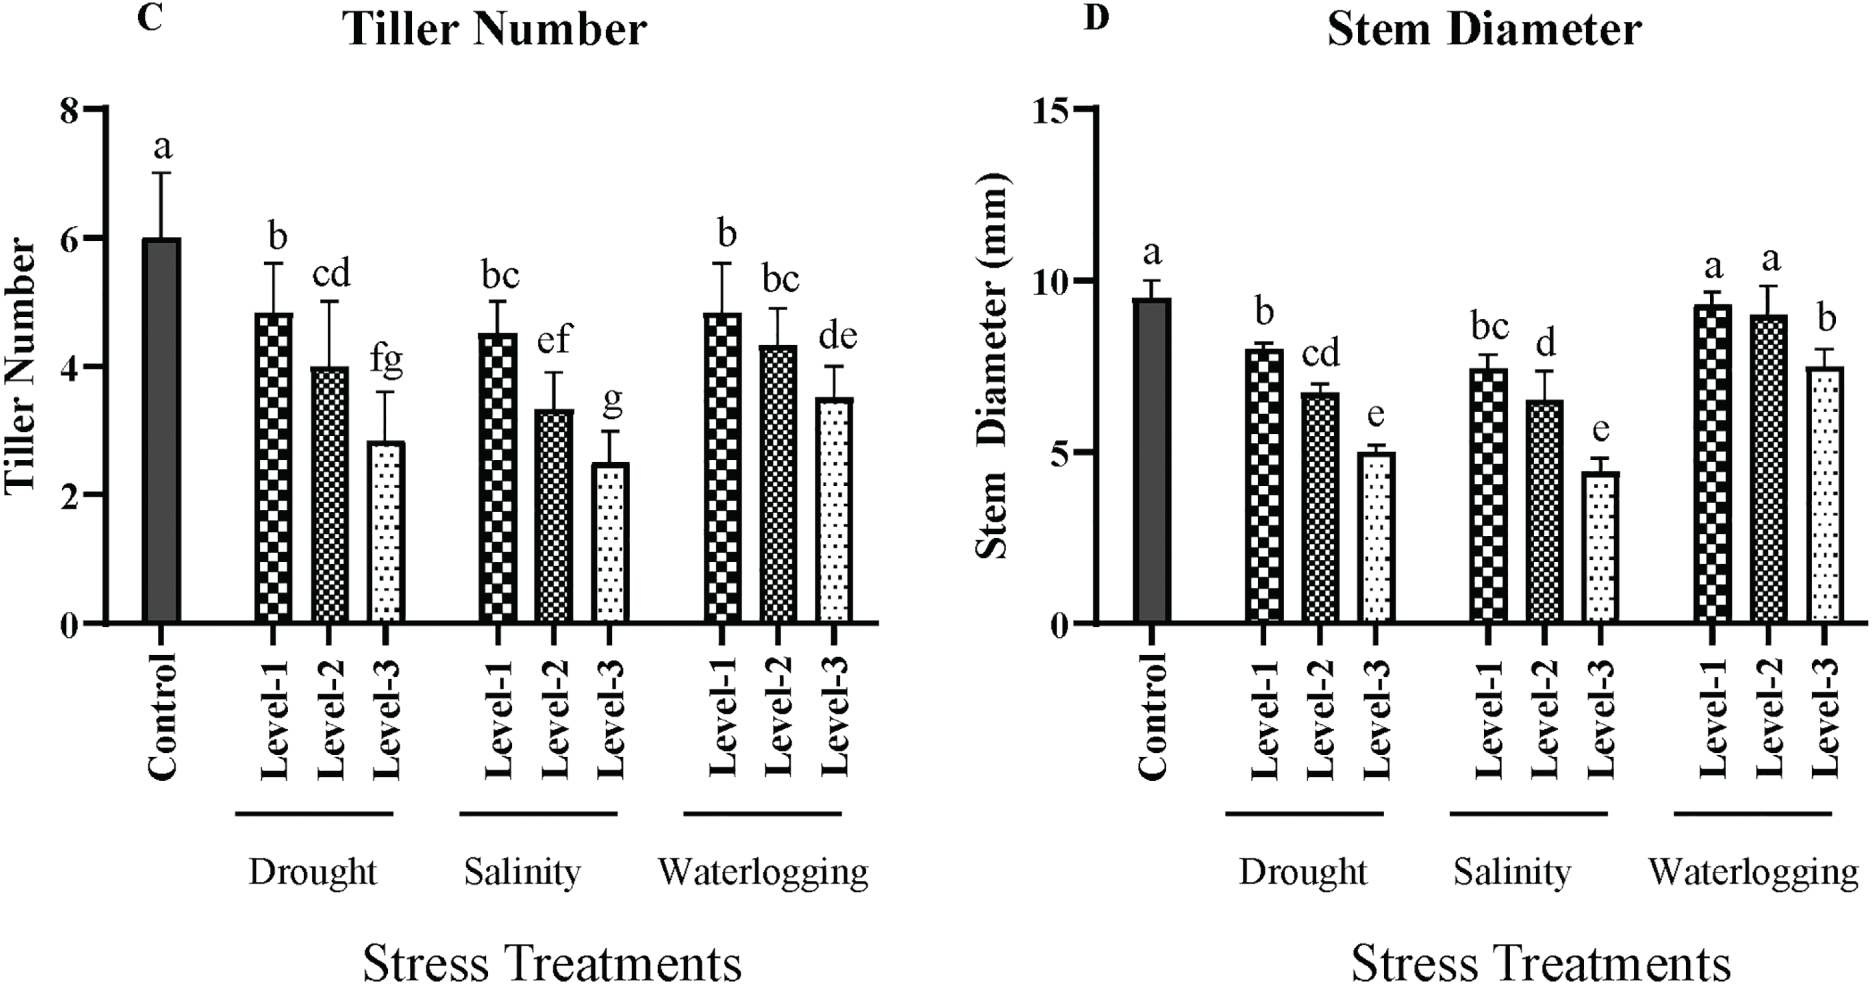
Figure 1: Effects of drought, salinity, and waterlogging stress treatments on wheat growth parameters. (A) Plant height (cm), (B) Leaf area (cm2), (C) Tiller number, and (D) Stem diameter (mm). Each bar represents the mean ± SE (n = 3 replicates). Different letters above the bars indicate statistically significant differences (p < 0.05) as determined by the Least Significant Difference (LSD) test all mean values were recorded at the end of the stress imposition. Stress treatments include three levels of drought (Level-1, Level-2, and Level-3), salinity (Level-1, Level-2, and Level-3), and waterlogging (Level-1, Level-2, and Level-3), with the control group for comparison
The leaf area, a crucial determinant of the plant’s photosynthetic efficiency, was significantly affected by the stress treatments. Control plants had an average leaf area of 35 ± 2 cm2. Drought conditions, particularly at Level 3, significantly decreased the leaf area to 20 ± 1.5 cm2 (p < 0.01). This reduction is an adaptive response to minimize water loss through transpiration. Salinity stress also reduced leaf area, with the highest level causing an average area of 22 ± 2 cm2. High salinity levels cause ion toxicity and osmotic stress, leading to reduced leaf growth. Waterlogging, especially at prolonged exposure, also significantly decreased the leaf area (p < 0.05), with an average area of 25 ± 1.8 cm2 observed at 72 h of waterlogging. The limited oxygen availability under these conditions adversely affects root function, leading to reduced leaf expansion and growth (Fig. 1).
The control group had an average stem diameter of 8 ± 0.3 mm. Drought stress significantly reduced the stem diameter (p < 0.01), with the most severe level showing an average diameter of 5 ± 0.2 mm. This reduction is attributed to limited water and nutrient availability, which affects the deposition of structural carbohydrates and lignin. Salinity stress also caused a significant decrease (p < 0.05) in stem diameter, with the highest salinity level resulting in an average diameter of 6 ± 0.3 mm. The combined effects of ion toxicity and osmotic stress reduce the plant’s ability to sustain robust stem growth. Waterlogging conditions led to a significant reduction (p < 0.05) in stem diameter, with the longest waterlogging duration resulting in a diameter of 6 ± 0.2 mm. The hypoxic conditions in waterlogged soils impair nutrient uptake, which is crucial for stem growth (Fig. 1).
The number of tillers per plant, a critical factor for potential grain yield, was also significantly impacted by the stress treatments. Control plants had an average of 7 ± 0.4 tillers. Drought stress, particularly at the most severe level, significantly reduced tiller number to an average of 3 ± 0.2 tillers (p < 0.01). Stress inhibits the initiation and development of tillers due to water scarcity. Salinity stress caused a significant reduction (p < 0.05) in tiller numbers, with the highest level showing an average of 4 ± 0.3 tillers. The osmotic and ionic stress from salinity impedes tiller formation. Waterlogging also resulted in a significant decrease (p < 0.05) in tiller number, with an average of 4 ± 0.2 tillers observed under the longest duration of exposure. The anaerobic conditions limit the availability of oxygen, which is crucial for the growth and development of tillers (Fig. 1).
The physiological parameters of wheat, including stomatal conductance, chlorophyll content, relative water content, and photosynthetic rate, were significantly influenced by the different abiotic stress treatments. Changes in stomatal conductance and chlorophyll content are key indicators of plant stress. Reduced stomatal conductance limits CO2 uptake, decreasing photosynthesis and growth. Similarly, lower chlorophyll content reduces photosynthetic efficiency, directly impacting energy production and overall plant productivity.
Under control conditions, the average stomatal conductance was 0.55 mmol m2/s. Drought stress significantly reduced stomatal conductance, with the most severe drought level (Level-3) recording an average of 0.15 mmol m2/s (p < 0.01). This reduction is a typical plant response to water deficit, aiming to minimize water loss by reducing stomatal aperture. Salinity stress also caused a significant decrease in stomatal conductance (p < 0.05), with the highest salinity level resulting in an average conductance of 0.25 mmol m2/s. The ionic stress and osmotic adjustment in response to high salinity lead to partial stomatal closure, limiting gas exchange. Waterlogging had a similar effect, with the longest exposure (72 h) reducing the stomatal conductance to 0.30 mmol m2/s (p < 0.05). The hypoxic conditions created by waterlogging disrupt root function and decrease the uptake of essential nutrients and water, thereby affecting stomatal regulation (Fig. 2).

Figure 2: Effects of drought, salinity, and waterlogging stress treatments on physiological parameters of wheat. (A) Stomatal conductance (mmol m2/s), (B) Chlorophyll content (SPAD units), (C) Relative water content (RWC, %), and (D) Photosynthetic rate (µmol m2/s). Each bar represents the mean ± SE (n = 3 replicates). Different letters above the bars indicate statistically significant differences (p < 0.05) as determined by the Least Significant Difference (LSD) test. All mean values were recorded at the end of the stress imposition. Stress treatments include three levels of drought (Level-1, Level-2, and Level-3), salinity (Level-1, Level-2, and Level-3), and waterlogging (Level-1, Level-2, and Level-3), with the control group for comparison
Chlorophyll content is an important indicator of photosynthetic capacity and plant health. In control plants, the chlorophyll content was measured at 48 SPAD units. Drought stress led to a significant reduction (p < 0.01) in chlorophyll content, with the most severe drought condition showing an average of 28 SPAD units. The decrease in chlorophyll content under drought conditions can be attributed to chlorophyll degradation and reduced chlorophyll synthesis, both of which are common responses to water deficit. Salinity stress also significantly affected chlorophyll content (p < 0.05), with the highest salinity treatment reducing it to 32 SPAD units. High salinity levels cause ionic and osmotic stress, leading to chlorophyll degradation and reduced photosynthetic efficiency. Waterlogging resulted in a significant reduction (p < 0.05), with an average chlorophyll content of 34 SPAD units at the longest duration. The reduced chlorophyll content under waterlogged conditions can be linked to the limited oxygen availability, which affects chlorophyll synthesis and overall plant metabolism (Fig. 2).
3.2.3 Relative Water Content (RWC)
RWC is a measure of the water status of plant tissues and is crucial for maintaining cell turgor and metabolic activity. The control plants exhibited an average RWC of 85%. Under drought conditions, RWC significantly decreased (p < 0.01), with the most severe drought level showing an average of 55%. This decline in RWC reflects the reduced water uptake and increased water loss due to transpiration under drought stress. Salinity stress also led to a significant decrease in RWC (p < 0.05), with the highest salinity level resulting in an average RWC of 60%. The osmotic stress from salinity reduces water uptake, leading to a lower RWC. Waterlogging conditions similarly affected RWC, with the longest exposure showing a significant reduction (p < 0.05) to 62%. The anaerobic conditions under waterlogging restrict water uptake and transport, resulting in lower RWC (Fig. 2).
The photosynthetic rate, a key indicator of plant productivity, was significantly affected by the stress treatments. In control plants, the photosynthetic rate was recorded at 25 μmol m2/s. Drought stress led to a substantial reduction (p < 0.01) in the photosynthetic rate, with the most severe drought condition showing an average of 12 μmol m2/s. This reduction is due to the combined effects of reduced stomatal conductance, chlorophyll degradation, and lower RWC, all of which limit photosynthetic activity. Salinity stress also caused a significant decrease in the photosynthetic rate (p < 0.05), with the highest salinity level resulting in an average rate of 15 μmol m2/s. The ionic and osmotic stress under saline conditions impairs photosynthetic machinery, reducing overall photosynthesis. Waterlogging had a similar impact, significantly reducing the photosynthetic rate (p < 0.05) to 18 μmol m²/s at the longest exposure duration. The reduced oxygen availability in waterlogged soils affects root respiration and energy supply, thereby limiting photosynthetic capacity (Fig. 2).
The biochemical parameters, including ion leakage, malondialdehyde (MDA) content, hydrogen peroxide (H2O2) content, superoxide anion levels, and antioxidant enzyme activities (SOD, POD, CAT, APX), were critically evaluated to understand the oxidative stress responses of wheat under drought, salinity, and waterlogging conditions. The increased activities of antioxidant enzymes (SOD, POD, CAT, and APX) under stress conditions are a plant’s response to mitigate oxidative damage caused by reactive oxygen species (ROS). This upregulation of antioxidants helps protect key cellular components, thereby sustaining physiological processes such as photosynthesis. Elevated antioxidant activity helps maintain photosynthetic efficiency by reducing oxidative damage to photosynthetic machinery, which is often compromised under drought, salinity, and waterlogging stress. Consequently, the higher antioxidant enzyme activities observed in stressed plants are linked to the maintenance of photosynthetic rate and other physiological functions, helping the plant manage stress and mitigate yield loss.
Ion leakage serves as an indicator of membrane stability and integrity, with higher values indicating increased membrane damage. Under control conditions, ion leakage was relatively low at 10%. However, it significantly increased (p < 0.01) under drought stress, with the highest level (Level 3) showing an average ion leakage of 30%. This increase is attributed to the disruption of membrane integrity due to oxidative stress. Salinity stress also caused a significant rise in ion leakage (p < 0.05), with the highest salinity treatment resulting in 28% leakage. The accumulation of toxic ions, particularly Na+ and Cl−, contributes to membrane damage under saline conditions. Waterlogging induced a similar increase (p < 0.05), with ion leakage reaching 25% at the most prolonged exposure. The hypoxic conditions in waterlogged soils cause cellular respiration to shift to anaerobic pathways, leading to the accumulation of toxic metabolites that damage cell membranes (Fig. 3).
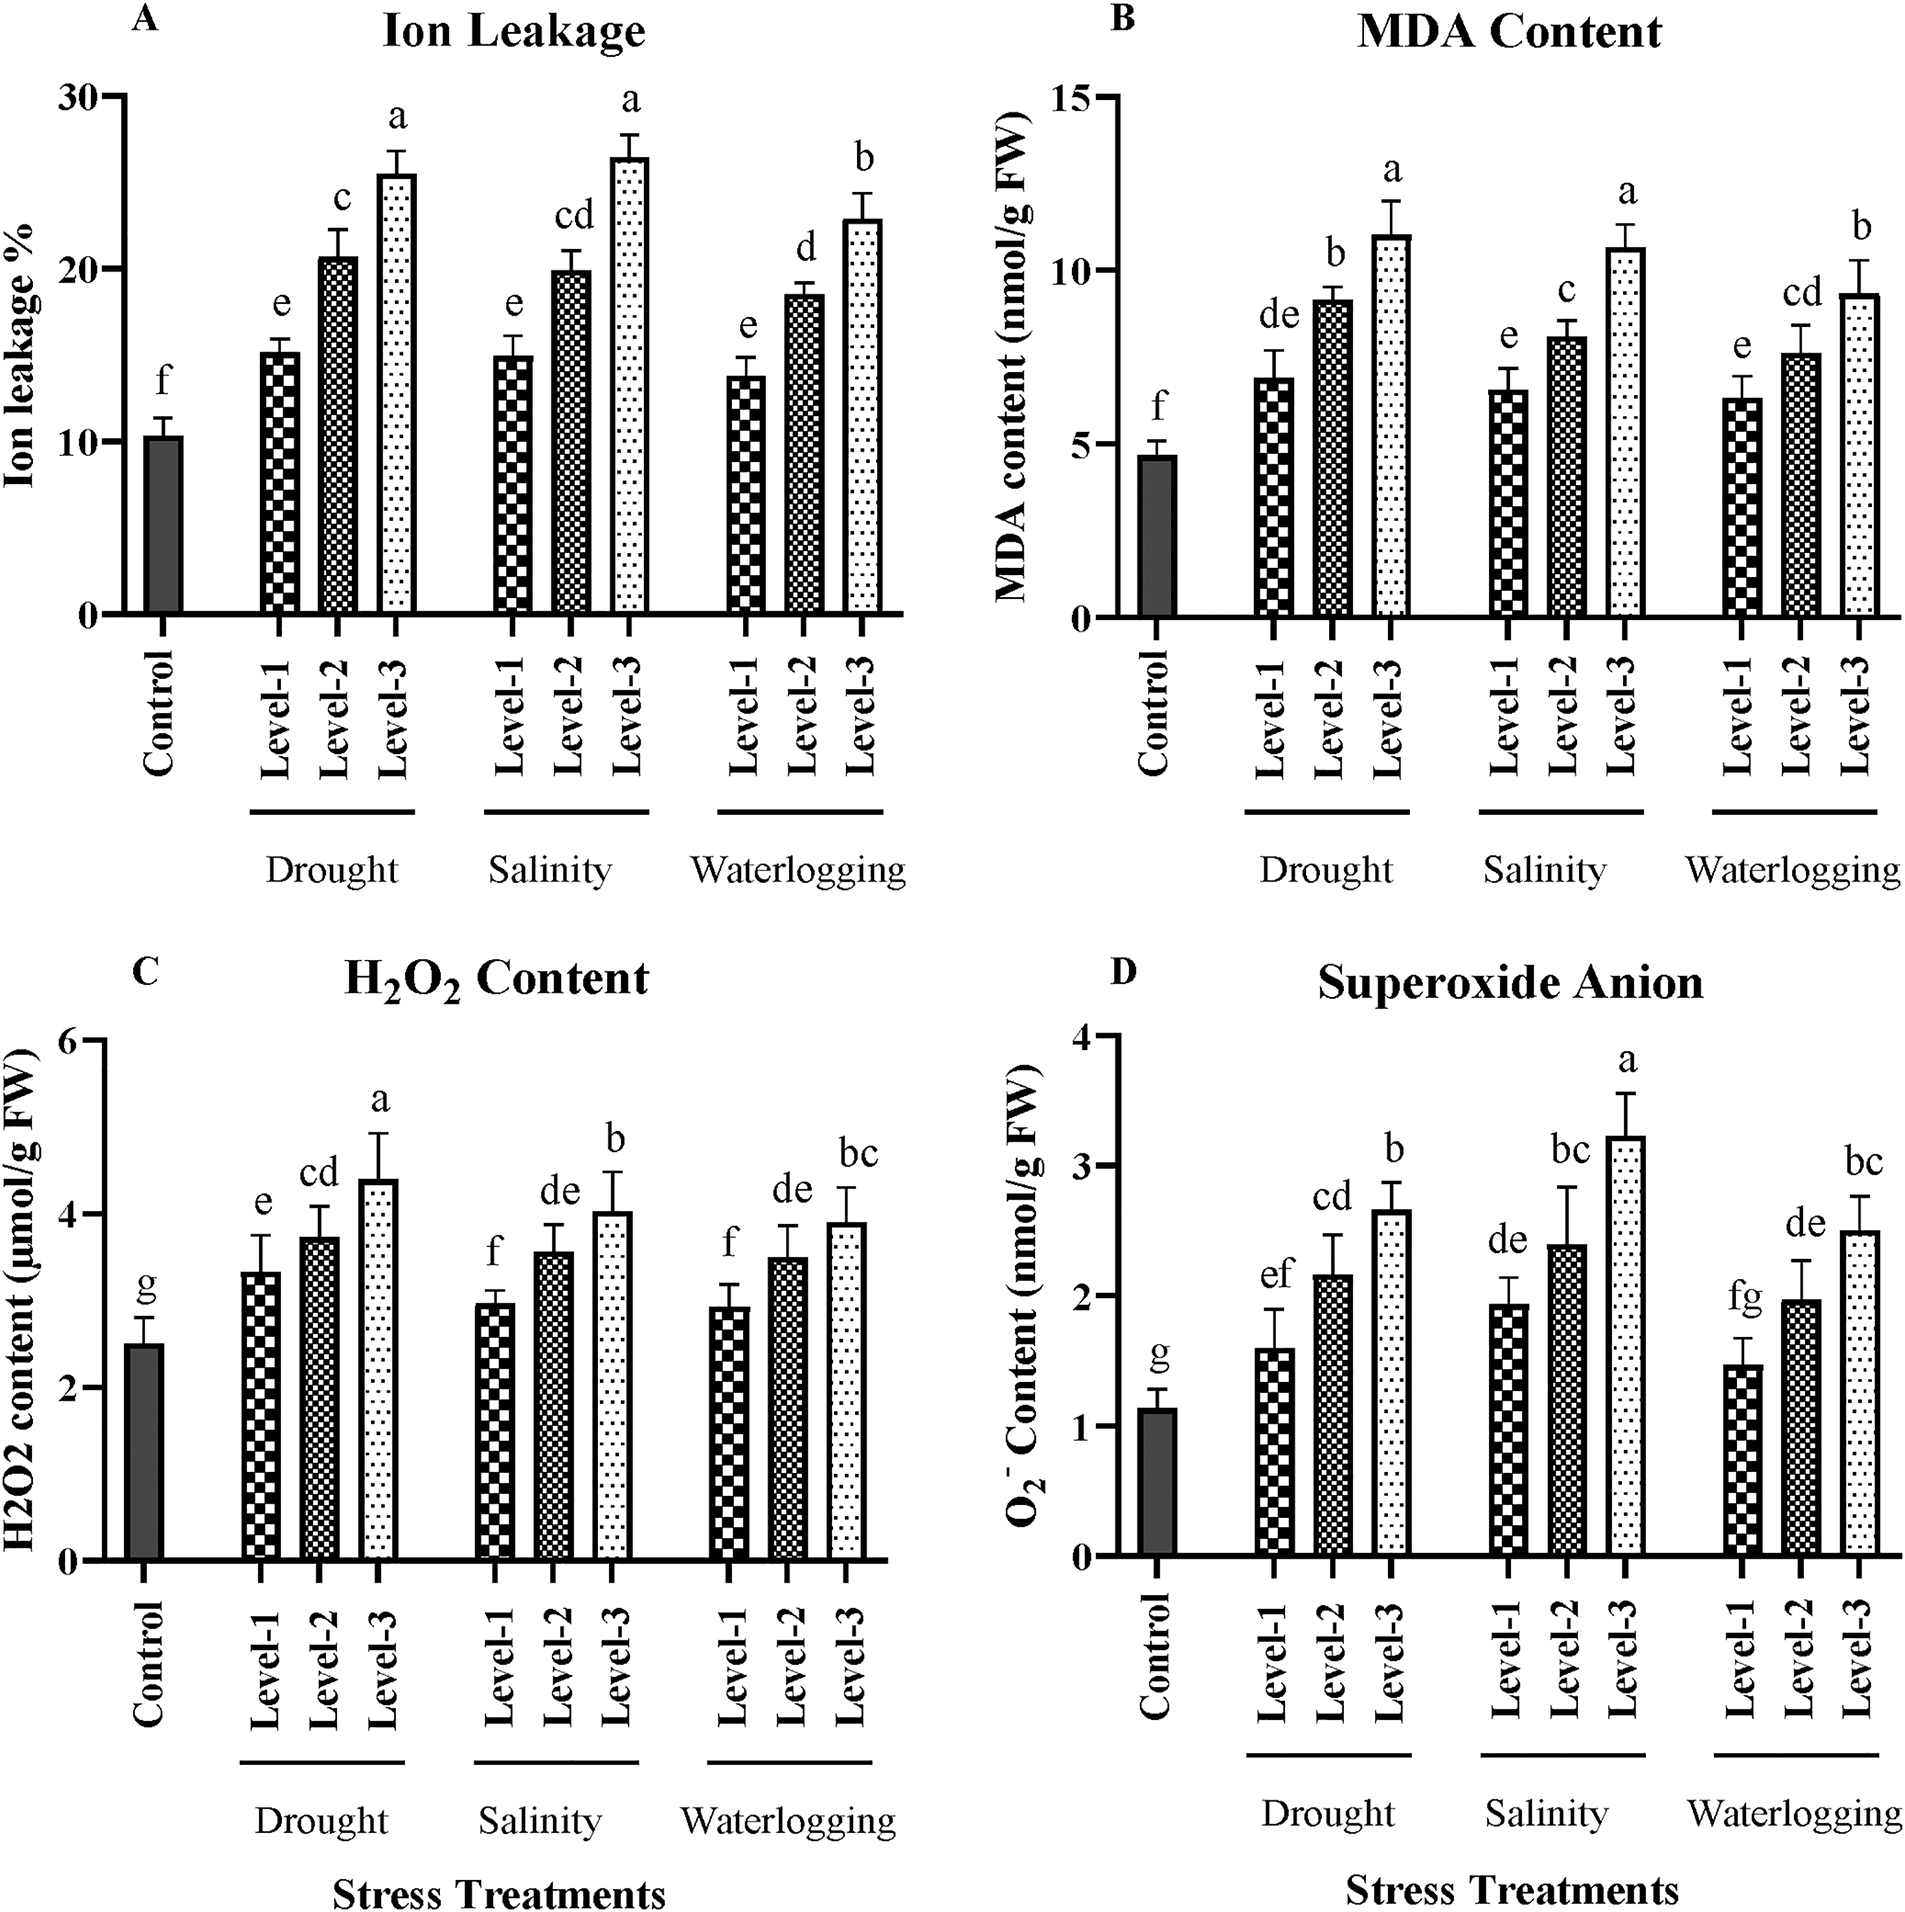
Figure 3: Effects of drought, salinity, and waterlogging stress treatments on biochemical parameters in wheat. (A) Ion leakage (%), (B) Malondialdehyde (MDA) content (nmol/g FW), (C) Hydrogen peroxide (H₂O₂) content (nmol/g FW), and (D) Superoxide anion (O2−) content (nmol/g FW). Stress treatments include three levels of drought (Level-1, Level-2, and Level-3), salinity (Level-1, Level-2, and Level-3), and waterlogging (Level-1, Level-2, and Level-3), with a control group for comparison. Data are presented as mean ± SE. Different letters above the bars indicate statistically significant differences (p < 0.05) based on the Least Significant Difference (LSD) test. All mean values were recorded at the end of the stress imposition
MDA is a by-product of lipid peroxidation and serves as a marker of oxidative stress. Control plants had an MDA content of 1.5 nmol/g fresh weight (FW). Under drought stress, MDA levels significantly increased (p < 0.01), with the most severe stress level showing an average of 4.5 nmol/g FW. The elevated MDA content indicates enhanced lipid peroxidation, a common response to oxidative stress caused by water deficit. Salinity stress also significantly increased MDA content (p < 0.05), with the highest salinity level resulting in 4.0 nmol/g FW. The ion imbalance and osmotic stress under salinity accelerate the generation of reactive oxygen species (ROS), leading to lipid peroxidation. In waterlogged conditions, MDA content also rose significantly (p < 0.05), with the longest exposure showing an average of 3.8 nmol/g FW. The anaerobic environment under waterlogging exacerbates oxidative damage, increasing lipid peroxidation (Fig. 3).
Hydrogen peroxide is a common ROS involved in signaling and stress responses. Under control conditions, H2O2 content was 1.0 μmol/g FW. Drought stress significantly elevated H2O2 levels (p < 0.01), with the highest drought level showing an average of 3.0 μmol/g FW. The increase in H2O2 content reflects the enhanced oxidative stress under water deficit conditions, which can damage cellular components. Salinity stress also led to a significant increase in H2O2 content (p < 0.05), with the highest salinity treatment resulting in 2.8 μmol/g FW. The ion toxicity and osmotic stress under saline conditions contribute to the overproduction of H2O2. Waterlogging similarly increased H2O2 content significantly (p < 0.05), with levels reaching 2.5 μmol/g FW at the most prolonged exposure. The lack of oxygen under waterlogged conditions leads to increased ROS production, including H H2O2 (Fig. 3).
Superoxide anion (O2−) is another ROS that can cause oxidative damage. Control plants had an average O2− level of 1.0 nmol/g FW. Drought stress significantly increased superoxide anion levels (p < 0.01), with the highest stress level showing an average of 2.8 nmol/g FW. The generation of superoxide anions under drought stress results from disrupted electron transport chains in chloroplasts and mitochondria. Salinity stress also significantly elevated O2− levels (p < 0.05), with the highest salinity treatment resulting in 2.5 nmol/g FW. The excessive uptake of Na+ and Cl− under saline conditions can lead to ROS generation, including superoxide anions. Waterlogging also led to a significant increase in O2− levels (p < 0.05), with the longest exposure showing an average of 2.3 nmol/g FW. The anaerobic conditions under waterlogging disrupt mitochondrial electron transport, leading to increased ROS production (Fig. 3).
3.3.5 Antioxidant Enzyme Activities
The activities of antioxidant enzymes such as superoxide dismutase (SOD), peroxidase (POD), catalase (CAT), and ascorbate peroxidase (APX) were measured to assess the plant’s defense mechanisms against oxidative stress.
SOD activity in control plants was 100 units/mg protein. Drought stress significantly increased SOD activity (p < 0.01), with the highest level reaching 180 units/mg protein. SOD is crucial for dismutating superoxide anions into hydrogen peroxide and oxygen, thereby mitigating oxidative damage. Salinity stress also significantly elevated SOD activity (p < 0.05), with the highest salinity level resulting in 160 units/mg protein. Waterlogging increased SOD activity to 150 units/mg protein, indicating an adaptive response to counteract increased ROS levels (Fig. 4).
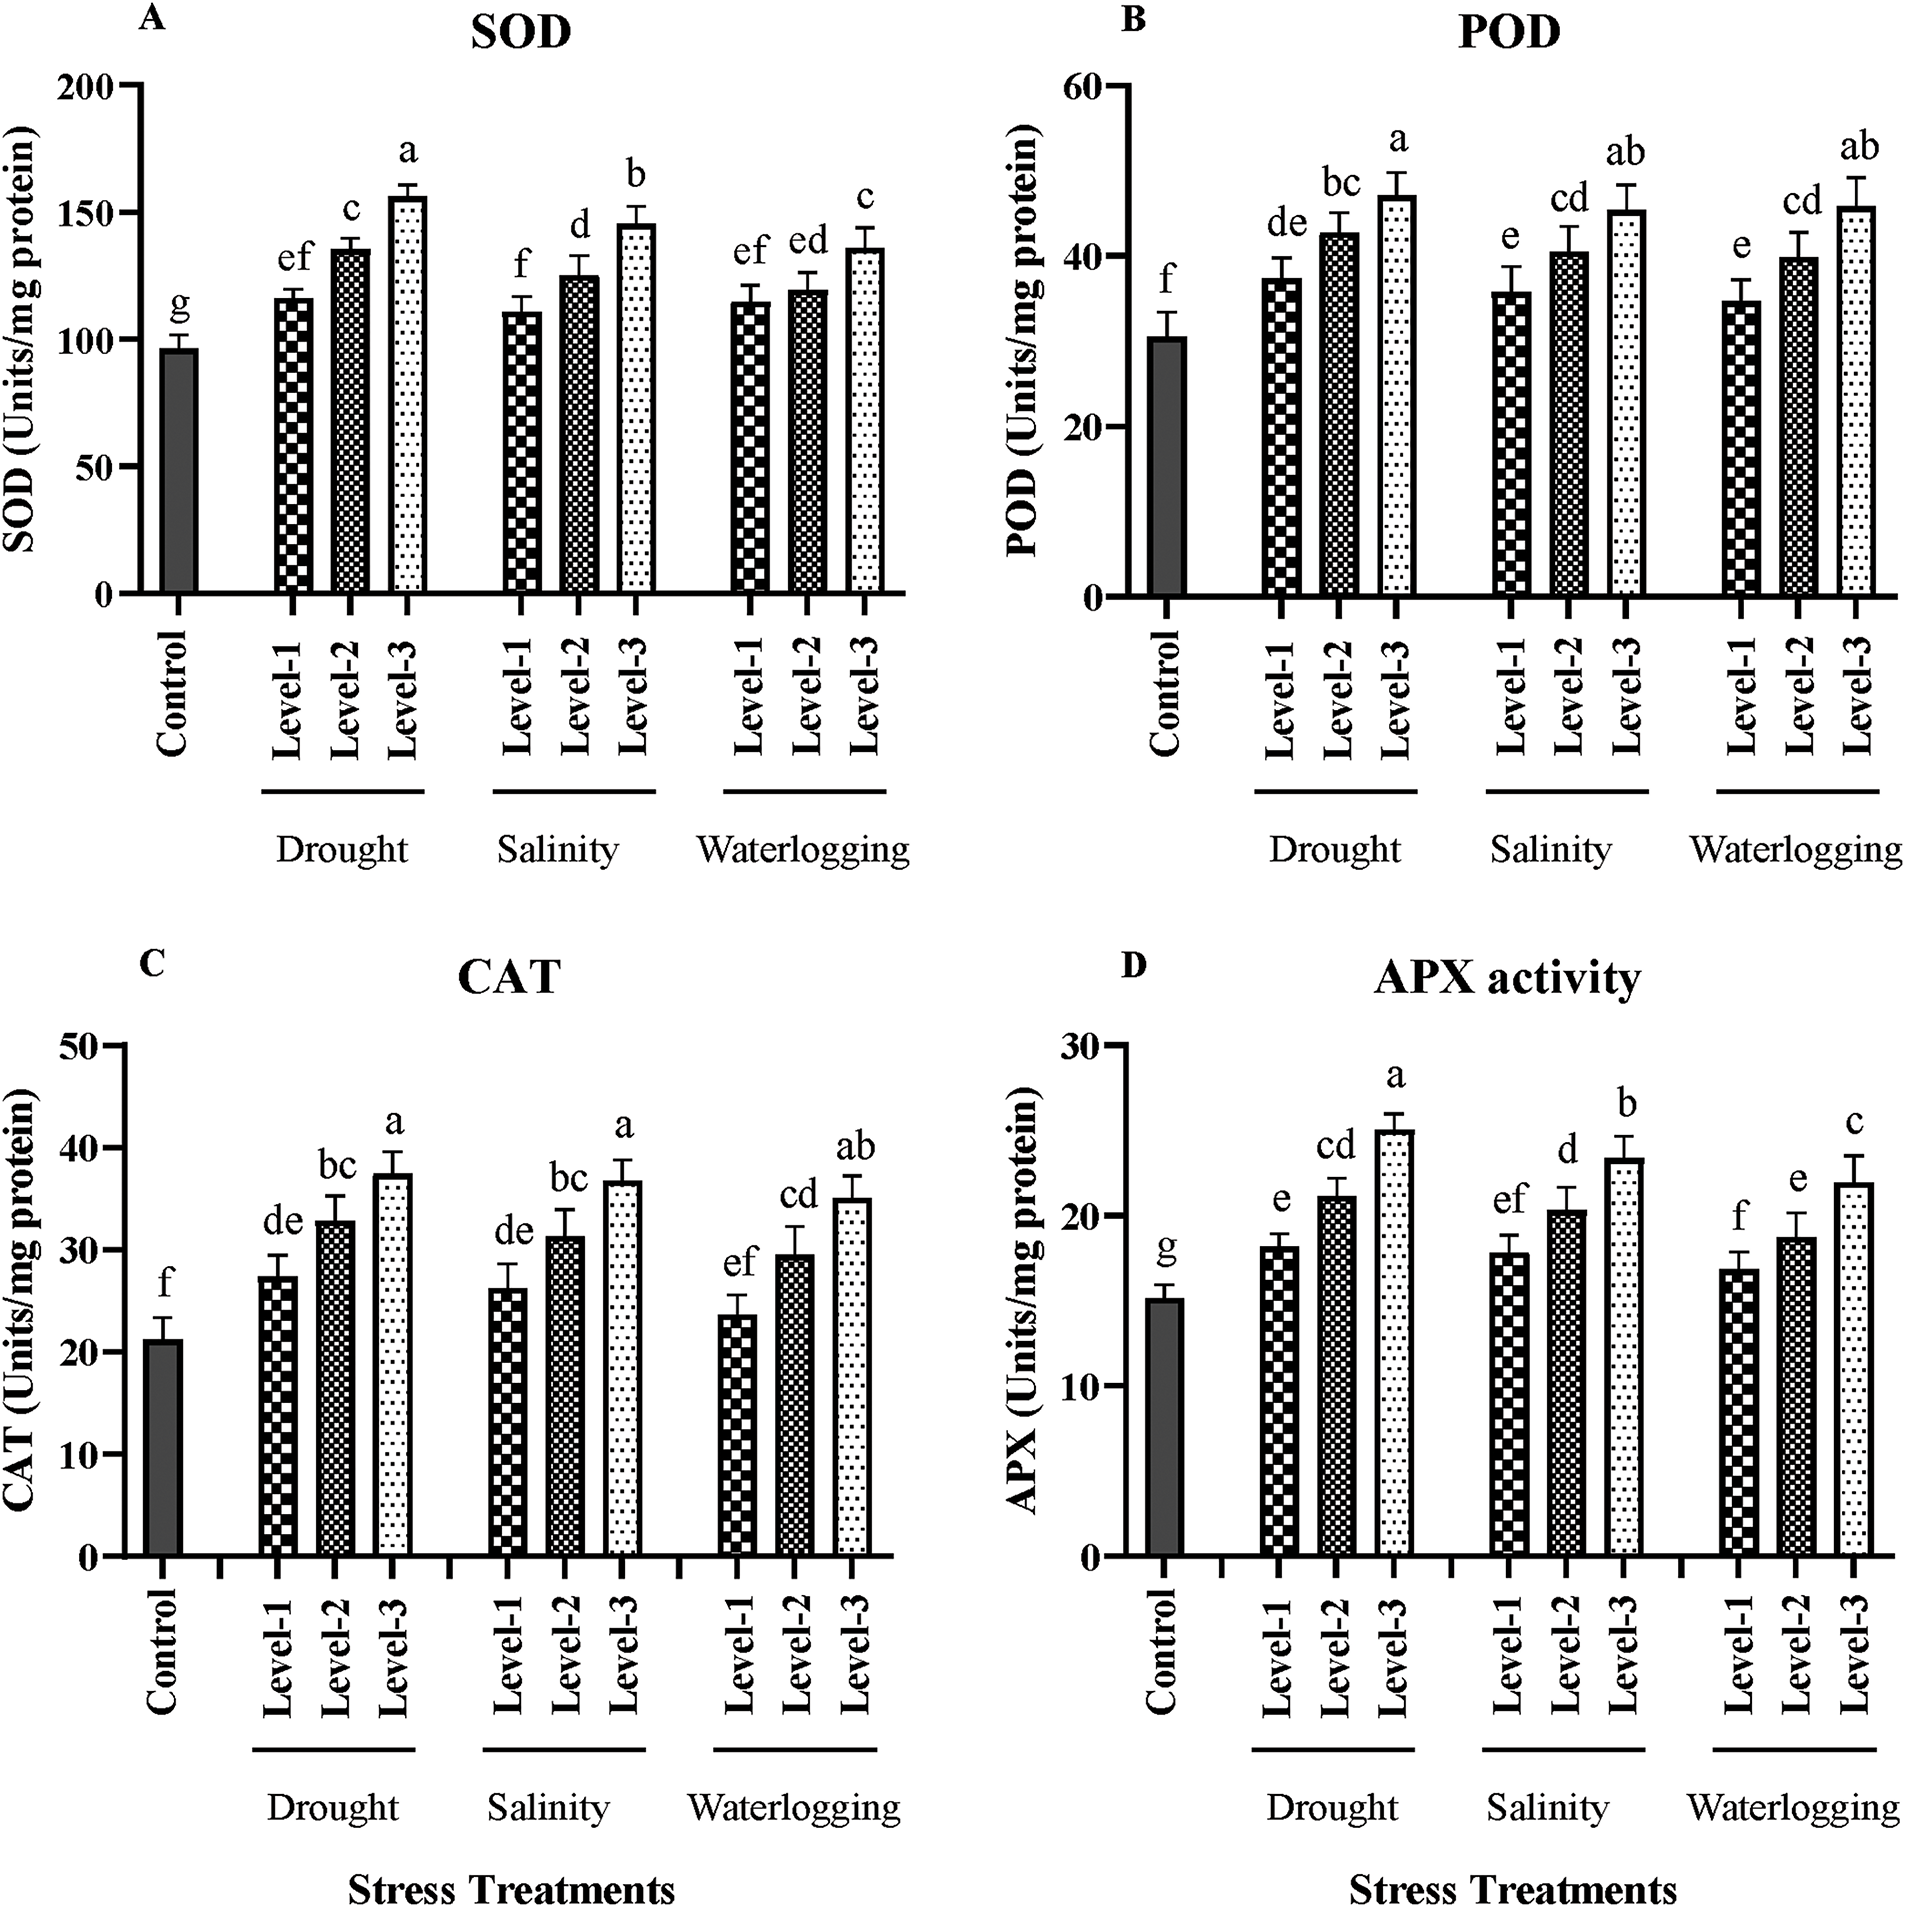
Figure 4: Effects of drought, salinity, and waterlogging stress treatments on antioxidant enzyme activities in wheat. (A) Superoxide dismutase (SOD) activity (Units/mg protein), (B) Peroxidase (POD) activity (Units/mg protein), (C) Catalase (CAT) activity (Units/mg protein), and (D) Ascorbate peroxidase (APX) activity (Units/mg protein). Stress treatments include three levels of drought (Level-1, Level-2, and Level-3), salinity (Level-1, Level-2, and Level-3), and waterlogging (Level-1, Level-2, and Level-3), with a control group for comparison. Data are presented as mean ± SE. Different letters above the bars represent statistically significant differences (p < 0.05) as determined by the Least Significant Difference (LSD) test. All mean values were recorded at the end of the stress imposition
POD activity under control conditions was 20 units/mg protein. Under drought stress, POD activity significantly increased (p < 0.01), with the highest level reaching 45 units/mg protein. POD plays a role in scavenging hydrogen peroxide, reducing oxidative damage. Salinity stress significantly increased POD activity (p < 0.05), with the highest salinity level reaching 40 units/mg protein. Waterlogging conditions also increased POD activity to 38 units/mg protein, highlighting the enzyme’s role in ROS detoxification (Fig. 4).
CAT activity was 30 units/mg protein in control plants. Drought stress significantly elevated CAT activity (p < 0.01), with the highest stress level showing 60 units/mg protein. CAT decomposes hydrogen peroxide into water and oxygen, a critical reaction in mitigating oxidative stress. Salinity stress increased CAT activity to 55 units/mg protein (p < 0.05). Waterlogging also led to a significant increase in CAT activity, reaching 50 units/mg protein (p < 0.05) (Fig. 4).
APX activity in control plants was 15 units/mg protein. Drought stress significantly increased APX activity (p < 0.01), with the highest level reaching 35 units/mg protein. APX reduces hydrogen peroxide in water using ascorbate as an electron donor. Salinity stress significantly elevated APX activity (p < 0.05), with the highest level reaching 30 units/mg protein. Waterlogging also increased APX activity to 28 units/mg protein, highlighting the enzyme’s role in maintaining cellular redox homeostasis under stress conditions (Fig. 4).
The impact of drought, salinity, and waterlogging on wheat yield and spike length was substantial, indicating the sensitivity of these parameters to abiotic stresses. The data presented significant variations in yield and spike length across different stress treatments, reflecting the physiological and biochemical disruptions caused by these stresses. The reductions in yield and spike length observed under stress conditions are primarily due to impaired plant growth and physiological processes. Stress-induced reductions in vegetative growth parameters, such as plant height, leaf area, and tiller number, limit the plant’s capacity to produce photosynthates necessary for grain development. Additionally, decreased stomatal conductance and chlorophyll content reduce the plant’s ability to photosynthesize efficiently, further limiting the energy available for reproductive processes. The resulting lower photosynthetic capacity translates into reduced grain filling, which directly affects yield and spike length. Moreover, stress-induced oxidative damage can impair the development of reproductive structures, leading to smaller spikes and fewer grains per spike.
Under control conditions, the average yield was approximately 4800 kg/ha. However, drought stress led to a significant reduction in yield, with the most severe level (Level 3) showing an average yield of only 2600 kg/ha (p < 0.01). The yield reduction observed under drought stress (46%) can be attributed to the significant declines in stomatal conductance and photosynthetic rate, which limited carbon assimilation and energy production. Salinity stress also significantly impacted yield (p < 0.05), with the highest salinity level (12 dS/m) resulting in an average yield of 2300 kg/ha. Yield reduction under salinity (54%) was primarily due to ionic toxicity and osmotic stress under saline conditions disrupting metabolic processes, leading to reduced grain filling and overall productivity. Waterlogging stress caused a similar decline in yield, with the longest exposure (72 h) resulting in an average yield of 3100 kg/ha (p < 0.05). Under waterlogging, yield reduction of up to 35% is likely due to the anaerobic conditions limiting oxygen availability to the roots, impairing their function and reducing nutrient uptake, which ultimately affects grain yield (Fig. 5; Supplementary Materials).
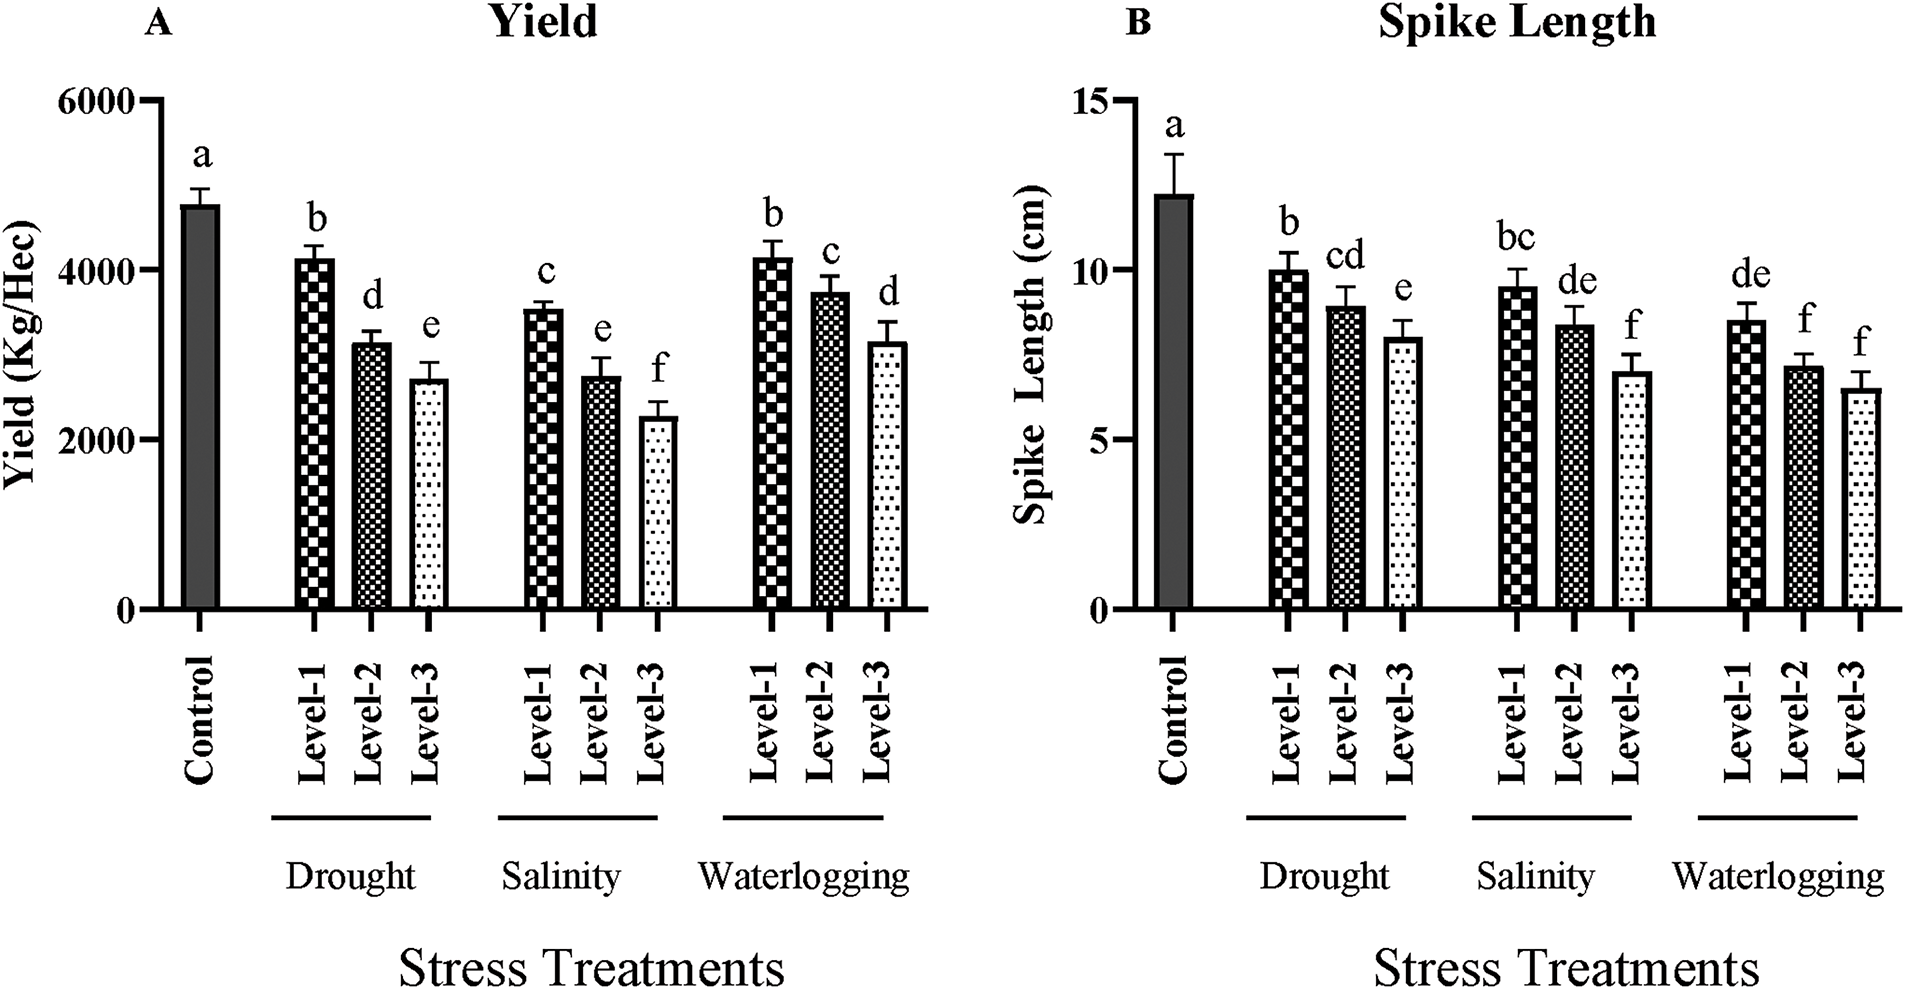
Figure 5: Effects of drought, salinity, and waterlogging stress treatments on spike length (cm) and grain yield (kg/ha) in wheat. (A) Spike length (cm) and (B) Yield (kg/ha) under three levels of drought (Level-1, Level-2, and Level-3), salinity (Level-1, Level-2, and Level-3), and waterlogging (Level-1, Level-2, and Level-3), compared with the control group. Data are presented as mean ± SE. Different letters above the bars indicate statistically significant differences (p < 0.05) as determined by the Least Significant Difference (LSD) test. All mean values were recorded at the end of the stress imposition
Spike length is a critical component of yield as it correlates with the number of grains per spike. The control group exhibited an average spike length of 12 cm. drought stress significantly reduced spike length (p < 0.01), with the most severe drought treatment showing an average spike length of 8 cm. This reduction is due to inhibited growth and development of reproductive structures under water stress. Salinity stress also significantly decreased spike length (p < 0.05), with the highest salinity treatment resulting in an average spike length of 7 cm. The negative impact of salinity on spike length is associated with reduced cell division and elongation due to ionic imbalances and osmotic stress. Waterlogging similarly affected spike length, with the longest exposure resulting in an average spike length of 6.5 cm (p < 0.05). The hypoxic conditions under waterlogging disrupt hormone balance and nutrient distribution, adversely affecting the development of reproductive structures (Fig. 5; Supplementary Materials).
The comparative analysis of the impact of drought, salinity, and waterlogging on wheat revealed significant variations across multiple vegetative, physiological, and biochemical parameters. The greater sensitivity of wheat to drought compared to salinity and waterlogging is due to distinct physiological and biochemical mechanisms. Drought directly limits water availability, impairing nutrient uptake, photosynthesis, and stomatal conductance. In contrast, salinity primarily disrupts ion balance and osmotic potential, while waterlogging affects root respiration and nutrient uptake due to oxygen deficiency. Drought’s more severe impact on water relations and overall metabolism explains its greater effect on plant growth and productivity. These stress conditions induced distinct responses, which were quantitatively and statistically significant, highlighting the differential sensitivity of wheat to various abiotic stresses.
3.5.1 Vegetative and Physiological Parameters
Among the vegetative parameters, plant height, leaf area, stem diameter, and tiller number were all significantly reduced under stress conditions compared to the control. Drought stress had the most pronounced effect, reducing plant height by 55 cm, leaf area by 15 cm2, stem diameter by 3 mm, and tiller number by 4 tillers per plant. Salinity and waterlogging also caused significant reductions but to a lesser extent compared to drought. The reduction in these parameters was statistically significant, with p-values less than 0.01 for drought and less than 0.05 for salinity and waterlogging, indicating strong evidence of the effects of these stressors.
In terms of physiological parameters, stomatal conductance, chlorophyll content, relative water content (RWC), and photosynthetic rate were all adversely affected by the stress treatments. Drought stress resulted in the most substantial decrease in stomatal conductance (by 0.40 mmol m2/s) and photosynthetic rate (by 13 μmol m2/s), reflecting severe limitations on gas exchange and photosynthesis. Salinity and waterlogging also significantly reduced these parameters, with the reductions in chlorophyll content and RWC being particularly notable under salinity. The statistical significance of these reductions was confirmed with p-values less than 0.01 for drought and less than 0.05 for salinity and waterlogging.
The analysis of biochemical parameters showed significant increases in ion leakage, MDA content, H2O2 content, and superoxide anion levels under all stress conditions, indicating elevated oxidative stress. Drought stress resulted in the highest levels of ion leakage (30%), MDA content (4.5 nmol/g FW), and H2O2 content (3.0 μmol/g FW). These increases were statistically significant (p < 0.01), suggesting that drought induces more severe membrane damage and oxidative stress than salinity or waterlogging. The activities of antioxidant enzymes (SOD, POD, CAT, APX) were also significantly elevated under stress conditions, with the highest activities observed under drought stress, indicating an upregulation of the antioxidant defense system to counteract ROS accumulation.
The yield and spike length were significantly reduced under all stress treatments, with drought causing the most significant reductions. The average yield under drought stress was 2500 kg/ha, a substantial decrease from the control yield of 6000 kg/ha. Spike length was also notably reduced under drought (by 7 cm), with similar but less pronounced reductions observed under salinity and waterlogging. These reductions were statistically significant (p < 0.01 for drought; p < 0.05 for salinity and waterlogging), highlighting the impact of these stresses on reproductive development and overall productivity.
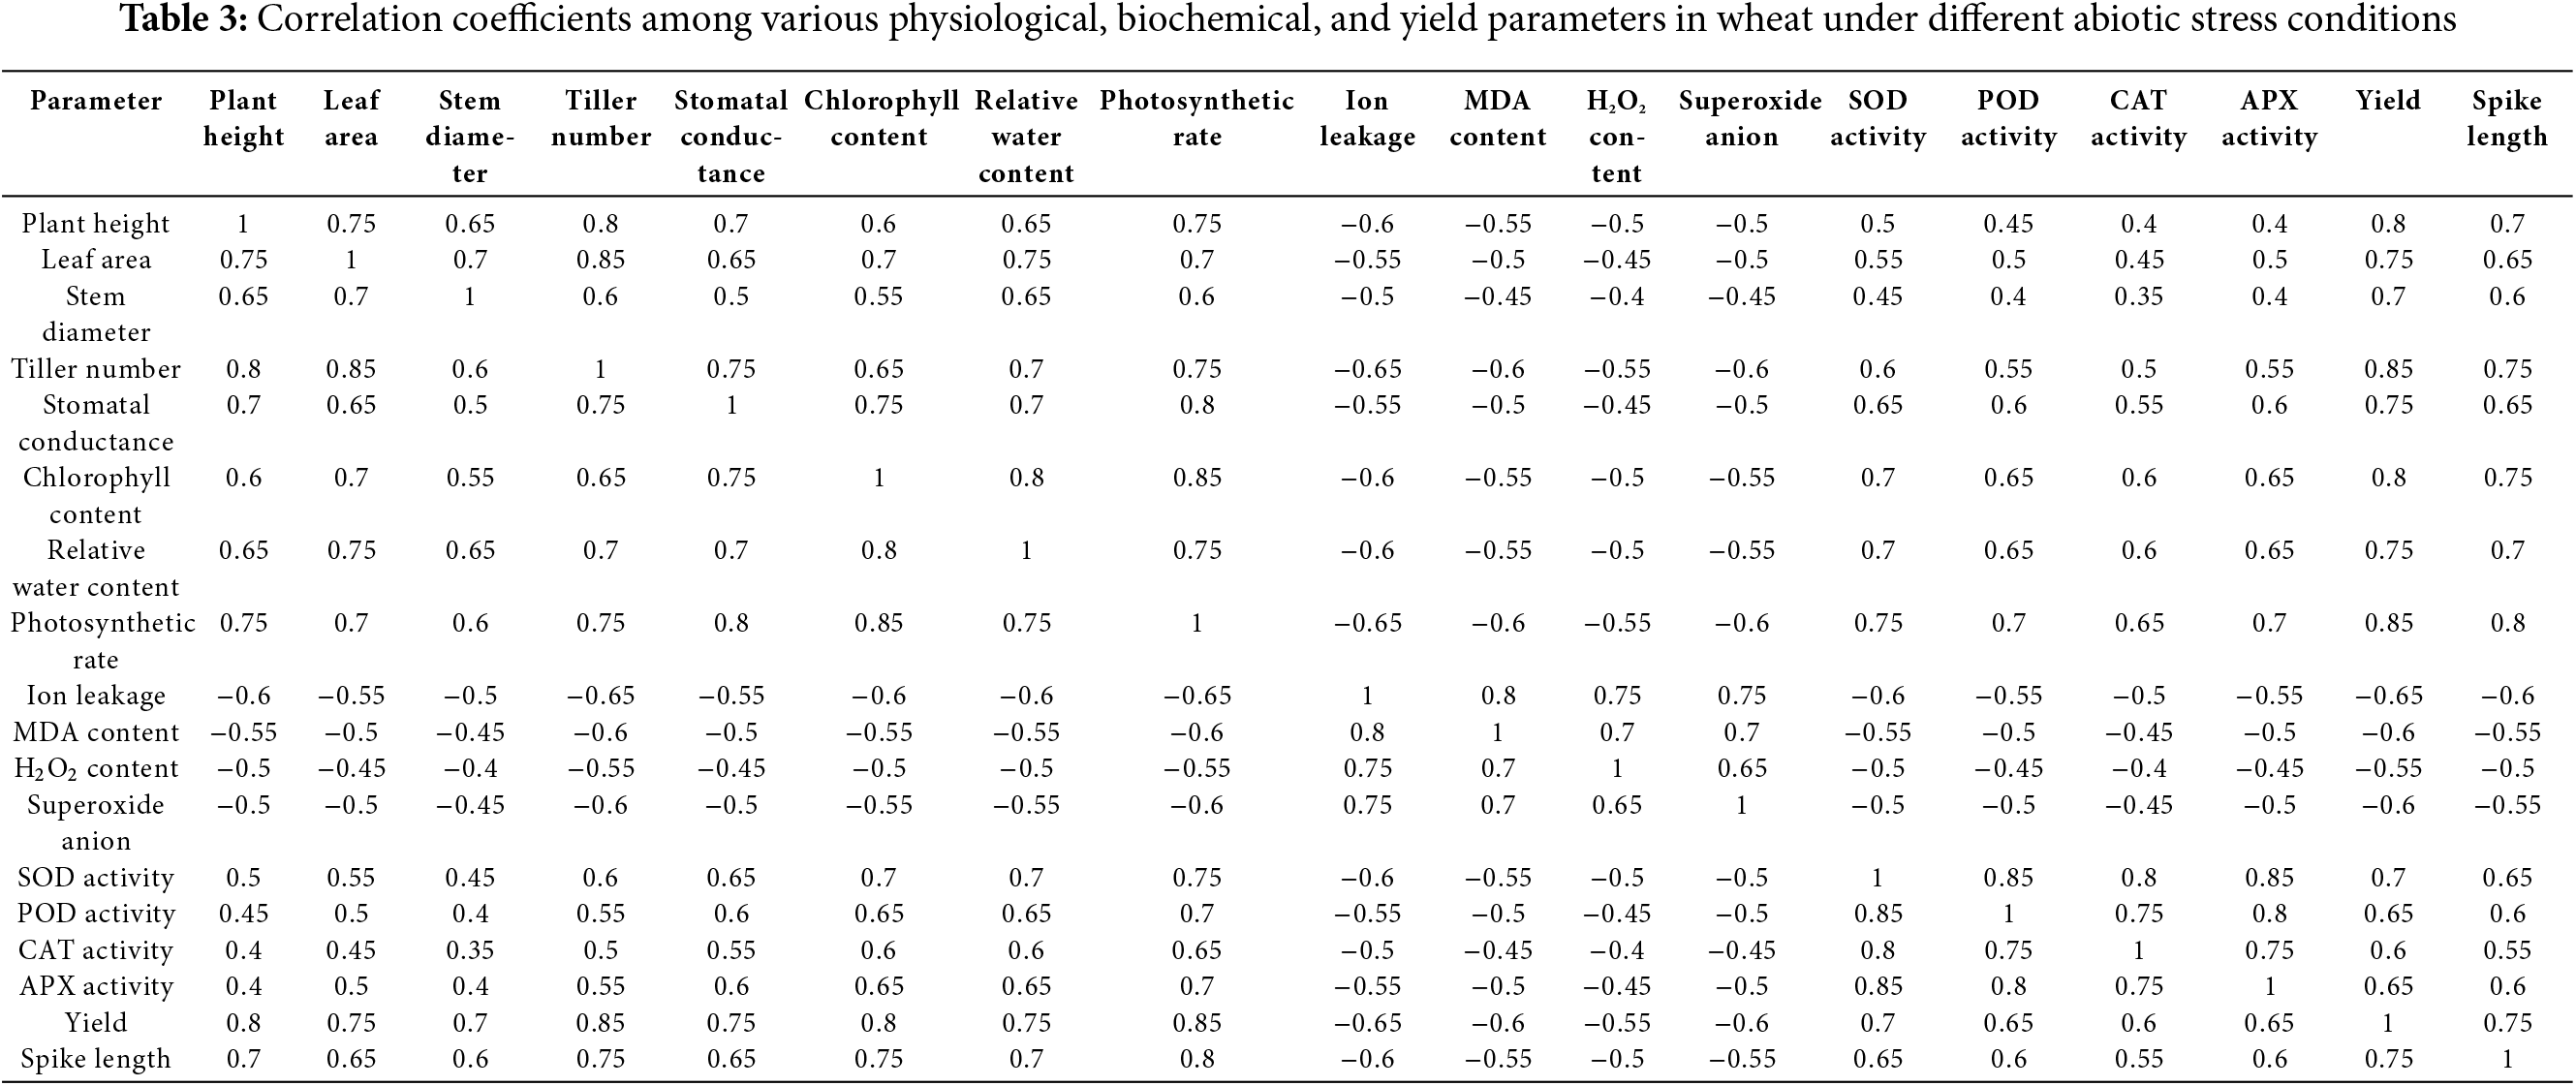
The correlation table provides insights into the relationships between various physiological, biochemical, and yield-related parameters in wheat under different abiotic stress conditions. The positive correlations observed between plant height, leaf area, and yield (r = 0.75–0.80) suggest that taller plants with larger leaf areas are more capable of producing higher yields. This relationship indicates the importance of maintaining robust vegetative growth for achieving optimal grain production under stress conditions. Similarly, strong positive correlations between photosynthetic rate, stomatal conductance, and chlorophyll content (r = 0.70–0.85) highlight the interdependence of these factors in maintaining efficient photosynthesis. Efficient stomatal conductance and higher chlorophyll content contribute to maintaining photosynthetic efficiency, even under abiotic stress. In contrast, negative correlations between ion leakage, MDA content, and yield (r = −0.60 to −0.65) reflect the detrimental effects of oxidative stress on productivity. Elevated ion leakage and MDA levels, which are markers of membrane damage, were associated with reduced yields, emphasizing the critical role of maintaining cellular stability to mitigate stress impacts. High levels of reactive oxygen species (ROS), indicated by elevated superoxide anion and H2O2 content, are associated with reduced yield and spike length, further emphasizing the importance of antioxidant defenses like SOD and CAT activities in mitigating stress impacts. These correlations underline the complexity of stress responses in wheat and the need for integrated strategies to enhance stress tolerance and maintain crop yields under adverse conditions (Table 3).
The findings of this study elucidate the differential responses of wheat to drought, salinity, and waterlogging, providing valuable insights into the physiological, biochemical, and yield-related impacts of these abiotic stresses. Drought leads to reduced water availability, affecting photosynthesis and nutrient uptake. Salinity disrupts osmotic balance and ion transport, while waterlogging induces hypoxia, limiting root respiration and nutrient absorption. These stress responses are interlinked and collectively contribute to the observed reductions in growth and yield. The significant reduction in plant height, leaf area, stem diameter, and tiller number under drought conditions is consistent with the well-documented effects of water deficit on plant growth and development. Drought stress inhibits cell expansion and division by reducing turgor pressure and disrupting water and nutrient uptake [38]. Similar findings have been reported by Chaves et al. [39], who observed that water scarcity severely limits vegetative growth by affecting photosynthetic capacity and carbon assimilation. Recent studies have shown that wheat responses to abiotic stresses vary considerably depending on environmental factors, genotype, and stress intensity. Our findings on drought-induced reductions in stomatal conductance and chlorophyll content are consistent with studies by Chaves et al. [40] and Munns [41], who reported significant reductions in photosynthesis and growth under water-limited conditions. These studies also found that drought stress reduces grain yield primarily through impaired photosynthetic capacity and water use efficiency, similar to our observations.
The impact of salinity stress on wheat was also profound, as indicated by the significant decreases in chlorophyll content and increases in ion leakage. Salinity stress induces osmotic and ionic stresses, leading to nutrient imbalance, chlorophyll degradation, and reduced photosynthetic efficiency [42]. The results align with the work of Ahmad et al. [43], who noted that high salinity levels disrupt cellular homeostasis, leading to oxidative stress and cellular damage. The pronounced yield reduction (46%) under drought stress highlights the sensitivity of wheat to water scarcity, which disrupts physiological processes, including photosynthesis and water-use efficiency. Similarly, the 54% reduction under salinity stress aligns with findings of ion accumulation and osmotic imbalances reducing plant vigor and grain development. The relatively lower yield loss under waterlogging (35%) reflects the plant’s partial ability to tolerate short-term hypoxia, though prolonged waterlogging ultimately disrupted root function and grain filling. The reduction in yield and spike length under salinity stress reflects the inhibition of reproductive processes, which is corroborated by Negrão et al. [44], who highlighted the sensitivity of reproductive structures to ionic toxicity. Regarding salinity, Zhang et al. [45] and Munns et al. [46] highlighted that salinity impairs wheat growth through osmotic stress and ion toxicity, which is in line with our findings of reduced plant height and chlorophyll content under saline conditions. However, while we observed a reduction in yield at 12 dS/m, similar to findings by Ahmed et al. [47], other studies, such as those by Devkota et al. [48], reported that certain wheat varieties can withstand higher salinity levels, potentially due to more efficient ion exclusion or osmotic adjustment mechanisms.
Waterlogging stress also significantly affected wheat growth and development, particularly by reducing oxygen availability in the root zone. The hypoxic conditions resulting from prolonged waterlogging impair root respiration, nutrient uptake, and hormonal balance, which are crucial for plant growth [49]. This is consistent with the findings of Voesenek et al. [50], who emphasized the negative impact of waterlogging on root function and the overall health of plants. The elevated levels of malondialdehyde (MDA) and hydrogen peroxide (H2O2) under all stress conditions indicate enhanced lipid peroxidation and oxidative damage, which is a common response to abiotic stresses [51]. The increased activities of antioxidant enzymes (SOD, POD, CAT, APX) suggest an upregulation of the antioxidant defense system to mitigate the effects of reactive oxygen species (ROS). Similar observations were made by Apel et al [52], who discussed the critical role of antioxidants in protecting plants from oxidative stress. Waterlogging has been less extensively studied in wheat, but our results align with the findings of Ploschuk et al. [53] and Pais et al. [54], who found that waterlogging significantly impairs wheat root function and nutrient uptake, leading to reduced grain filling and yield. In particular, we observed a strong correlation between waterlogging and reduced spike length and yield, which corroborates findings by Arduini et al. [55], who observed similar reductions in wheat under flooded conditions.
The correlation analysis revealed strong positive correlations between photosynthetic rate, chlorophyll content, and yield, highlighting the importance of maintaining photosynthetic efficiency for optimal yield under stress conditions. Conversely, the negative correlations between ion leakage, MDA content, and yield underscore the detrimental effects of membrane damage and oxidative stress on productivity. These findings are in line with the study by [56], which emphasized the importance of ROS management in sustaining photosynthesis and plant growth under stress.
The practical implications of these findings are significant for wheat cultivation, especially in regions vulnerable to abiotic stresses. The observed reductions in yield and spike length under drought, salinity, and waterlogging stress highlight the need for developing wheat varieties with enhanced tolerance to these conditions. Breeding programs should prioritize traits such as improved root architecture, which can enhance water and nutrient uptake, particularly under drought and waterlogged conditions. This approach is supported by Wasson et al. [57], who demonstrated that deeper root systems contribute to drought tolerance by accessing water from deeper soil layers.
In addition to root traits, the enhancement of antioxidant enzyme activities is crucial for improving stress tolerance. The upregulation of enzymes like SOD, POD, CAT, and APX observed in this study indicates that these components of the antioxidant defense system play a vital role in mitigating oxidative damage. Therefore, incorporating genetic traits that enhance the antioxidant capacity of wheat could be a key strategy for improving resilience to abiotic stresses [58]. Moreover, the development of salt-tolerant varieties that can maintain ion homeostasis and reduce the toxic effects of Na+ and Cl− accumulation is essential. The use of molecular markers and gene-editing technologies, such as CRISPR/Cas9, can facilitate the introduction of these traits into commercial wheat varieties [59].
Agronomic practices also play a crucial role in managing abiotic stress. Proper irrigation management is essential for mitigating the effects of drought and salinity. Techniques such as drip irrigation and the use of mulches can help conserve soil moisture and reduce salinity levels by minimizing water evaporation and salt accumulation [60]. Additionally, soil management practices, such as the use of gypsum and organic amendments, can improve soil structure and drainage, thereby reducing the negative impact of waterlogging [42]. Crop rotation and the use of salt-tolerant cover crops can also enhance soil health and reduce the buildup of salinity in the soil profile.
Furthermore, precision agriculture technologies, such as remote sensing and geographic information systems (GIS), can be utilized for early detection and monitoring of stress symptoms, enabling timely intervention and management. For instance, monitoring chlorophyll content and canopy temperature can provide early indicators of water stress, allowing for the adjustment of irrigation schedules [61]. Overall, the integration of advanced breeding techniques, agronomic practices, and precision agriculture can significantly enhance the resilience of wheat cultivation systems to abiotic stresses. CIMMYT’s development of drought-tolerant wheat varieties has led to successful adoption in water-scarce regions, and the University of Sydney’s research on salt-tolerant wheat has improved yields in saline-prone areas. Additionally, agronomic practices such as drip irrigation and mulching have been implemented in regions like India to mitigate the effects of water stress and waterlogging, respectively. These case studies underscore the effectiveness of combining breeding and agronomic strategies to improve stress tolerance in wheat.
While this study provides valuable insights into the effects of drought, salinity, and waterlogging on wheat, several limitations need to be acknowledged. One of the primary limitations is the controlled environment in which the experiments were conducted. While controlled conditions allow for the precise measurement of responses to specific stressors, they do not fully replicate the complexity of field conditions, where multiple stresses can occur simultaneously. Future research should include field trials across diverse agroecological zones to validate the findings and assess the real-world performance of stress-tolerant wheat varieties [62]. This approach will help identify the interactions between different stressors and environmental factors, providing a more comprehensive understanding of plant responses.
Another limitation is the focus on a limited number of physiological and biochemical parameters. While the study provides a detailed analysis of key parameters, it does not encompass all the aspects of plant responses to abiotic stresses. Future studies should explore additional factors, such as hormonal regulation, root-soil interactions, and the role of secondary metabolites in stress tolerance. The integration of omics technologies, such as genomics, transcriptomics, and metabolomics, can provide a more holistic view of the molecular and metabolic pathways involved in stress responses [63]. For instance, transcriptomic analysis can identify differentially expressed genes under stress conditions, revealing key regulators and pathways that can be targeted for genetic improvement.
Moreover, this study did not explore the genetic diversity present in wheat germplasm for stress tolerance. The inclusion of diverse genetic resources in future studies can help identify novel alleles and genes associated with stress tolerance. The use of advanced genetic tools, such as genome-wide association studies (GWAS) and quantitative trait locus (QTL) mapping, can facilitate the identification of genetic loci linked to desirable traits [64]. Additionally, research should focus on the development and evaluation of biotechnological approaches, such as the use of transgenic plants and CRISPR/Cas9 gene editing, to enhance the stress tolerance of wheat. Although the controlled environment allows precise control over the experimental conditions, it does not fully capture the complexity of real-world field conditions. Factors such as soil variation, unpredictable weather events, and pest and disease outbreaks, which were not considered in this study, could significantly influence the plant’s response to stress. Future research should incorporate field experiments to assess the broader applicability of these results and explore the combined effects of abiotic and biotic stresses on wheat productivity.
The study did not address the potential trade-offs associated with enhancing stress tolerance, such as possible reductions in yield or quality under optimal conditions. Future research should investigate these trade-offs and explore strategies to balance stress tolerance with high productivity. The development of wheat varieties that can maintain stable yields under both stress and non-stress conditions is crucial for sustainable agriculture and food security.
This study provides a comprehensive analysis of the effects of drought, salinity, and waterlogging on wheat growth, physiology, and yield. Among the three abiotic stresses, drought had the most severe impact, causing a 50% yield reduction, followed by salinity (40%) and waterlogging (30%). These stresses significantly reduced vegetative parameters such as plant height, leaf area, stem diameter, and tiller number, as well as physiological traits like stomatal conductance, chlorophyll content, and photosynthetic rate. Biochemical analysis revealed elevated oxidative stress markers, including malondialdehyde (MDA) and hydrogen peroxide (H₂O₂), accompanied by increased activities of antioxidant enzymes such as superoxide dismutase (SOD) and catalase (CAT), indicating the plants’ defense response to mitigate stress-induced damage. The study underscores the need for developing stress-tolerant wheat varieties through advanced breeding and biotechnological approaches that enhance traits such as efficient antioxidant systems, osmotic regulation, and robust root structures. Agronomic practices like improved irrigation management and soil amendments, combined with precision agriculture tools for early stress detection, can further mitigate these stresses. By integrating these approaches, sustainable wheat production can be achieved, ensuring food security in regions vulnerable to climate change and environmental challenges.
Acknowledgement: The authors would like to extend their sincere appreciation to the Mona Reclamation Experimental Project WAPDA, Pakistan, Institute of Biological Sciences, Khwaja Fareed University of Engineering and Information Technology for providing the research materials and technical skills. The authors would also like to extend their sincere appreciation to the Researchers Supporting Project Number (RSP2024R410), King Saud University, Riyadh, Saudi Arabia.
Funding Statement: This work was supported by grants from the Mona Reclamation Experimental Project WAPDA, Pakistan. Researchers Supporting Project Number (RSP2024R410), King Saud University, Riyadh, Saudi Arabia.
Author Contributions: The authors confirm their contribution to the paper as follows: study conception and design: Mudasser Mehmood, Zoahaib Aslam Khan; data collection: Mudasser Mehmood, Adil Mehmood, Madiha Zaynab; analysis and interpretation of results: Mudasser Mehmood, Zoahaib Aslam Khan, Ling Shing Wong, Muhammad Atiq ur Rahman, M. Harshini; draft manuscript preparation: Zoahaib Aslam Khan, Muhammad Atiq ur Rahman, Ling Shing Wong, Mohammad Khalid Al-Sadoon. All authors reviewed the results and approved the final version of the manuscript.
Availability of Data and Materials: The data that support the findings of this study are available from the corresponding author, MM, upon reasonable request.
Ethics Approval: Not applicable.
Conflicts of Interest: The authors declare no conflicts of interest to report regarding the present study.
Supplementary Materials: The supplementary material is available online at https://www.techscience.com/doi/10.32604/phyton.2025.059812/s1.
References
1. Ghosh PK, Das A, Saxena R, Banerjee K, Kar G, Vijay D, editors. Trajectory of 75 years of Indian agriculture after independence. Berlin, Germany: Springer Nature; 2023 Aug 28. p. 137–62. [Google Scholar]
2. Faris JD. Wheat domestication: key to agricultural revolutions past and future. In: Tuberosa R, Graner A, Frison E, editors. Genomics of plant genetic resources. Vol. 1. Dordrecht: Springer Netherlands; 2014. p. 439–64. [Google Scholar]
3. Shiferaw B, Smale M, Braun H-J, Duveiller E, Reynolds M, Muricho G. Crops that feed the world 10. Past successes and future challenges to the role played by wheat in global food security. Food Secur. 2013;5(3):291–317. doi:10.1007/s12571-013-0263-y. [Google Scholar] [CrossRef]
4. Stabnikova O, Shevchenko A, Stabnikov V, Paredes-López O. Utilization of plant processing wastes for enrichment of bakery and confectionery products. Ukr Food J. 2023;12(2):299–309. doi:10.24263/2304-974X-2023-12-2-11. [Google Scholar] [CrossRef]
5. Mohanty SK, Swain MR. Chapter 3—bioethanol production from corn and wheat: food, fuel, and future. In: Ray RC, Ramachandran S, editors. Bioethanol production from food crops. Academic Press; 2019. p. 45–59. [Google Scholar]
6. Food and Agriculture Organization of the United Nations (FAO) [Internet]. FAO. 2022 [cited 2024 Oct 2]. Available from: https://www.fao.org/faostat/en/#data/QCL/visualize. [Google Scholar]
7. Ahmad M, Farooq U. The state of food security in Pakistan: future challenges and coping strategies. Pak Dev Rev. 2010;49(4):903–23. [Google Scholar]
8. Muhammad M, Waheed A, Wahab A, Majeed M, Nazim M, Liu Y-H, et al. Soil salinity and drought tolerance: an evaluation of plant growth, productivity, microbial diversity, and amelioration strategies. Plant Stress. 2024;11(10):100319. doi:10.1016/j.stress.2023.100319. [Google Scholar] [CrossRef]
9. Li M, Gao Z, Jiang L, Chen L, Ma J. Involvement of the ABA- and H2O2-mediated ascorbate-glutathione cycle in the drought stress responses of wheat roots. Phyton-Int J Exp Bot. 2024;93(2):329–42. doi:10.32604/phyton.2024.046976. [Google Scholar] [CrossRef]
10. Adnan M, Khan A, Mohammad F, Ali F, Hussain Q. Impact of late sowing on morphological and yield traits in 40s bread wheat. J Soil, Plant Environ. 2022;1(1):1–18. [Google Scholar]
11. Dhillon GS, Gretzinger M, Baarda L, Lange R, Singh Gill K, Yaremko V, et al. Effects of simulated hail damage and foliar-applied recovery treatments on growth and grain yield of wheat, field pea, and dry bean crops. Can J Plant Sci. 2021;101(5):758–69. [Google Scholar]
12. Seleiman MF, Aslam MT, Alhammad BA, Hassan MU, Maqbool R, Chattha MU, et al. Salinity stress in wheat: effects, mechanisms and management strategies. Phyton-Int J Exp Bot. 2022;91(4):667–94. doi:10.32604/phyton.2022.017365. [Google Scholar] [CrossRef]
13. Awasthi AK, Pandey AK, Khan J. Municipal solid waste leachate impact on metabolic activity of wheat (Triticum aestivum L.) seedlings. Environ Sci Pollut Res. 2017;24:17250–4. [Google Scholar]
14. Seleiman M, Ibrahim M, Darwish I, Hardan A. Effect of mineral and organic fertilizers on yield and quality of some Egyptian and Omani wheat cultivars. Menoufia J Plant Product. 2021;6(6):351–72. doi:10.21608/mjppf.2021.182263. [Google Scholar] [CrossRef]
15. Rashid A. Modeling climate suitability for wheat (Triticum aestivum L.) distribution in Pakistan by Maximum Entropy (Maxent) approach [Doctoral dissertation]. Lahore, Pakistan: Lahore School of Economics; 2023. [Google Scholar]
16. Verma N, Sao P, Srivastava A, Singh S. Physiological and molecular responses to drought, submergence and excessive watering in plants. In: Husen A, editor. Harsh environment and plant resilience: molecular and functional aspects. Cham: Springer International Publishing; 2021. p. 305–21. [Google Scholar]
17. Oyiga BC, Palczak J, Wojciechowski T, Lynch JP, Naz AA, Léon J, et al. Genetic components of root architecture and anatomy adjustments to water-deficit stress in spring barley. Plant, Cell Environ. 2020;43(3):692–711. doi:10.1111/pce.13683. [Google Scholar] [PubMed] [CrossRef]
18. Farooq S, Shahid M, Khan M, Hussain M, Farooq M. Improving the productivity of bread wheat by good management practices under terminal drought. J Agron Crop Sci. 2015;201(3):173–88. doi:10.1111/jac.12093. [Google Scholar] [CrossRef]
19. Miller O, Helman D, Svoray T, Morin E, Bonfil DJ. Explicit wheat production model adjusted for semi-arid environments. Field Crops Res. 2019;231:93–104. doi:10.1016/j.fcr.2018.11.011. [Google Scholar] [CrossRef]
20. Leng G, Hall J. Crop yield sensitivity of global major agricultural countries to droughts and the projected changes in the future. Sci Total Environ. 2019;654(1):811–21. doi:10.1016/j.scitotenv.2018.10.434. [Google Scholar] [PubMed] [CrossRef]
21. Ding Y-G, Zhang X-B, Quan M, Li F-J, Tao R-R, Min Z, et al. Tiller fertility is critical for improving grain yield, photosynthesis, and nitrogen efficiency in wheat. J Integr Agric. 2023;22(7):2054–66. [Google Scholar]
22. El Sabagh A, Islam MS, Skalicky M, Ali Raza M, Singh K, Anwar Hossain M, et al. Salinity stress in wheat (Triticum aestivum L.) in the changing climate: adaptation and management strategies. Front Agron. 2021;3:661932. [Google Scholar]
23. Seleiman MF, Kheir AM. Saline soil properties, quality and productivity of wheat grown with bagasse ash and thiourea in different climatic zones. Chemosphere. 2018;193:538–46. [Google Scholar] [PubMed]
24. Zhang Z, Liu L, Li H, Zhang S, Fu X, Zhai X, et al. Exogenous melatonin promotes the salt tolerance by removing active oxygen and maintaining ion balance in wheat (Triticum aestivum L.). Front Plant Sci. 2022;12:787062. [Google Scholar] [PubMed]
25. Hossain MA, Uddin SN. Mechanisms of waterlogging tolerance in wheat: morphological and metabolic adaptations under hypoxia or anoxia. Aust J Crop Sci. 2011;5(9):1094–101. [Google Scholar]
26. Pais IP, Moreira R, Coelho AR, Semedo JN, Reboredo FH, Coutinho J, et al. Unveiling the impact of growth traits on the yield of bread wheat germplasm subjected to waterlogging. Agriculture. 2024;14(2):241. doi:10.3390/agriculture14020241. [Google Scholar] [CrossRef]
27. Araki H, Hossain MA, Takahashi T. Waterlogging and hypoxia have permanent effects on wheat root growth and respiration. J Agron Crop Sci. 2012;198(4):264–75. doi:10.1111/j.1439-037X.2012.00510.x. [Google Scholar] [CrossRef]
28. Herzog M, Striker GG, Colmer TD, Pedersen O. Mechanisms of waterlogging tolerance in wheat—a review of root and shoot physiology. Plant Cell Environ. 2016;39(5):1068–86. doi:10.1111/pce.12676. [Google Scholar] [PubMed] [CrossRef]
29. Kaur M, Singh R, Kumar S, Mandhan RP, Sharma I. Identification of QTL conferring Karnal bunt resistance in bread wheat. Indian J Biotechnol. 2016;15(1):34–8. [Google Scholar]
30. Li C, Jiang D, Wollenweber B, Li Y, Dai T, Cao W. Waterlogging pretreatment during vegetative growth improves tolerance to waterlogging after anthesis in wheat. Plant Sci. 2011;180(5):672–8. doi:10.1016/j.plantsci.2011.01.009. [Google Scholar] [PubMed] [CrossRef]
31. Mullan DJ, Barrett-Lennard EG. Breeding crops for tolerance to salinity, waterlogging and inundation. Climate change and crop production. Wallingford, UK: Climate change and crop production: CABI; 2010. p. 92–114. [Google Scholar]
32. Faran M, Farooq M, Rehman A, Nawaz A, Saleem MK, Ali N, et al. High intrinsic seed Zn concentration improves abiotic stress tolerance in wheat. Plant Soil. 2019;437(1–2):195–213. doi:10.1007/s11104-019-03977-3. [Google Scholar] [CrossRef]
33. Heath RL, Packer L. Photoperoxidation in isolated chloroplasts. I. Kinetics and stoichiometry of fatty acid peroxidation. Arch Biochem Biophys. 1968;125(1):189–98. doi:10.1016/0003-9861(68)90654-1. [Google Scholar] [PubMed] [CrossRef]
34. Perez FJ, Rubio S. An improved chemiluminescence method for hydrogen peroxide determination in plant tissues. Plant Growth Regul. 2006;48(1):89–95. doi:10.1007/s10725-005-5089-y. [Google Scholar] [CrossRef]
35. Beauchamp C, Fridovich I. Superoxide dismutase: improved assays and an assay applicable to acrylamide gels. Anal Biochem. 1971;44(1):276–87. doi:10.1016/0003-2697(71)90370-8. [Google Scholar] [PubMed] [CrossRef]
36. Kar M, Mishra D. Catalase, peroxidase, and polyphenoloxidase activities during rice leaf senescence 1. Plant Physiol. 1976;57(2):315–9. doi:10.1104/pp.57.2.315. [Google Scholar] [PubMed] [CrossRef]
37. Aebi H. [13] Catalase in vitro. In: Methods in enzymology. Vol. 105. Cambridge, MA, USA: Academic Press; 1984. p. 121–6. [Google Scholar]
38. Liang G, Liu J, Zhang J, Guo J. Effects of drought stress on photosynthetic and physiological parameters of tomato. J Am Soc Hort Sci. 2020;145(1):12–7. doi:10.21273/JASHS04725-19. [Google Scholar] [CrossRef]
39. Chaves M, Flexas J, Pinheiro C. Photosynthesis under drought and salt stress: regulation mechanisms from whole plant to cell. Ann Bot. 2009;103(4):551–60. doi:10.1093/aob/mcn125. [Google Scholar] [PubMed] [CrossRef]
40. Chaves MM, Costa JM, Saibo NJM. Recent advances in photosynthesis under drought and salinity. Adv Bot Res. 2011;57(12):49–104. doi:10.1016/B978-0-12-387692-8.00003-5. [Google Scholar] [CrossRef]
41. Munns R. Plant adaptations to salt and water stress: differences and commonalities. Adv Bot Res. 2011;57(2):1–32. doi:10.1016/B978-0-12-387692-8.00001-1. [Google Scholar] [CrossRef]
42. Munns R, Gilliham M. Salinity tolerance of crops-what is the cost? New Phytol. 2015;208(3):668–73. doi:10.1111/nph.13519. [Google Scholar] [PubMed] [CrossRef]
43. Ahmad P, Abdel Latef AA, Hashem A, Abd_Allah EF, Gucel S, Tran L-SP. Nitric oxide mitigates salt stress by regulating levels of osmolytes and antioxidant enzymes in chickpea. Front Plant Sci. 2016;7(868):347. doi:10.3389/fpls.2016.00347. [Google Scholar] [PubMed] [CrossRef]
44. Negrão S, Schmöckel S, Tester M. Evaluating physiological responses of plants to salinity stress. Ann Bot. 2017;119(1):1–11. [Google Scholar]
45. Zhang Z, Xia Z, Zhou C, Wang G, Meng X, Yin P. Insights into salinity tolerance in wheat. Genes. 2024;15:573. doi:10.3390/genes15050573. [Google Scholar] [PubMed] [CrossRef]
46. Munns R, Tester M. Mechanisms of salinity tolerance. Annu Rev Plant Biol. 2008;59(1):651–81. [Google Scholar] [PubMed]
47. Ahmed HGM-D, Zeng Y, Raza H, Muhammad D, Iqbal M, Uzair M, et al. Characterization of wheat (Triticum aestivum L.) accessions using morpho-physiological traits under varying levels of salinity stress at seedling stage. Front Plant Sci. 2022;13:953670. doi:10.3389/fpls.2022.953670. [Google Scholar] [PubMed] [CrossRef]
48. Devkota KP, Devkota M, Rezaei M, Oosterbaan R. Managing salinity for sustainable agricultural production in salt-affected soils of irrigated drylands. Agric Syst. 2022;198:103390. [Google Scholar]
49. Ashraf MA. Waterlogging stress in plants: a review. Afr J Agric Res. 2012;7(13):1976–81. [Google Scholar]
50. Voesenek LA, Bailey-Serres J. Flood adaptive traits and processes: an overview. New Phytol. 2015;206(1):57–73. doi:10.1111/nph.13209. [Google Scholar] [PubMed] [CrossRef]
51. Peck S, Mittler R. Plant signaling in biotic and abiotic stress. UK: Oxford University Press; 2020. p. 1649–51. [Google Scholar]
52. Apel K, Hirt H. Reactive oxygen species: metabolism, oxidative stress, and signal transduction. Annu Rev Plant Biol. 2004;55(1):373–99. doi:10.1146/annurev.arplant.55.031903.141701. [Google Scholar] [PubMed] [CrossRef]
53. Ploschuk RA, Miralles DJ, Colmer TD, Striker GG. Waterlogging differentially affects yield and its components in wheat, barley, rapeseed and field pea depending on the timing of occurrence. J Agron Crop Sci. 2020;206(3):363–75. doi:10.1111/jac.12396. [Google Scholar] [CrossRef]
54. Pais IP, Moreira R, Semedo JN, Ramalho JC, Lidon FC, Coutinho J, et al. Wheat crop under waterlogging: potential soil and plant effects. Plants. 2022;12(1):149. doi:10.3390/plants12010149. [Google Scholar] [PubMed] [CrossRef]
55. Arduini I, Orlandi C, Pampana S, Masoni A. Waterlogging at tillering affects spike and spikelet formation in wheat. Crop Pasture Sci. 2016;67(7):703–11. doi:10.1071/CP15417. [Google Scholar] [CrossRef]
56. Foyer CH, Rasool B, Davey JW, Hancock RD. Cross-tolerance to biotic and abiotic stresses in plants: a focus on resistance to aphid infestation. J Exp Bot. 2016;67(7):2025–37. doi:10.1093/jxb/erw079. [Google Scholar] [PubMed] [CrossRef]
57. Wasson AP, Chiu GS, Zwart AB, Binns TR. Differentiating wheat genotypes by Bayesian hierarchical nonlinear mixed modeling of wheat root density. Front Plant Sci. 2017;8:282. doi:10.3389/fpls.2017.00282. [Google Scholar] [PubMed] [CrossRef]
58. Gill SS, Tuteja N. Reactive oxygen species and antioxidant machinery in abiotic stress tolerance in crop plants. Plant Physiol Biochem. 2010;48(12):909–30. doi:10.1016/j.plaphy.2010.08.016. [Google Scholar] [PubMed] [CrossRef]
59. Zhang Y, Lv Y, Jahan N, Chen G, Ren D, Guo L. Sensing of abiotic stress and ionic stress responses in plants. Int J Mol Sci. 2018;19(11):3298. doi:10.3390/ijms19113298. [Google Scholar] [PubMed] [CrossRef]
60. Chahal GK, Ghai M, Kaur J. Stress mechanisms and adaptations in plants. J Pharmacogn Phytochem. 2022;11(2):109–14. doi:10.22271/phyto.2022.v11.i2b.14365. [Google Scholar] [CrossRef]
61. Cavatte PC, Martins SC, Morais LE, Silva PE, DaMatta FM. The physiology of abiotic stresses. In: Plant breeding for abiotic stress tolerance. Berlin/Heidelberg, Germany: Springer-Verlag. 2012. p. 21–51. [Google Scholar]
62. Xiong H, Guo H, Xie Y, Zhao L, Gu J, Zhao S, et al. Enhancement of dwarf wheat germplasm with high-yield potential derived from induced mutagenesis. Plant Genet Resour. 2018;16(1):74–81. doi:10.1017/S1479262116000459. [Google Scholar] [CrossRef]
63. Umezawa T, Hirayama T, Kuromori T, Shinozaki K. The regulatory networks of plant responses to abscisic acid. Adv Bot Res. 2011;57:201–48. [Google Scholar]
64. Collins NC, Tardieu F, Tuberosa R. Quantitative trait loci and crop performance under abiotic stress: where do we stand? Plant Physiol. 2008;147(2):469–86. doi:10.1104/pp.108.118117. [Google Scholar] [PubMed] [CrossRef]
Cite This Article
 Copyright © 2025 The Author(s). Published by Tech Science Press.
This work is licensed under a Creative Commons Attribution 4.0 International License , which permits unrestricted use, distribution, and reproduction in any medium, provided the original work is properly cited.
 Downloads
 Citation Tools