
 Submit a Paper
 Propose a Special lssue
 Open Access
ARTICLE

Reprogramming the Metabolome of Centella asiatica (L.) Urban Callus: Profiling of Newly Synthesized Cryptic Anthocyanins Triggered by LED Light Exposure
Research Centre for Plant Metabolomics, Department of Biochemistry, University of Johannesburg, Auckland Park, P.O. Box 524, Johannesburg, 2006, South Africa
* Corresponding Author: Ian A. Dubery. Email:
(This article belongs to the Special Issue: Advances in Molecular Insights of Plant Secondary Metabolites: Biosynthesis, Regulation, and Applications)
Phyton-International Journal of Experimental Botany 2025, 94(4), 1269-1286. https://doi.org/10.32604/phyton.2025.062392
Received 17 December 2024; Accepted 07 March 2025; Issue published 30 April 2025
 View Full Text
 Download PDF
Abstract
Centella asiatica L., a medicinal herb, has attracted substantial interest in research as well as commercial domains due to its bioactive compounds which include the pentacyclic triterpenoid centellosides, and in addition, hydroxy. In addition, hydroxycinnamic acid conjugates as well as flavonoids. The latter is the major class of secondary plant metabolites and comprises various subclasses, including anthocyanidins. Anthocyanins are rarely reported in extracts from C. asiatica and differ structurally due to a flavylium (2-phenylchromenylium) ion that carries a positive charge at the oxygen atom of the C-ring of the basic flavonoid structure. Callus of C. asiatica was initiated and propagated on synthetic media and subjected to different light regimes. White callus resulted from white fluorescent illumination, while purple callus developed in response to white light emitting diode (LED) illumination. To profile the metabolites responsible for the intense purple coloration, methanolic extracts were prepared from the two cell lines. Total phenolic, flavonoid, and anthocyanin content were determined and indicated (i) very low levels of flavonoids and anthocyanins in white callus and (ii) that anthocyanins dominate the flavonoid content of the purple callus. Extracts were subjected to untargeted ultra-high-performance liquid chromatography coupled to high-definition mass spectrometry (UHPLC–MS) to profile newly synthesized anthocyanins. Metabolite annotation was based on accurate mass determination and characteristic fragmentation patterns. Here, the reprogramming of the metabolome of white C. asiatica callus due to LED illumination is reported and the profiles of cryptic anthocyanins as well as putative flavonoid and caffeoylquinic acid co-pigments in purple callus are described.Keywords
Abbreviations
| UHPLC-MS | Ultra high-performance liquid chromatography-mass spectrometry |
| LED | Light emitting diode |
Centella asiatica (L.) Urban is a herbaceous, perennial plant in the flowering plant family Apiaceae. It is native to tropical regions of Asia, Australia, and islands in the western Pacific Ocean, as well as Africa [1]. The plant is an important source of bio-active pentacyclic triterpenoids. These triterpenoids (centellosides) exhibit a range of biological and pharmacological activities that include antitumor effects, skin protective effects, cardiovascular and pulmonary protective effects, and nootropic and neuroprotective effects [2].
The enhancement of the synthesis of the triterpenoid centellosides by exploitation of the associated metabolic pathways is receiving much consideration [3]. However, the production of specialized secondary metabolites from plants can be limited by seasonal, environmental, and climatic conditions as well as by the time required for growth and the increase of metabolites to the desired level [4]. To overcome such constraints, the production of secondary metabolites using cell—or root culture systems has been extensively studied [5,6] to overproduce the centellosides of C. asiatica through in vitro culture [7,8]. However, plants exhibit high metabolic network complexity with metabolic pathways that are part of extensive networks and, are frequently, subject to negative feedback control that limits the desired outcome [8,9].
Light-emitting diodes (LEDs) are increasingly being used in plant tissue culture environments. While the use of fluorescent white lights or grow lights in in vitro plant growth facilities provides the benefit of uniform light intensity, new LED luminaires have additional advantages that allow the application of certain specific wavelengths to the plants being cultured, depending on the species or physiological process of interest [10].
Previous phytochemical analyses revealed that, in addition to the mentioned pentacyclic triterpenoid centelloids, C. asiatica also synthesizes hydroxycinnamic acids and—conjugates as well as flavonoids [5,8]. The latter is the major class of secondary plant metabolites and comprises subclasses such as flavanones, flavonols, flavones and isoflavones, flavonols, and anthocyanidins [9,11]. Anthocyanins have a wide occurrence in food and non-food plants [11,12] and possess significant medicinal potential and beneficial effects on human health [12]. However, they are rarely reported in extracts from C. asiatica (e.g., [13,14]). Anthocyanins differ structurally from the other flavonoids due to a flavylium (2-phenylchromenylium) ion that carries a positive charge at the oxygen atom of the C-ring of the basic flavonoid structure. There are six naturally occurring common anthocyanidins: malvidin, petunidin, delphinidin, peonidin, cyanidin, and pelargonidin. The aglycone core structure may be bound to various 3- and 5-linked glycosides and additional substitution with aromatic or aliphatic moieties may produce a wide array of anthocyanins [11,15].
In this study, we report on the metabolic adaptation or reprogramming of the metabolome of white C. asiatica callus due to LED illumination. The objective was to profile the newly synthesized (cryptic) anthocyanins and putative flavonoid and caffeoylquinic acid co-pigments in purple callus.
Commercially cultivated C. asiatica was obtained from a local nursery (Gauteng province, South Africa). A voucher specimen (J. James 1-JRAU) was deposited in the herbarium of the Botany Department, University of Johannesburg, South Africa.
2.2 Callus Initiation and Growth Conditions
Callus from the ends of 15–20 mm stem segments of C. asiatica plants was initiated on Murashige and Skoog (MS) medium solidified with phytoagar with Murashige and Skoog (MS) vitamins and hormones (Ducheva, Haarlem, Netherlands). The vitamins and organics were: 50 mg nicotinic acid, 50 mg thiamine HCl, 10 mg pyridoxine HCl, 10 mg myo-inositol, 0.1 g casein hydrolysate and 3 g sucrose per 100 mL. The phytohormones were 2 μM dichloro-phenoxyacetic acid (2,4-D) and 0.5 μM 6-benylaminopurine (BAP). To obtain callus proliferation, 1 g of callus was dissected from the ends of the stem segments and aseptically transferred to Petri-dishes with the medium as described above for further cultivation. The cultures were kept in an incubator cabinet with white fluorescent lights (~20 μmol/m2/s) with an 18/6 h light/dark cycle and regulated temperature at 23°C. Callus was sub-cultured every two weeks and eventually achieved a pure white appearance. Callus was also transferred to a plant growth room with cool white LED illumination above cultivation shelves (~60 μmol/m2/s). Compared to white fluorescent light, the cool white LED light is enriched with blue light around 460 nm. Under the LED conditions, the edges of the calli turned a light red color. Further selection under the LED lights of calli displaying the red color eventually resulted in calli with a uniform, purple appearance (Fig. 1). No difference in growth rates was observed and all calli were sub-cultured on fresh media at two-week intervals.
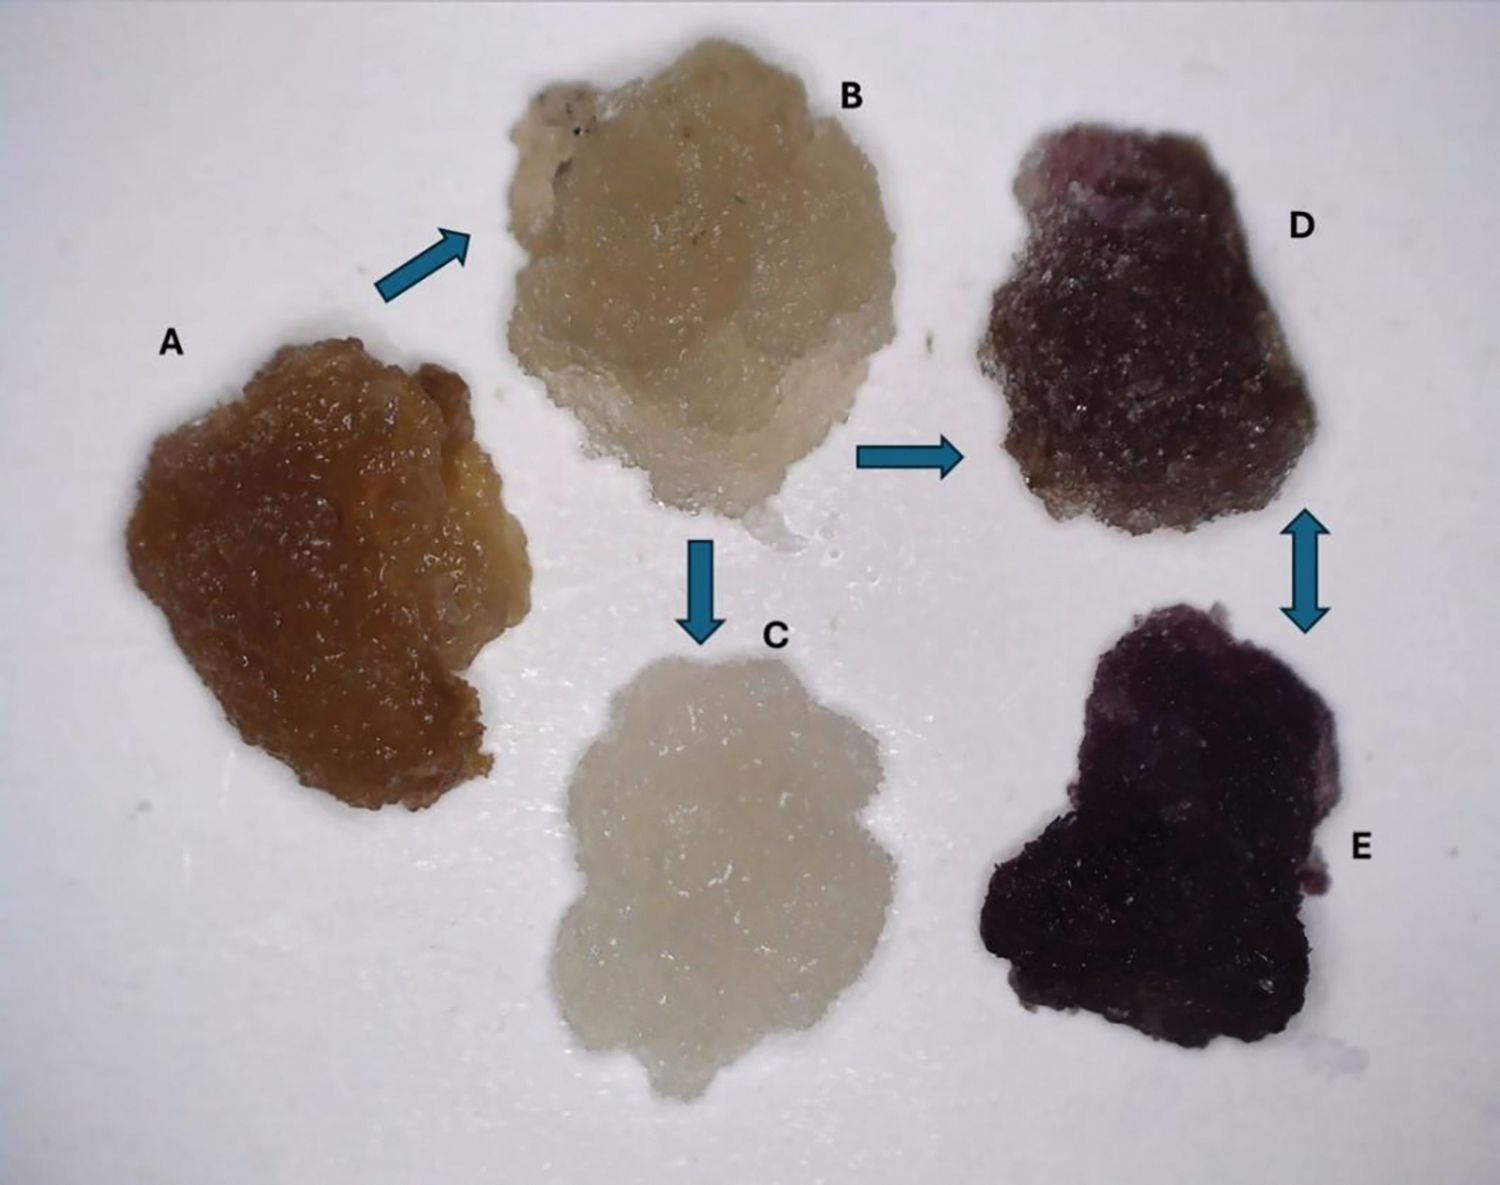
Figure 1: Cultivation of Centella asiatica callus. (A): Initial brown callus derived from stem sections. (B,C): Adaptation of the callus to the tissue culture environment under white fluorescent light, (B–D): Transition of callus under white fluorescent light to white LED light, (E): Callus with a uniform, purple appearance
2.3 Extraction and Sample Preparation
Unless otherwise specified, all chemicals used in the research were obtained from Merck-Sigma-Aldrich (Modderfontein, South Africa) and all solvents were analytical grade and obtained from SpS, Romil (Cambridge, UK). For phytochemical screening, metabolites were extracted based on the metabolites of interest and as described in each section. Irrespective of the purpose of the extraction, a 1:2 (w/v) ratio was used, either with analytical grade methanol or ethanol as stipulated. White and purple calli were used, two weeks following the sub-culture. 1.5 g of the calli were taken and extracted into 3.0 mL (1:2 m/v) analytical grade solvent. The tissue was homogenized using an Ultra-turra type shaft homogenizer (CAT, Berlin, Germany) for 2 min, followed by sonication in an ultrasonic bath for 15 min. The homogenates were centrifuged at 13,000× g and the supernatants were transferred to 2 mL microcentrifuge tubes. Extractions were repeatedly performed as described above over one year with consistent results.
2.4 Total Phenolic Content Using the Folin-Ciocalteu Method
The total phenolic content (TPC) of methanolic extracts of C. asiatica calli was determined following the Folin-Ciocalteu (F-C) method [16]. This standard colorimetric method relies on the ability of phenolic compounds to reduce the F-C reagent, forming a blue complex measurable spectrophotometrically [17]. Briefly, in 2 mL Eppendorf tubes, 100 μL of each extract (prepared in 100% methanol, MeOH), blanks (100% MeOH), and different concentrations of the standard gallic acid, a trihydroxybenzoic acid, were added. This was followed by the addition of 200 μL of 10% (v/v) F-C reagent, then a vigorous vortex of each tube. 800 μL of 0.7 M sodium carbonate (Na2CO3) was added to the mixture before 2 h incubation at room temperature. Following the incubation, 200 μL of each test sample, standard and blank was transferred in four replicates to a 96-well microplate to determine the absorbance at 765 nm using a UV-VIS microplate reader spectrophotometer (Synergy HT, BioTek, Agilent, Santa Clara, CA, USA). Gallic acid (GA), dissolved in methanol was used as positive control. The concentrations used to plot the calibration curve varied between 25 μg/mL and 300 μg/mL. The TPC content in the extracts was expressed as μg of GA equivalents (GAE)/g wet weight. The concentration in each sample was calculated following the equation: C = (C1 × V)/m; where C represents the TPC in μg/g (expressed as GAE), C1 is the concentration of GA from the calibration curve in μg/mL, V is the volume of the extract in mL, and m is the weight of the plant tissue in grams. The results were statistically expressed as mean ± standard deviation (SD) and a Student t-test was performed (p < 0.005 indicating statistical significance).
The quantification of the total flavonoid content (TFC) was performed using the aluminium chloride (AlCl3) colorimetric method adapted for the microplate spectrophotometer. The assay is based on the binding affinity of the oxo and hydroxyl group of flavonoids with metal ions such as Al3+, forming a yellow complex [18,19]. The total flavonoid content was extrapolated from the calibration curve constructed with quercetin as reference flavonoid standard. The concentration of quercetin used varied between 25 and 250 μg/mL dissolved in methanol. Briefly, in a 96-well microplate, 50 μL of sample extract or standard solution was added to the well in 4 replicates. The blank contained 100% methanol only. This was followed by the addition of 100 μL of 50% methanol. A volume of 20 μL 10% AlCl3 was finally added and the plate gently shaken. After 3 min incubation at room temperature, and the absorbance was read at 430 nm. The results were statistically expressed as μg of quercetin equivalents (QE)/g wet weight, (mean ± SD) and a Student t-test was performed (p < 0.0001 indicating statistical significance).
Anthocyanins were extracted from 3 g of C. asiatica callus, with 3 mL acidified ethanol (with 0.1% HCl). For determination of the total anthocyanin content (TAC) the pH-differential method [20]. This method relies on the principle that structures of anthocyanin pigments can reversibly change with pH variation and this is observable by prominent differences in the absorbance spectra. At pH 1.0, the colored oxonium form is more dominant, while the colorless hemiketal form prevails at pH 4.5. Cyanidin 3-glucoside (CG) was used to optimize the methods. The buffers consisted of 0.025 M of potassium chloride (KCl), pH 1.0 and 0.4 M sodium acetate, pH 4.5. The dilution factor was determined using the KCl buffer pH 1.0 and ensuring that the absorbance of the callus extract at the maximum wavelength was below 1.2. After reaching the right dilutions, samples were left to equilibrate for 15 min. The baseline was corrected with distilled water and the absorbance spectra were recorded in each buffer. Absorbance reading of the purple callus was made against the blank at the wavelength 530 and 700 nm. The TAC was evaluated as CG equivalents (CGE), [21]. The calculation was done using the following formula: TAC (mg/L) = [(A × MW × DF × 1000)/ε × l], where A is the absorbance difference = (Amax − A700 nm)pH1.0 − (Amax − A700 nm)pH4.5; MW is the molecular weight of CG (449.2 g/mol); DF is the dilution factor; ε the molar extinction coefficient for CG (26,900 L/mol/cm) and l the path length (1 cm) [20,22]. The determined values were converted to mg CGE/g wet weight.
2.7 Antioxidant Activity—DPPH and ABTS Assays
The antioxidant potential of the methanolic extracts from white and purple callus were investigated using two different antioxidant assays since antioxidant mechanisms could include different reactions with radical species [23,24]. For these assays, ascorbic acid (as an antioxidant) was used as the positive control at concentrations ranging from 8.8 to 176.1 μg/mL depending on the assay. For the 2,2-diphenyl-1-picrylhydrazyl (DPPH), a 0.15 mM solution was prepared in 80% methanol. In 96-well microtitre plates, 50 μL of C. asiatica methanolic callus extracts, at varying concentrations (DF 1:1) were added to 200 μL DPPH solution, mixed, and stored in the dark at room temperature (30°C) for 30 min. Ascorbic acid in methanol served as the reference standard, while the methanolic DPPH solution was used as the control. The experiment was routinely performed in triplicate. The absorbance was measured with a UV-Vis plate reader at 517 nm to evaluate radical scavenging activity, with the percentage inhibition calculated using the equation: DPPH radical scavenging activity (%) = [(Acontrol − Asample)/Acontrol] × 100.
For the 2,2′-azino-bis(3ethylbenzothiazoline-6-sulfonic acid), ABTS assay, the radical cation form (ABTS•+) was generated by the combination of equal volumes of 2.6 mM potassium persulfate to ABTS solution (7.4 mM), maintained at room temperature in the dark for 14 h. After incubation, the resulting blue-green working solution was diluted with methanol until the absorbance reading at 734 nm decreased to 0.871 ± 0.01. In the 96 well microplate, 200 μL of ABTS•+ solution was added, followed by different concentrations of vitamin C, used as standard, serial diluted concentrations of the callus extracts and the blank (methanol). The antioxidant activity was calculated as: ABTS•+ scavenging activity (%) = [(Acontrol − Asample)/Acontrol] × 100. The concentration of the extract neutralizing 50% of DPPH and the ABTS•+ was calculated by using the equation generated by the curves. This was done for samples generating a scavenging activity above 50% at their highest concentrations. A two-way analysis of variation (ANOVA) with replication was performed for statistical analysis (Excel, Microsoft 365).
2.8 Comparative UHPLC-MS Analyses
For UHPLC-MS analysis, extracted samples were concentrated to half of the original volumes at 50°C in a dry bath in a fume hood and centrifuged again at 13, 000× g for 10 min before transfer to chromatography vials, capped, and stored for analysis. Samples were analyzed using a Waters Acquity Premier UPLC system (Waters Corporation, Milford, MA, USA) and separation was obtained with a Waters HSS T3 C18 UPLC column (150 mm × 2.1 mm, 1.8 μm). A solvent mixture was used consisting of ultra-pure water (solvent A) and UPLC-grade acetonitrile (solvent B). Both solvents contained 10 mM formic acid. The initial conditions were 95% A for 1 min, followed by a gradient to 1% A at 16 min. These chromatographic conditions were maintained for 1 min whereafter the initial conditions were re-instated. The flow rate was kept constant at 0.4 mL/min and the column temperature was maintained at 60°C. The runtime was 20 min with injection volumes varying between 1 and 5 μL. The Waters Sample Manager temperature was maintained at 6°C.
For high-definition quadrupole time-of-flight mass spectrometry (HD-qTOF) MS analysis, a Waters Synapt XS system, equipped with a 4 kDalton (Da) quadrupole, was used in sensitivity mode. Accurate mass measurements were obtained using leucine encephalin ([M − H]− = 554.2615 and [M + H]+ = 556.2766) as the ‘lockmass’ reference mass calibrant at a fixed concentration of 200 pg/mL and a constant flow rate of 5 μL/min. This reference allowed the processing software to perform automatic correction of slight centroid mass deviations observed in the samples, ensuring precise and accurate mass (≤1 mDa) measurements. The instrument was used in sensitivity mode with an electrospray ionization (ESI) interface. Analysis was done in positive and negative ionization modes using a capillary voltage of 0.6 kV, a sample cone voltage of 30 V, and a source offset of 4 V. Data was collected from 100 to 1500 Da at a scan speed of 0.1 s. The source temperature was set at 120°C and a desolvation temperature of 450°C was used for all the analysis. High-purity nitrogen gas was used as the nebulization gas at a flow rate of 700 L/h and the cone gas flow rate was 50 L/h. MassLynxTM software, V4.2 SCN1028 (Waters Corporation, Milford, MA, USA) was used to control the instrumentation and to collect and process all the data. Cyanidin 3-glucoside (CG) was again used for method optimization.
Two data channels were collected, the first produced largely unfragmented data while the second channel was MSE data rendering fragmentation data of the detected compounds. Base peak intensity (BPI) MS chromatograms were generated and annotated with the m/z values of the most intense peaks at a specific chromatographic retention time (Rt).
2.9 Structural Elucidation/Metabolite Annotation
The purple and white callus extracts were analyzed on the same untargeted method to produce base peak intensity (BPI) chromatograms. These were compared to reveal new or altered compounds in the purple sample. Clear differences were observed and the m/z ions that contributed most to the differences were further investigated. The unfragmented data was used to obtain the observed mass, ring double bond equivalence (RDBE) count, and predicted empirical formula of each compound. The fragmented data channel produced product ion mass spectra that were searched against the NIST (National Institute of Standards and Technology, USA; https://chemdata.nist.gov/ (accessed on 6 March 2025)) 2014 mass spectral database, as well as own libraries created by the analysis of reference standards. Tandem mass spectrometric (MS/MS) analysis was also done on compounds that did not display significant fragmentation during the MSE analysis, or that co-eluted with other compounds. Proposed structures/compounds were evaluated with MassFragment software (Waters Corporation, Milford, MA, USA) to determine the feasibility that the fragmentation mass spectrum that could be obtained from the suggested structure/compound (https://www.waters.com > waters > library (accessed on 6 March 2025); [25]). In addition, caffeoylquinic acids (CQAs) were annotated through the use of the in-source collision-induced dissociation method and hierarchical fragmentation patterns as previously outlined [26,27] as well as elution order of authentic standards on reverse phase chromatography [13]. Metabolites were annotated/putatively identified to level 2 of the Metabolomics Standards Initiative (MSI) [28].
The initiation and cultivation of C. asiatica callus is summarised in Fig. 1. Callus tissue that formed at the ends of stem sterilized segments on MS agar medium supplemented with 2 μM dichloro-phenoxyacetic acid (2,4-D) and 0.5 μM 6-benylaminopurine (BAP) (auxin to cytokinin ration of 4:1) were dissected and placed on fresh medium with the same chemical composition. Initially, the callus was brown, possibly due to stress-related oxidation of phenolics. Over several months, the callus adapted to the artificial medium as explained below. Transfer of the white callus under white fluorescent light to a growth chamber with white LED light triggered the synthesis of red/purple compounds during the acclimation response. This triggered research questions about the nature and composition of the metabolites responsible for the purple coloration of C. asiatica callus.
3.1 Quantitative Data of Phenolics, Flavonoids, Anthocyanins and Antioxidant Activity in White vs. Purple Callus
Total phenolic and flavonoid contents (TPC and TFC) are good indicators in phytochemical screening. These are secondary metabolites ubiquitous in plants and structurally characterized by the presence of an aromatic group with at least one hydroxyl group. Here the TPC in the purple callus (600.8 ± 0.05 μg GAE/g wet weight) was almost 10 times higher than that in white callus (61.3 μg ± 0.009 GAE/g), Fig. 2A. The content of phenolic compounds was also reported in dried leaves and roots of C. asiatica accessions [29] with expectedly higher concentrations (70–110 mg/g dry sample) than those found here.
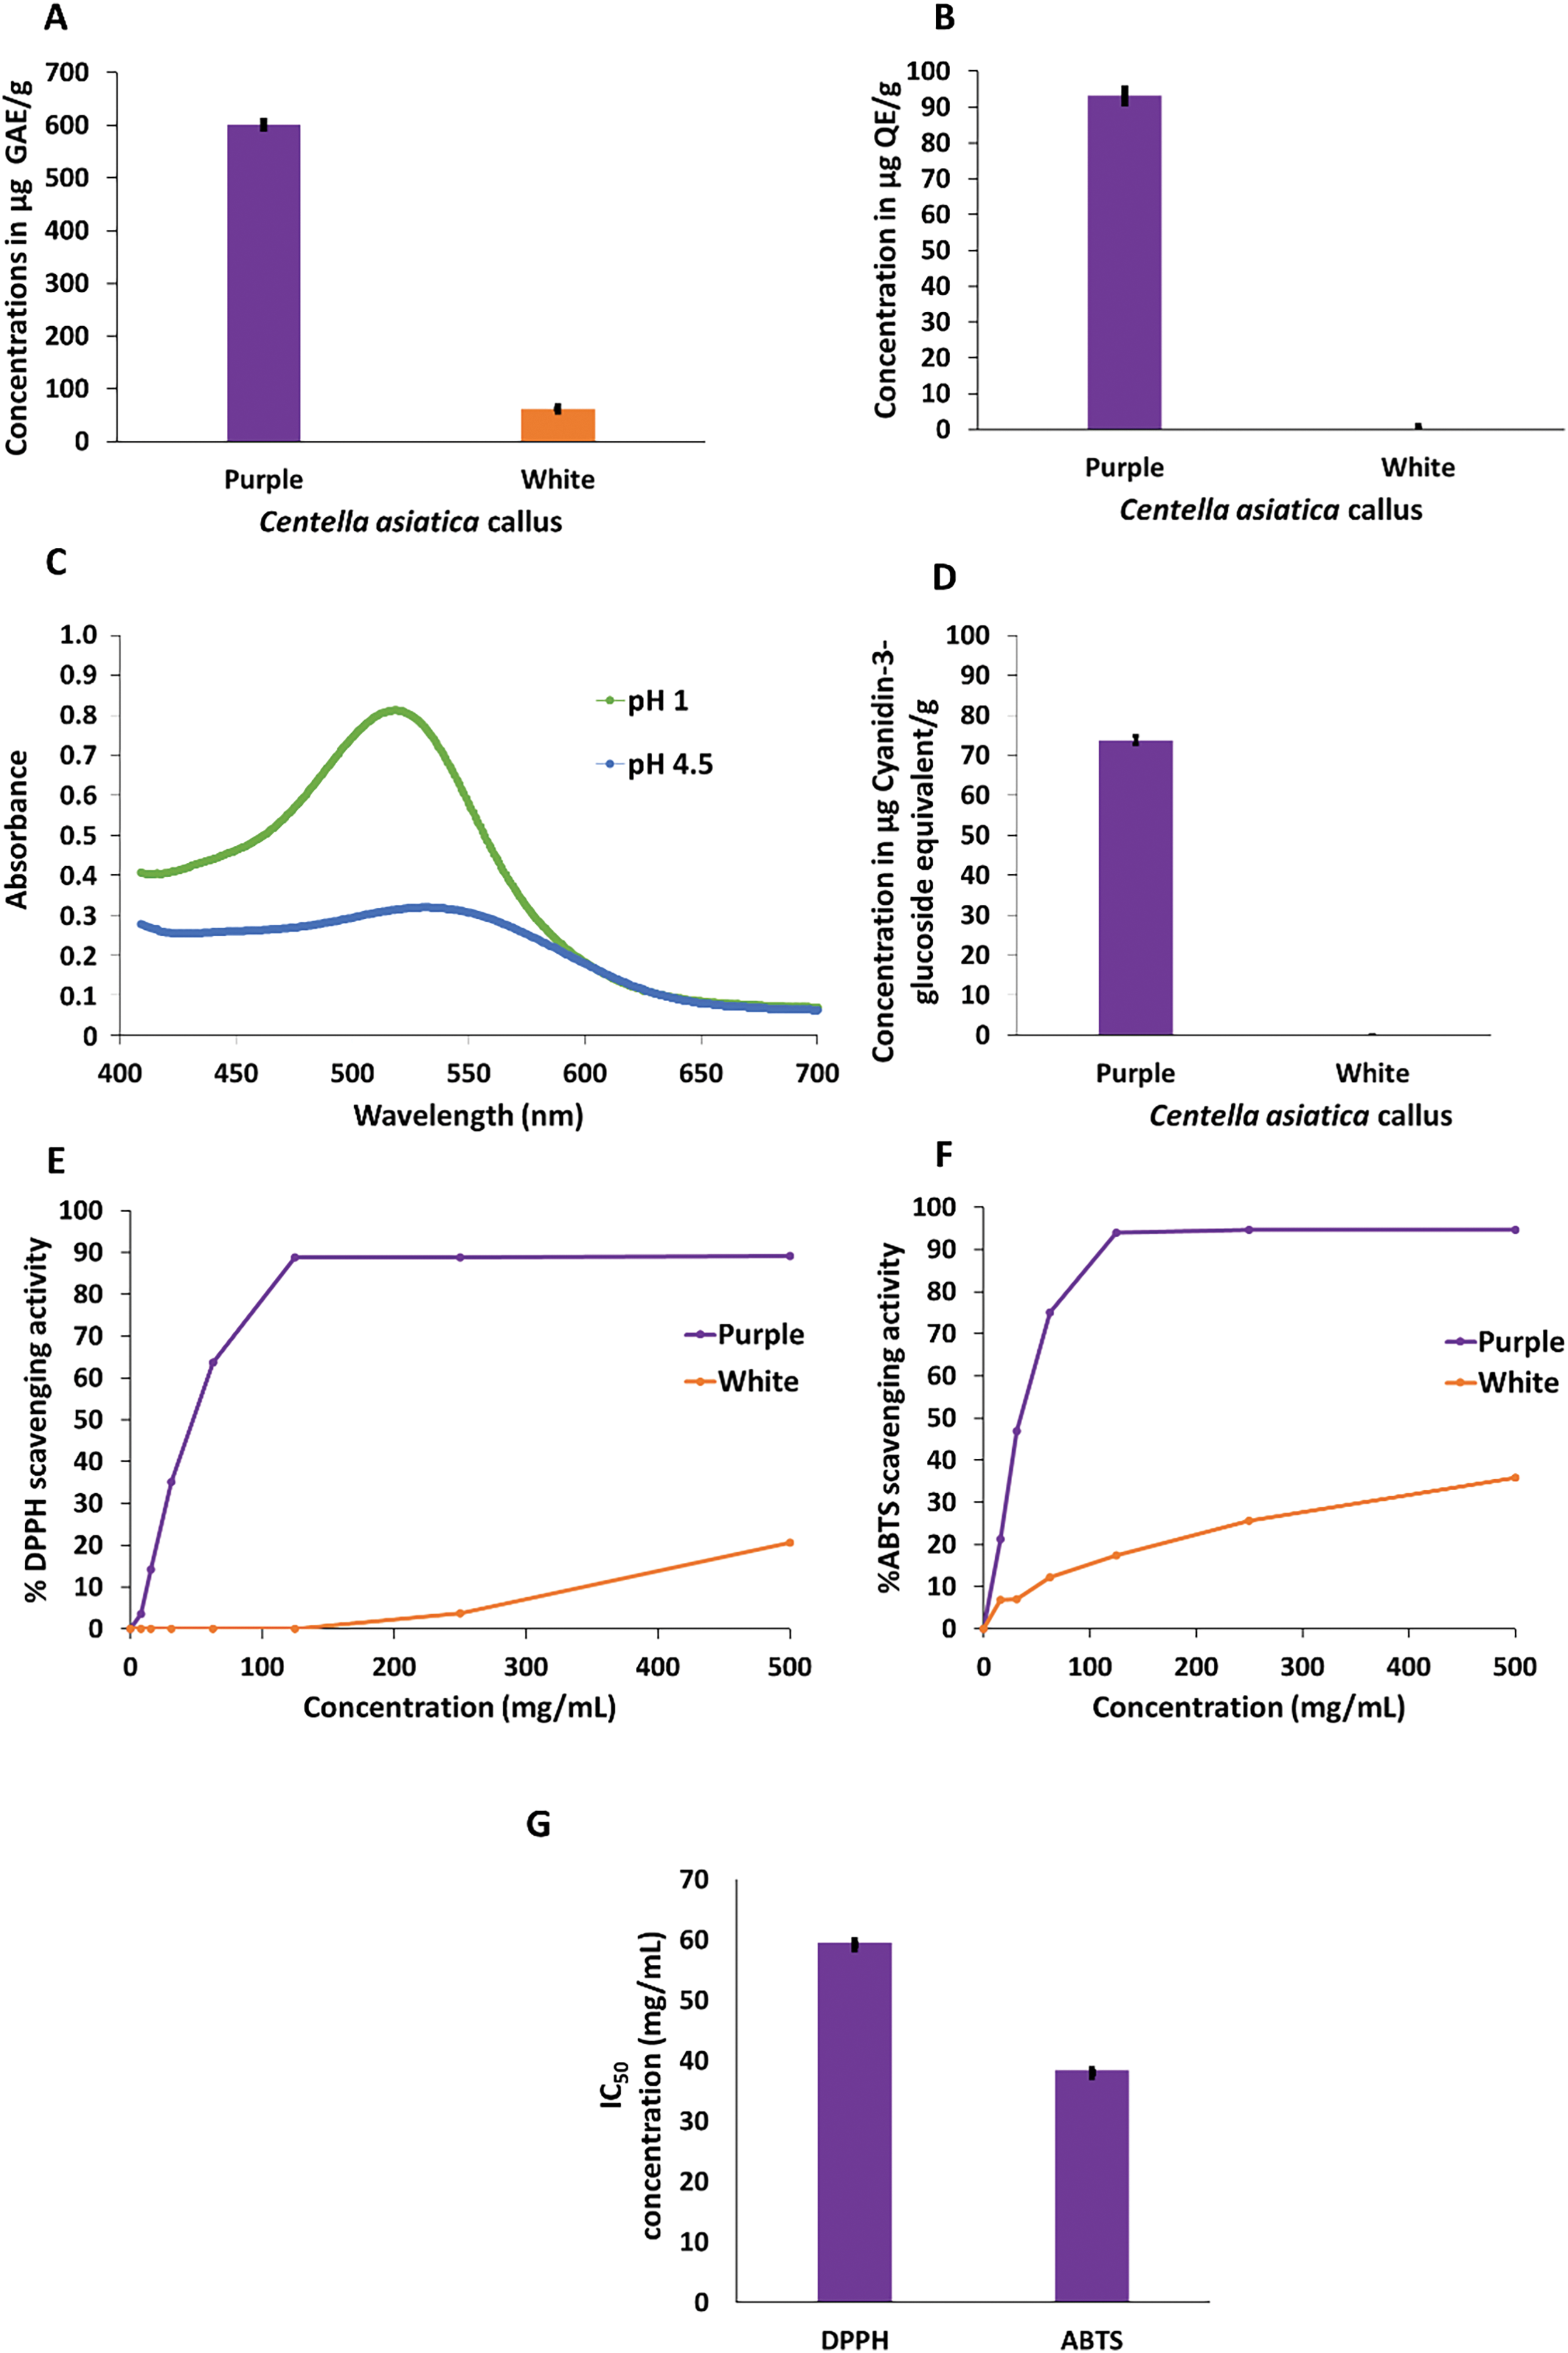
Figure 2: Quantitative determination of total phenolics, flavonoids, anthocyanins and associated antioxidant activity in extracts prepared from white and purple callus of Centella asiatica. (A) Phenolic content expressed as μg GAE/g tissue (p < 0.005). (B) Flavonoid content expressed as μg QE/g tissue (p < 0.00001). (C) Typical absorbances of the pH differential method for the quantification of total anthocyanin content (D), expressed as CGE/g tissue. (E) DPPH• antioxidant activity (p < 0.00001), (F) ABTS•+ antioxidant activity (p < 0.00001), and (G) IC50 values extrapolated from the standard curves corresponding to serially diluted extracts and expressed in mg/mL. Error bars indicate the standard deviation of n = 3 replicate values. GAE = gallic acid equivalents, QE = quercetin equivalents, CGE = cyanidin glucoside equivalents
While the flavonoid content (TFC) in the purple callus was 93.1 μg/g ± 0.02 QE, in white callus the content was either null or below the detection limit (Fig. 2B). Similarly to flavonoids, anthocyanins were only detected in the purple callus and quantified as 73.7 ± 0.01 μg/g CGE (Fig. 2C,D), thus representing the majority of the TFC in the purple callus. Anthocyanins in the white callus were deemed below the detection limit as their absorbance in both pH 1 and 4 buffers were relatively the same.
Since extracts prepared from the white callus contained no detectable flavonoids and anthocyanins, this might be an indication that the flavonoid pathway was significantly repressed and not operational. Flavonoid biosynthesis is influenced by various stimuli, with light playing a significant role. This process is mediated by photoreceptors that activate key enzymes involved in the flavonoid biosynthetic pathway [30,31]. Similarly to our study, anthocyanins were initiated in cell suspension cultures of Centaurea cyanus after only 20 h of UV and white light activation. In the absence of light irradiation, no anthocyanin production occurred [32]. Light has successfully been applied to cell suspensions of strawberries to increase the in vitro production of anthocyanins five-fold [33]. In cultures of Melastoma malabathricum, the accumulation of anthocyanins and pigment content was enhanced under moderate light intensity and continuous irradiance [34].
3.2 Antioxidant Activity in White vs. Purple C. asiatica Callus
Plants are exposed to detrimental and reactive oxygen species (ROS, forms of oxygen that are more reactive than O2) that can originate from metabolic events or external stressors such as light [35]. These include the superoxide anion (O2–•), hydroxyl (•HO) and hydroperoxyl (HOO•) radicals, hydrogen peroxide (H2O2), singlet oxygen (1O2) and ozone (O3) [23], that can be detoxified by antioxidants.
Phenolic compounds present in C. asiatica roots and leaves were reported as the major contributors to the antioxidative activities of the herb [29]. Here the antioxidant capacity of the white and purple callus was evaluated using two well-known assays using free radicals, DPPH• and ABTS•+. The principle behind the two assays relies on the extract’s ability to reduce both free radicals [36]. Both assays were used here to provide complimentary insights into the scavenging potential of the white and purple callus of C. asiatica. The DPPH• scavenging capacity ranged from 3.7 ± 0.004–20.6 ± 0.02% for the white callus and 3.5 ± 0.01–89.2 ± 0.01% for the purple callus (Fig. 2E).
The ABTS•+ scavenging capacity of the white callus extract varied between 6.8 ± 0.004–35.8 ± 0.02% and for the purple callus extract the capacity ranging from 21.2 ± 0.05–94.6 ± 0.001% (Fig. 2F). The inhibitory scavenging activity of purple callus was more than 4 times higher than that of white callus at the highest tested concentration (500 mg/mL). Because the white callus did not achieve 50% radical inhibition at this concentration, only the IC50 of the purple callus was calculated. The IC50 of purple extracts are represented in Fig. 2G and show a lower concentration with ABTS•+ (38.4 ± 0.34 mg/mL) compared to DPPH• (59.5 ± 0.19 mg/mL). DPPH• is known to be more specific to hydrophobic antioxidants while ABTS•+ covers a broader range of antioxidants, being hydrophobic or lipophilic [24]. Hence, lower IC50 with ABTS•+ can be explained by the potential of a broader range of antioxidants present in purple callus to neutralize the free radical. Such differences demonstrate the importance of using more than one method to assess the antioxidant capacity of plant extracts. The antioxidant capacity of the purple callus was remarkable, irrespective of the free radical, suggesting a functional relationship between the compounds responsible for the purple coloration of the callus and photooxidative stress triggered by the LED illumination. Related observations from the literature reported that ROS act as key signaling molecules facilitating light-induced anthocyanin synthesis in Eucalyptus [37], while another emphasized that a redox homeostasis balance is needed where antioxidants can deactivate excessive ROS but still allow ROS to trigger cell-protective signaling cascades [38].
3.3 Phytochemical Profiling of Extracts from Purple vs. White Callus
The UV-visible absorbance spectra of the methanol extracts of the purple callus, compared to that of the white callus, exhibited a broad absorbance peak in the 450–660 nm region, with a λmax at 525–527 nm. The LC-MS comparison of the extracts from the purple and white callus indicated that fifteen compounds were upregulated in the purple callus. Of the 24 compounds, four were tentatively identified as flavonoids, six as anthocyanins, and 12 as caffeoylquinic acid derivatives. Two compounds could not be identified and would require further evaluation. Fig. 3 represents the base peak intensity (BPI) chromatogram of the extracts from the purple callus overlaid on the chromatogram of extracts of the white callus. A combined extracted ion chromatogram (XIC) of selected mass ions (m/z = 355.1, 449.1, 535.1, 549.1, 479.1, 551.1, 499.1, 493.1, and 565.1) are presented in Fig. 4. Peaks that exhibited prominent differences in intensities were selected for further investigation.
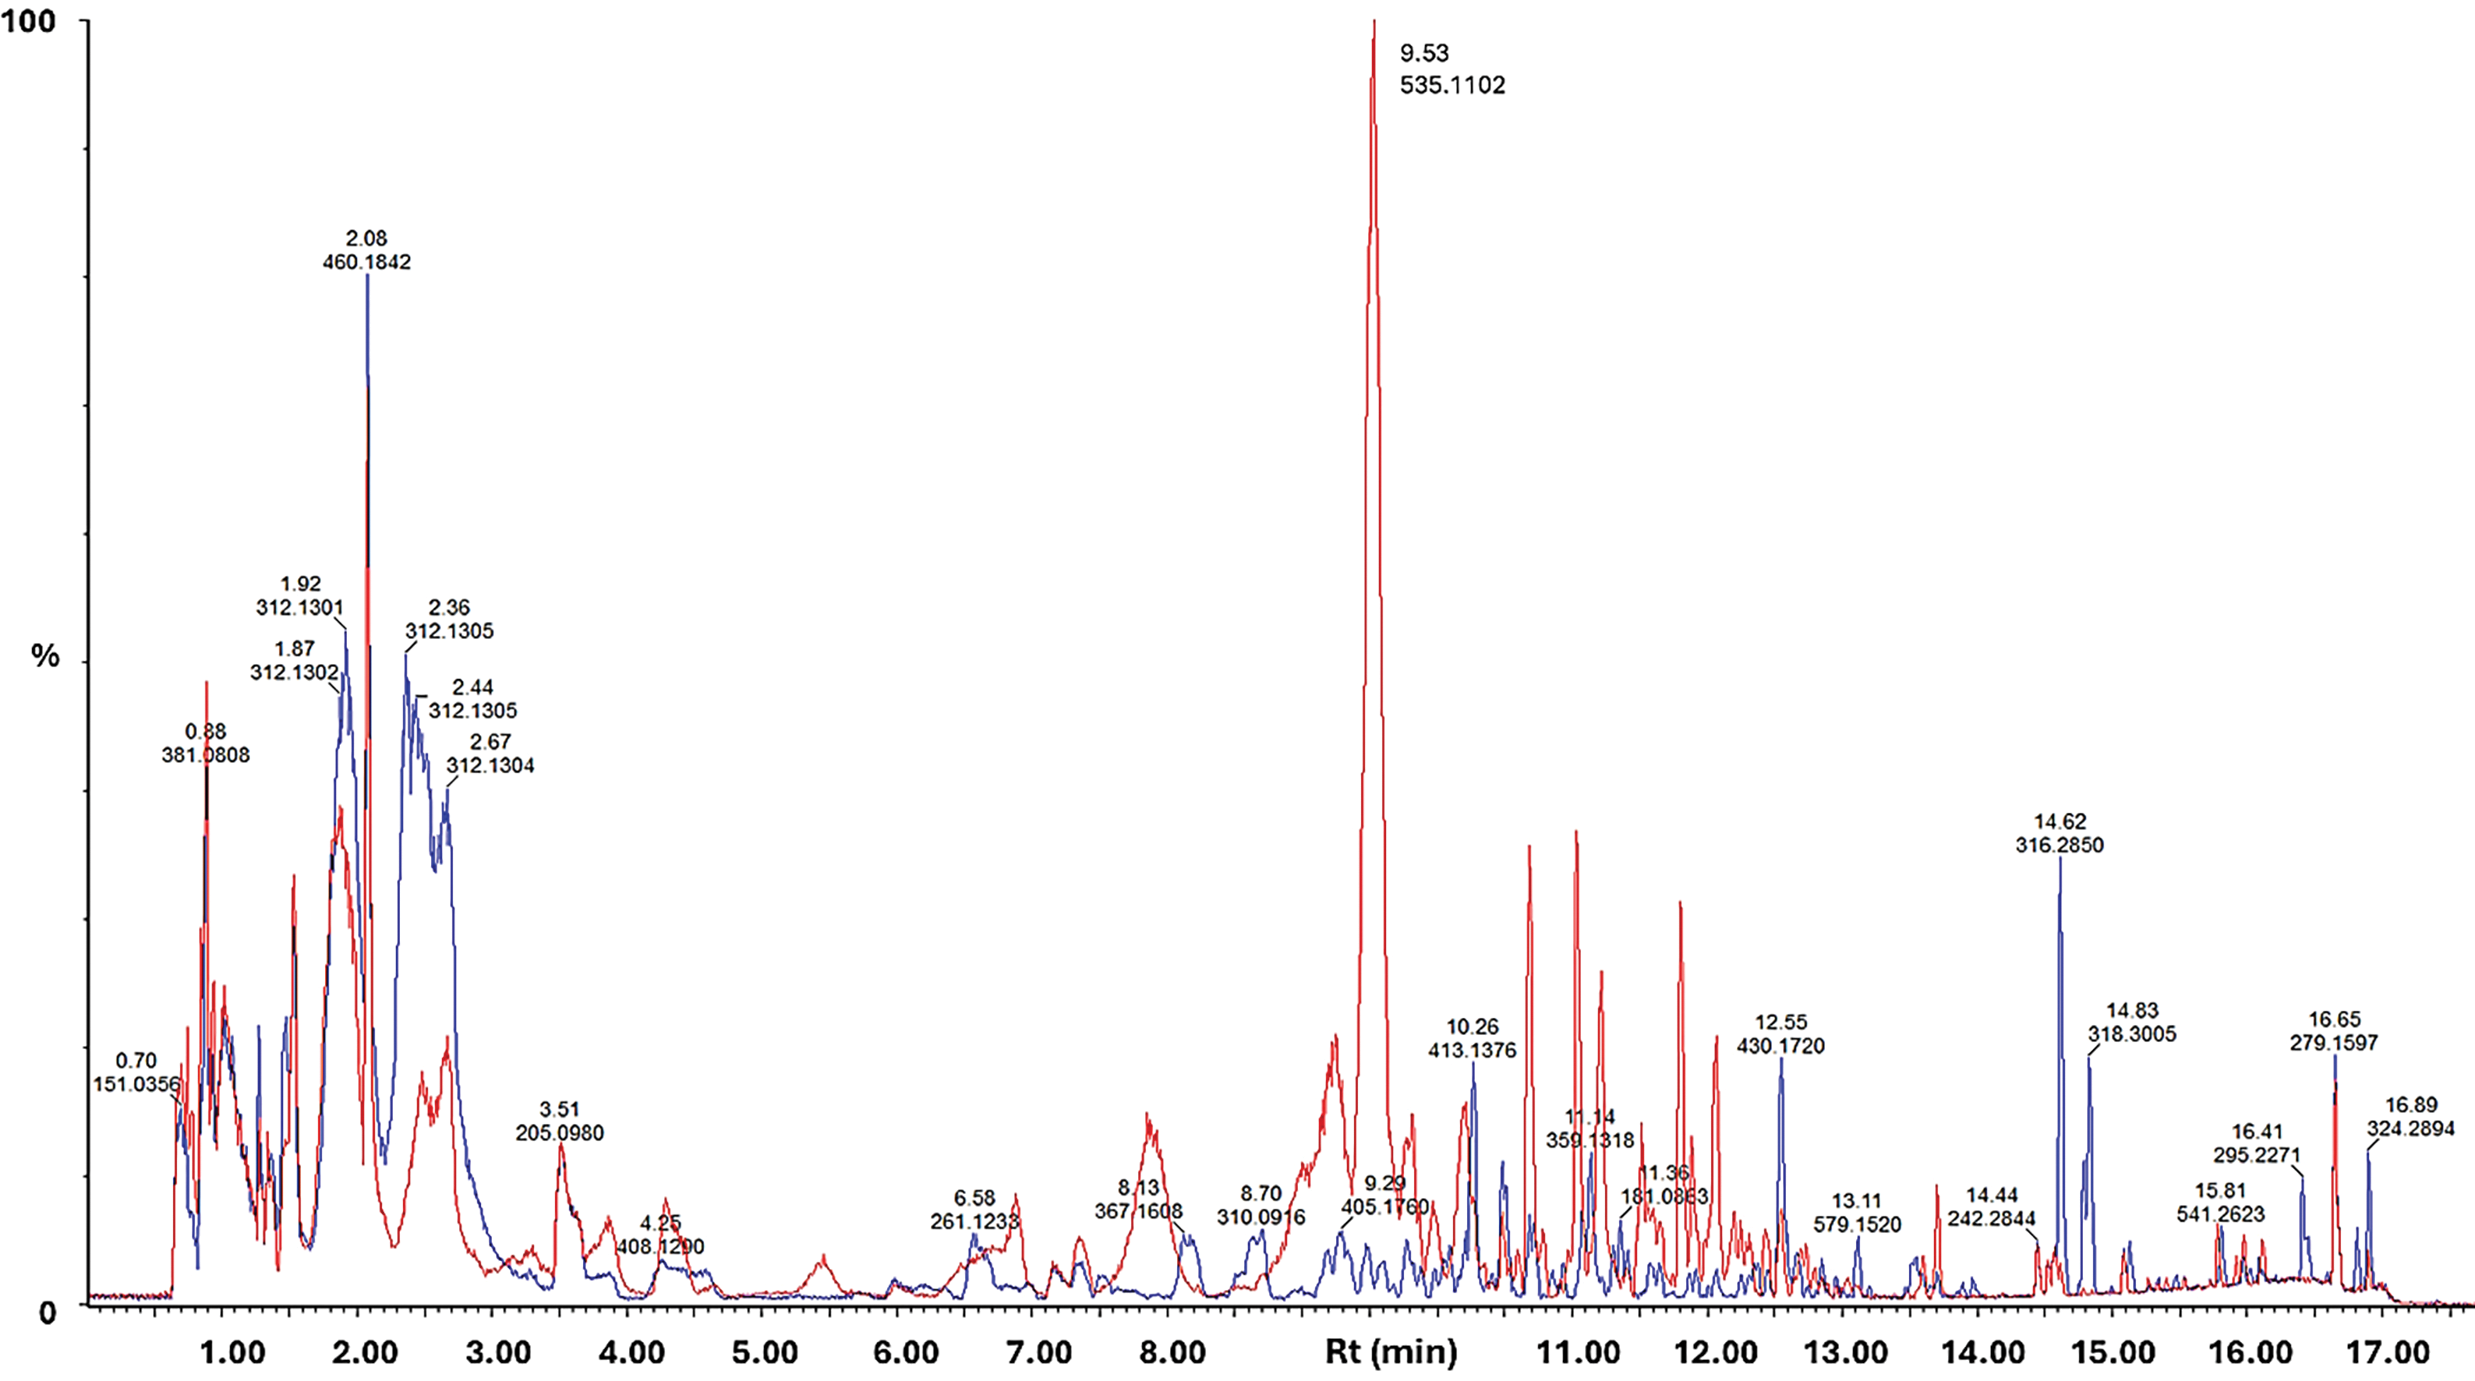
Figure 3: Overlaid UHPLC-MS base peak intensity (BPI) MS chromatograms of methanolic extracts of purple (red line) vs. white callus (blue line), stacked and scaled. Data was acquired in positive ionisation mode. Individual peaks are annotated by the m/z value of the most intense peak at a specific retention time and relative peak intensities are shown as a % of the most intense peak overall
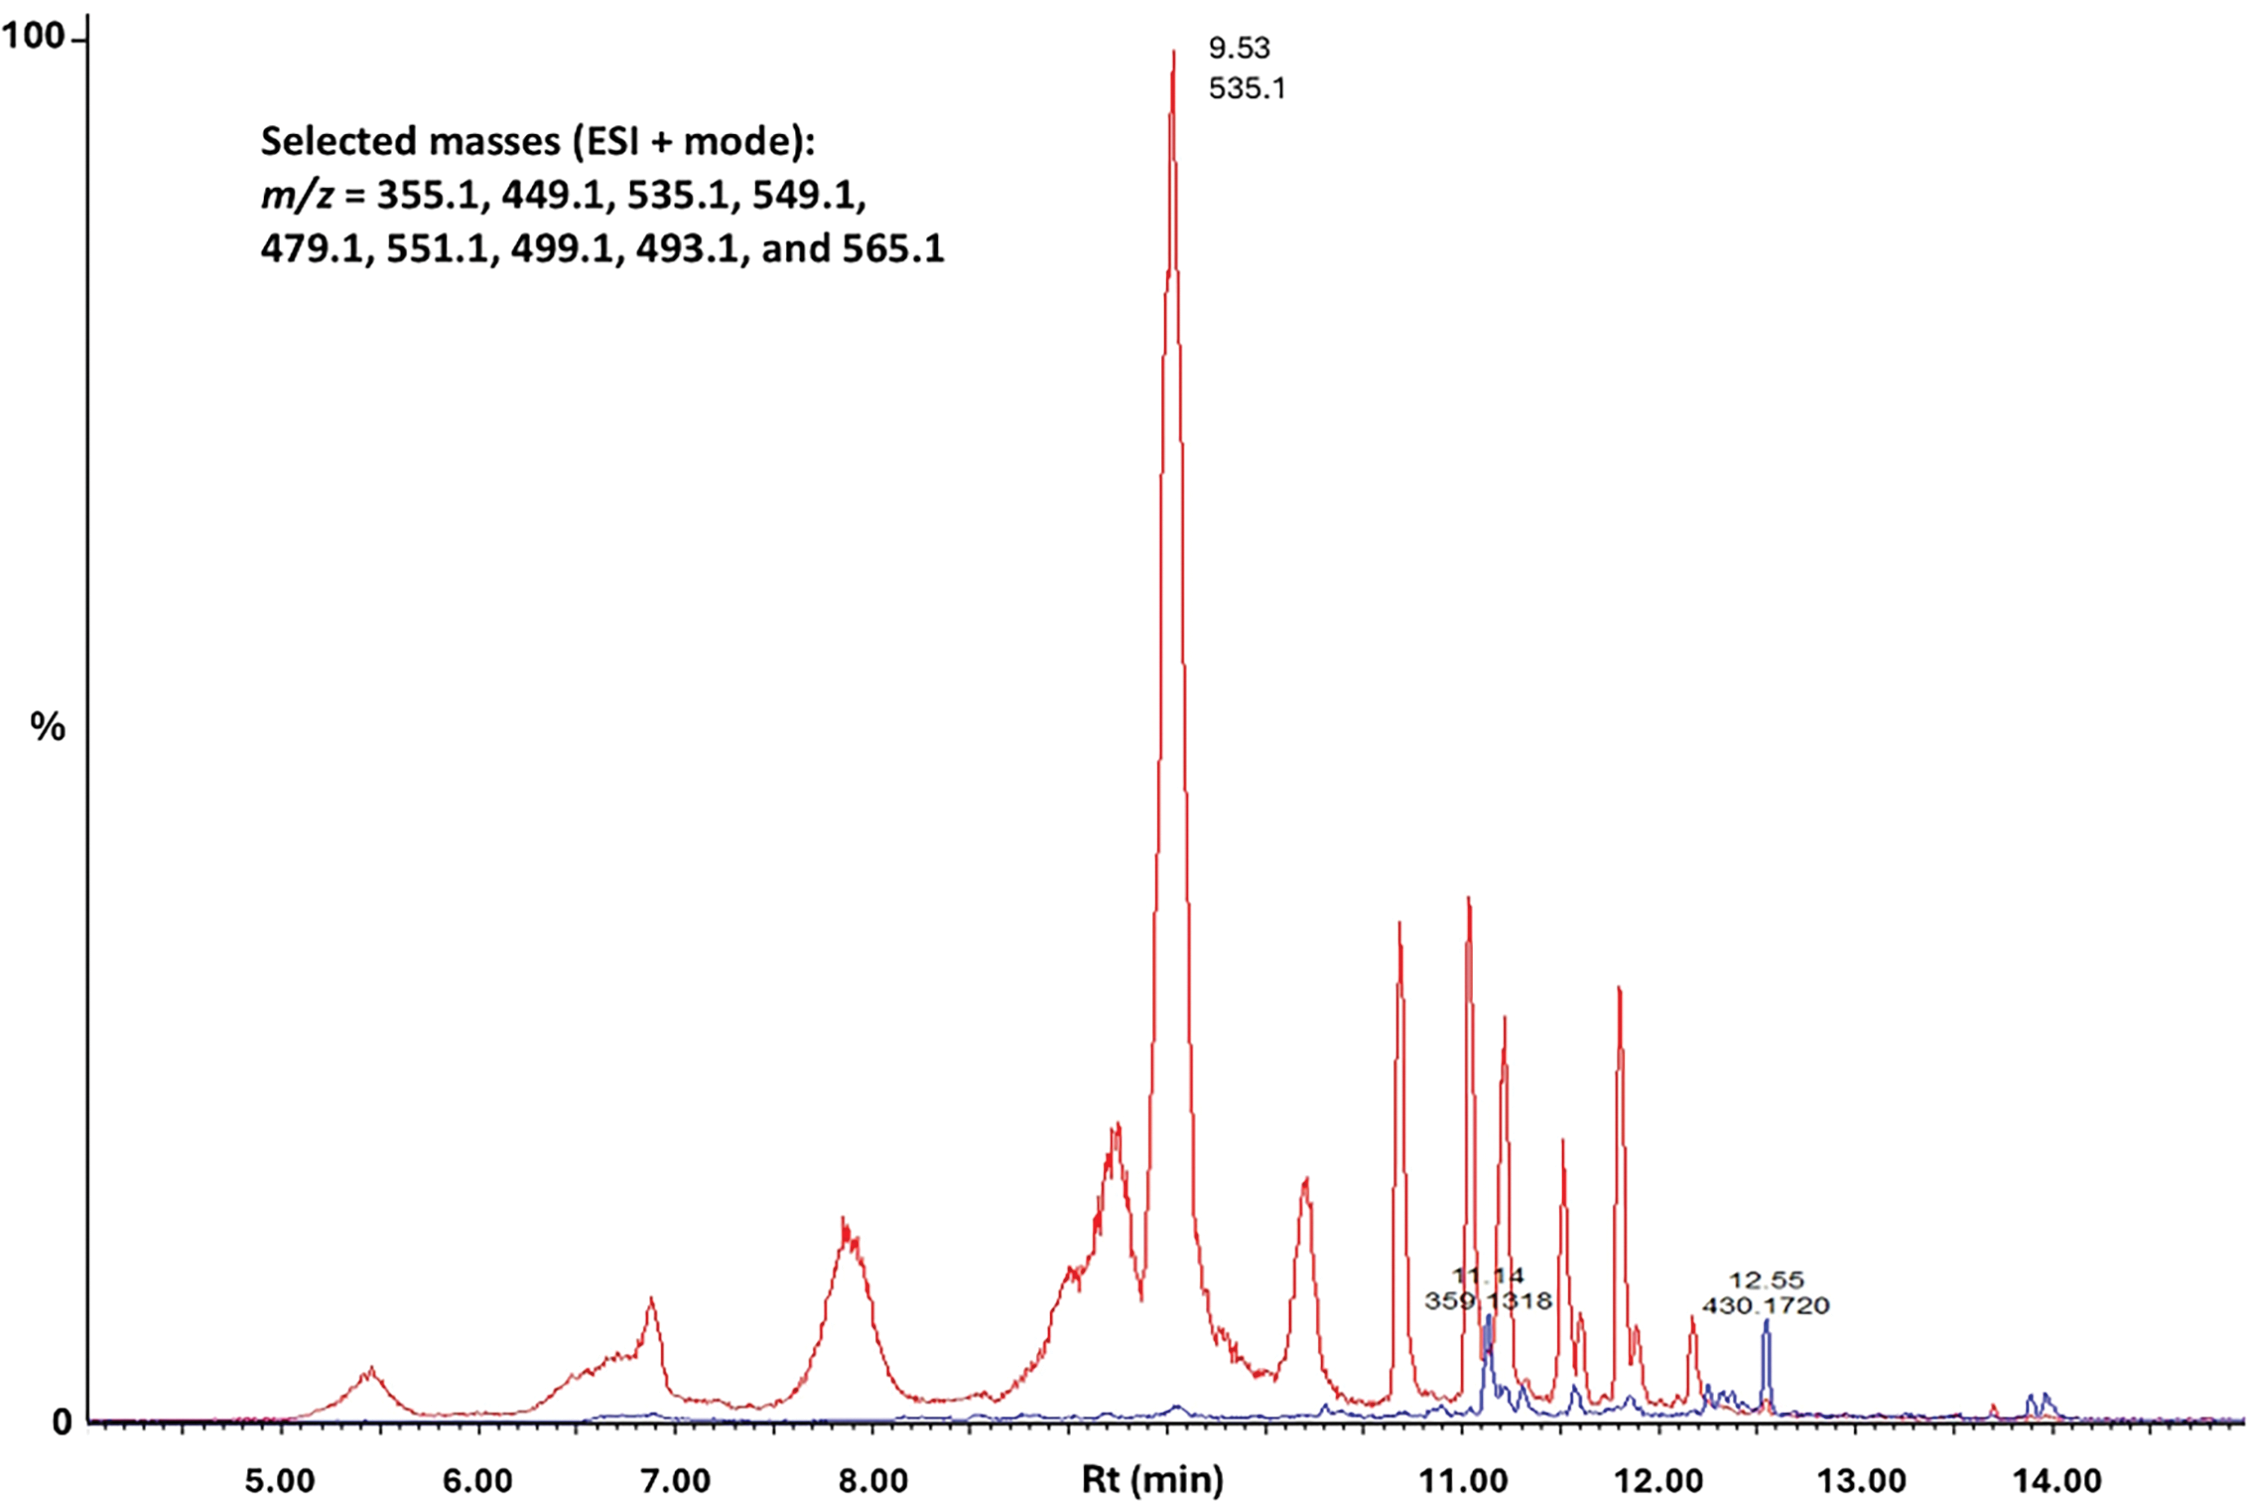
Figure 4: UHPLC-MS combined extracted ion chromatogram (XIC) obtained in positive ESI mode of selected masses (m/z = 355.1, 449.1, 535.1, 549.1, 479.1, 551.1, 499.1, 493.1 and 565.1) eluting between 5–14 min. The chromatograms are stacked and scaled to the same y-axis; i.e., relative peak intensities are shown as a % of the most intense peak overall. The red and blue lines indicate the methanolic extracts from the purple and white callus, respectively
3.4 Annotation of Anthocyanins Present in Methanolic Extracts of Purple Callus
As mentioned, anthocyanins have an anthocyanidin (aglycone) core structure bound to various 3- and 5-linked glycosides. Further decoration of the core structure with aromatic or aliphatic moieties may produce a wide array of anthocyanins [11,15]. Structural variants can include non-acylated and acylated anthocyanins, O-methylated anthocyanins, 3-deoxyanthocyanins, and pyrano-anthocyanins [11]. There are six common anthocyanidins: (pelargonidin, cyanidin, peonidin, delphinidin, petunidin, and malvidin, Fig. 5), four of which were annotated in extracts from the purple C. asiatica callus.
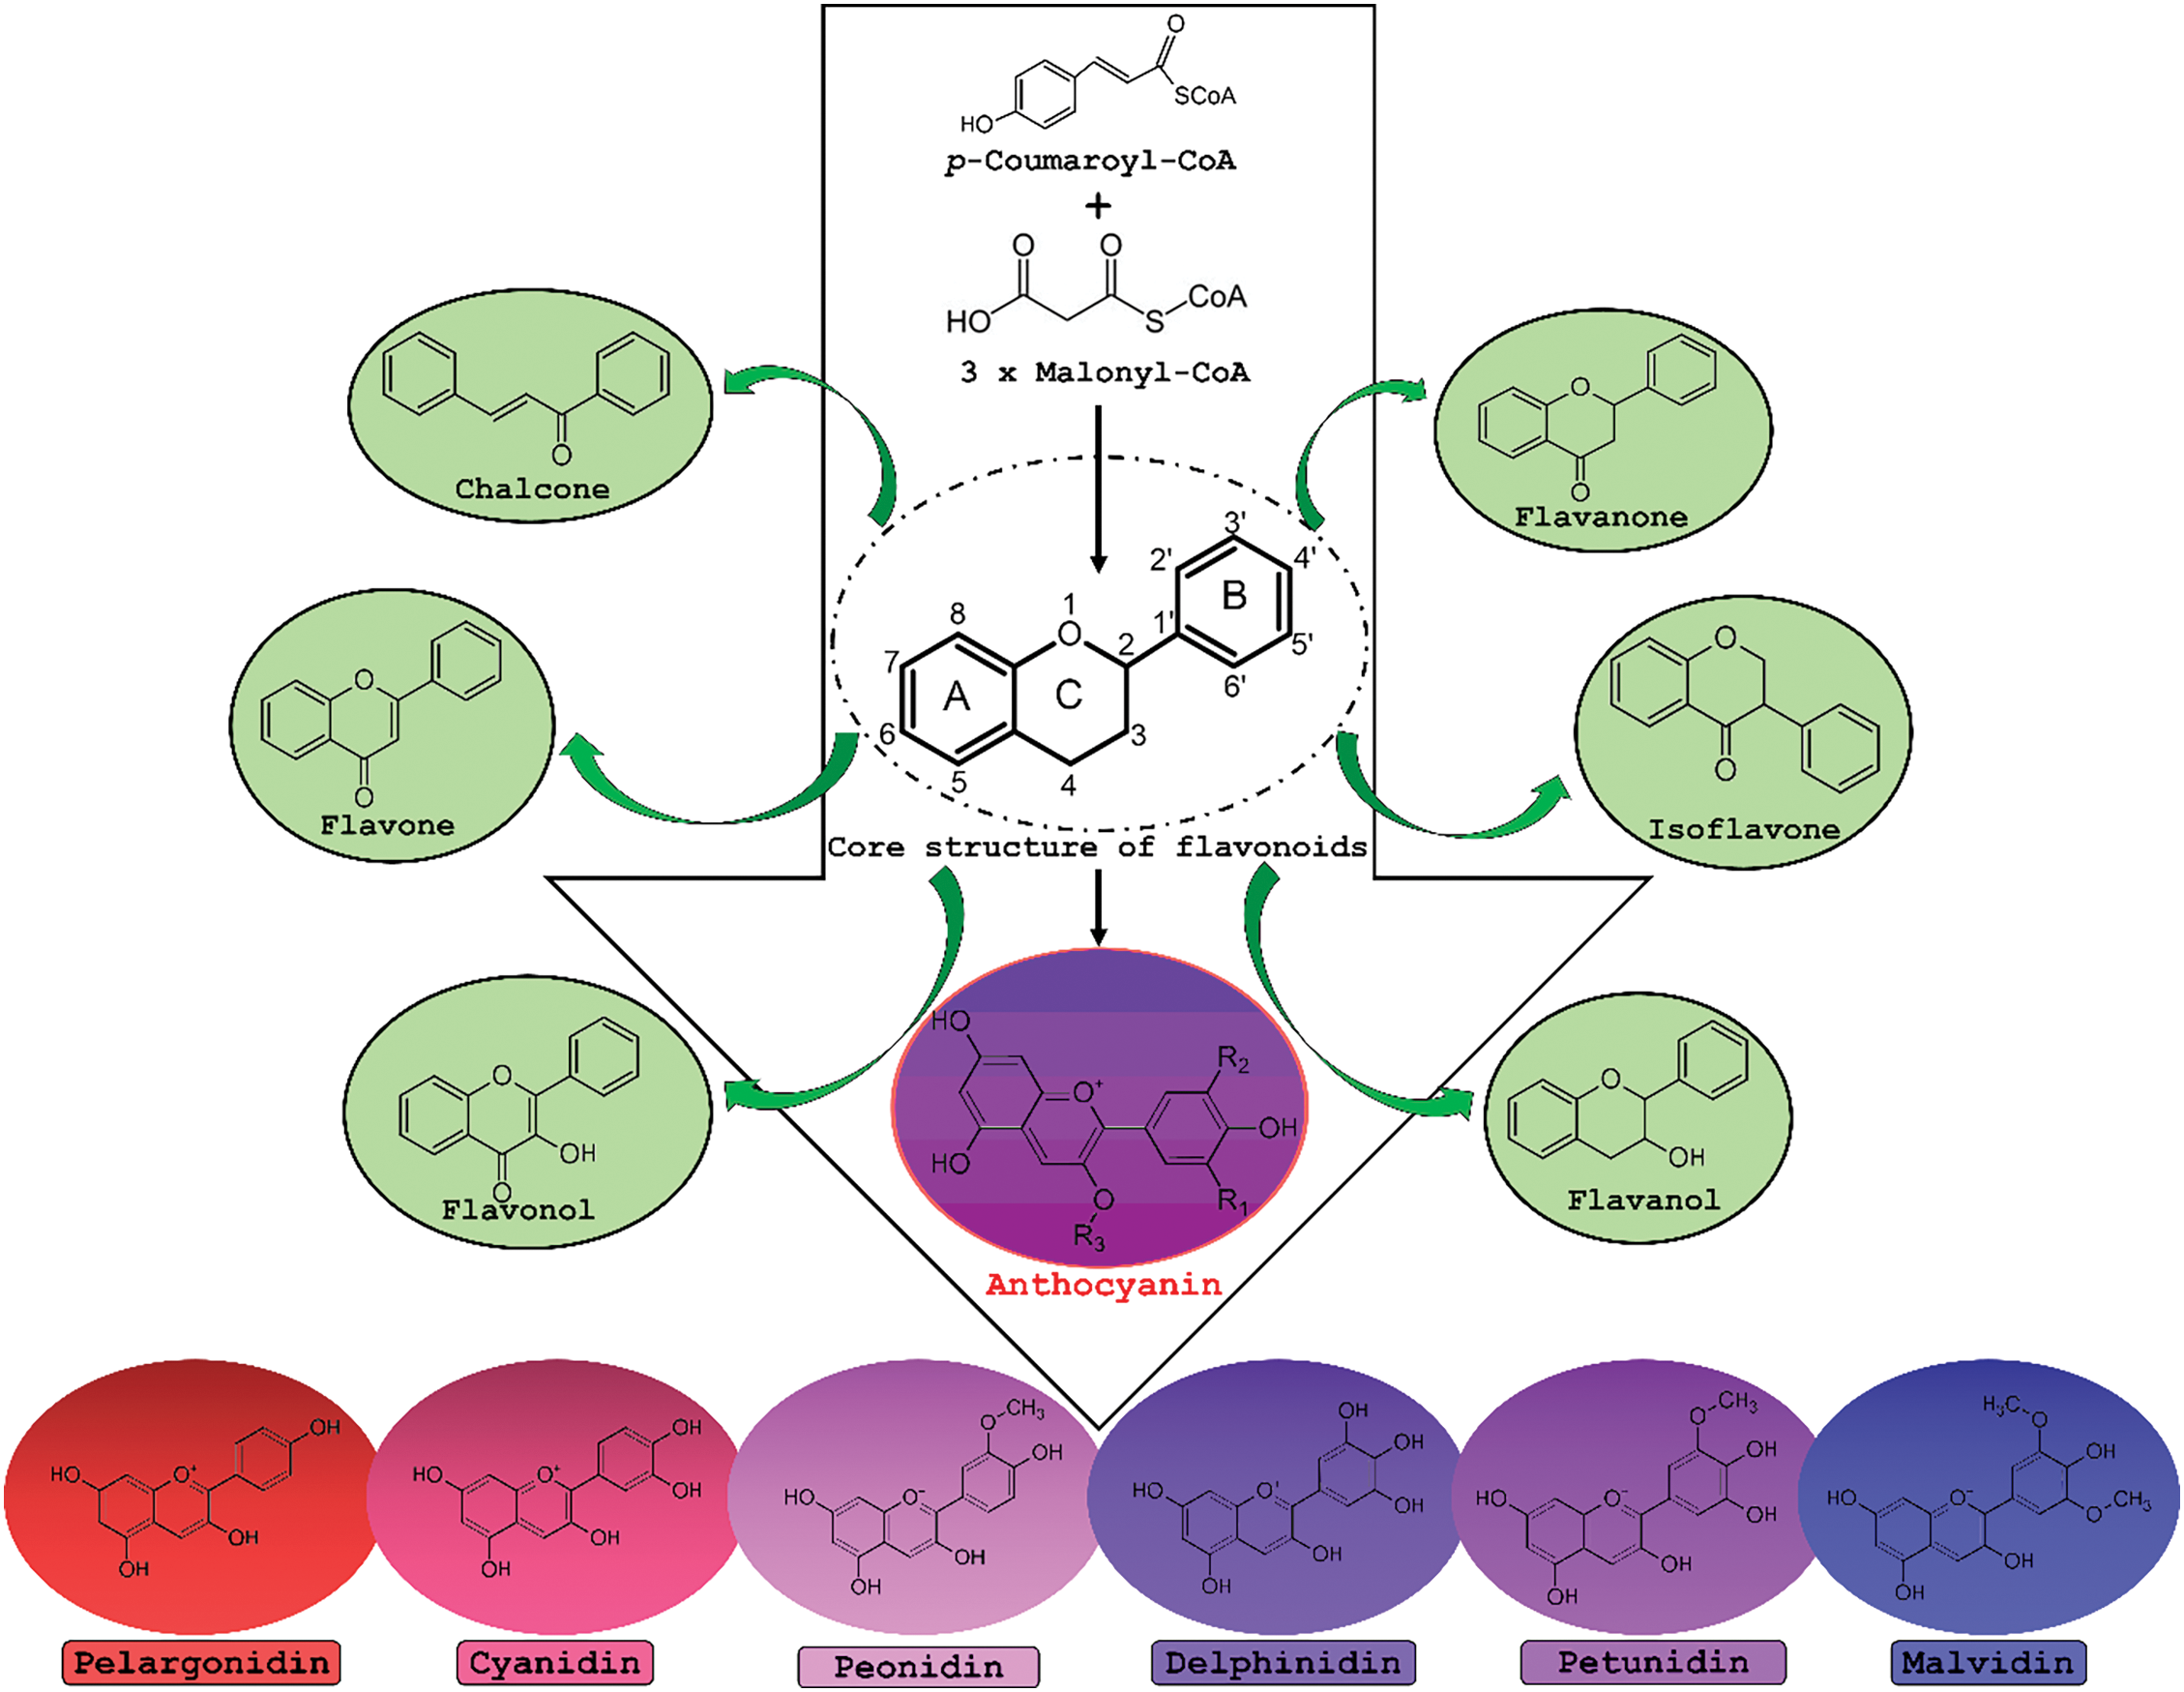
Figure 5: Overview of the biosynthesis of anthocyanins in relation to other members of the flavonoid class of secondary metabolites. Flavonoids are synthesised by condensing a C6–C3 unit (p-coumaroyl-CoA) with three molecules of malonyl CoA and contain fused benzopyrylium cores (C- and A-rings) with an added phenyl group attached at C2 (B-ring). Anthocyanidins differ structurally from the other flavonoids due to a flavylium (2-phenylchromenylium) ion that carries a positive charge at the oxygen atom of the C-ring of the basic flavonoid structure. In the anthocyanidin core structure R1 and R2 can be either -H or -OH, generating the six main classes: pelargonidin, cyanidin, peonidin, delphinidin, petunidin and malvidin. The aglycone core structure may be bound to various 3- and 5-linked glycosides. Additional substitution with aromatic or aliphatic moieties may produce a wide array of anthocyanins [11,15]
Both channels of the MSE analysis were used to obtain MS1 and MS2 data for the annotation of the putative anthocyanins, four of which were annotated as decorated with malonyl moieties. The collected data and results are summarized in Table 1. The compound with an Rt of 7.85 min (#8) and an observed mass of 449.1090 Da produced a single production with a mass of 287.0555 Da. The NIST database tentatively identified the compound as cyanidin 3-galactoside or cyanidin 3-glucoside. The mass spectral data confirmed the empirical formula as C21H21O11+ with m/z of 449.10839 Da and a ring and double bond equivalence count (RDBE) of 12. The fragment ion was identified as cyanidin (C15H11O6+; m/z 287.0555; RDBE = 11).
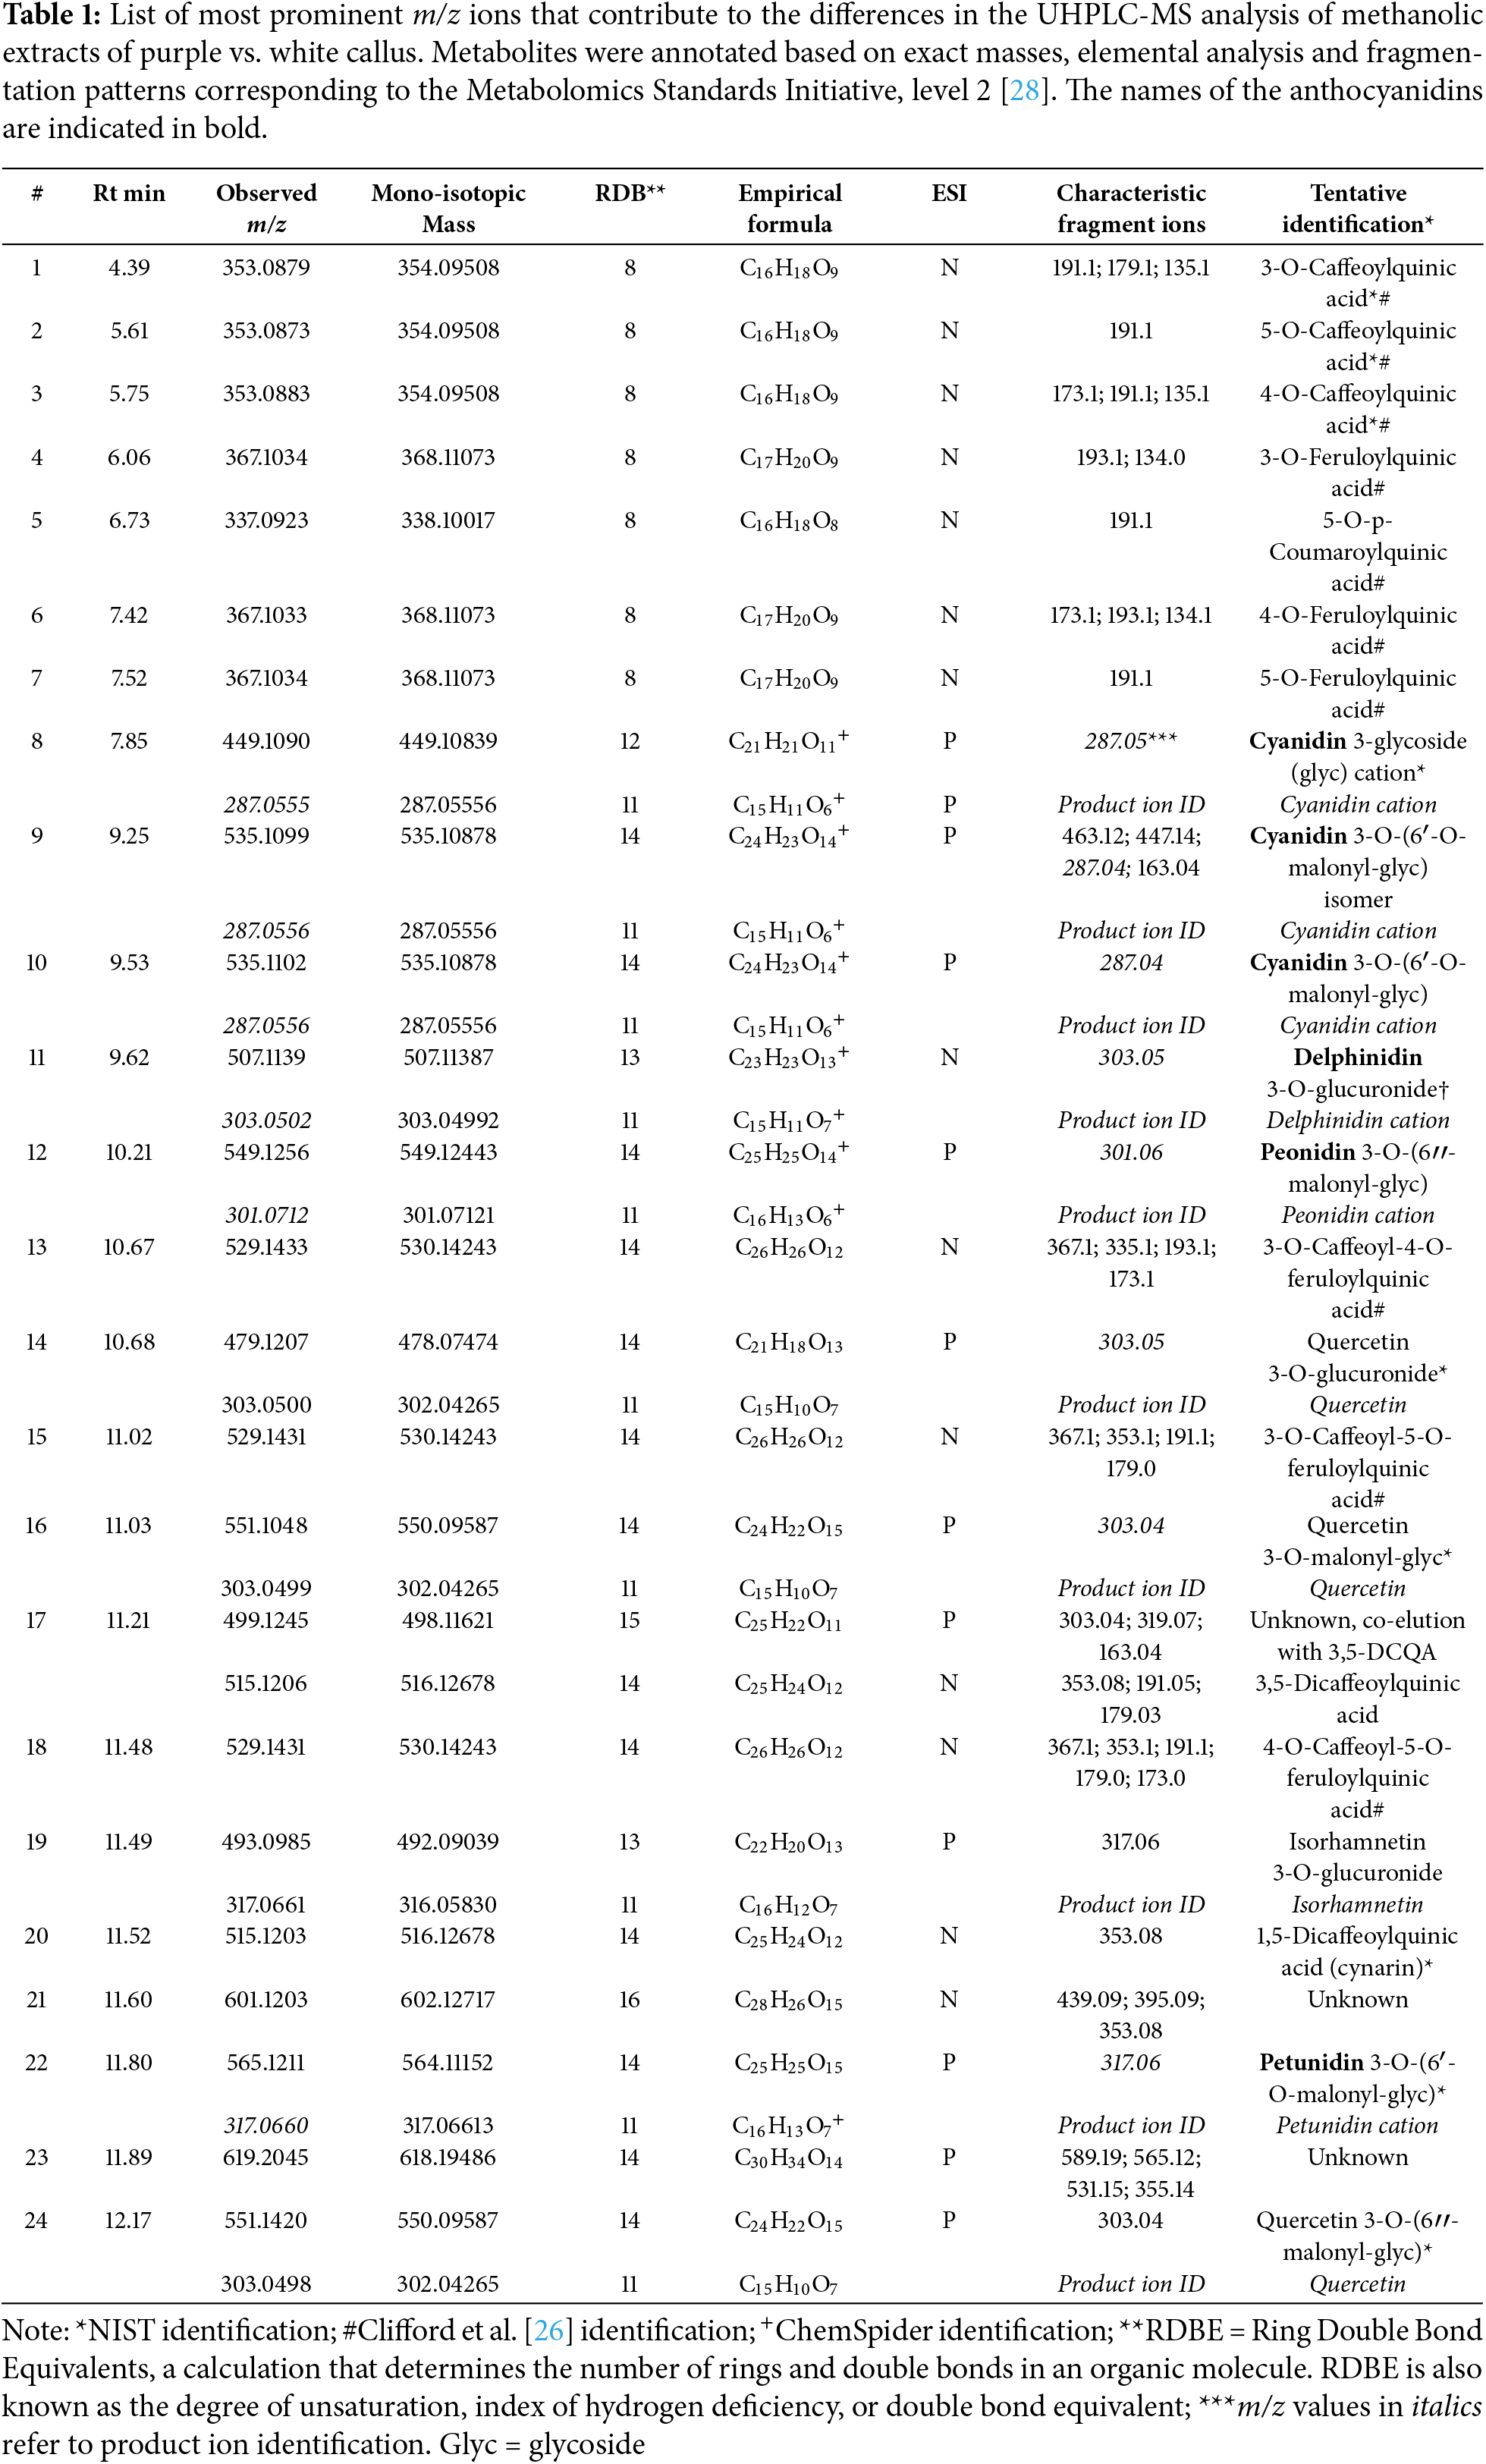
Two compounds were detected with a BPI ion with m/z 535.11. The compound at an Rt of 9.25 min (#9) produced four fragment ions, including a product ion with m/z 287.04. The second compound at Rt 9.53 min (#10) displayed a single production with m/z 287.05. The data obtained from the elemental analysis (MassLynx software, Waters Corporation, Milford, MA, USA) were submitted to ChemSpider, an online chemical information resource, (https://www.chemspider.com (accessed on 6 March 2025)), and compound #10 was tentatively identified as cyanidin 3-O-(6′-O-malonylglucoside) (C24H23O14+; m/z 535.10878; RDBE = 14). A MassFragment analysis confirmed the fragmentation pattern as consistent with the proposed structure. Due to the similarity between the mass spectra of the two compounds, the first compound (Rt = 9.25 min, #9) may be an isomer of cyanidin 3-O-(6′-O-malonylglucoside) or containing an alternative sugar.
The compound at Rt 9.60 with m/z 507.1139 (#11) was only detected in ESI-Neg mode. The elemental analysis suggested an empirical formula of C23H23O13+ with an RDBE value of 13 and the production with m/z 303.0502 produced an empirical formula of C15H11O7+ and a RDBE value of 11. A ChemSpider and Pubchem (National Institutes of Health, USA; https://pubchem.ncbi.nlm.nih.gov/ (accessed on 6 March 2025)) search identified the compound as delphinidin 3-O-glucuronide or delphinidin 3-(6″-acetylglucoside) and this was confirmed with a MassFragment analysis.
The compound at Rt 10.21 min with m/z 549.12 (#12) produced a single production with m/z 301.06. Elemental composition analysis rendered an empirical formula of C25H25O14+ (m/z 549.12443; RDBE = 14). Elemental composition analysis of the production suggested an empirical formula (C16H13O6+; m/z 301.07121; RDBE = 11). An online PubChem search identified the compound as peonidin 3-O-(6″-malonyl-glucoside). An analysis of the mass spectrum of the production suggested an empirical formula of C16H13O6+ (m/z 301.07121; RDBE = 11). According to the NIST and ChemSpider mass spectral libraries, this is consistent with the structure of the peonidin cation.
An elemental analysis of the compound with Rt 11.80 min (#22) indicated an empirical formula of C25H25O15+. The NIST mass spectral library tentatively identified the compound as petunidin 3-O-(6′-O-malonylglucoside) (C25H25O15+; m/z 564.11152; RDBE = 14). The production in MS2 analysis was identified as petunidin cation (C16H13O7+; m/z 317.06613; RDBE = 11).
3.5 Annotation of Upregulated Flavonoids and Chlorogenic Acids Present in Purple Callus
Anthocyanins can form intramolecular interactions with non-stoichiometric amounts of colorless pigments (flavone or flavone glycosides), a phenomenon known as co-pigmentation [15]. This synergistic phytochemical interaction occurs between the anthocyanidins and co-localized aromatic acid moieties and is proposed to have a stabilizing effect on anthocyanin color. Similarly, alycone hydroxycinnamoyl quinic acids may be transported to the vacuole to potentially function as co-pigments [11].
MS1 data of the three potential flavonoids were submitted to the NIST library and all were tentatively identified. The compound with Rt 10.68 min (#14) was identified as quercetin 3-O-glucuronide (C21H18O13; m/z 478.07474; RDBE = 14). The compound with Rt 11.03 min (#16) was identified as quercetin 3-O-malonylglycoside (C24H22O15; m/z 550.09587; RDBE = 14). Relatedly, the compound with Rt 12.17 min (#24) was tentatively identified as quercetin 3-O-(6″-malonylglycoside) (C24H22O15; m/z 550.09587; RDBE = 14). The MS2 analysis of the productions of the quercetin glucosides confirmed the identity as quercetin (C15H10O7; m/z 302.04265; RDBE = 11), a pentahydroxyflavone.
The compound detected at Rt 11.49 min (#19) was identified from literature [14] as isorhamnetin 3-O-glucuronide. The elemental analysis of MS1 and MS2 data confirmed the identity (C22H20O13; m/z 492.09039; RDBE = 13) of the intact molecule and the product ion as isorhamnetin (C16H12O7; m/z 316.05830; RDBE = 11), a monomethoxyflavone (quercetin where the hydroxy group at position 3′ is replaced by a methoxy group).
In addition, 12 chlorogenic acids (CGAs) were annotated. These include the mono-substituted CGA: 5-O-coumaroylquinic acid; 3-O-, 4-O- and 5-O-regio-isomers of caffeoylquinic acid and 3-O-, 4-O- and 5-O-regio-isomers of feruloylquinic acid. The di-substituted CGAs included 3-O-caffeoyl-4-O-feruloylquinic acid, 3-O-caffeoyl-5-O-feruloylquinic acid, 4-O-caffeoyl-5-O-feruloylquinic acid, 3,5-caffeoylquinic acid, and 1,5-caffeoylquinic acid. These provisional annotations were based on fragmentation patterns and retention time differences of authentic standards [13,26,39].
The productivity of undifferentiated plant cell cultures about secondary metabolite biosynthesis is often low and depends several factors [40,41]. The biosynthesis of desired metabolites can be activated by various biotic elicitors and abiotic inducers. The triggered acclimation response of plant cells influences multiple layers of cellular functions and involves modification of the transcriptome, proteome, enzymatic activities, and metabolome [31]. In this context, LED lights have been used to elicit the production of specific secondary metabolites in different cultured plant systems [42]. Factors determining the levels of secondary metabolite synthesis and accumulation are the availability of appropriate precursors, as well as the activation and expression of the required biosynthetic enzymes. Artificial epigenetic modification may also be an effective strategy to activate the synthesis of cryptic secondary metabolites [43]. Antioxidant activity in plants is largely attributed to their flavonoid content, with generally higher flavonoid levels, indicating increased antioxidant potential.
The intricacies related to the in vitro activation of anthocyanin biosynthesis have been reviewed and addressed [30]. The metabolic pathway as depicted by the Kyoto Encyclopaedia of Genes and Genomes (KEGG, https://www.genome.jp/kegg/ (accessed on 6 March 2025)) lists 16 enzymes involved in the biosynthesis of anthocyanins, [PATH: ko00942] and is highly regulated at the tissue and organ levels. In addition to the structural genes involved [PATH: ko00941] (i.e., chalcone synthase (CHS), chalcone isomerase (CHI), dihydroflavonol-4-reductase (DFR), flavanone 3-hydroxylase (F3H), and flavonoid 3-O-glucyltransferase (UF3GT)), three types of transcription factors (i.e., MYB, basic helix–loop–helix (bHLH), and WD40) are involved [44]. Mutual interactions between these transcription factors in response to cellular demand result in the activation and regulation of the expression of anthocyanin biosynthetic genes as a sub-branch of the phenylpropanoid/flavonoid metabolic pathway.
The synthesis of anthocyanins is regarded as a strategic adaptive response by plants to various environmental stimuli. The quality, intensity, and duration of light are dominant variables within any cultivation environment [42,45] and play critical roles in modulating plant biochemical pathways and genetic expression [46]. Red and blue light are perceived by the photoreceptors phytochrome and cryptochrome, respectively. This, in turn, triggers the start of gene transcription in support of the biosynthesis of flavonoids, including anthocyanins. Blue light has been reported to be the most effective in increasing the accumulation of anthocyanins [47]. It can be concluded the white C. asiatica callus represents a receptive cellular system where blue-enriched LED light (possibly also contributing to photooxidative stress and ROS) was able to elicit the synthesis of anthocyanins.
Due to their chemical structures, anthocyanins absorb high-energy quanta, thereby protecting chloroplasts from the photooxidative and inhibitory effects of strong light [45,48], thus mitigating oxidative injury by controlling the production of ROS and efficiently scavenging free radicals [49]. A secondary derived benefit linked to ROS scavenging is the prevention of oxidation of biomolecules and the degradation of photolabile defense compounds. As such, anthocyanins serve a crucial role in plant defense mechanisms, enhancing resilience against a spectrum of biotic and abiotic influences.
The novel cryptic anthocyanidin metabolites from C. asiatica are members of the cyanidin, delphinidin, petunidin, and peonidin groups; respectively reflecting the use of caffeic acid, sinapic acid, and ferulic acid as hydroxycinnamic acid (C6) precursors (Fig. 5). While glucose is most often found in anthocyanins, the presence of other hexoses and pentoses has also been documented. In addition, acylation of the sugar residue(s) might occur with aliphatic acids and derivatives of cinnamic acid to contribute to the structural diversity [11]. The C. asiatica glycosylated anthocyanins exhibited a glucose and malonyl unit (6-malonyl glucoside) but with no additional acylation to hydroxycinnamates. The exception was delphinidin which was annotated as the 3-O-glucuronide and not malonylated. It is of interest that glucuronosylation, compared to glucosylation, seems to contribute to color stability against light and heat stresses [50]. Relatedly, two flavonoids, quercetin and isorhamnetin, were also found as glucuronide derivatives in this study (Table 1). Interestingly, glucoside, but not glucuronide derivatives of delphinidin and pelargonidin were reported in C. asiatica leaf material sourced from Kenya [51].
A recent review pointed out that anthocyanin biosynthesis is complex and multifaceted [44]. While the upregulation of the early phenylpropanoid pathway in response to light stimuli is relatively well known, the fine regulatory control within the late flavonoid pathway towards anthocyanin synthesis (rather than in competition with other C6-C3-C6 flavonoids as shown in Fig. 5), requires further investigation. Furthermore, it is important to note that the general response patterns and magnitude of anthocyanin increase, and how they confer or modulate resistance to stresses, are difficult to evaluate because of the influence of experimental variables. Different stress conditions were linked to the induction of distinct sets of anthocyanins in Arabidopsis thaliana, raising the possibility that the substitution and decoration patterns of each anthocyanin are used for distinct purposes during stress [52]. The anthocyanidin and anthocyanin profiles or ‘fingerprints’ may thus reflect the stress status of the plants.
Acknowledgement: Claude Y. Hamany Djande acknowledges postdoctoral funding support from the University of Johannesburg.
Funding Statement: The authors received no specific funding for this study.
Author Contributions: The authors confirm contribution to the paper as follows: study conception and design: Ian A. Dubery; data collection: Claude Y. Hamany Djande, Paul A. Steenkamp; analysis and interpretation of results: Claude Y. Hamany Djande, Paul A. Steenkamp, Ian A. Dubery; draft manuscript preparation: Claude Y. Hamany Djande, Ian A. Dubery. All authors reviewed the results and approved the final version of the manuscript.
Availability of Data and Materials: The authors confirm that the data supporting the findings of this study are available within the article. In addition, raw data, data processing information and the meta-data have been deposited into the National Metabolomics Data Repository website, the Metabolomics Workbench, https://www.metabolomicsworkbench.org (accessed on 6 March 2025), where it has been assigned the number ST003707.
Ethics Approval: Not applicable.
Conflicts of Interest: The authors declare no conflict of interests to report regarding the present study.
References
1. James JT, Dubery IA. Pentacyclic triterpenoids from the medicinal herb, Centella asiatica (L.) Urban. Molecules. 2009;14(10):3922–41. doi:10.3390/molecules14103922. [Google Scholar] [PubMed] [CrossRef]
2. He Z, Hu Y, Niu Z, Zhong K, Liu T, Yang M, et al. A review of pharmacokinetic and pharmacological properties of asiaticoside, a major active constituent of Centella asiatica (L.) Urb. J Ethnopharmacol. 2023;302(Pt A):115865. doi:10.1016/j.jep.2022.115865. [Google Scholar] [PubMed] [CrossRef]
3. Alcalde MA, Cusido RM, Moyano E, Palazon J, Bonfill M. Metabolic gene expression and centelloside production in elicited Centella asiatica hairy root cultures. Ind Crops Prod. 2022;184(1):114988. doi:10.1016/j.indcrop.2022.114988. [Google Scholar] [CrossRef]
4. James JT, Meyer R, Dubery IA. The occurrence of triterpenoid saponins in callus, cell suspensions and leaves of two Southern African phenotypes of Centella asiatica. Plant Cell Tiss Org Cult. 2008;94(1):91–9. [Google Scholar]
5. James JT, Tugizimana F, Steenkamp PA, Dubery IA. Metabolomic analysis of methyl jasmonate-induced triterpenoid production in the medicinal herb Centella asiatica (L.) urban. Molecules. 2013;18(4):4267–81. doi:10.3390/molecules18044267. [Google Scholar] [PubMed] [CrossRef]
6. Kim OT, Um Y, Jin ML, Kim YC, Bang KH, Hyun DY, et al. Analysis of expressed sequence tags from Centella asiatica (L.) Urban hairy roots elicited by methyl jasmonate to discover genes related to cytochrome P450s and glucosyltransferases. Plant Biotechnol Rep. 2014;8(2):211–20. doi:10.1007/s11816-013-0311-2. [Google Scholar] [CrossRef]
7. Ncube EN, Steenkamp P, Madala N, Dubery I. Metabolite profiling of the undifferentiated cultured cells and differentiated leaf tissues of Centella asiatica. Plant Cell Tissue Organ Cult PCTOC. 2017;129(3):431–43. doi:10.1007/s11240-017-1189-4. [Google Scholar] [CrossRef]
8. Dersch LM, Beckers V, Wittmann C. Green pathways: metabolic network analysis of plant systems. Metab Eng. 2016;34(2):1–24. doi:10.1016/j.ymben.2015.12.001. [Google Scholar] [PubMed] [CrossRef]
9. Chen S, Wang X, Cheng Y, Gao H, Chen X. A review of classification, biosynthesis, biological activities and potential applications of flavonoids. Molecules. 2023;28(13):4982. doi:10.3390/molecules28134982. [Google Scholar] [PubMed] [CrossRef]
10. Barceló-Muñoz A, Barceló-Muñoz M, Gago-Calderon A. Effect of LED lighting on physical environment and microenvironment on in vitro plant growth and morphogenesis: the need to standardize lighting conditions and their description. Plants. 2021;11(1):60. doi:10.3390/plants11010060. [Google Scholar] [PubMed] [CrossRef]
11. Sendri N, Bhandari P. Anthocyanins: a comprehensive review on biosynthesis, structural diversity, and industrial applications. Phytochem Rev. 2024;23(6):1913–74. doi:10.1007/s11101-024-09945-9. [Google Scholar] [CrossRef]
12. Lakshmikanthan M, Muthu S, Krishnan K, Altemimi AB, Haider NN, Govindan L, et al. A comprehensive review on anthocyanin-rich foods: insights into extraction, medicinal potential, and sustainable applications. J Agric Food Res. 2024;17:101245. doi:10.1016/j.jafr.2024.101245. [Google Scholar] [CrossRef]
13. Alcazar Magana A, Wright K, Vaswani A, Caruso M, Reed RL, Bailey CF, et al. Integration of mass spectral fingerprinting analysis with precursor ion (MS1) quantification for the characterisation of botanical extracts: application to extracts of Centella asiatica (L.) Urban. Phytochem Anal. 2020;31(6):722–38. doi:10.1002/pca.2936. [Google Scholar] [PubMed] [CrossRef]
14. Kandasamy A, Aruchamy K, Rangasamy P, Varadhaiyan D, Gowri C, Oh TH, et al. Phytochemical analysis and antioxidant activity of Centella asiatica extracts: an experimental and theoretical investigation of flavonoids. Plants. 2023;12(20):3547. doi:10.3390/plants12203547. [Google Scholar] [PubMed] [CrossRef]
15. Houghton A, Appelhagen I, Martin C. Natural blues: structure meets function in anthocyanins. Plants. 2021;10(4):726. doi:10.3390/plants10040726. [Google Scholar] [PubMed] [CrossRef]
16. Ainsworth EA, Gillespie KM. Estimation of total phenolic content and other oxidation substrates in plant tissues using Folin-Ciocalteu reagent. Nat Protoc. 2007;2(4):875–7. doi:10.1038/nprot.2007.102. [Google Scholar] [PubMed] [CrossRef]
17. Pérez M, Dominguez-López I, Lamuela-Raventós RM. The chemistry behind the folin-ciocalteu method for the estimation of (poly)phenol content in food: total phenolic intake in a Mediterranean dietary pattern. J Agric Food Chem. 2023;71(46):17543–53. doi:10.1021/acs.jafc.3c04022. [Google Scholar] [PubMed] [CrossRef]
18. Herald TJ, Gadgil P, Tilley M. High-throughput micro plate assays for screening flavonoid content and DPPH-scavenging activity in Sorghum bran and flour. J Sci Food Agric. 2012;92(11):2326–31. doi:10.1002/jsfa.5633. [Google Scholar] [PubMed] [CrossRef]
19. Shraim AM, Ahmed TA, Rahman MM, Hijji YM. Determination of total flavonoid content by aluminium chloride assay: a critical evaluation. LWT Food Sci Technol. 2021;150:111932. doi:10.1016/j.lwt.2021.111932. [Google Scholar] [CrossRef]
20. Giusti MM, Wrolstad RE. Characterization and measurement of anthocyanins by UV-visible spectroscopy. Curr Protoc Food Anal Chem. 2001;1(1):F1–2. doi:10.1002/0471142913.faf0102s00. [Google Scholar] [CrossRef]
21. Lee J, Durst RW, Wrolstad RE. Determination of total monomeric anthocyanin pigment content of fruit juices, beverages, natural colorants, and wines by the pH differential method: collaborative study. J AOAC Int. 2005;88(5):1269–78. doi:10.1093/jaoac/88.5.1269. [Google Scholar] [CrossRef]
22. Teng H, Mi Y, Cao H, Chen L. Enzymatic acylation of raspberry anthocyanin: evaluations on its stability and oxidative stress prevention. Food Chem. 2022;372(3):130766. doi:10.1016/j.foodchem.2021.130766. [Google Scholar] [PubMed] [CrossRef]
23. Gillespie KM, Chae JM, Ainsworth EA. Rapid measurement of total antioxidant capacity in plants. Nat Protoc. 2007;2(4):867–70. doi:10.1038/nprot.2007.100. [Google Scholar] [PubMed] [CrossRef]
24. Munteanu IG, Apetrei C. Analytical methods used in determining antioxidant activity: a review. Int J Mol Sci. 2021;22(7):3380. doi:10.3390/ijms22073380. [Google Scholar] [PubMed] [CrossRef]
25. Yu K, Castro-Perez J, Shockcor J. MassFragment for structural elucidation in metabolite ID using exact mass MS. In: Application note. Milford, MA, USA: Waters Corporation; 2008. [Google Scholar]
26. Clifford MN, Johnston KL, Knight S, Kuhnert N. Hierarchical scheme for LC-MSn identification of chlorogenic acids. J Agric Food Chem. 2003;51(10):2900–11. doi:10.1021/jf026187q. [Google Scholar] [PubMed] [CrossRef]
27. Ramabulana AT, Steenkamp P, Madala N, Dubery IA. Profiling of chlorogenic acids from Bidens pilosa and differentiation of closely related positional isomers with the aid of UHPLC-QTOF-MS/MS-based in-source collision-induced dissociation. Metabolites. 2020;10(5):178. doi:10.3390/metabo10050178. [Google Scholar] [PubMed] [CrossRef]
28. Sumner LW, Amberg A, Barrett D, Beale MH, Beger R, Daykin CA, et al. Proposed minimum reporting standards for chemical analysis Chemical Analysis Working Group (CAWG) Metabolomics Standards Initiative (MSI). Metabolomics. 2007;3(3):211–21. doi:10.1007/s11306-007-0082-2. [Google Scholar] [PubMed] [CrossRef]
29. Zainol MK, Abd-Hamid A, Yusof S, Muse R. Antioxidative activity and total phenolic compounds of leaf, root and petiole of four accessions of Centella asiatica (L.) Urban. Food Chem. 2003;81(4):575–81. doi:10.1016/S0308-8146(02)00498-3. [Google Scholar] [CrossRef]
30. Murthy HN, Joseph KS, Paek KY, Park SY. Anthocyanin production from plant cell and organ cultures in vitro. Plants. 2023;13(1):117. doi:10.3390/plants13010117. [Google Scholar] [PubMed] [CrossRef]
31. Araguirang GE, Richter AS. Activation of anthocyanin biosynthesis in high light—what is the initial signal? New Phytol. 2022;236(6):2037–43. doi:10.1111/nph.18488. [Google Scholar] [PubMed] [CrossRef]
32. Kakegawa K, Hattori E, Koike K, Takeda| K. Induction of anthocyanin synthesis and related enzyme activities in cell cultures of Centaurea cyanus by UV-light irradiation. Phytochemistry. 1991;30(7):2271–3. doi:10.1016/0031-9422(91)83628-X. [Google Scholar] [CrossRef]
33. Sato K, Nakayama M, Shigeta JI. Culturing conditions affect the production of anthocyanin in suspended cell cultures of strawberry. Plant Sci. 1996;113:91–8. doi:10.1016/0168-9452(95)05694-7. [Google Scholar] [CrossRef]
34. Chan LK, Koay SS, Boey PL, Bhatt A. Effects of abiotic stress on biomass and anthocyanin production in cell cultures of Melastoma malabathricum. Biol Res. 2010;43(1):127–35. [Google Scholar] [PubMed]
35. Hasanuzzaman M, Bhuyan MHMB, Zulfiqar F, Raza A, Mohsin SM, Mahmud JA, et al. Reactive oxygen species and antioxidant defense in plants under abiotic stress: revisiting the crucial role of a universal defense regulator. Antioxidants. 2020;9(8):681. doi:10.3390/antiox9080681. [Google Scholar] [PubMed] [CrossRef]
36. Cao X, Yang L, Xue Q, Yao F, Sun J, Yang F, et al. Antioxidant evaluation-guided chemical profiling and structure-activity analysis of leaf extracts from five trees in Broussonetia and Morus (Moraceae). Sci Rep. 2020;10(1):4808. doi:10.1038/s41598-020-61709-5. [Google Scholar] [PubMed] [CrossRef]
37. Zhu L, Liao Y, Zhang T, Zeng Z, Wang J, Duan L, et al. Reactive oxygen species act as the key signaling molecules mediating light-induced anthocyanin biosynthesis in Eucalyptus. Plant Physiol Biochem. 2024;212:108715. doi:10.1016/j.plaphy.2024.108715. [Google Scholar] [PubMed] [CrossRef]
38. Cerqueira JVA, de Andrade MT, Rafael DD, Zhu F, Martins SVC, Nunes-Nesi A, et al. Anthocyanins and reactive oxygen species: a team of rivals regulating plant development? Plant Mol Biol. 2023;112(4–5):213–23. doi:10.1007/s11103-023-01362-4. [Google Scholar] [PubMed] [CrossRef]
39. Alcázar Magaña A, Kamimura N, Soumyanath A, Stevens JF, Maier CS. Caffeoylquinic acids: chemistry, biosynthesis, occurrence, analytical challenges, and bioactivity. Plant J. 2021;107(5):1299–319. doi:10.1111/tpj.15390. [Google Scholar] [PubMed] [CrossRef]
40. Murthy HN, Lee EJ, Paek KY. Production of secondary metabolites from cell and organ cultures: strategies and approaches for biomass improvement and metabolite accumulation. Plant Cell Tiss Org Cult. 2014;118:1–16. [Google Scholar]
41. Chandran H, Meena M, Barupal T, Sharma K. Plant tissue culture as a perpetual source for production of industrially important bioactive compounds. Biotechnol Rep. 2020;26(5):e00450. doi:10.1016/j.btre.2020.e00450. [Google Scholar] [PubMed] [CrossRef]
42. Hashim M, Ahmad B, Drouet S, Hano C, Abbasi BH, Anjum S. Comparative effects of different light sources on the production of key secondary metabolites in plants in vitro cultures. Plants. 2021;10(8):1521. doi:10.3390/plants10081521. [Google Scholar] [PubMed] [CrossRef]
43. Nomura T, Kato Y. Activation of cryptic secondary metabolite biosynthesis in tobacco BY-2 suspension cells by epigenetic modifiers. Appl Biochem Biotechnol. 2025;197(2):1225–41. doi:10.1007/s12010-024-05096-x. [Google Scholar] [PubMed] [CrossRef]
44. Yan W, Li J, Lin X, Wang L, Yang X, Xia X, et al. Changes in plant anthocyanin levels in response to abiotic stresses: a meta-analysis. Plant Biotechnol Rep. 2022;16(5):497–508. doi:10.1007/s11816-022-00777-7. [Google Scholar] [CrossRef]
45. Artés-Hernández F, Castillejo N, Martínez-Zamora L. UV and visible spectrum LED lighting as abiotic elicitors of bioactive compounds in sprouts, microgreens, and baby leaves-a comprehensive review including their mode of action. Foods. 2022;11(3):265. doi:10.3390/foods11030265. [Google Scholar] [PubMed] [CrossRef]
46. Zhang S, Zhang L, Zou H, Qiu L, Zheng Y, Yang D, et al. Effects of light on secondary metabolite biosynthesis in medicinal plants. Front Plant Sci. 2021;12:781236. doi:10.3389/fpls.2021.781236. [Google Scholar] [PubMed] [CrossRef]
47. Chen DQ, Li ZY, Pan RC, Wang XJ. Anthocyanin accumulation mediated by blue light and cytokinin in Arabidopsis seedlings. J Integr Plant Biol. 2006;48(4):420–5. doi:10.1111/j.1744-7909.2006.00234.x. [Google Scholar] [CrossRef]
48. Wang LZ, Hu YB, Zhang HH, Xu N, Zhang XL, Sun GY. Photoprotective mechanisms of leaf anthocyanins: research progress. J Appl Ecol. 2012;23(3):835–41. [Google Scholar]
49. Tena N, Martín J, Asuero AG. State of the art of anthocyanins: antioxidant activity, sources, bioavailability, and therapeutic effect in human health. Antioxidants. 2020;9(5):451. doi:10.3390/antiox9050451. [Google Scholar] [PubMed] [CrossRef]
50. Osmani SA, Hansen EH, Malien-Aubert C, Olsen CE, Bak S, Møller BL. Effect of glucuronosylation on anthocyanin color stability. J Agric Food Chem. 2009;57(8):3149–55. doi:10.1021/jf8034435. [Google Scholar] [PubMed] [CrossRef]
51. Ondeko DA, Juma BF, Baraza LD, Nyongesa PK. LC-ESI/MS and GC-MS methanol extract analysis, phytochemical and antimicrobial activity studies of Centella asiatica. Asian J Chem Sci. 2020;8(3):32–51. doi:10.9734/ajocs/2020/v8i319046. [Google Scholar] [CrossRef]
52. Kovinich N, Kayanja G, Chanoca A, Riedl K, Otegui MS, Grotewold E. Not all anthocyanins are born equal: distinct patterns induced by stress in Arabidopsis. Planta. 2014;240(5):931–40. doi:10.1007/s00425-014-2079-1. [Google Scholar] [PubMed] [CrossRef]
Cite This Article
 Copyright © 2025 The Author(s). Published by Tech Science Press.
This work is licensed under a Creative Commons Attribution 4.0 International License , which permits unrestricted use, distribution, and reproduction in any medium, provided the original work is properly cited.
 Downloads
 Citation Tools