
 Submit a Paper
 Propose a Special lssue
 Open Access
ARTICLE

Salt Tolerance of Different Maize Genotypes during Germination and Seedling Stages
Department of Organic Agriculture Management, Applied Technology and Management School of Silifke, Mersin University, Mersin, 33900, Turkiye
* Corresponding Authors: Gülay Zulkadir. Email: or
(This article belongs to the Special Issue: Plant Responses to Stress Factors)
Phyton-International Journal of Experimental Botany 2025, 94(6), 1879-1896. https://doi.org/10.32604/phyton.2025.064144
Received 06 February 2025; Accepted 21 May 2025; Issue published 27 June 2025
 View Full Text
 Download PDF
Abstract
Soil salinization is a prominent global environmental issue that considerably affects the sustainable development of agriculture worldwide. Maize, a key crop integral to the global agricultural economy, is especially susceptible to the detrimental impacts of salt stress, which can impede its growth and development from the germination phase through to the seedling stage. Soil salinity tends to escalate due to improper irrigation methods, particularly in arid and semi-arid environments. Consequently, it is essential to evaluate potential genotypes and select those with high salt tolerance. In this study, 39 popcorn kernel genotypes were examined under varying salinity levels (0, 100, and 200 mM NaCl). Notable declines in seedling growth and significant differences in stress responses were recorded in relation to salinity levels. The application of 200 mM NaCl was found to severely hinder the growth of sensitive species such as maize, adversely impacting both the germination rate and speed. Even when germination occurred, subsequent seedling development was stunted. Therefore, it is advisable to utilize salinity concentrations below 200 mM in research focused on seedling development stages. The assessment of genotypes for their adaptability to saline conditions indicated that genotypes 4, 33, 12, 28, 18, 21, 25, 37, 16, and 31 exhibited high salt tolerance, while genotypes 1, 17, 35, and 36 were identified as susceptible. It is recommended that the more resilient genotypes be utilized in regions affected by salt stress or incorporated into breeding programs.Keywords
Plant growth and productivity are profoundly influenced by abiotic stressors, including salinity, drought, and extreme temperature conditions. The impact of these stressors has intensified as a consequence of global warming. Specifically, the prevalence of salt stress has escalated due to suboptimal fertilization and irrigation practices in agricultural settings [1]. Presently, approximately 20% of the world’s arable land is impacted by salt stress [2], with projections indicating that this figure could rise to 50% by the year 2050 [3]. Despite various initiatives aimed at mitigating soil salinity, these measures have proven neither practical nor sustainable. Conversely, research has been directed towards developing strategies to enhance plant resilience to salt stress [4–8]. Nonetheless, some scholars have posited that breeding salt-tolerant genotypes represents a more viable approach [9]. Consequently, numerous investigations have been undertaken to assess the salt tolerance of different genotypes, revealing significant genetic diversity in salt tolerance among them [10,11]. The examination of pre-harvest stages in plants and the assessment of plant yield are recognized as lengthy and challenging endeavors. Additionally, considerable labor is necessary to evaluate a large number of genotypes. Data obtained from germination and seedling stages can yield significant, efficient, and rapid insights into the stress tolerance or susceptibility of plants [2]. Conversely, plants are particularly vulnerable to stress during the germination and early seedling phases [12–14]. Therefore, research conducted during these critical periods is essential.
Maize (Zea mays L.) was domesticated approximately 9000 years ago in the mountainous regions of Mexico and subsequently spread first across the American continent, and later to Europe, Asia, and Africa following the discovery of the New World [15]. Centuries of continuous cultivation and adaptation to diverse environments have resulted in significant genetic diversity within this crop. Today, hundreds of landraces distributed globally serve as a tangible representation of this diversity [16]. Unlike hybrids, maize landraces are heterogeneous, meaning that each landrace population consists of various genotypes. Farmers continually select these varieties based on characteristics such as resistance to pests and diseases, prolificacy, flowering dynamics, plant architecture, and reliable yield performance [15,17].
It has been proposed that enhancing genetic diversity among indigenous varieties may serve as an alternative strategy to alleviate the impacts of climate change, as these varieties often possess the ability to adapt to challenging conditions and endure various biotic and abiotic stressors [18]. Indigenous maize varieties encompass valuable genetic agricultural traits, including adaptability to harsh environments, early maturity, yield potential, and stability across diverse conditions, which can be leveraged in genetic enhancement initiatives [19]. Beyond agronomic assessments, there is a need for alternative approaches to identify promising germplasm under stress conditions. Farooq et al. [20] advocated for experiments in which genotypes are subjected to salinity stress. The evaluation of salt tolerance among various genotypes represents the initial phase in identifying appropriate genetic donors. Given that assessing salt tolerance in multiple genotypes through grain yield is both time-intensive and expensive, examining salt tolerance during the early growth stages of these genotypes may provide a more cost-effective and efficient strategy to expedite the breeding of salinity-resistant varieties.
The early seedling stage of maize provides a reliable indicator of salt stress tolerance, allowing for a more efficient screening of genotypes for breeding programs aimed at enhancing resilience to salinity.
2.1 Plant Material and Growth Conditions
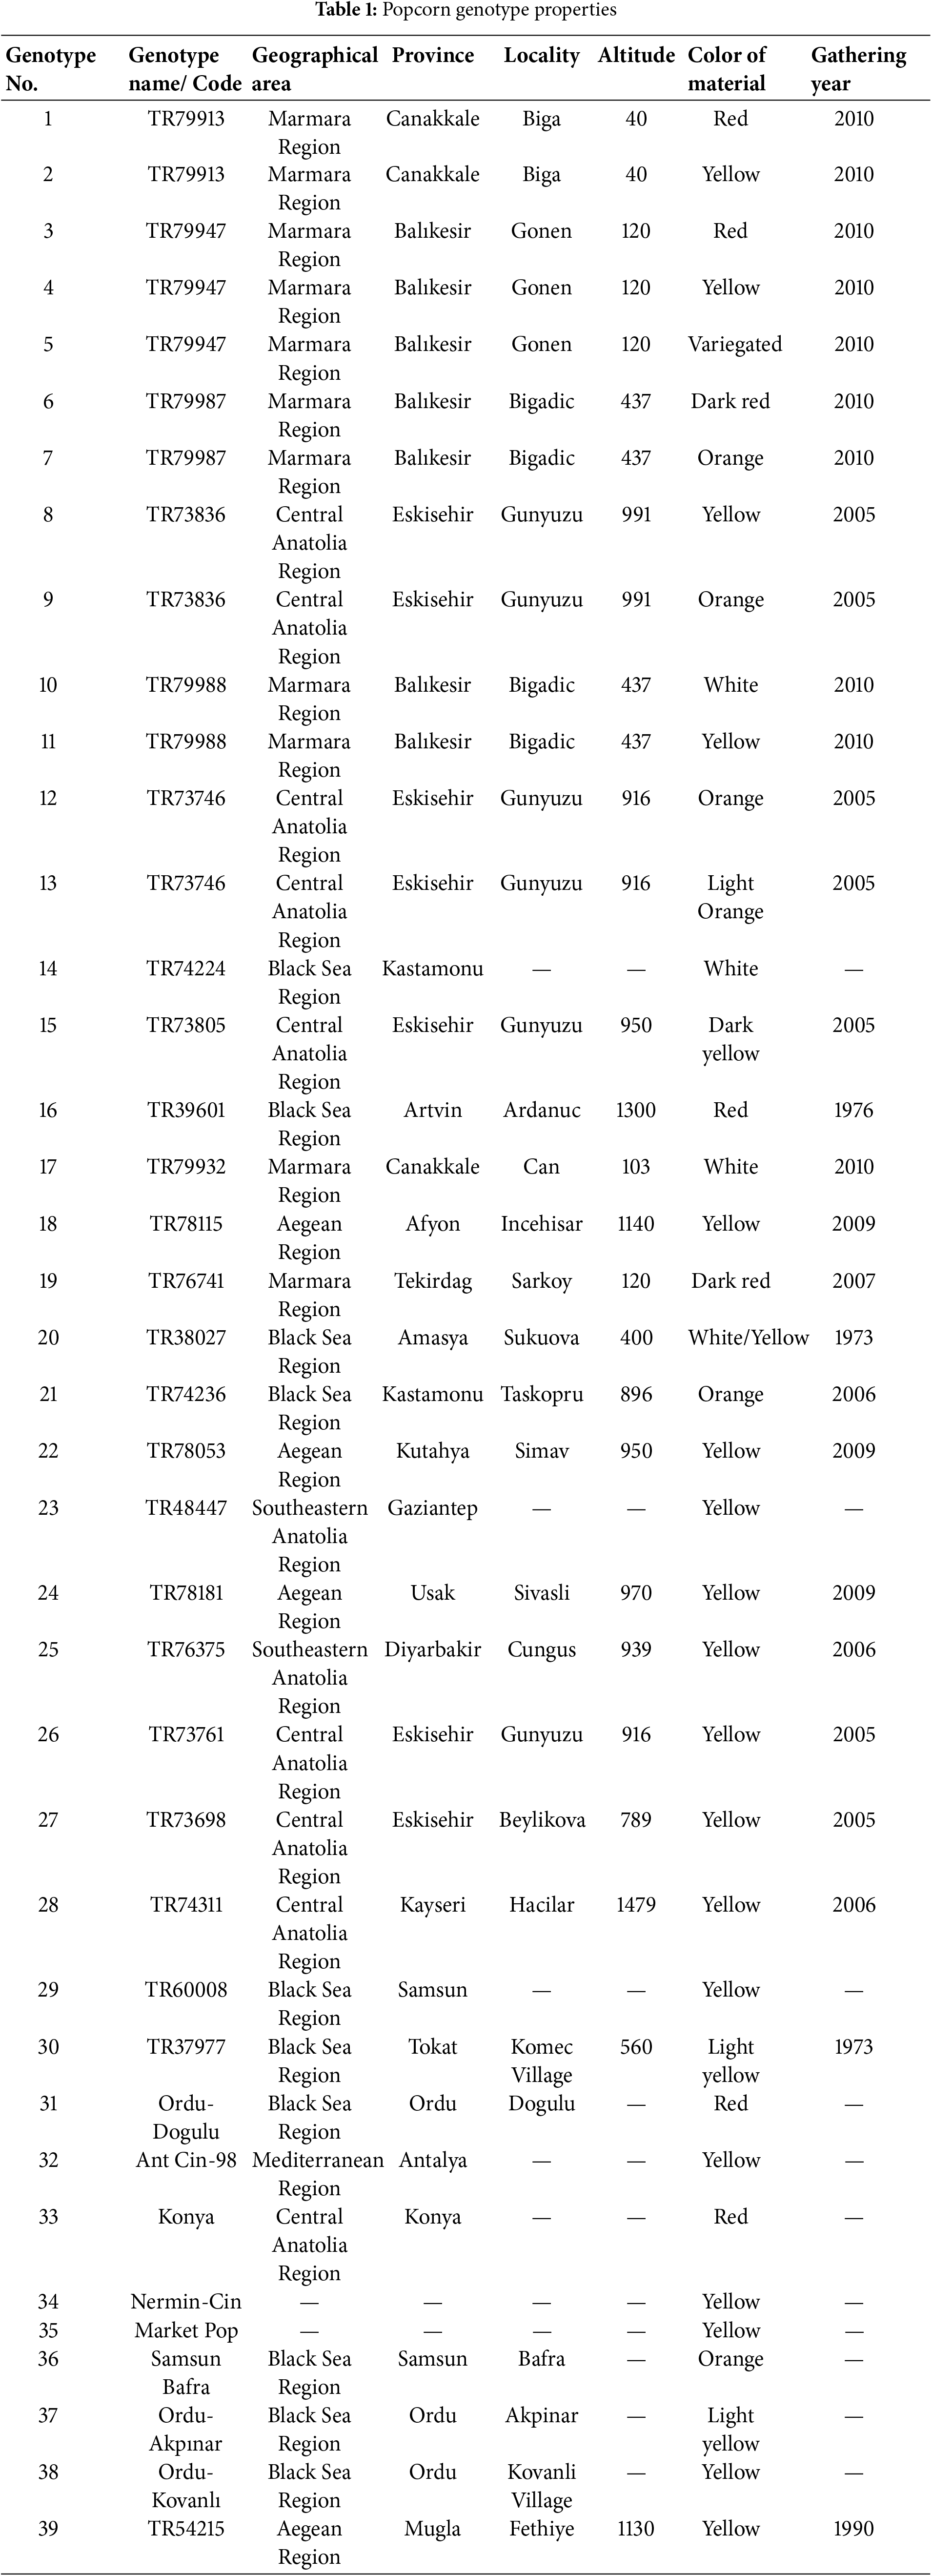
This research involved 39 different genotypes of popcorn (Zea mays everta L.) kernels, which were obtained from the Aegean Agricultural Research Institute, the National Gene Bank, and various farmers throughout Turkey. Specific characteristics of these genotypes, including their collection locations, are detailed in Table 1. The genotypes used in this study are plants that are grown in different geographical places of Turkey and adapted to the environments where they are located. ‘Ant Cin 98’ and ‘Nermin Cin’ varieties are the varieties registered by using these genotypes. These varieties, which were scientifically studied and standardized, were also used as control types.
The assessment of salt tolerance for these genotypes was carried out during the germination and seedling growth phases through two distinct experiments: one focusing on germination and the other on seedling development. Both experiments were performed at a controlled temperature of 18°C ± 2°C under a 12-h light cycle.
2.2 Germination Test and Property Measurements
A factorial experiment was performed to investigate the impact of different salt concentrations on the germination indices of 39 popcorn genotypes. The study utilized a randomized block design with two factors and was replicated three times. The genotypes served as the primary factor, while the salt concentrations (0, 100, and 200 mM NaCl) constituted the secondary factor. Prior to the experiments, seeds from various genotypes were disinfected using a 5% sodium hypochlorite solution for a duration of 5 min, followed by three rinses with tap water and one rinse with deionized water (dH2O). Subsequently, the seeds were placed on blotting paper to eliminate excess moisture at room temperature. A double layer of Whatman No. 2 filter paper was then positioned in 10 cm-diameter petri dishes, with 20 sterilized seeds allocated to each dish. To facilitate germination, 10 mL of solution was introduced into each petri dish, while only dH2O was used for the control samples. Germination data were recorded every 24 h over a period of 8 days, with germination defined as the emergence of coleoptiles or roots measuring at least 2 mm in length (Fig. 1). The study assessed germination parameters, including the maximum germination rate (Gmax%) and mean germination time (MGT), calculated according to the methodology established by Al-Mudaris [21].
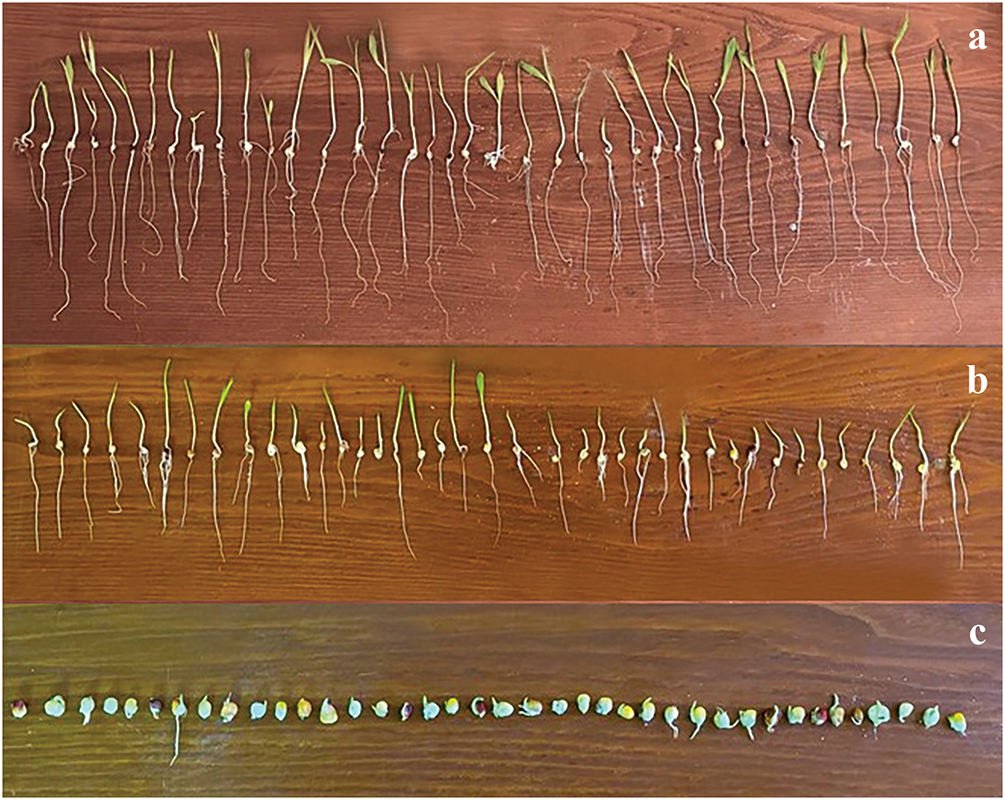
Figure 1: General appearance of the plants belonging to the experiment. (a) Plants belonging to the control group; (b) Plants belonging to the 100 mM salt application group; (c) Plants belonging to the 200 mM salt application group
2.3 Seedling Test and Property Measurements
The seedling experiment was designed using a factorial approach within a randomized block trial framework, incorporating two factors and conducted in three replicates. In this study, seeds were germinated in 5-L plastic containers equipped with lids. For each genotype, fifteen surface-sterilized seeds were arranged in separate rows between two sheets of blotting paper, which were then rolled and placed inside the plastic containers. To ensure adequate oxygen supply, holes were created in the lids of the containers. Germination was initiated by adding a sufficient solution to saturate the blotting paper. The seedlings were allowed to develop for a period of 21 days, while various seeds, including shoot length (SL), root length (RL), shoot moisture rate (SMR), root fresh weight (RFW), shoot dry weight (SDW) and Root Dry Weight (RDW), various seeds growth performance parameters were evaluated according to the International Seed Testing Association (ISTA) protocols [22]. The measurements for SFW, RFW, SDW, and RDW were taken using an electronic balance with an accuracy of ±0.001 g. The vigor index (VI) was calculated by multiplying the seedling length by the germination rate, as outlined by Abdul-Baki and Anderson [23].
Stress tolerance index (STI) was calculated with the equation proposed by Fernandez [24] with germination and seedling property data measured under control and salinity conditions.
where XC and XS are control and salinity measurements, xC is the mean property measurement for all genotypes in the control experiment.
Germination and seedling data were subjected to analysis of variance (ANOVA) using JMP Pro 17.0 package program utilizing a factorial random block design, with genotypes and salt concentrations designated as factor A and factor B, respectively. The significance of the interrelationships among all potential pairs of germination and seedling characteristics under both control and saline conditions was assessed using the Pearson correlation coefficient. Additionally, principal component analysis (PCA) was performed using PAST 4 program on the germination and seedling traits of all genotypes in both control and stress environments. To classify the genotypes according to their salt tolerance and stress tolerance index (STI) across various germination and seedling traits, Ward’s cluster analysis was employed. The distance between clusters was quantified using the squared Euclidean distance.
3.1 Maximum Germination Rate (Gmax%)
Analysis of the data indicated that the highest germination rate exhibited significant variation (p < 0.01) in relation to both genotype (G) and salt concentration (S) as shown in Fig. 2. Furthermore, the interaction between G and S resulted in notable differences (p < 0.01). A comprehensive analysis indicated that the germination rate significantly declined with increasing salt concentration, with the exception of genotypes 6, 8, 13, 16, 19, 22, 27, 29, 37, 38, and 39. Notably, a salinity level of 100 mM enhanced the germination rate in these specific genotypes when compared to the control group, or yielded results comparable to those of the control.
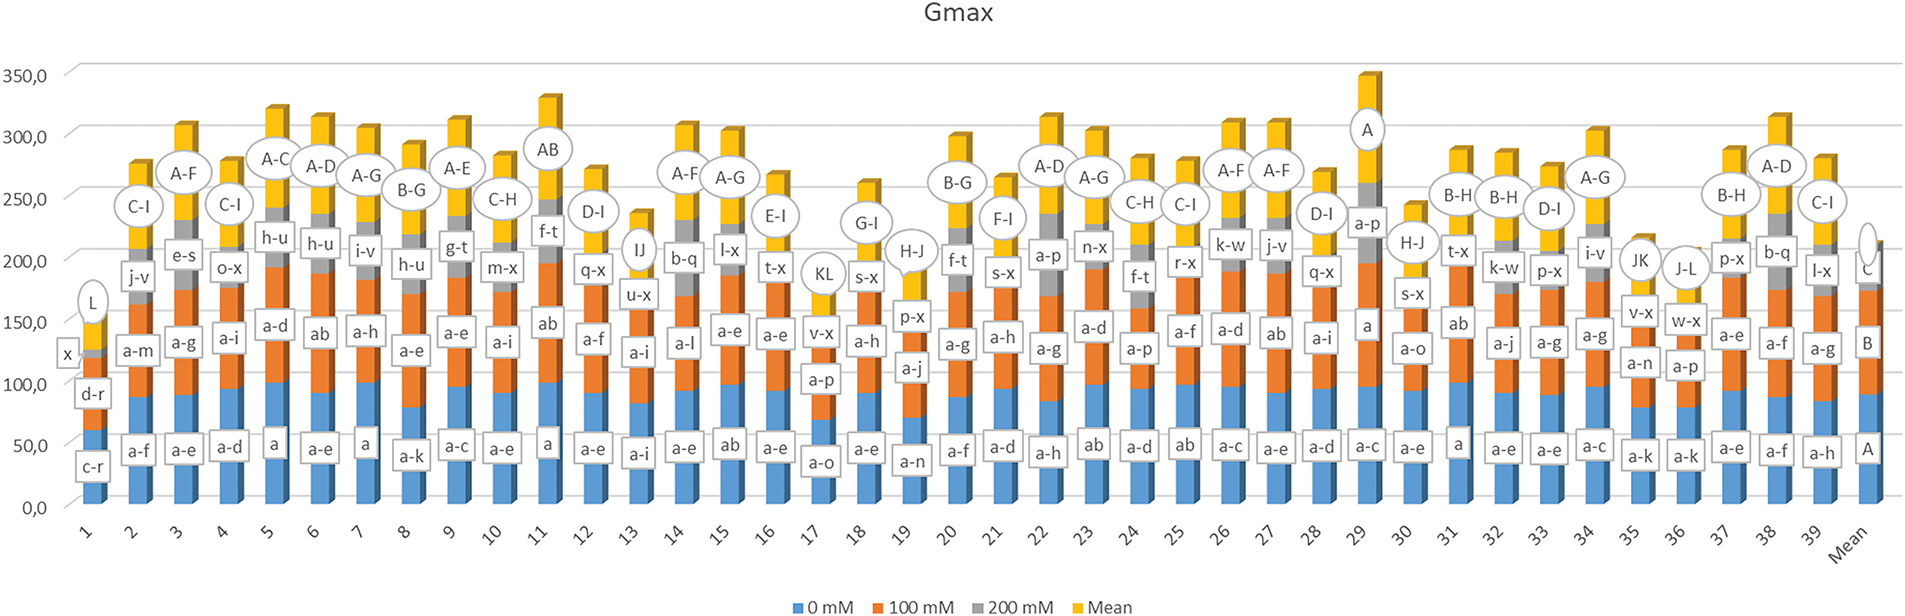
Figure 2: Mean maximum germination in different salt concentrations (0, 100 and 200 mM) and 39 popcorn genotypes. Means are averaged over three replicates and means with a different letter varied significantly at p < 0.05
The average germination rates across different salt concentrations [0 mM (S1), 100 mM (S2), and 200 mM (S3)] were recorded as 88.761%, 83.889%, and 37.222%, respectively, with mean germination rates ranging from 41.667% for genotype 1 (G1) to 86.667% for genotype 29 (G29). The maximum germination rate for the S × G interaction varied from 6.667% (G1-S3) to 100% (G29-S2), and it was observed that the interactions G5-S1, G11-S1, G7-S1, and G31-S1 produced statistically similar results to the G29-S2 interaction (98.333%).
3.2 Mean Germination Time (MGT)
The mean germination time (MGT) for various genotypes that were irrigated with water that included different salt concentrations and related statistical categories are presented in Fig. 3. The findings revealed statistically significant differences (p < 0.01) between the genotypes and salt concentrations. Furthermore, G × S interaction MGT values also exhibited significant differences. The mean MGT values varied between 5.909 (G3) and 9.908 days (G13) across the genotypes, while the mean MGT at different salt concentrations were 5.489, 7.623, and 11.856 days. Based on the G × S interaction, MGT varied between 2.523 and 14.000 days, and the application where the quickest germination was observed was the G3-S1, the G × S interactions that led to the latest germination were G31-S3 and G35-S3.
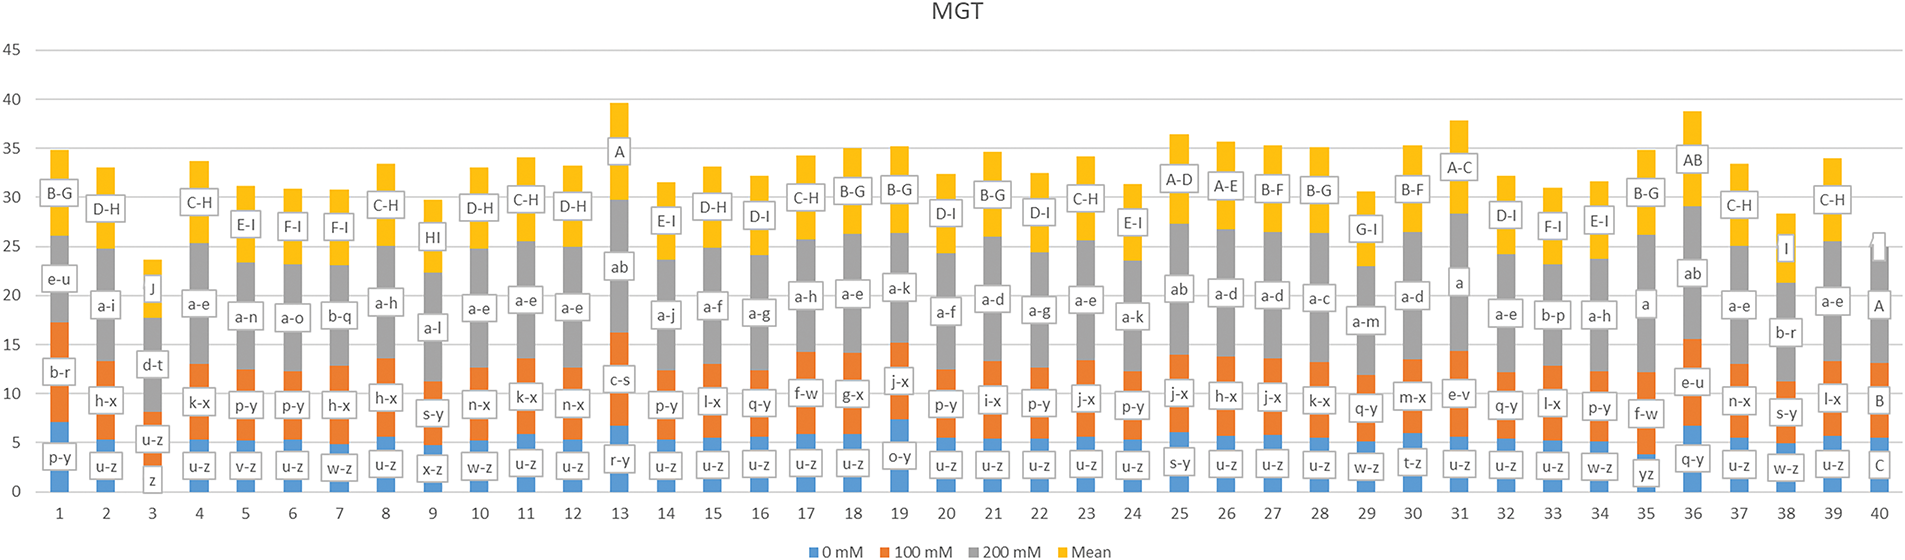
Figure 3: Mean germination time under various salt concentrations (0, 100 and 200 mM) and 39 popcorn genotypes. Means are averaged over three replicates and means with a different letter varied significantly at p < 0.05
The results of the mean germination index and the classifications derived from the Tukey test are summarized in Fig. 4. Statistically significant differences (p < 0.01) were identified among the germination index (GI) values influenced by the factors G, S, and their interaction (G × S). The data for the G × S interaction ranged from 0.100 to 10.450, with an average GI of 2.204. The interaction yielding the lowest GI was G1-S3, closely followed by G36-S3, both of which fell into the same statistical category. Conversely, the highest GI was recorded for the G3-S1 interaction, which was categorized distinctly from all other combinations. It was noted that an increase in salt concentration corresponded with a decrease in GI. The mean GI values across varying salt concentrations were 3.550, 2.398, and 0.663, while the mean GI ranged from 1.046 for genotype G1 to 5.008 for genotype G3.
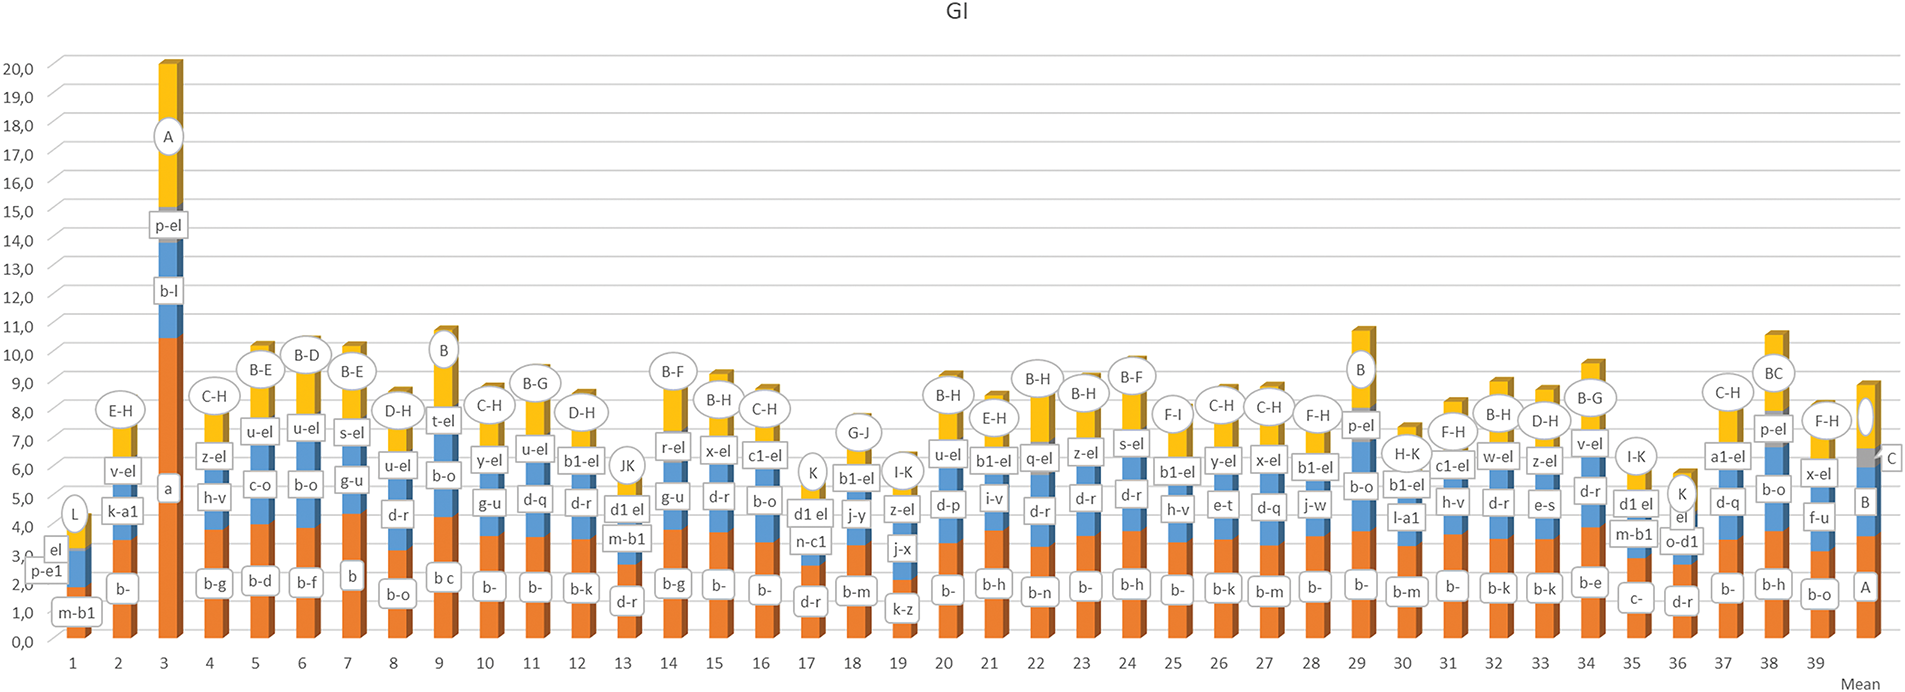
Figure 4: Mean germination index measured with different salt concentrations (0, 100 and 200 mM) and 39 popcorn genotypes. Means are averaged over three replicates and means with a different letter varied significantly at p < 0.05
The average shoot length for maize genotypes, influenced by different salt concentrations, along with the results of the multiple comparison test, is detailed in Fig. 5. A significant variation in shoot length (SL) was observed (p < 0.01) due to the effects of genotype (G), salt concentration (S), and their interaction (G × S). Overall, a notable decline in SL was recorded across all genotypes as salt concentration increased. The results ranged from 0.310 to 17.107 cm, contingent upon the G × S interaction. The G23-S1 interaction yielded the highest SL, categorizing it distinctly from the other genotypes. Conversely, the G35-S3 interaction resulted in the lowest SL. Most of the lower SL values were associated with the application of 200 mM salt, with the exceptions being G23-S3, G34-S3, G22-S3, G28-S3, G38-S3, G37-S3, G7-S3, and G35-S3 interactions, which were found to be statistically similar. The mean SL values recorded were 13.080 cm at 0 mM, 3.247 cm at 100 mM, and 0.651 cm at 200 mM, while the mean SL varied from 3.482 cm (G18) to 8.184 cm (G22) based on genotype.
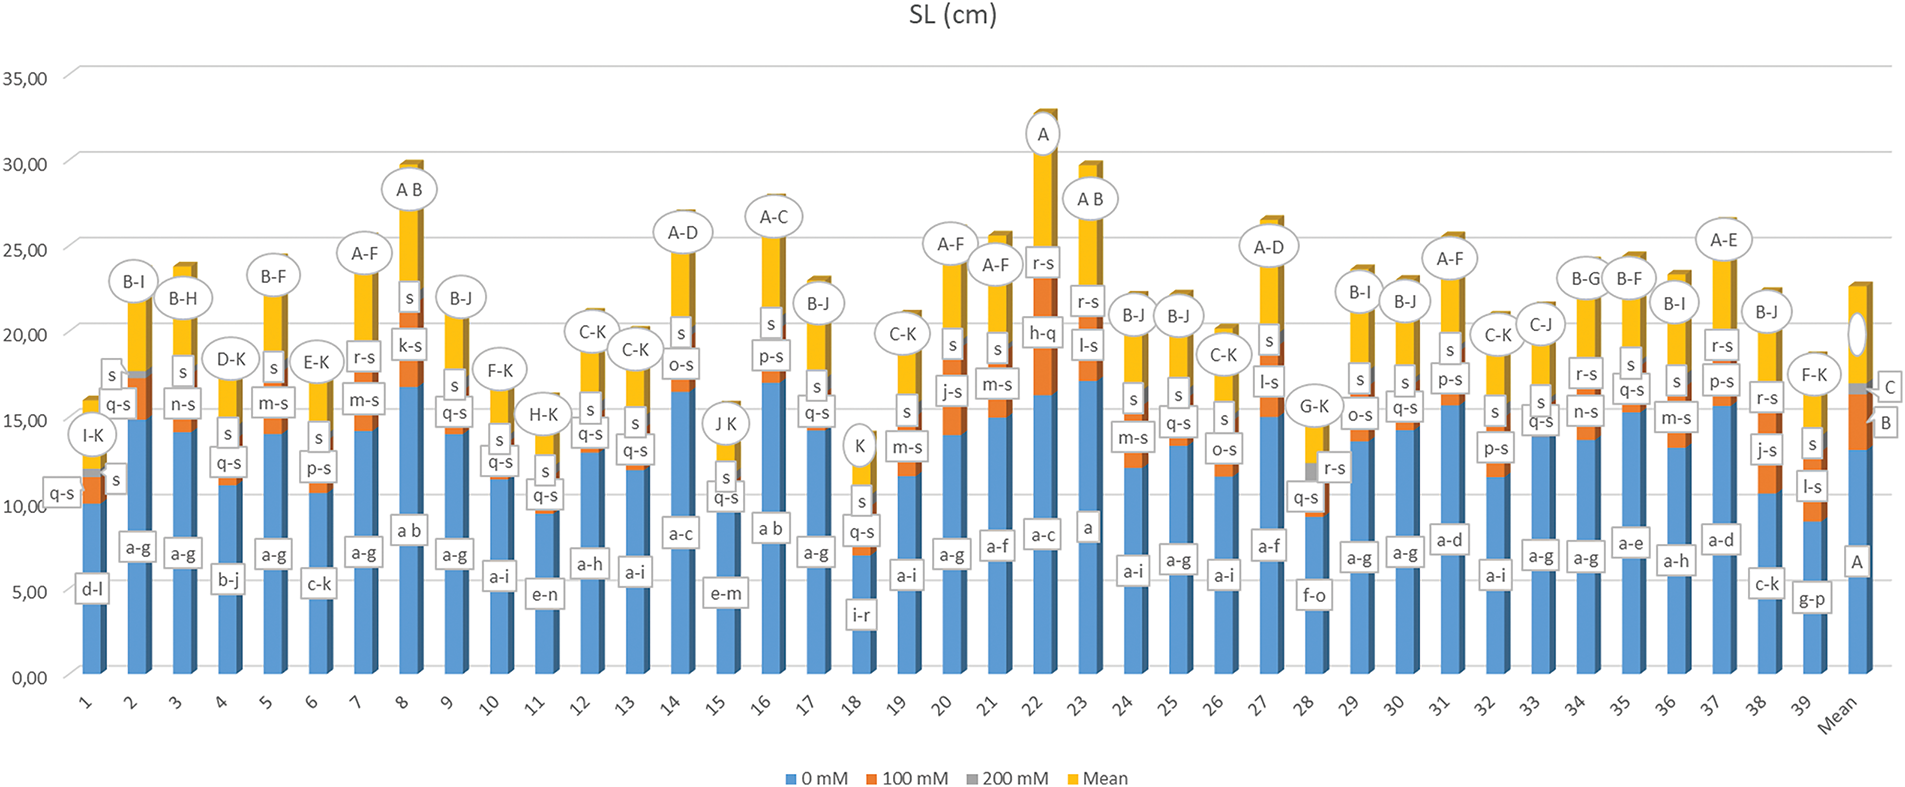
Figure 5: Mean shoot length under different salt concentrations (0, 100 and 200 mM) and 39 popcorn genotypes. Means are averaged over three replicates and means with a different letter varied significantly at p < 0.05
The examination of root length (RL) data is summarized in Fig. 6, revealing that the effects of genotype, salt concentration, and the genotype by salt interaction (G × S) were statistically significant (p < 0.01). The findings indicated that higher salt concentrations resulted in a notable reduction in root length, with values ranging from 0.150 to 23.547 cm depending on the G × S interaction. The longest root length was recorded for the G34-S1 interaction, while the shortest was associated with the G17-S3 interaction. At a salt concentration of 200 mM, all genotypes, including interactions such as G35-S2, G10-S2, G17-S2, G18-S2, G15-S2, G33-S2, and G9-S2, exhibited reduced root lengths, with G17 being statistically comparable to S3. The mean RL varied from 1.993 cm (G9) to 10.892 cm (G22), and RL values were measured at 17.474, 4.083, and 0.632 cm as salt concentration increased.
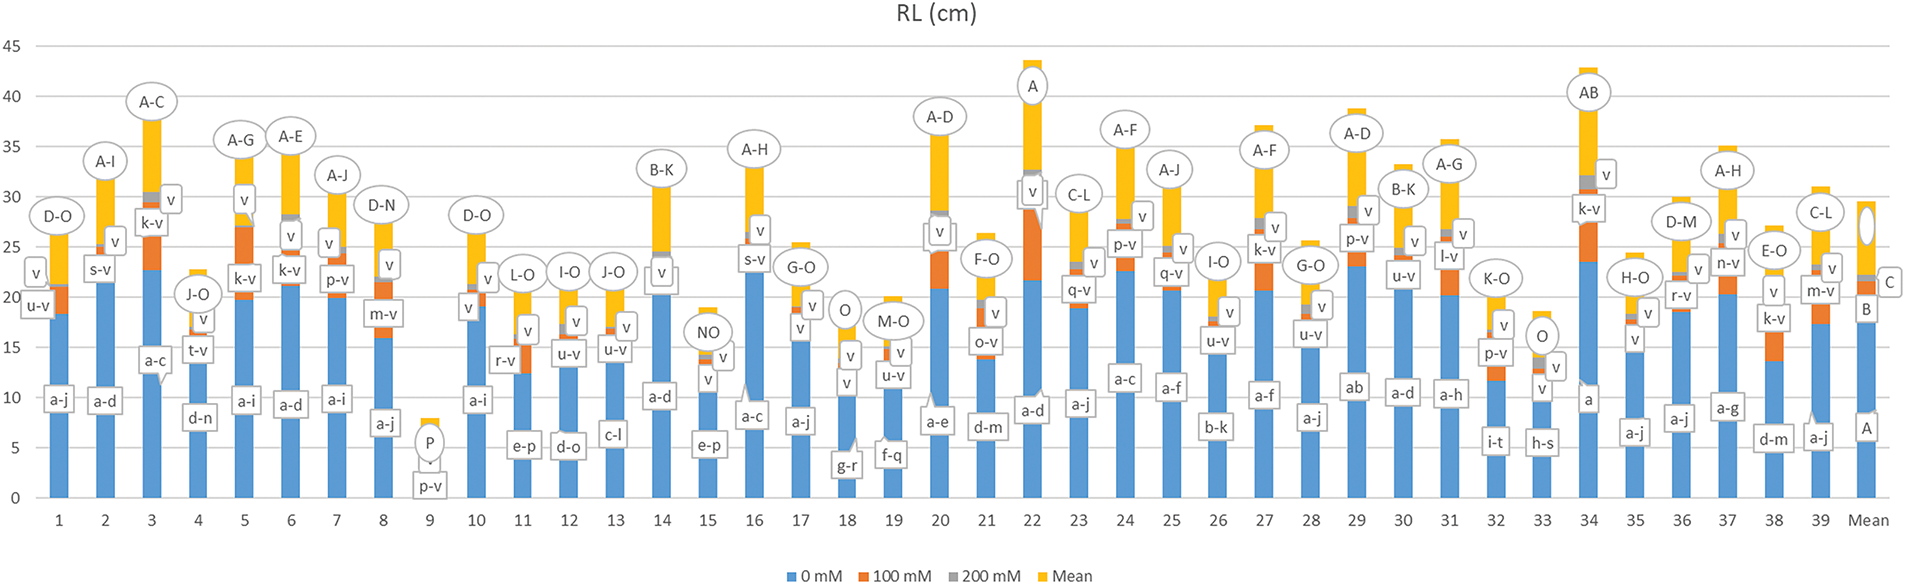
Figure 6: Mean root length under different salt concentrations (0, 100 and 200 mM) and 39 popcorn genotypes. Means are averaged over three replicates and means with a different letter varied significantly at p < 0.05
The data regarding mean seedling length (SdL) and the corresponding statistical categories are summarized in Fig. 7. The analysis revealed that genotype, salt application, and their interactions (G × S) resulted in statistically significant differences (p < 0.01). Seedling lengths ranged from 0.770 to 39.533 cm, with the G16-S1 interaction yielding the longest seedling length, while the G2-S3 interaction produced the shortest. Notably, the interactions G28-S2, G35-S2, G18-S2, G1-S2, G10-S2, G17-S2, G9-S2, G15-S2, and G33-S2, along with all samples treated with a 200 mM salt solution, were categorized similarly to the G2-S3 interaction, indicating shorter seedling lengths. The mean seedling lengths were recorded as 30.554 cm for the 0 mM salt concentration, 7.329 cm for 100 mM, and 1.329 cm for 200 mM, demonstrating a significant reduction in seedling length across all genotypes with increasing salt concentration. Furthermore, the mean seedling length varied by genotype, ranging from 7.729 cm (G9) to 19.076 cm (G22), with an overall mean of 13.055 cm for all samples.
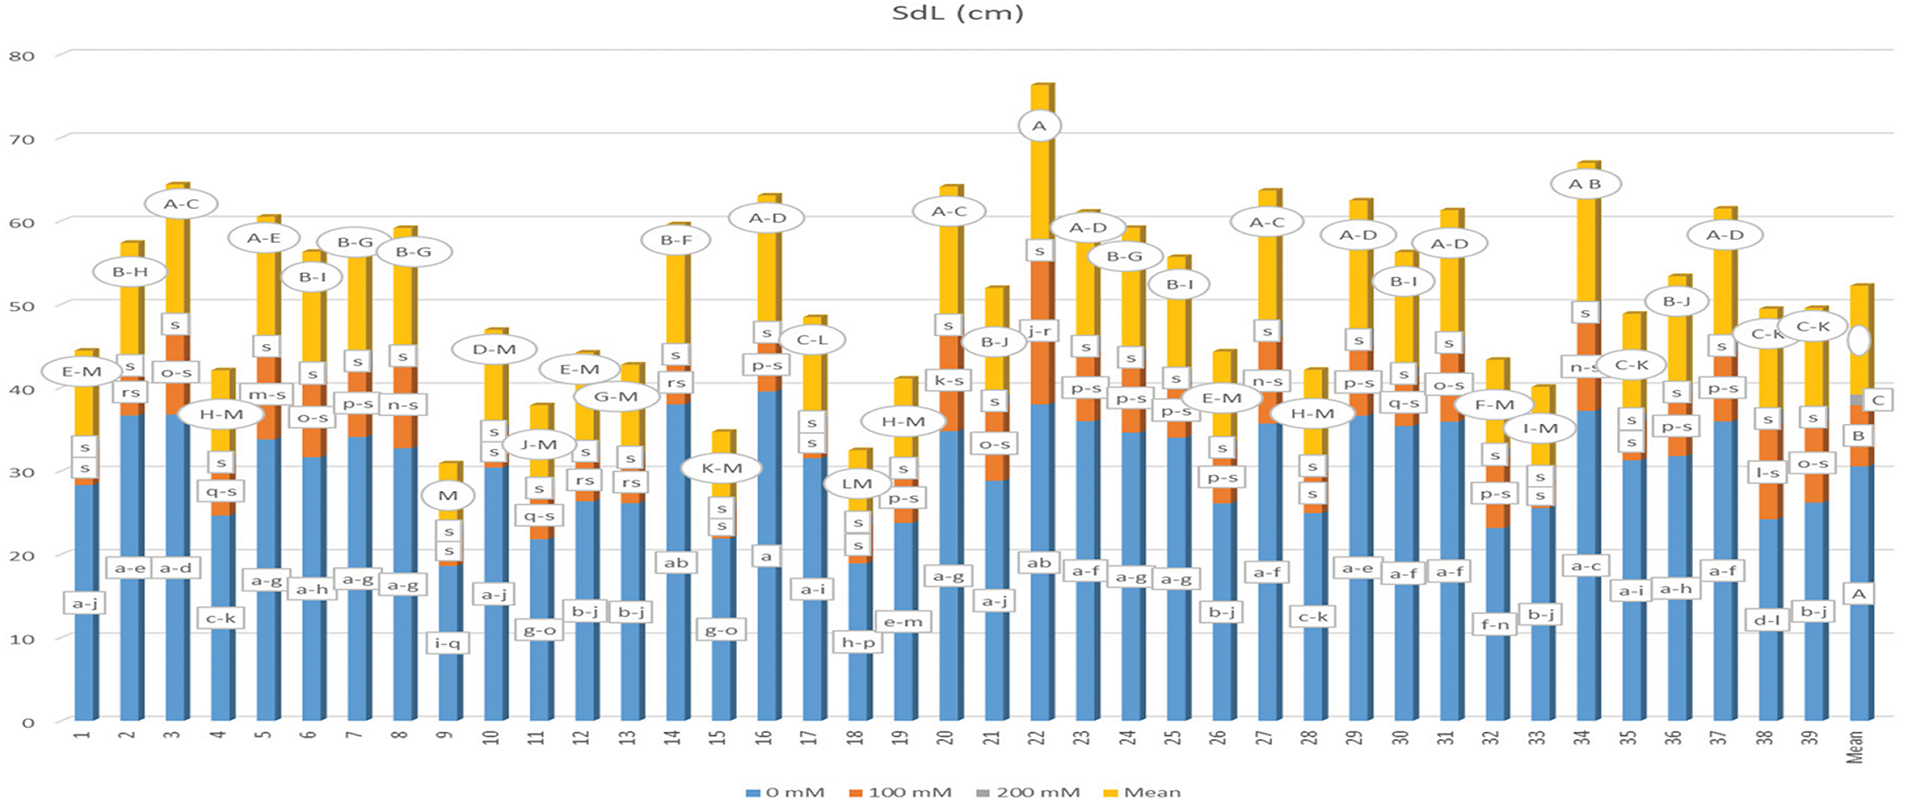
Figure 7: Mean seedling length under different salt concentrations (0, 100 and 200 mM) and 39 popcorn genotypes. Means are averaged over three replicates and means with a different letter varied significantly at p < 0.05
The data regarding the seedling vigor index (SVI) are summarized in Fig. 8. Analysis revealed that the main effects of genotype (G), salt concentration (S), and their interaction (G × S) resulted in statistically significant differences (p < 0.01). The SVI exhibited a range from 8.270 (G13-S3) to 3602.500 (G16-S1) as influenced by the G × S interaction, with an overall mean SVI of 1163.872. When considering genotype alone, the mean SVI ranged from 660.510 (G1) to 1576.62 (G34). Additionally, the mean SVI values were recorded as 2797.728 for 0 mM, 645.891 for 100 mM, and 47.998 for 200 mM of salt concentration.
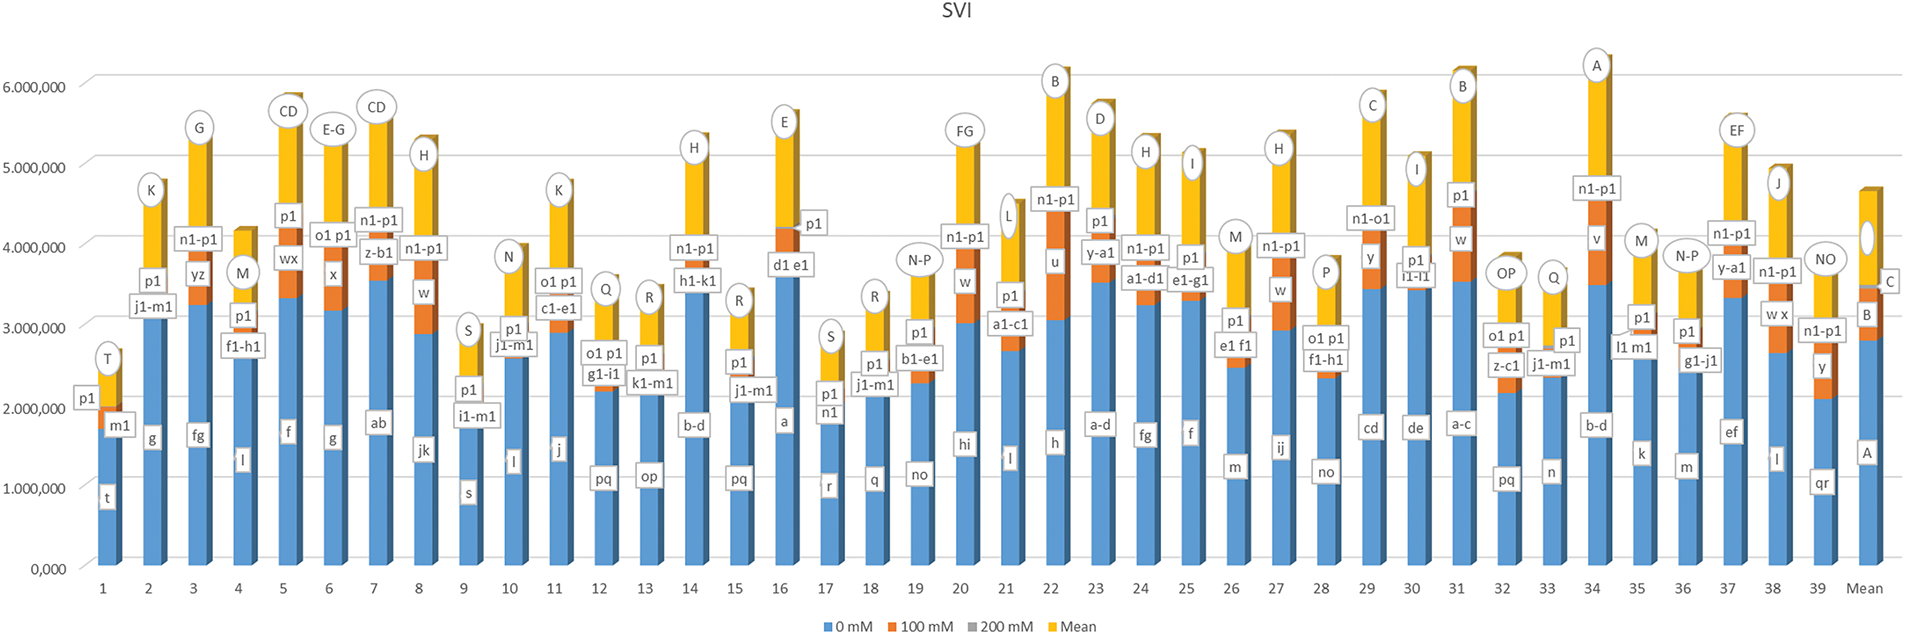
Figure 8: Mean seedling vigor index under different salt concentrations (0, 100 and 200 mM) and 39 popcorn genotypes. Means are averaged over three replicates and means with a different letter varied significantly at p < 0.05
The average shoot moisture rate (SMR) in the studied plants, along with the statistical categorical distribution of the data, is detailed in Fig. 9. Significant differences were noted among all G, S, and G × S interaction applications at a 1% significance level. The mean SMR ranged from 9.275% to 23.465%, with genotype G31 exhibiting the highest moisture content, while genotype G1 displayed the lowest. Additionally, genotypes G28 (9.339%) and G7 (9.681%) were found to have the lowest SMR values, with no significant difference observed between these genotypes and G1. An increase in salt concentration resulted in moisture levels of 30.989%, 8.785%, and 3.512%, corresponding to varying salt concentrations. The SMR was found to fluctuate between 0.209% (G1-S3) and 56.436% (G31-S1) when considering the G × S interaction, with the G3-S3 interaction yielding the second lowest SMR at 0.333%, categorically similar to the G1-S3 interaction.
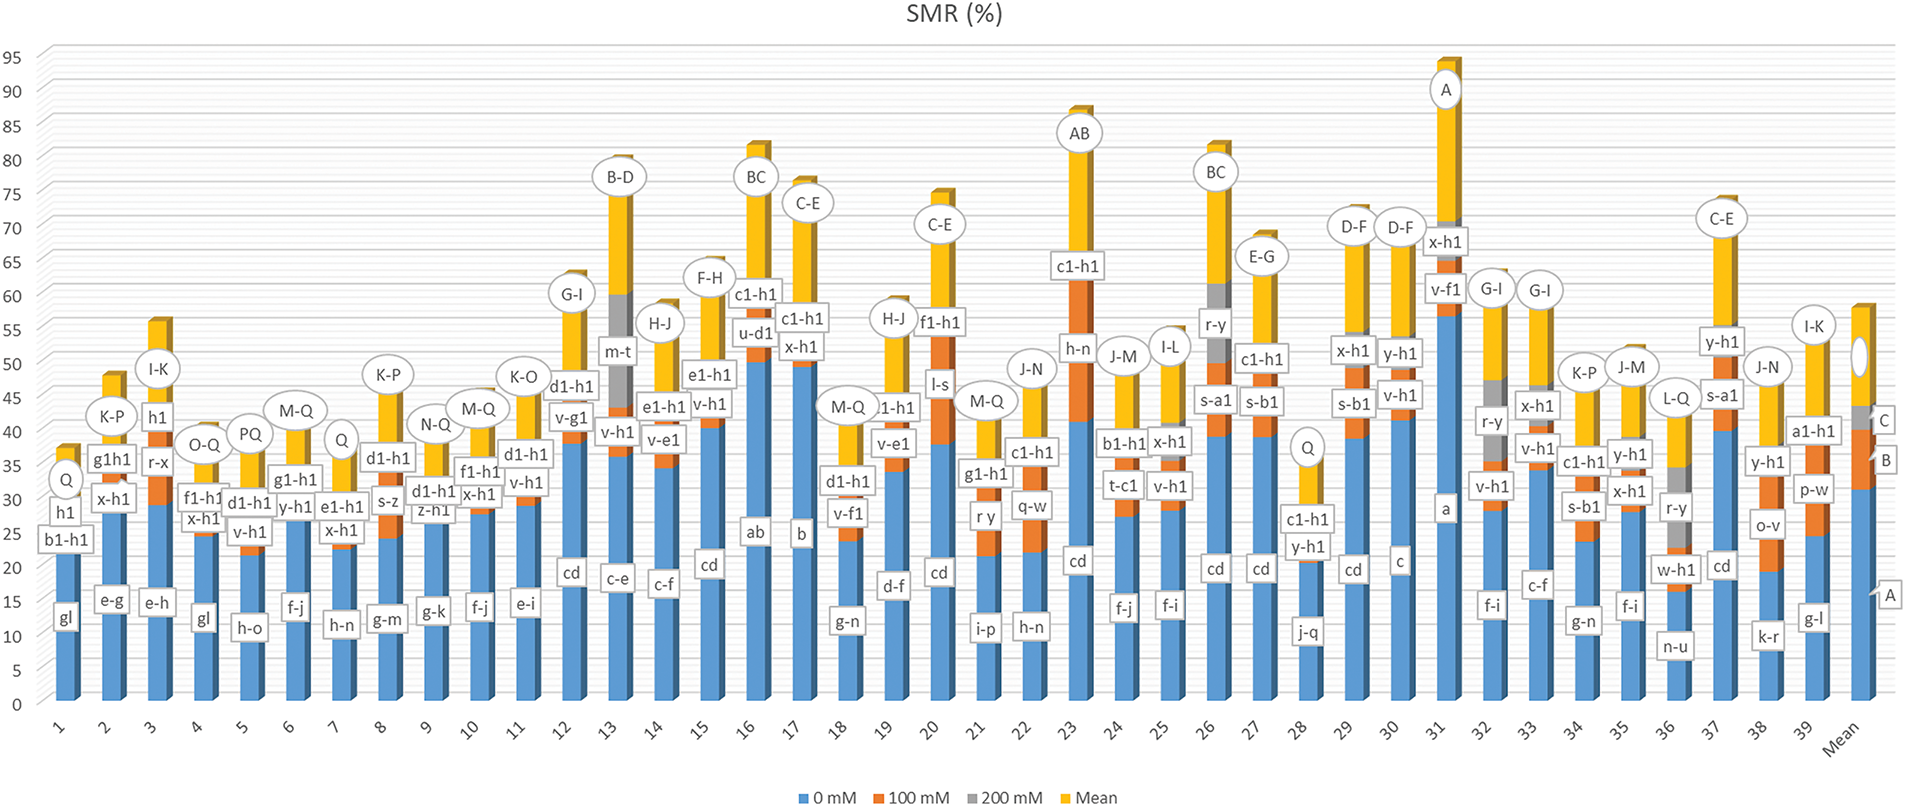
Figure 9: Mean shoot moisture rate under different salt concentrations (0, 100 and 200 mM) and 39 popcorn genotypes. Means are averaged over three replicates and means with a different letter varied significantly at p < 0.05
The average root moisture ratio (RMR), which reflects the genotypes’ responses to varying salt concentrations, along with the categorical distribution of the mean values derived from the multiple comparison test, is detailed in Fig. 10. It was found that RMR exhibited significant variation (p < 0.01) in relation to genotype (G), salt concentration (S), and their interaction (G × S). Specifically, RMR decreased from 13.140% to 3.431% and 3.348% as salt concentration increased, indicating a progressive decline in root moisture content that ultimately hindered germination. Consequently, data were collected for specific genotypes subjected to a 200 mM salt concentration. The RMR ranged from 0.030% to 31.515% due to the G × S interaction, with the lowest moisture content recorded in genotypes G2-S3, G1-S3, G8-S3, G10-S3, G18-S2, G6-S3, G16-S3, G18-S3, and G4-S3, all of which were categorized similarly to G2-S3. Conversely, the highest moisture content was noted in the G17-S1 treatment. It is important to mention that no germination occurred in the treatments G24-S3, G19-S3, G13-S3, G22-S3, G17-S3, and G9-S3, leading to the exclusion of these samples from data collection and subsequent analysis.
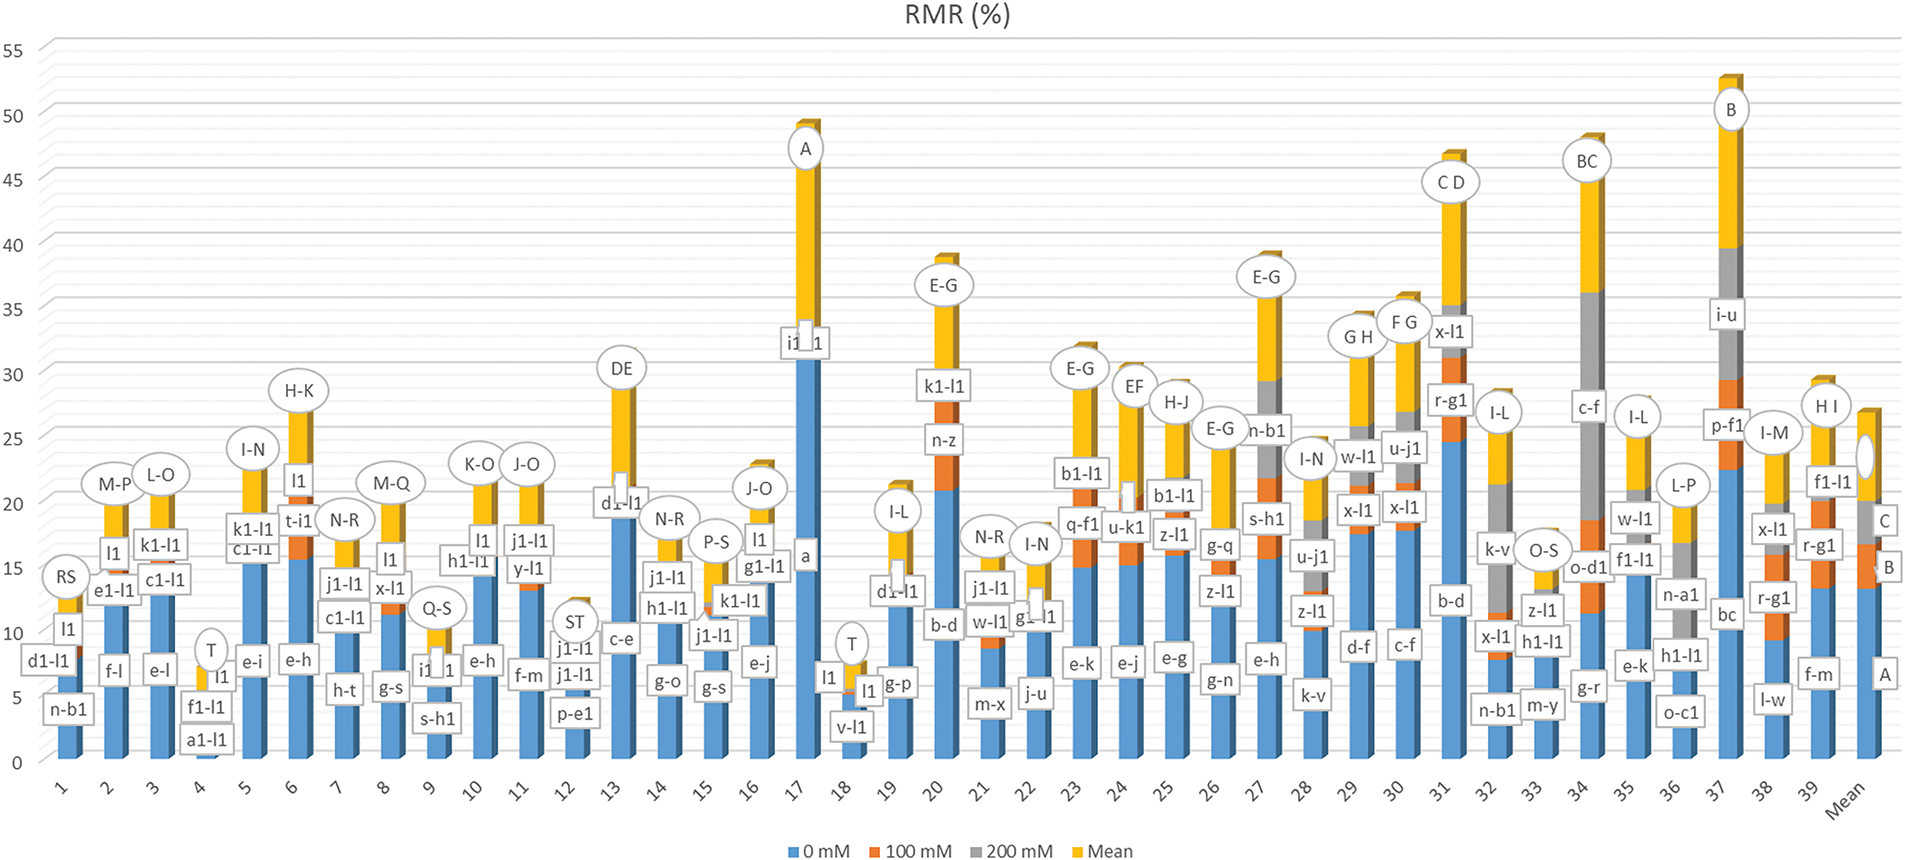
Figure 10: Mean root moisture rate under different salt concentrations (0, 100 and 200 mM) and 39 popcorn genotypes. Means are averaged over three replicates and means with a different letter varied significantly at p < 0.05
The average Stress Tolerance Index (STI) was determined by evaluating the germination rates of different popcorn kernel genotypes across a range of salt concentrations, as detailed in Fig. 11. The STI values ranged from 0.053 for genotype G1-S3 to 1.206 for genotypes G11-S2, G29-S2, and G31-S2, indicating variability influenced by both genotype and salt concentration. A comprehensive analysis revealed that higher salt concentrations led to a decrease in the stress tolerance index, as assessed through germination rates.
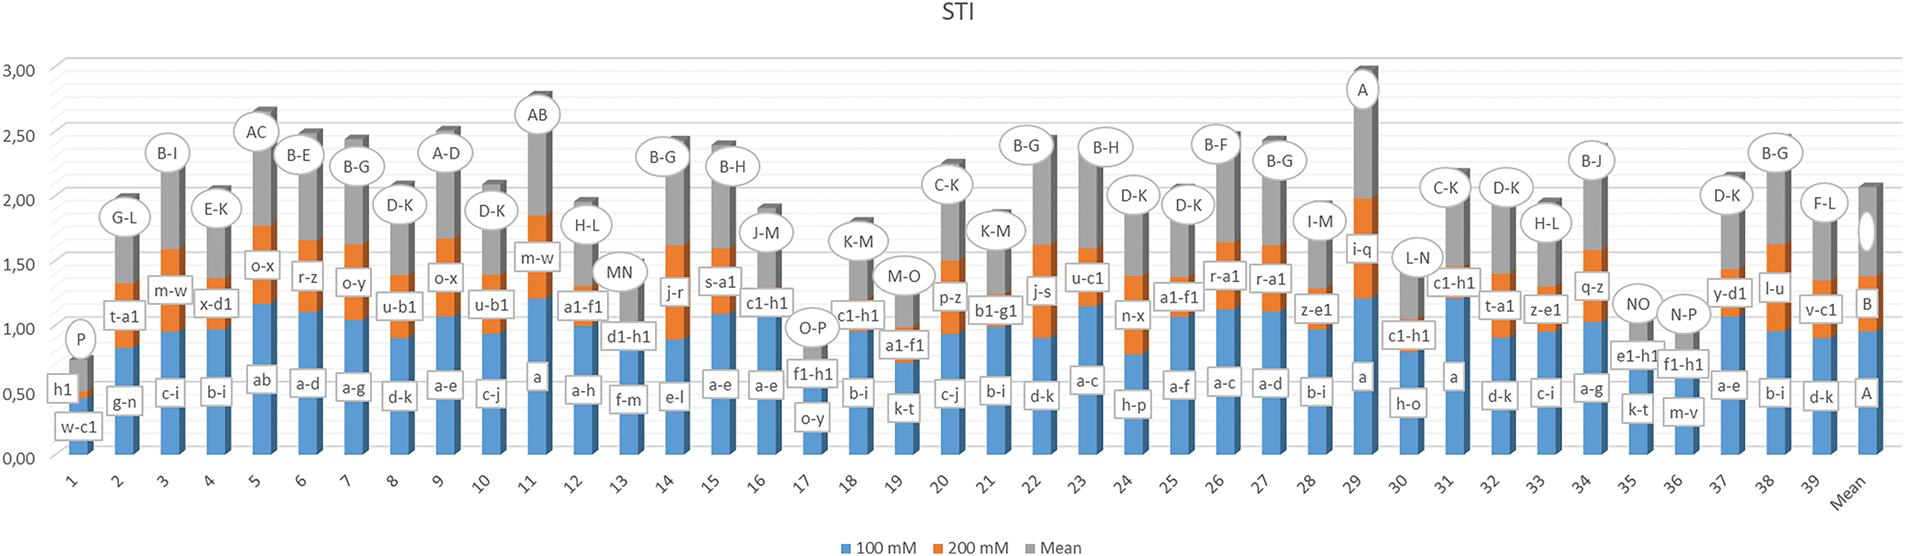
Figure 11: Mean stress tolerance index based on germination rates in 39 popcorn genotypes at 100 mM and 200 mM salt concentrations. Means are averaged over three replicates and means with a different letter varied significantly at p < 0.05
Simple linear regression was used to analyze the correlation between the mean STI and salt concentration across the genotypes (Fig. 12). The analysis revealed a negative correlation between STI and salt concentration.
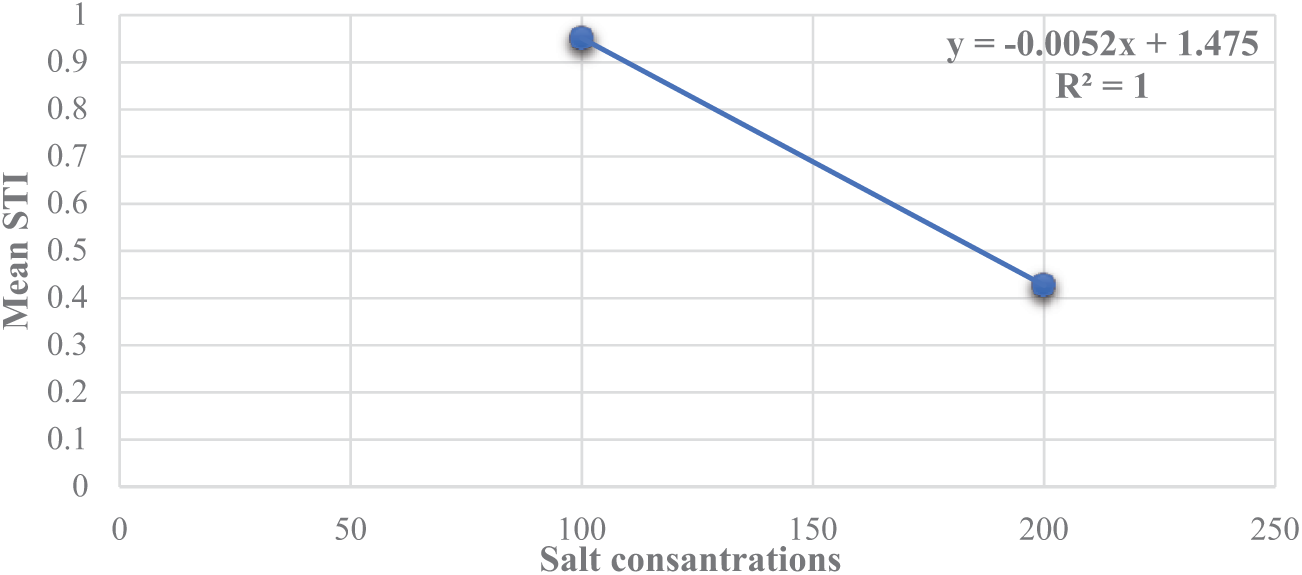
Figure 12: Simple regression analysis that demonstrated the correlation between stress tolerance index (STI) and irrigation water salinity. STI data are the averages across all genotypes at a specific salinity
The dendrogram illustrating the hierarchical cluster analysis of the average salt tolerance index (STI) values for each genotype across varying salinity levels is depicted in Fig. 13. This dendrogram reveals that the genotypes were classified into seven distinct groups according to their salt tolerance levels. The 1st group comprised genotypes with lower salt tolerance, specifically genotypes 1, 17, 35, and 36. Conversely, the 7th group included those with higher salt tolerance, which encompassed genotypes 33, 12, 28, 18, 21, 25, 37, 16, and 31. The 2nd group contained genotypes 13, 19, and 30, while the 3rd group was made up of genotypes 2, 24, 8, 32, 10, and 39. The 4th group included genotypes 3, 38, 20, 14, and 22, and the 5th group consisted of genotypes 5, 11, and 29. Finally, the 6th group was represented by genotypes 6, 15, 27, 26, 23, 7, 34, and 9.
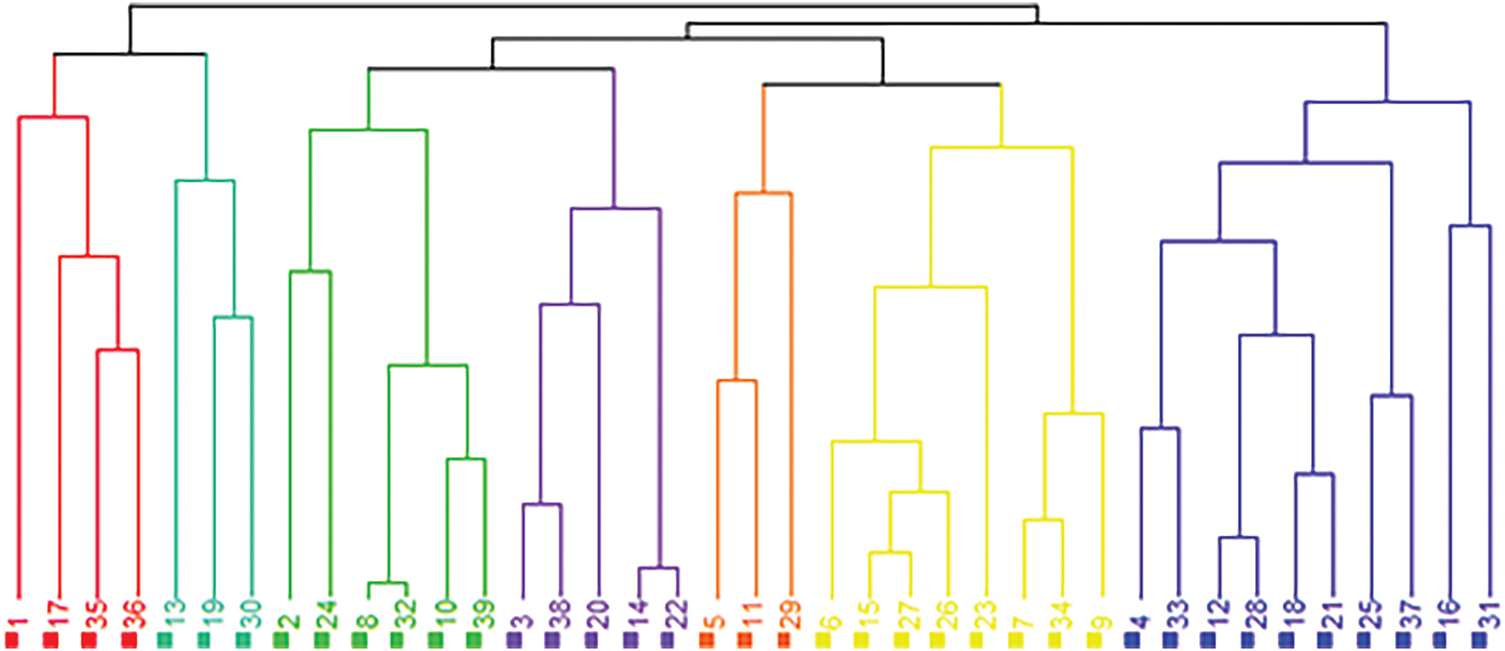
Figure 13: Hierarchical cluster analysis dendrogram for the salinity tolerance of 39 popcorn genotypes
Salinity is a significant abiotic stressor that critically impedes plant development and agricultural productivity, making it a persistent challenge for global food security [25]. Among its adverse effects, salt stress disrupts water uptake, alters ion homeostasis, and induces metabolic imbalances, which collectively hinder plant growth and yield [26]. Young seedlings are particularly vulnerable during germination and early growth stages, as their physiological systems are not yet fully developed to counteract the osmotic and ionic stresses induced by salinity. This heightened sensitivity underscores the need for targeted interventions to enhance crop resilience at these critical stages [26].
Despite notable advancements in breeding techniques over the past 15 years, traditional breeding practices focusing on the evaluation of promising germplasm remain integral to crop improvement efforts. These methods prioritize the identification and utilization of genetic variability within plant species, enabling the selection of traits that confer greater resilience under challenging environmental conditions [27]. In maize, genetic diversity in salinity tolerance is closely linked to its polymorphic nature, which facilitates the expression of diverse adaptive traits. Consequently, the assessment of agronomic traits, particularly during early growth phases, is essential for understanding and improving tolerance mechanisms [28–30].
Maize exhibits pronounced sensitivity to salinity during its vegetative growth phase, where elevated salinity levels adversely affect nearly all physiological and morphological traits, including photosynthesis, respiration, and cell division [31–34]. However, the degree of sensitivity varies across genotypes, highlighting the potential to identify and develop salt-tolerant varieties. Such genotypes can serve as a valuable resource for improving grain yields in saline-affected soils, thereby addressing a critical need for sustainable agriculture [35,36].
Saline soils negatively influence plant development, growth, and yield by inducing physiological and metabolic disruptions, which manifest in reduced seed germination rates, impaired survival, and diminished productivity. Key traits such as germination percentage (G%), germination index (GI), and mean germination time (MGT) are particularly affected by salinity, as evidenced by the current study’s findings. These traits exhibited significant changes under rising salinity levels, with the most pronounced effects observed at 200 mM NaCl. This salinity level also revealed substantial genotypic variation, providing a basis for distinguishing salt-tolerant genotypes. Comparable findings have been reported in other crops, including barley, wheat, oats, and sorghum, underscoring the universal nature of salinity-induced challenges across species [2,37–42].
The accumulation of soluble substances around seeds under salt stress increases osmotic pressure, creating additional challenges for water uptake and leading to ion toxicity. This results in inhibited root emergence, reduced embryo development, and a decline in seedling vigor [43,44]. Furthermore, salinity disrupts hormonal signaling pathways and physiological processes such as mineral uptake, stomatal regulation, and photosynthetic efficiency, culminating in reduced growth and yield [45].
During seedling growth, key parameters such as shoot length (SL), root length (RL), shoot moisture rate (SMR), and root moisture ratio (RMR) were significantly reduced under salt stress. These reductions were particularly severe at higher salinity levels, with complete growth inhibition observed at 200 mM NaCl. At 100 mM NaCl, declines of 75%–77% in SL and RL highlighted substantial variability in tolerance among genotypes, reflecting the potential for genetic improvement [46,47]. These findings emphasize the importance of identifying salt-tolerant genotypes for breeding programs.
Studies consistently demonstrate that salt toxicity reduces maize shoot and root growth by disrupting cell elongation, leaf formation, and internode development, ultimately diminishing biomass production [48–55]. Among the most critical parameters for assessing salinity tolerance are fresh and dry weights, along with root and shoot lengths, as these traits provide reliable indicators of genotypic performance under saline conditions. Additionally, physiological traits such as proline accumulation, sodium exclusion, and potassium uptake play a vital role in enhancing tolerance, as they help mitigate osmotic and ionic stress [56,57]. The identification and selection of parental lines with these traits remain essential for breeding salt-resistant maize varieties that can thrive in saline environments [58–64].
The study’s findings demonstrated a significant reduction in key growth parameters, including Gmax, GI, SL, RL, SdL, SVI, SMR, RMR, and STI, alongside an observed increase in MGT, as salinity levels increased linearly. These results underscore the pervasive influence of saline stress on maize development, particularly at critical growth stages. The analysis revealed substantial genetic variation among the evaluated genotypes, resulting in notable differences in their salt tolerance capacities. This genetic variability highlights the importance of selecting and utilizing genotypes with superior resilience to salinity stress in breeding programs.
Despite maize’s pronounced sensitivity to salinity, the application of 200 mM NaCl proved effective for identifying high-tolerance genotypes based on germination rates. However, it was noted that germination in several genotypes was severely inhibited under these conditions, suggesting that this concentration may not be suitable for assessing seedling characteristics comprehensively. A more balanced approach would involve employing lower salt concentrations, such as 100 mM NaCl, which could provide a clearer understanding of seedling growth traits while still reflecting the stress conditions encountered in saline soils. This adjustment could help mitigate the risk of overlooking moderately tolerant genotypes that fail to germinate under extreme salinity.
The study further identified genotypes 4, 33, 12, 28, 18, 21, 25, 37, 16, and 31 as high-performing candidates for cultivation in saline soils, owing to their remarkable tolerance traits. These genotypes demonstrated resilience across multiple parameters, making them valuable for enhancing agricultural productivity in salt-affected regions. Conversely, genotypes 1, 17, 35, and 36 exhibited pronounced sensitivity to salinity and are therefore not recommended for cultivation in such conditions. These results emphasize the need for careful genotype selection based on targeted stress testing to maximize crop yield potential.
From an application standpoint, these findings provide a foundation for refining breeding strategies aimed at improving salinity tolerance in maize. Future studies could explore the underlying physiological and molecular mechanisms contributing to the observed variability in salt tolerance. Moreover, integrating these genotypes into broader trials across diverse saline environments would help validate their performance and scalability in real-world agricultural settings. By combining targeted genotype selection with advanced breeding methodologies, agricultural resilience to saline stress can be significantly enhanced.
Acknowledgement: Not applicable.
Funding Statement: The author received no specific funding for this study.
Availability of Data and Materials: All the data that support the findings of this study are available in the manuscript.
Ethics Approval: Not applicable.
Conflicts of Interest: The author declares no conflicts of interest to report regarding the present study.
References
1. Ozyazici MA, Acikbas OUS. Green fertilization. Ankara, Turkiye: Iksad Publications; 2022. (In Turkish). [Google Scholar]
2. Javed MM, Al-Doss AA, Tahir MU, Khan MA, El-Hendawy S. Assessing the suitability of selection approaches and genetic diversity analysis for early detection of salt tolerance of barley genotypes. Agronomy. 2022;12(12):3217. doi:10.3390/agronomy12123217. [Google Scholar] [CrossRef]
3. Butcher K, Wick AF, Desutter T, Chatterjee A, Harmon J. Soil salinity: a threat to global food security. Agron J. 2016;108(6):2189–200. doi:10.2134/agronj2016.06.0368. [Google Scholar] [CrossRef]
4. Liu B, Soundararajan P, Manivannan A. Mechanisms of silicon-mediated amelioration of salt stress in plants. Plants. 2019;8(9):307. doi:10.3390/plants8090307. [Google Scholar] [PubMed] [CrossRef]
5. Kumar A, Singh S, Gaurav AK, Srivastava S, Verma JP. Plant growth-promoting bacteria: biological tools for the mitigation of salinity stress in plants. Front Mic. 2020;11:1216. doi:10.3389/fmicb.2020.01216. [Google Scholar] [PubMed] [CrossRef]
6. Ma Y, Dias MC, Freitas H. Drought and salinity stress responses and microbe-induced tolerance in plants. Front Plant Sci. 2020;11:591911. doi:10.3389/fpls.2020.591911. [Google Scholar] [PubMed] [CrossRef]
7. El Moukhtari A, Cabassa-Hourton C, Farissi M, Savouré A. How does proline treatment promote salt stress tolerance during crop plant development? Front Plant Sci. 2020;11:1127. doi:10.3389/fpls.2020.01127. [Google Scholar] [PubMed] [CrossRef]
8. Johnson R, Puthur JT. Seed priming as a cost effective technique for developing plants with cross tolerance to salinity stress. Plant Phy Biochem. 2021;162:247–57. doi:10.1016/j.plaphy.2021.02.034. [Google Scholar] [PubMed] [CrossRef]
9. Mansour E, Moustafa ES, Desoky ESM, Ali MM, Yasin MA, Attia A, et al. Multidimensional evaluation for detecting salt tolerance of bread wheat genotypes under actual saline field growing conditions. Plants. 2020;9(10):1324. doi:10.3390/plants9101324. [Google Scholar] [PubMed] [CrossRef]
10. Zhang F, Sapkota S, Neupane A, Yu J, Wang Y, Zhu K, et al. Effect of salt stress on growth and physiological parameters of sorghum genotypes at an early growth stage. Indian J Exp Biol. 2020;58(6):404–11. doi:10.56042/ijeb.v58i06.65504. [Google Scholar] [CrossRef]
11. Lei Y, Liu Q, Hettenhausen C, Cao G, Tan Q, Zhao W, et al. Salt tolerant and sensitive alfalfa (Medicago sativa) cultivars have large variations in defense responses to the lepidopteran insect spodoptera litura under normal and salt stress condition. PLoS One. 2017;12(7):E0181589. doi:10.1371/journal.pone.0181589. [Google Scholar] [PubMed] [CrossRef]
12. Gautam AR, Khan AH, Poonam M, Bhadhur R, Singh AK. Impact of salinity stress on morpho-physiology of four rice (Oryza sativa L.) varieties. J Adv Biol Biotechnol. 2024;27(11):138–45. doi:10.9734/jabb/2024/v27i111599. [Google Scholar] [CrossRef]
13. Dogru A. The effects of salt stress on the antioxidant system in different corn genotypes. In: 22nd National Biology Congress; 2014 Jun 23–27; Eskisehir, Turkiye. 430 p. (In Turkish). [Google Scholar]
14. Zaimoglu S, Dogru A. Some growth parameters and effects of salt stress on different corn genotypes on photosynthetic activity. In: 23rd National Biology Congress; 2016; Gaziantep, Turkiye: Gaziantep University. 2016. 270 p. (In Turkish). [Google Scholar]
15. Prasanna BM. Diversity in global maize germplasm: characterization and utilization. J Biosci. 2012;37:843–55. doi:10.1007/s12038-012-9227-1. [Google Scholar] [PubMed] [CrossRef]
16. Galvez Ranilla L. The application of metabolomics for the study of cereal corn (Zea mays L.). Metabolites. 2020;10(8):300. doi:10.3390/metabo10080300. [Google Scholar] [PubMed] [CrossRef]
17. Guzzon F, Arandia Rios LW, Caviedes Cepeda GM, Cespedes Polo M, Chavez Cabrera A, Muriel Figueroa J, et al. Conservation and use of Latin American maize diversity: pillar of nutrition security and cultural heritage of humanity. Agronomy. 2021;11:172. doi:10.3390/agronomy11010172. [Google Scholar] [CrossRef]
18. Mayer M, Hölker AC, González-Segovia E, Bauer E, Presterl T, Ouzunova M, et al. Discovery of beneficial haplotypes for complex traits in maize landraces. Nat Commun. 2020;11(1):4954. doi:10.1038/s41467-020-18683-3. [Google Scholar] [PubMed] [CrossRef]
19. González-Martínez J, Rocandio-Rodríguez M, Contreras-Toledo AR, Joaquín-Cancino S, Vanoye-Eligio V, Chacón-Hernández JCY, et al. Morphological and agronomic diversity of maize native to the high plateau of Tamaulipas, Mexico. Rev Fitotec Mex. 2020;43(4):361–70. (In Spanish). doi:10.35196/rfm.2020.4.361. [Google Scholar] [CrossRef]
20. Farooq M, Hussain M, Wakeel A, Siddique KH. Salt stress in maize: effects, resistance mechanisms, and management: a review. Agron Sustain Dev. 2015;35:461–81. doi:10.1007/s13593-015-0287-0. [Google Scholar] [CrossRef]
21. Al-Mudaris M. Notes on various parameters recording the speed of seed germination. Der Trop J Agric Trop Subtrop. 1998;99:147–54. [Google Scholar]
22. ISTA. International rules for seed testing. Sapporo, Japan: International Seed Testing Association; 2019 [cited 2025 Jan 1]. Available from: https://www.seedtest.org/en/publications/international-rules-seed-testing.html. [Google Scholar]
23. Abdul-Baki AA, Anderson JD. Vigor determination in soybean seed by multiple criteria. Crop Sci. 1973;13(6):630–3. doi:10.2135/cropsci1973.0011183X001300060013x. [Google Scholar] [CrossRef]
24. Fernandez GC. Effective selection criteria for assessing plant stress tolerance. In: Proceedings of the International Symposium on Adaptation of Vegetables and Other Food Crops in Temperature and Water Stress; 1992 Aug 13–18; Shanhua, Taiwan. p. 257–70. [Google Scholar]
25. Shrivastava P, Kumar R. Soil Salinity: a serious environmental issue and plant growth promoting bacteria as one of the tools for its alleviation. Saudi J Biol Sci. 2015;22:123–31. doi:10.1016/j.sjbs.2014.12.001. [Google Scholar] [PubMed] [CrossRef]
26. Hussain K, Majeed A, Nawaz K, Nisar MF. Changes in morphological attributes of maize (Zea mays L.) under NaCl salinity. Am Eurasian J Agric Env Sci. 2010;8(2):230–2. [Google Scholar]
27. Jia C, Wang F, Yuan J, Zhang Y, Zhao Z, Abulizi B, et al. Screening and comprehensive evaluation of rice (Oryza sativa L. Subsp. Japonica Kato) germplasm resources for nitrogen efficiency in Xinjiang, China. Plant Genet Resour. 2020;18:179–89. doi:10.1017/s1479262120000118. [Google Scholar] [CrossRef]
28. Paterniani E. Maize breeding in tropics. Crit Rev Plant Sci. 1990;9:125–54. doi:10.1080/07352689009382285. [Google Scholar] [CrossRef]
29. Khan AA, Sajjad AR, Mcneilly T. Assessment of salinity tolerance based upon seedling root growth response functions in maize (Zea mays L.). Euphytica. 2003;131:81–9. doi:10.1023/A:1023054706489. [Google Scholar] [CrossRef]
30. Eker S, Comertpay G, Konuskan O, Ulger AC, Ozturk L, Cakmak I. Effect of salinity stress on dry matter production and ion accumulation in hybrid maize varieties. Turk J Agric. 2006;30:365–73. [Google Scholar]
31. Hatzig S, Hanstein S, Schubert S. Apoplast acidification is not a necessary determinant for the resistance of maize in the first phase of salt stress. J Plant Nutr Soil Sci. 2010;173:559–62. doi:10.1002/jpln.201000117. [Google Scholar] [CrossRef]
32. Uddin MN, Hanstein S, Leubner R, Schubert S. Leaf cell-wall components as influenced in the first phase of salt stress in three maize (Zea mays L.) hybrids differing in salt resistance. J Agron Crop Sci. 2013;199:405–15. doi:10.1111/jac.12031. [Google Scholar] [CrossRef]
33. Uddin MN, Hanstein S, Faust F, Eitenmuller PT, Pitann B, Schubert S. Diferulic acids in the cell wall may contribute to the suppression of shoot growth in the first phase of salt stress in maize. Phytochemistry. 2014;102:126–36. doi:10.1016/j.phytochem.2014.02.014. [Google Scholar] [PubMed] [CrossRef]
34. Zaidi F, Shahzad A, Ahsan M, Gul H, Shahzad M, Gul S, et al. Evaluation of genetic variation among maize inbred lines for salinity stress at seedling stage through salt-stress-responsive traits. Acta Univ Sapientiae Agric Env. 2022;14(1):62–84. doi:10.2478/ausae-2022-0005. [Google Scholar] [CrossRef]
35. Khayatnezhad M, Gholamin R. Effects of salt stress levels on five maize (Zea mays L.) cultivars at germination stage. Afr J Biotechnol. 2011;10:12909–15. doi:10.5897/Ajb11.1568. [Google Scholar] [PubMed] [CrossRef]
36. Ali F, Ahsan M, Ali Q, Kanwal N. Phenotypic stability of Zea mays grain yield and its attributing traits under drought stress. Front Plant Sci. 2017;8:1397. doi:10.3389/Fpls.2017.01397. [Google Scholar] [PubMed] [CrossRef]
37. Wahid A, Perveen M, Gelani S, Basra SM. Pretreatment of seed with H2O2 improves salt tolerance of wheat seedlings by alleviation of oxidative damage and expression of stress proteins. J Plant Physiol. 2007;164:283–94. doi:10.1016/j.jplph.2006.01.005. [Google Scholar] [PubMed] [CrossRef]
38. Tao R, Ding J, Li C, Zhu X, Guo W, Zhu M. Evaluating and screening of agro-physiological indices for salinity stress tolerance in wheat at the seedling stage. Front Plant Sci. 2021;12:646175. doi:10.3389/fpls.2021.646175. [Google Scholar] [PubMed] [CrossRef]
39. Bai J, Yan W, Wang Y, Yin Q, Liu J, Wight C, et al. Screening oat genotypes for tolerance to salinity and alkalinity. Front Plant Sci. 2018;9:1302. doi:10.3389/fpls.2018.01302. [Google Scholar] [PubMed] [CrossRef]
40. Dehnavi AR, Zahedi M, Ludwiczak A, Perez SC, Piernik A. Effect of salinity on seed germination and seedling development of sorghum (Sorghum bicolor (L.) Moench) genotypes. Agronomy. 2020;10:859. doi:10.3390/agronomy10060859. [Google Scholar] [CrossRef]
41. Almodares A, Hadi M, Dosti B. Effects of salt stress on germination percentage and seedling growth in sweet sorghum cultivars. J Biol Sci. 2007;7:1492–5. doi:10.3923/jbs.2007.1492.1495. [Google Scholar] [CrossRef]
42. Kinfemichael GA, Melkamu GW. Response of some lowland growing sorghum (Sorghum bicolor L. Moench) accessions to salt stress during germination and seedling growth. Afr J Agric Res. 2008;3(1):44–8. doi:10.5897/ajar2014.9064. [Google Scholar] [PubMed] [CrossRef]
43. Iqbal S, Hussain S, Qayyaum MA, Ashraf M. The response of maize physiology under salinity stress and its coping strategies. In: Plant stress physiology. London, UK: IntechOpen; 2020. doi:10.5772/intechopen.92213. [Google Scholar] [CrossRef]
44. Yan H, Shah SS, Zhao W, Liu F. Variations in water relations, stomatal characteristics, and plant growth between quinoa and pea under salt-stress conditions. Pak J Bot. 2020;52(1):1–7. doi:10.30848/PJB2020-1(8). [Google Scholar] [CrossRef]
45. Koyro HW. Effect of salinity on growth, photosynthesis, water relations and solute composition of the potential cash crop halophyte Plantago coronopus (L.). Env Exp Bot. 2006;56(2):136–46. doi:10.1016/j.envexpbot.2005.02.001. [Google Scholar] [CrossRef]
46. Saddiq MS, Iqbal S, Afzal I, Ibrahim AM, Bakhtavar MA, Hafeez MB, et al. Mitigation of salinity stress in wheat (Triticum aestivum L.) seedlings through physiological seed enhancements. J Plant Nutr. 2019;42(10):1192–204. doi:10.1080/01904167.2019.1609509. [Google Scholar] [CrossRef]
47. Zahra N, Raza ZA, Mahmood S. Effect of salinity stress on various growth and physiological attributes of two contrasting maize genotypes. Braz Arch Biol Technol. 2020;63:e20200072. doi:10.1590/1678-4324-2020200072. [Google Scholar] [CrossRef]
48. Qu C, Liu C, Gong X, Li C, Hong M, Wang L, et al. Impairment of maize seedling photosynthesis caused by a combination of potassium deficiency and salt stress. Env Exp Bot. 2012;75:134–41. doi:10.1016/j.envexpbot.2011.08.019. [Google Scholar] [CrossRef]
49. Usman M, Haq AU, Ahsan T, Amjad S, Riast Z, Umar M. Effect of NaCl on morphological attributes of maize (Zea mays L.). World J Agric Sci. 2012;8(4):381–4. doi:10.5829/idosi.bri.2012.5.3.243. [Google Scholar] [CrossRef]
50. Collado MB, Arturi MJ, Aulicino MB, Molina MC. Identification of salt tolerance in seedlings of maize (Zea mays L.) with the cell membrane stability trait. Inter Res J Plant Sci. 2010;1:126–32. [Google Scholar]
51. Szalai G, Janda T. Effect of salt stress on the salicylic acid synthesis in young maize (Zea mays L.) plants. J Agron Crop Sci. 2009;195:165–71. doi:10.1111/j.1439-037x.2008.00352.x. [Google Scholar] [CrossRef]
52. Munns R. Physiological processes limiting growth in saline soils: some dogmas and hypotheses. Plant Cell Env. 1993;16:15–24. doi:10.1111/j.1365-3040.1993.tb00840.x. [Google Scholar] [CrossRef]
53. Rios-Gonzalez K, Erdei L, Lips SH. The activity of antioxidant enzymes in maize and sunflower seedlings as affected by salinity and different nitrogen sources. Plant Sci. 2002;162:923–30. doi:10.1016/s0168-9452(02)00040-7. [Google Scholar] [CrossRef]
54. Pitann B, Schubert S, Muhling KH. Decline in leaf growth under salt stress is due to an inhibition of H+ pumping activity and increase in apoplastic pH of maize leaves. J Plant Nutr Soil Sci. 2009;172:535–43. doi:10.1002/jpln.200800349. [Google Scholar] [CrossRef]
55. Wakeel A, Sumer A, Hanstein S, Yan F, Schubert S. In vitro effect of Na+/K+ ratios on the hydrolytic and pumping activity of the plasma membrane H+-ATPase from maize (Zea mays L.) and sugar beet (Beta vulgaris L.) shoot. Plant Physiol Biochem. 2011;49:341–5. doi:10.1016/j.plaphy.2011.01.006. [Google Scholar] [PubMed] [CrossRef]
56. Negrão S, Schmockel SM, Tester M. Evaluating physiological responses of plants to salinity stress. Ann Bot. 2017;119:1–11. doi:10.1093/aob/mcw191. [Google Scholar] [PubMed] [CrossRef]
57. Shahzad M, Abbasi KY, Shahzad A, Zaidi F. Effect of glycine betaine on morphological and physiological attributes of tomato (Lycopersicon esculentum L.) cultivars under saline conditions. J Hort Plant Res. 2019;8:22–9. doi:10.18052/www.scipress.com/jhpr.8.22. [Google Scholar] [CrossRef]
58. Giaveno CD, Ribeiro RV, Souza GM, De Oliveira RF. Screening of tropical maize for salt stress tolerance. Crop Breed Appl Biotechnol. 2007;7:304–13. [Google Scholar]
59. Sharif AE, Nisar RA, Sadiq M. Response of maize (Zea mays L.) genotypes to NaCl salinity at various growth stages of crop. Pak J Bio Sci. 1999;23:606–8. doi:10.3923/pjbs.1999.606.608. [Google Scholar] [CrossRef]
60. Turan M, Turkmen N, Taban N. Effect of NaCl on stomata resistance and proline, chlorophyll, Na, Cl and K concentrations of lentil plants. J Agron. 2007;6:378–81. doi:10.3923/ja.2007.378.381. [Google Scholar] [CrossRef]
61. Tas B, Basar H. Effects of various salt compounds and their combinations on growth and stress indicators in maize. Afr J Agric Res. 2009;4(3):156–61. [Google Scholar]
62. Ahmed K, Saqib M, Akhtar J, Ahmad R. Evaluation and characterization of genetic variation in maize (Zea mays L.) for salinity tolerance. Pak J Agric Sci. 2012;49(4):521–6. [Google Scholar]
63. Parvaiz M. Response of maize to salt stresses: a critical review. Int J Heal Sci. 2014;1(1):13–25. [Google Scholar]
64. Naqi S, Khan AH, Rana RM, Hamza MI, Kiedrzyński M, Tahir MN, et al. Inheritance of cell membrane stability and yield components under drought and salinity stress in bread wheat (Triticum aestivum L.). J Plant Growth Regul. 2024;12:1–16. doi:10.1007/s00344-024-11580-9. [Google Scholar] [CrossRef]
Cite This Article
 Copyright © 2025 The Author(s). Published by Tech Science Press.
This work is licensed under a Creative Commons Attribution 4.0 International License , which permits unrestricted use, distribution, and reproduction in any medium, provided the original work is properly cited.
 Downloads
 Citation Tools