
 Submit a Paper
 Propose a Special lssue
 Open Access
ARTICLE

Integrating Morphological and Digital Traits to Optimize Nitrogen Use Efficiency in Maize Hybrids
1 Seed Technology Division, Bangladesh Agricultural Research Institute, Joydebpur, Gazipur, 1701, Bangladesh
2 Oilseeds Research Center, Bangladesh Agricultural Research Institute, Joydebpur, Gazipur, 1701, Bangladesh
3 Department of Crop Physiology and Ecology, Hajee Mohammad Danesh Science & Technology University, Dinajpur, 5200, Bangladesh
4 Department of Biology, Faculty of Science, Taif University, P.O. Box 11099, Taif, 21944, Saudi Arabia
5 Soil Science Division, Bangladesh Wheat and Maize Research Institute, Dinajpur, 5200, Bangladesh
* Corresponding Authors: M Shalim Uddin. Email: ; Akbar Hossain. Email:
(This article belongs to the Special Issue: Integrated Nutrient Management in Cereal Crops)
Phyton-International Journal of Experimental Botany 2025, 94(6), 1897-1919. https://doi.org/10.32604/phyton.2025.065607
Received 18 March 2025; Accepted 27 May 2025; Issue published 27 June 2025
 View Full Text
 Download PDF
Abstract
The yield of maize (Zea mays L.) is highly influenced by nitrogen fertilization. This study investigated the impact of nitrogen fertilization on morphophysiological traits in maize (Zea mays L.) and developed algorithms to relate manual phenotyping and digital phenotyping of maize with leaf nitrogen and digital field image traits. The experiment included three hybrid maize varieties, V1 (Hybrid 981), V2 (BARI Hybrid maize-9), and V3 (Hybrid P3396), which were evaluated across three nitrogen levels (N1 = 100 kg N ha−1, N2 = 200 kg N ha−1, N3 = 300 kg N ha−1) in a split-plot design with three replications. The results revealed that nitrogen levels (N), varieties (V), and their interactions (V × N) significantly influenced traits such as plant height (PH), leaf area index (LAI), normalized difference vegetation index (NDVI), canopy cover (CC), chlorophyll content (Chl a and Chl b), leaf nitrogen content (LNC), total dry matter (TDM), and grain yield. The hybrid P3396 with 300 kg N ha−1 (V3N3) achieved the highest grain yield of 14.45 t ha−1, which was statistically similar to that of Hybrid 981 and 300 kg N ha−1 (V1N3). Nitrogen significantly improved dry matter accumulation, leaf area, and physiological parameters, with maximum values recorded during flowering. The NDVI, CC, and SPAD were strongly correlated with LNC and TDM, highlighting their potential as indicators for nitrogen management. The digital imaging traits analysed via software effectively differentiated the nitrogen treatments, demonstrating their utility for precise nitrogen application. In conclusion, nitrogen fertilization at 300 kg N ha−1 optimized the growth and yield of hybrid maize, with Hybrid P3396 performing best. This study underscores the role of advanced phenotyping tools in improving nitrogen use efficiency and sustainable maize production.Keywords
Supplementary Material
Supplementary Material FileThe global population is expected to reach 9.7 billion by 2050, necessitating a substantial increase in agricultural production to address demands for food, feed, and biofuel [1]. This challenge is compounded by limitations in arable land, making sustainable intensification of crop production essential. Maize (Zea mays L.), a versatile crop cultivated across a wide range of altitudes, latitudes, and environmental conditions, is the third most important cereal crop globally [2–4]. It provides food, feed, and industrial raw materials for billions of people and supports food security in some of the world’s poorest regions [5]. Despite its importance, maize yields in developing countries (Nigeria, Tanzania, Nepal, India, Ethiopia, etc.) average just 2.5 to 4.0 t per hectare, far below the global average of 5.6 t, due to abiotic and biotic stresses, including inadequate nutrient management [6].
Nitrogen (N) is an essential nutrient for maize and plays a key role in protein, nucleotide, and chlorophyll contents, which are crucial for plant growth and development [7–9]. However, nitrogen use efficiency (NUE) in maize is often low, leading to excessive nitrogen application, which not only reduces economic returns for farmers but also poses serious environmental challenges, such as soil acidification, water pollution, and greenhouse gas emissions [6,10,11]. While the importance of optimizing nitrogen application to increase maize productivity is widely recognized, real-time, accurate monitoring of plant nitrogen status remains a challenge [12]. Conventional methods for assessing nitrogen levels, such as leaf chlorophyll measurements and destructive tissue analysis, are labor intensive and time consuming.
Digital imaging technologies have emerged as promising tools for the nondestructive assessment of crop growth and nutrient status [13,14]. These methods enable the quantification of plant traits such as canopy cover, color indices, and greenness via image-derived parameters such as the dark green color index (DGCI) and excessive greenness index (EGI) [15,16]. However, the application of digital imaging for maize nitrogen management is still underexplored, particularly in the development of reliable segmentation techniques to differentiate maize plants from varying soil backgrounds [17,18]. Furthermore, while some studies have established relationships between nitrogen application and crop traits, few have leveraged image-based assessments to link morphophysiological parameters with nitrogen levels in maize.
This study aims to address these gaps by integrating advanced digital imaging techniques with agronomic evaluations to explore the effects of nitrogen levels on the morphophysiological traits of maize. By assessing parameters such as canopy cover, plant greenness, and color indices and correlating them with physiological traits such as leaf area, biomass, and nitrogen content, this research seeks to establish a cost-effective and scalable approach for optimizing nitrogen management in maize. The specific objectives of this study are (i) to evaluate the impact of nitrogen levels on the morphophysiological traits of maize, (ii) to utilize digital imaging techniques for trait assessment at different growth stages, and (iii) to establish correlations between image-derived indices and morphophysiological parameters to enhance nitrogen management strategies.
This novel approach has the potential to improve NUE, reduce environmental impacts, and support sustainable maize production, particularly in resource-constrained regions where traditional monitoring methods are impractical. By combining agronomic expertise with digital imaging innovations, this study contributes to bridging the gap between scientific knowledge and practical application, offering new insights into the sustainable intensification of maize production systems.
2.1 Location of the Observations
The experiment was conducted at the Seed Technology Division Field, Bangladesh Agricultural Research Institute (BARI), from November 2016 to May 2017 and was repeated the next year from November 2017 to May 2018. The experimental field is located in Gazipur Sadar Upazila, at a latitude of 23.9886369° N and longitude of 90.413056° E, with an elevation of approximately 71 m above sea level (Fig. S1).
2.2 Soil Characteristics and Analysis
The soil at the experimental site is classified as dark gray terrace soil within the Modhupur Tract under AEZ 28, which is characterized by low fertility and internal drainage limitations. Soil analyses were conducted prior to sowing to assess the baseline characteristics. The soil pH, ranging from 6.11 to 6.50, was measured with a combined glass calomel electrode, indicating slightly acidic conditions with a low organic matter content. Other parameters were analysed as follows: the organic carbon content was determined via the Walkley and black wet oxidation methods. Total nitrogen: Total nitrogen was assessed via the modified Kjeldahl method. Calcium and magnesium: Extracted with KCl. Potassium, copper, iron, manganese, and zinc were extracted via NaHCO3 followed by atomic absorption spectroscopy (AAS). Boron: Extracted by CaCl2. Phosphorus was measured via the Bray–Kurtz method. Sulfur: Determined via the turbidity method with BaCl2. Soil analysis revealed high levels of Ca, Mg, K, P, S, Cu, Fe, Mn, and Zn but limited nitrogen availability.
The study site is situated in a subtropical climate zone with three distinct seasons: winter (November–February), with nighttime temperatures ranging from 8°C–12°C, and daytime temperatures ranging from 20°C–25°C. Premonsoon/hot season (March–April): Nighttime temperatures of 15°C–18°C and daytime temperatures of 35°C–40°C. Monsoon (May–October): Nighttime temperatures of 18°C–24°C and daytime temperatures of 30°C–35°C. The detailed climatic data are presented in Fig. S2.
2.4 Land Preparation, Experimental Design, and Crop Establishment
The experimental field was prepared through repeated ploughing and cross-ploughing, followed by laddering to break soil clods and level the surface. To prevent fertilizer runoff during irrigation, 8–10 cm high ridges were formed around each plot. A soil-borne insecticide, Furadan 5G (10 kg ha−1, containing carbofuran), was broadcast during the final land preparation to control soil-borne pests. A split-plot design with three replications was employed, with three hybrid maize varieties assigned to the main plots (V1 = Hybrid 981, V2 = BARI Hybrid Maize-9, V3 = Hybrid P3396) and three nitrogen levels in the subplots (N1 = 100 kg N ha−1, N2 = 200 kg N ha−1, N3 = 300 kg N ha−1). Each plot measured 5 × 3 m, with a row spacing of 75 cm and a spacing of 20 cm. The fertilizers applied included phosphorus (55 kg ha−1), potassium (110 kg ha−1), sulfur (40 kg ha−1), zinc (5 kg ha−1), boron (1 kg ha−1), and cow dung (5 t ha−1), which were provided in the form of TSP, MoP, gypsum, and zinc oxide. All fertilizers, along with one-third of the nitrogen, were applied during final land preparation, with the remaining nitrogen applied in two equal splits at 40 and 80 days after sowing (DAS).
The maize seeds were sown at a seeding rate of 25 kg ha−1, maintaining a spacing of 75 cm between rows and 20 cm between plants. Two seeds were sown per hill at a depth of 3–5 cm and covered with soil to ensure uniform germination. To protect against fungal infections, seeds were pretreated with the fungicide Provax-200 WP (containing carboxin and thiram). Light irrigation was applied two days after sowing to support seedling emergence and establishment. To ensure optimal crop growth and yield, several management practices have been employed. The birds were deterred during the first 10–12 days after sowing and thinning within two weeks ensured a target density of 66,666 plants per hectare. Weeding was performed at the 4–5 leaf stage, and irrigation was applied four times—at the 3–5 leaf stage, the 8–10 leaf stage, tassel emergence, and grain filling—with excess water drained as needed. Earthing at the 8–10 leaf stage created 15–20 cm ridges and furrows between rows. Pest management included spraying Dursban 20EC for cutworms and 0.1% Tilt 25 EC solution for leaf blight (Helminthosporium maydis). The crop was harvested upon maturity, as indicated by drying husks and kernel black layers, on 03 May 2017, and 10 May 2018. The plants were bundled, tagged, and threshed, and the grains were sun-dried to 12% moisture content before weighing.
2.5 Data Collection and Measurements
The data were collected at various growth stages and at harvest to assess plant performance. Plant height was measured from ground level to the main shoot tip. The number of mature cobs per plant was recorded from ten plants and averaged. Cob length was measured on ten randomly selected cobs, whereas the number of seeds per cob was calculated by counting the number of seeds in the selected rows and then multiplying by the number of rows in each cob. The grain yield per plot was determined by cleaning, drying, and weighing cobs and then adjusting to a standard 12% moisture content.
2.6 Physiological and Biochemical Measurements
NDVI values were assessed with a GreenSeeker to quantify vegetation by measuring the difference between near-infrared (NIR) and red-light reflections. Canopy coverage was measured via the Canopeo mobile app (Oklahoma State University) at intervals ranging from 20–100 days after sowing. Canopeo quantifies fractional green canopy cover by analyzing digital images in real time. The app uses a color thresholding algorithm to distinguish green vegetation from soil and other background elements, providing an accurate, rapid, and non-destructive estimate of live canopy cover. It reports canopy cover as the percentage of ground covered by green vegetation, making it especially useful in monitoring crop growth and assessing the effects of management practices. In this study, Canopeo was used for its portability, ease of use, and high-throughput capability, allowing consistent and timely data collection directly from the field.
The chlorophyll content of the main shoot flag leaf at several growth stages was determined with a SPAD meter (Model: SPAD-502, Minolta Co., Ltd., Tokyo, Japan). This instrument estimates relative chlorophyll concentration based on light absorbance at two specific wavelengths regions-red (600–700 nm) and near-infrared-where chlorophyll exhibits characteristic absorption. The SPAD-502 measures light transmission through a small leaf area of 2 mm × 3 mm, providing a non-destructive and rapid estimation of chlorophyll content.
SPAD readings were recorded from the middle section of the flag leaf of the tagged main shoot at six different growth stages: 40, 60, 80, 100, 120, and 140 days after sowing (DAS). The device is self-calibrating, ensuring consistency across measurements. For each experimental plot, SPAD values represent the average of five readings per sampling event.
The leaf area index (LAI) was calculated with an automatic leaf area meter (Model: LICOR-3300, LI-COR Inc., Lincoln, NE, USA) via the Radford equation at 40, 60, 80, 100, 120, and 140 days after sowing (DAS). Measurements were taken from plants within a 1 m2 area in each plot to ensure representative sampling.
The Leaf Area Index (LAI) at each growth stage was then calculated following the method described by Radford (1967), using the formula:
The chlorophyll and carotenoid concentrations were estimated via Arnon’s method via a spectrophotometer. Fresh leaf tissue (0.5 g) was homogenized in 10 mL of 80% acetone at 4°C and centrifuged at 2500 rpm for 10 min. The process was repeated until the residue was colorless. The combined extract was brought to a final volume of 10 mL and absorbance was measured at 645, 663, and 480 nm using a UV-1800 spectrophotometer (Shimadzu, Kyoto, Japan), with 80% acetone as the blank.
Chlorophyll content was calculated using Arnon’s formulas and expressed as mg g−1 fresh weight (FW):
Carotenoid content was calculated following:
For enzyme activity analysis, 0.5 g of maize leaf tissue was homogenized in 1 mL of ice-cold 50 mM potassium phosphate buffer (pH 7.0) containing 100 mM KCl, 1 mM ascorbate, 5 mM β-mercaptoethanol, and 10% (w/v) glycerol. The homogenate was centrifuged at 11,500× g for 10 min at 4°C, and the supernatant was used for subsequent assays.
The leaf nitrate content (LNC) was measured via a LAQUAtwin Compact nitrate meter for immediate nitrogen status assessment in the field, which provides rapid, in-field readings of NO3− or NO3−-N concentrations (ppm). The device was calibrated with 150 and 2000 ppm NO3− standards, corresponding to 34 and 450 ppm NO3−-N, respectively.
For measurement, 0.1 g of fresh leaf tissue was homogenized with 1 mL distilled water, vortexed, and centrifuged for 4 min. A 0.1 mL aliquot of the supernatant was applied to the sensor. The sensor was rinsed and dried after each use. This method enables quick, low-cost nitrogen assessment in plant tissue. The total dry matter (TDM) content was determined via oven-dried plants sampled at different intervals during growth.
2.7 Imaging and Statistical Analysis
Images of the crop canopies were captured above the canopy using a Canon camera (EOS 700D DSLR camera) and smartphone (Samsung Galaxy S21), both offering high-resolution imaging and consistent color accuracy. Images were saved in JPEG format for standardized analysis. Data analysis was performed via STAR Version 2.0.1 (IRRI 2014), Microsoft Excel 2016, and the R (R Development Core Team, 2018) with “tree”, “cv.tree” and “prune.tree” package with the functions “agrocolea”, treatment means compared via LSD at the 5% significance level. We used one-way ANOVA for data analysis to compare treatment effects at individual time points.
3.1 Plant Height and Leaf Area Index (LAI) of Maize Hybrids as Influenced by Varieties and Levels of Nitrogen
The hybrid maize varieties presented significant differences in plant height across both seasons (Fig. 1). The BARI hybrid maize 9 had the tallest plants, reaching 239.29 cm in 2017–2018, whereas P3396 consistently had shorter plants. Increased nitrogen application (300 kg N ha−1) significantly increased plant height, with the tallest plants observed in the BARI hybrid maize 9 × 300 kg N ha−1 combination (219.10 cm in 2016–2017 and 196.84 cm in 2017–2018) (Fig. 1).
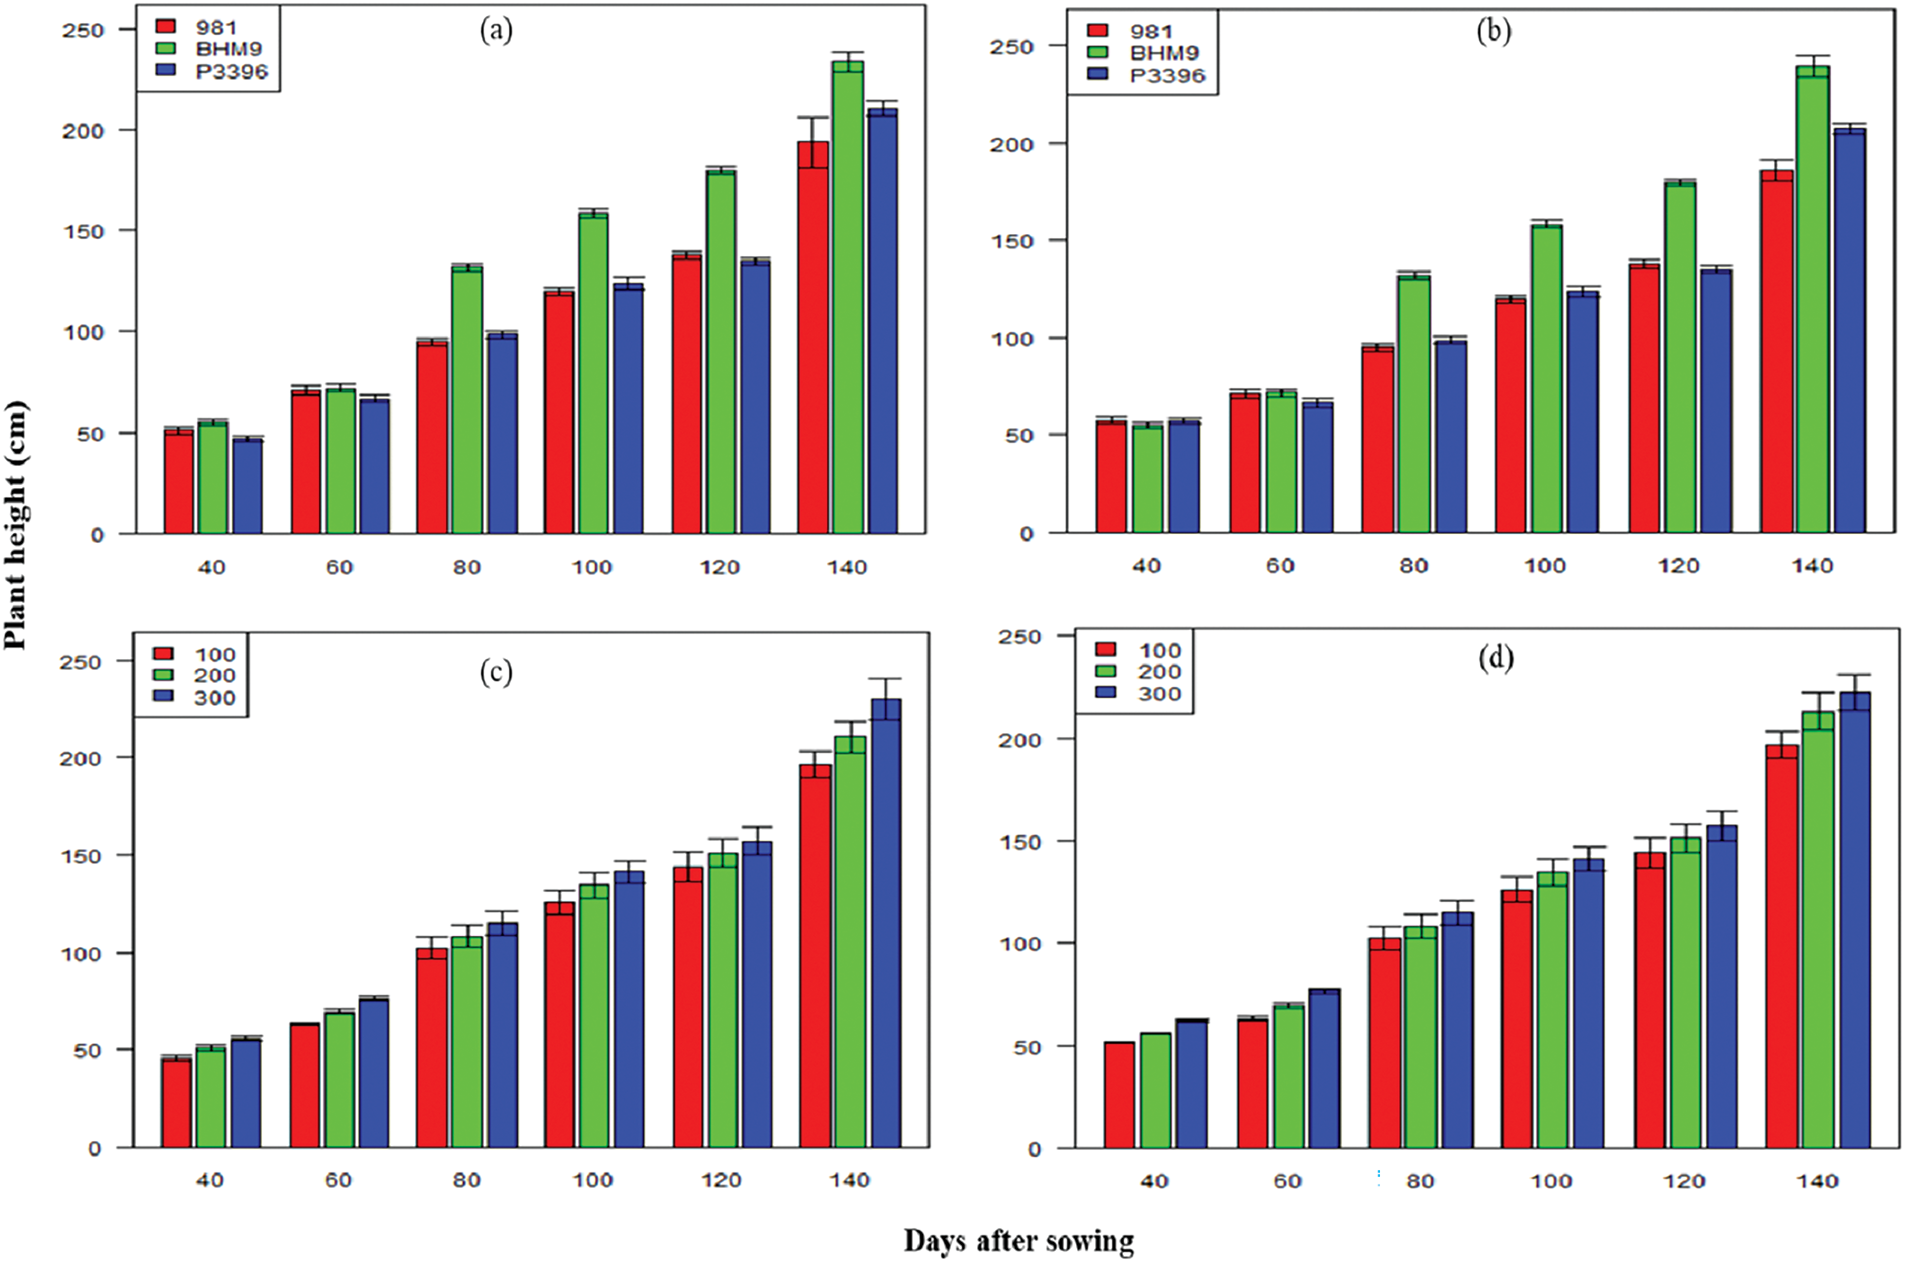
Figure 1: Effects of hybrid maize variety (a,b) and nitrogen level (c,d) on plant height on different days after sowing from 2016–2017 and 2017–2018
The lowest plant height was recorded at 100 kg N ha−1. The LAI values increased until 100 days after sowing (DAS) and declined thereafter (Fig. 2). BARI hybrid maize 9 presented the highest LAI across both years, with peak values of 3.22 at 100 DAS from 2016–2017 and 2.76 from 2017–2018. The nitrogen level significantly affected the LAI, with 300 kg N ha−1 resulting in the highest LAI at all stages. The interaction effect between variety and nitrogen level was significant, with the BARI hybrid maize (9 × 300 kg N ha−1) achieving the highest LAI values in both seasons (Fig. 2).
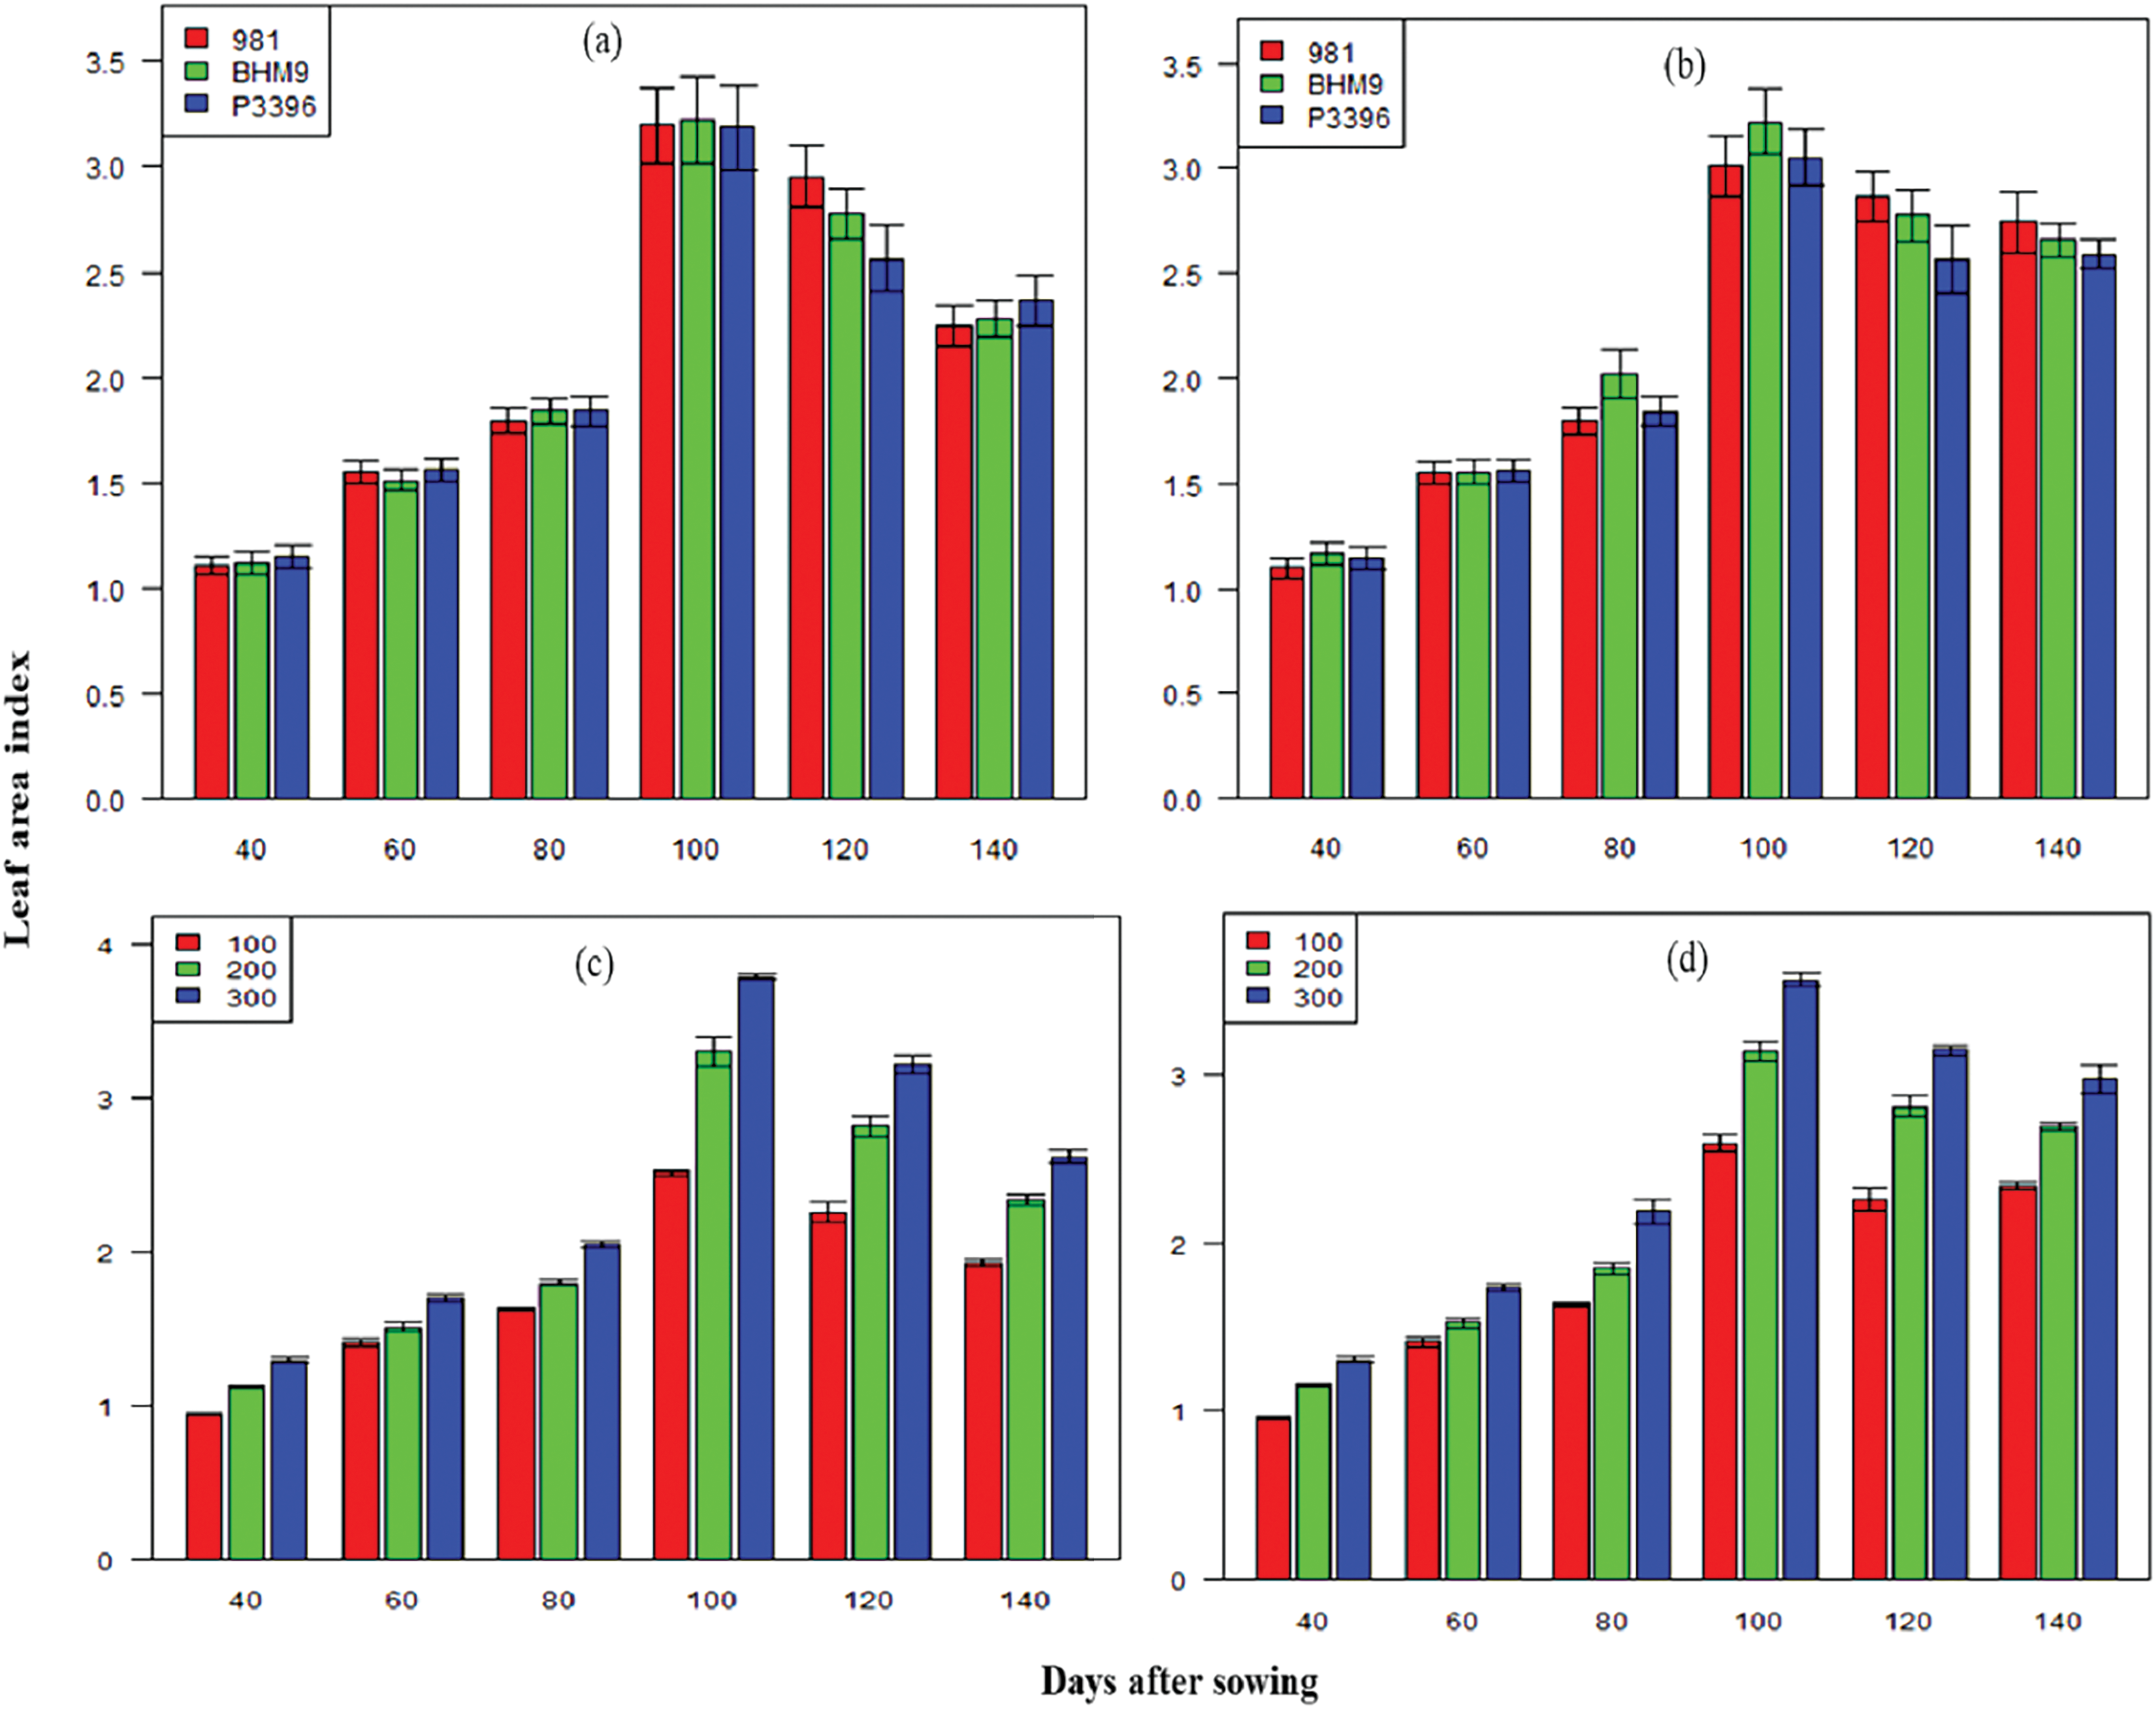
Figure 2: Effects of hybrid maize variety (a,b) and nitrogen level (c,d) on the leaf area index on different days after sowing from 2016–2017 and 2017–2018
3.2 Normalized Difference Vegetation Index (NDVI) Values as Influenced Varieties and Levels of Nitrogen
The NDVI values increased up to 100 DAS and decreased thereafter (Fig. 3). Hybrid 981 recorded the highest NDVI, peaking at 0.98 at 100 DAS from 2016–2017. The highest NDVI was also found with 300 kg N ha−1, ranging from 0.57–0.98 in 2016–2017 and 0.56–0.90 in 2017–2018. The BARI hybrid maize 9 × 300 kg N ha−1 combination consistently presented the highest NDVI values, reaching 0.99 from 2016–2017 and 0.92 from 2017–2018.
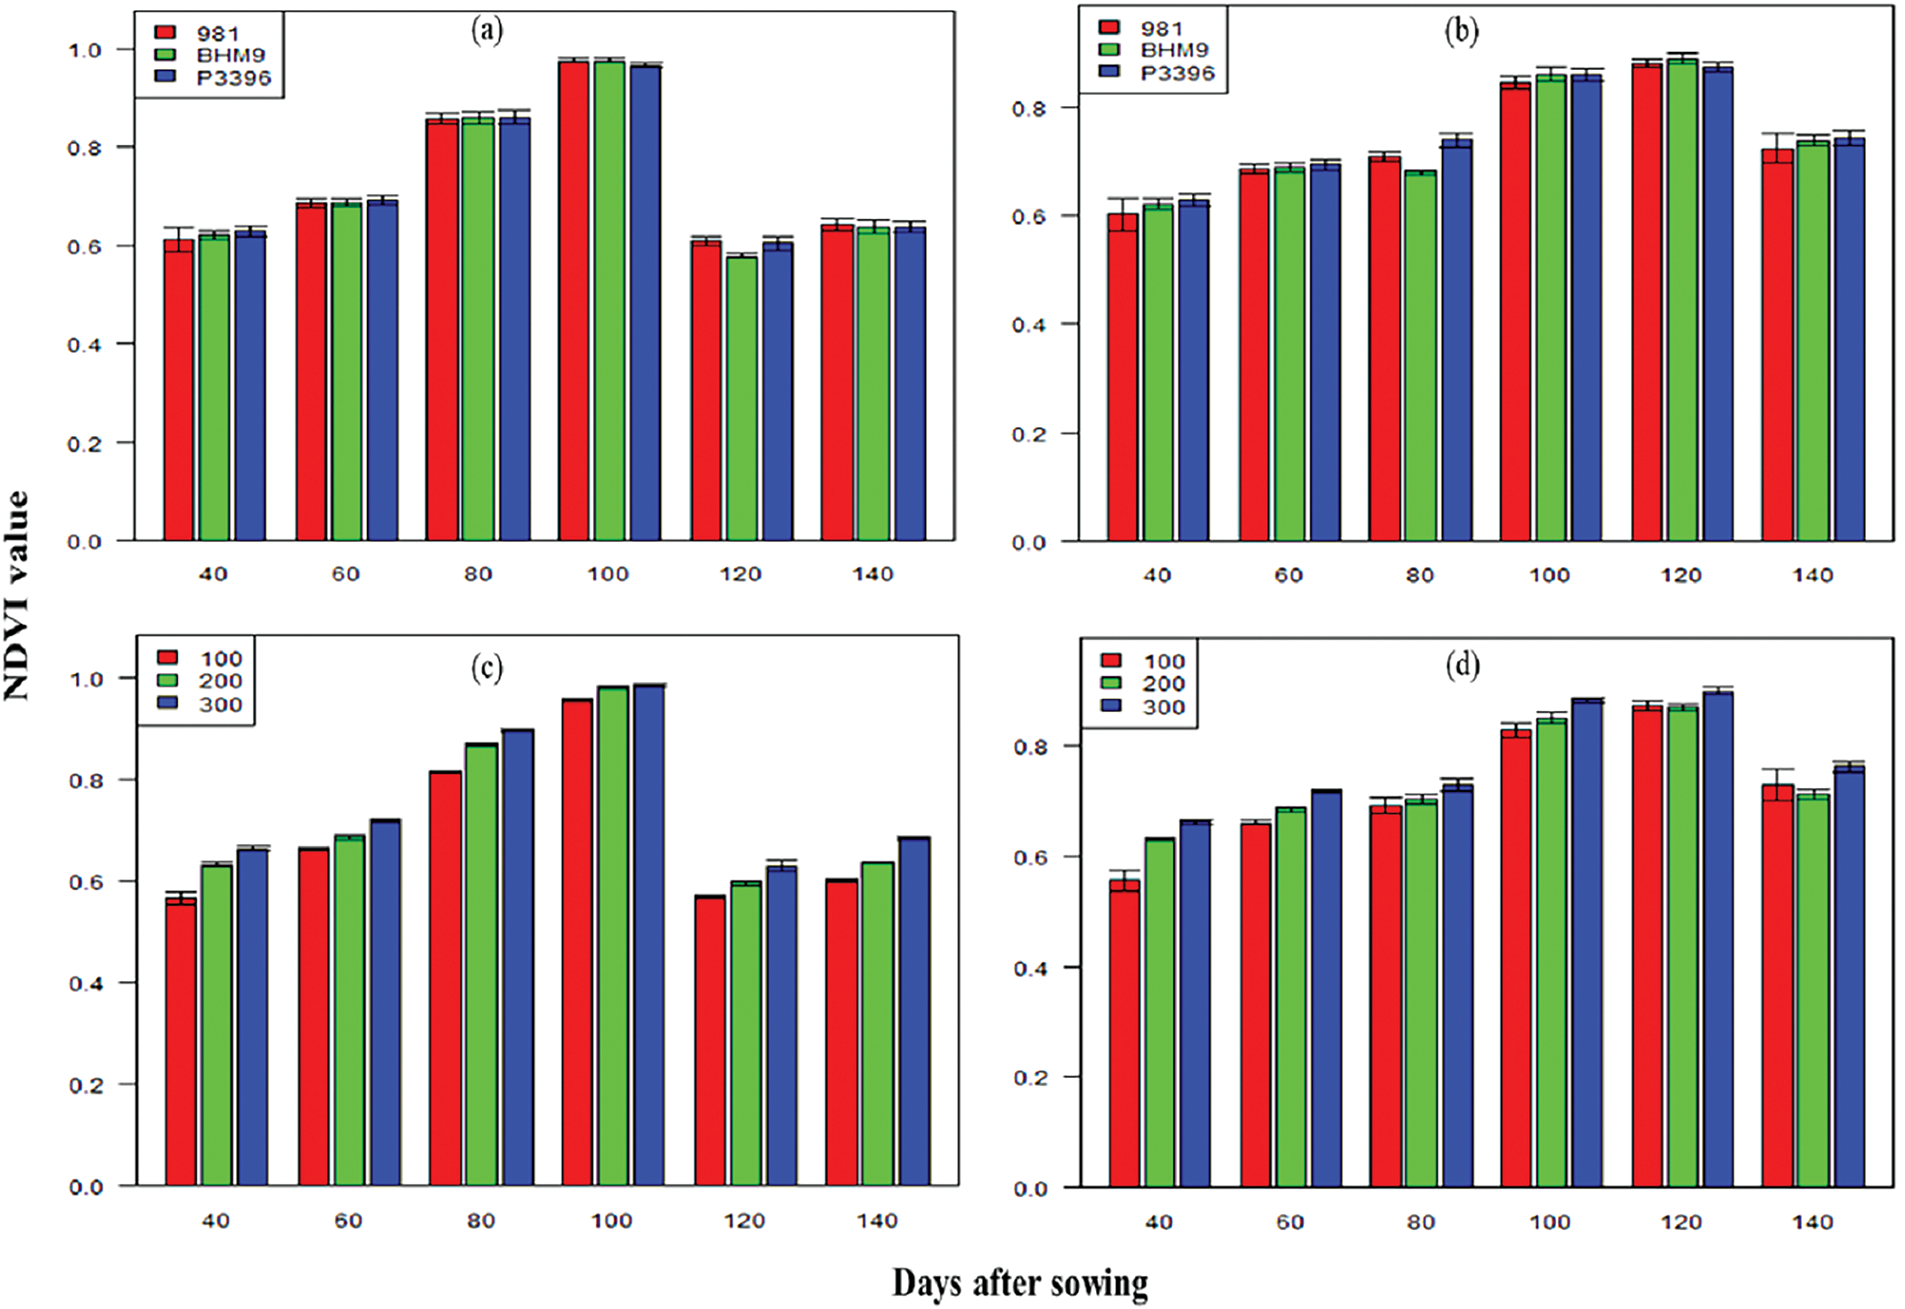
Figure 3: Effects of hybrid maize variety (a,b) and nitrogen level (c,d) on the NDVI value on different days after sowing from 2016–2017 and 2017–2018
3.3 Canopy Cover (CC) of Maize Hybrids as Influenced Varieties and Levels of Nitrogen
The CC values increased until 100 DAS and then decreased (Fig. 4). BARI hybrid maize 9 and hybrid 981 presented the highest CC, peaking at 0.73 from 2016–2017 and 0.63 from 2017–2018. The highest CC was observed with 300 kg N ha−1, with values peaking at 0.98 at 100 DAS from 2016–2017 and remaining high from 2017–2018. The interaction effect between variety and nitrogen level was significant, with the BARI hybrid maize (9 × 300 kg N ha−1) having the highest CC in both years.
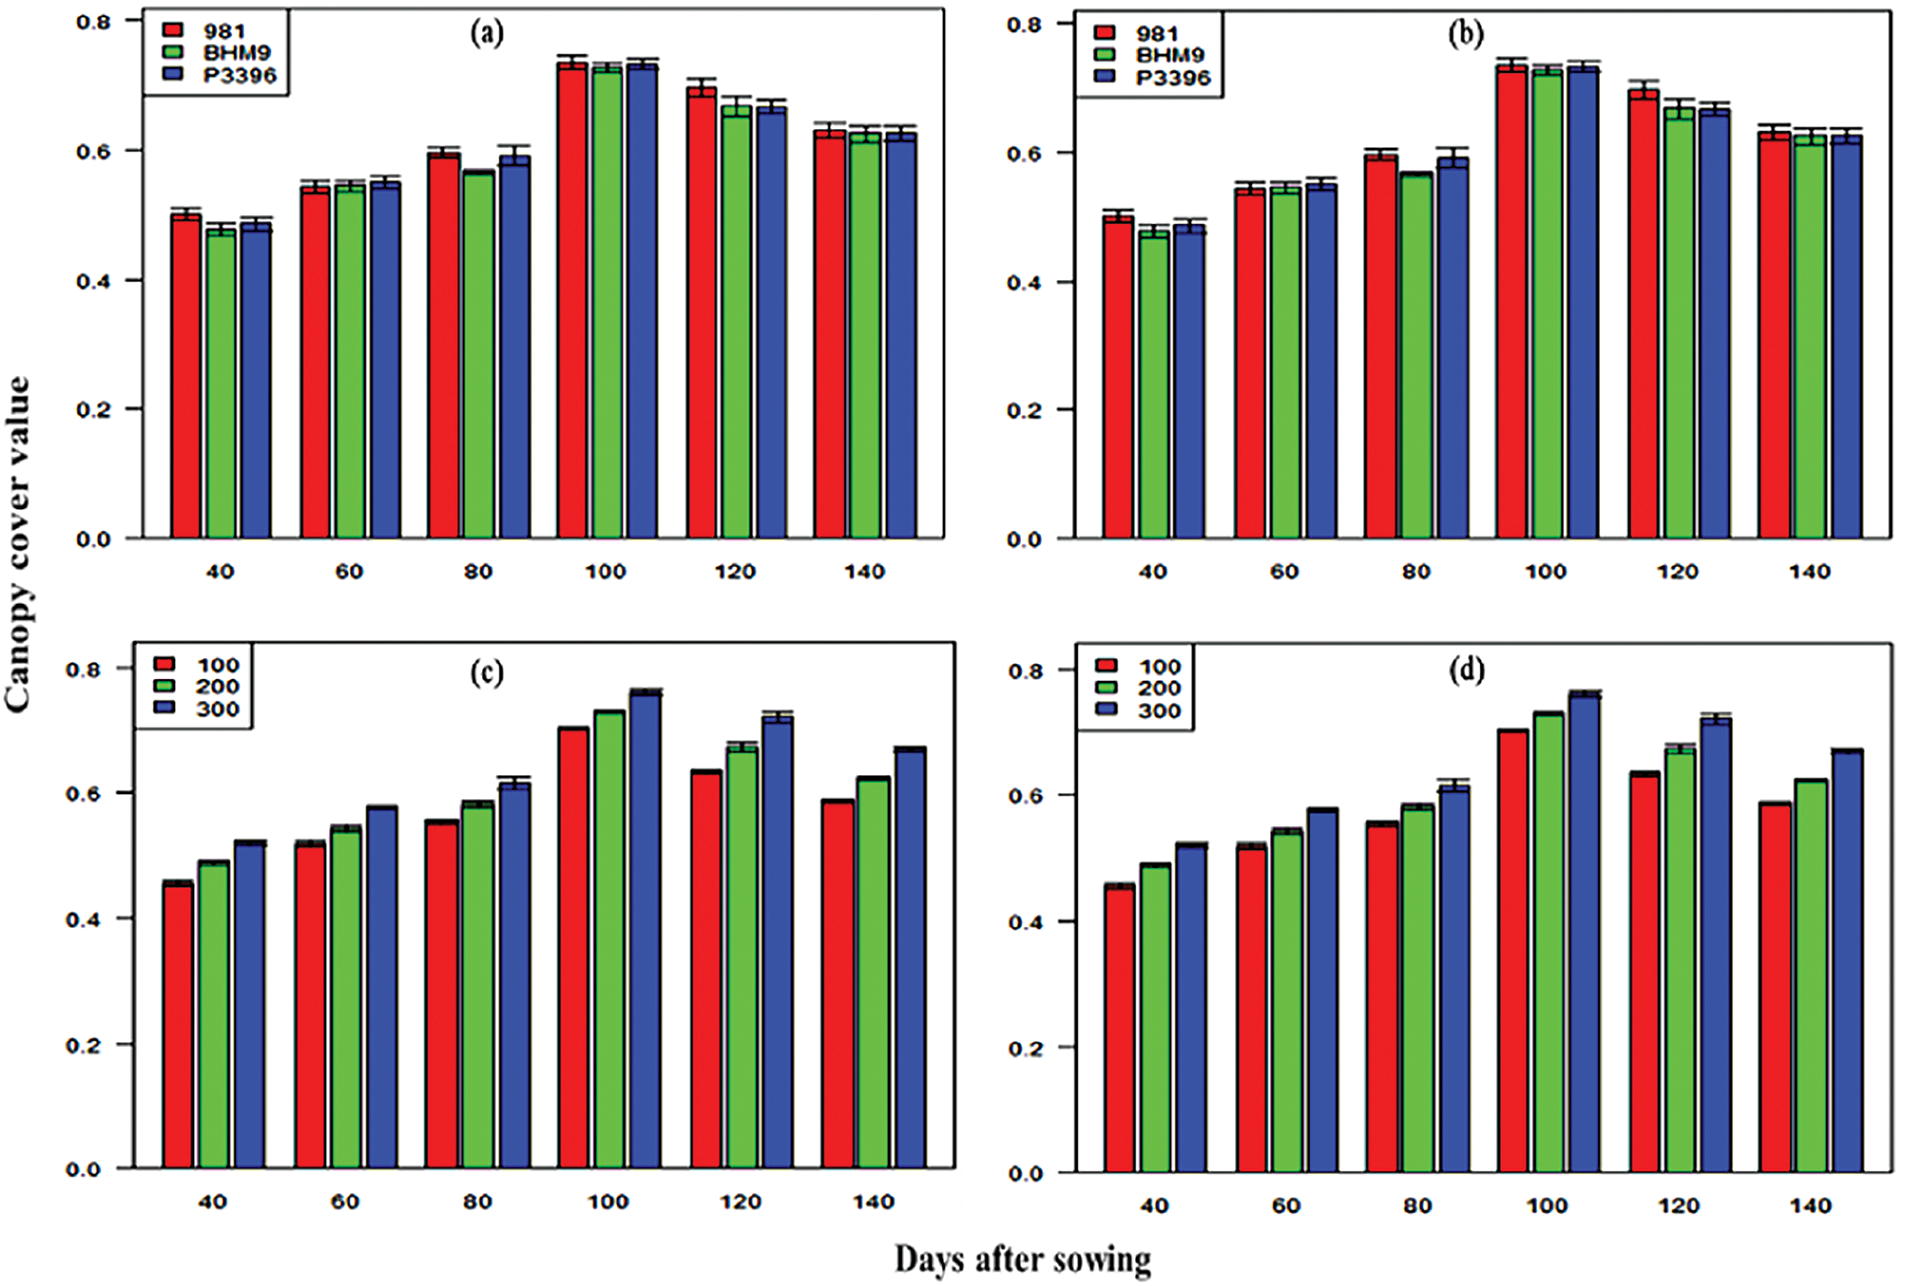
Figure 4: Effects of hybrid maize variety (a,b) and nitrogen level (c,d) on canopy cover (CC) values on different days after sowing from 2016–2017 and 2017–2018
3.4 Total Dry Matter (TDM) Accumulation in Maize Hybrids as Influenced by Varieties and Levels of Nitrogen
TDM accumulation varied significantly across hybrid maize varieties and nitrogen levels (Fig. 5). In 2016–2017, the TDM ranged from 443.02 to 1932.18 g m−2, and from 525.83 to 1990.56 g m−2 in 2017–2018. The P3396 hybrid presented the highest TDM from 2016–2017. Nitrogen application significantly influenced TDM, with the highest TDM recorded at 300 kg N ha−1 (0.63–0.98 g m−2 in 2016–2017 and 0.63–0.87 g m−2 in 2017–2018). The P3396 × 300 combination produced the highest TDM in both years.
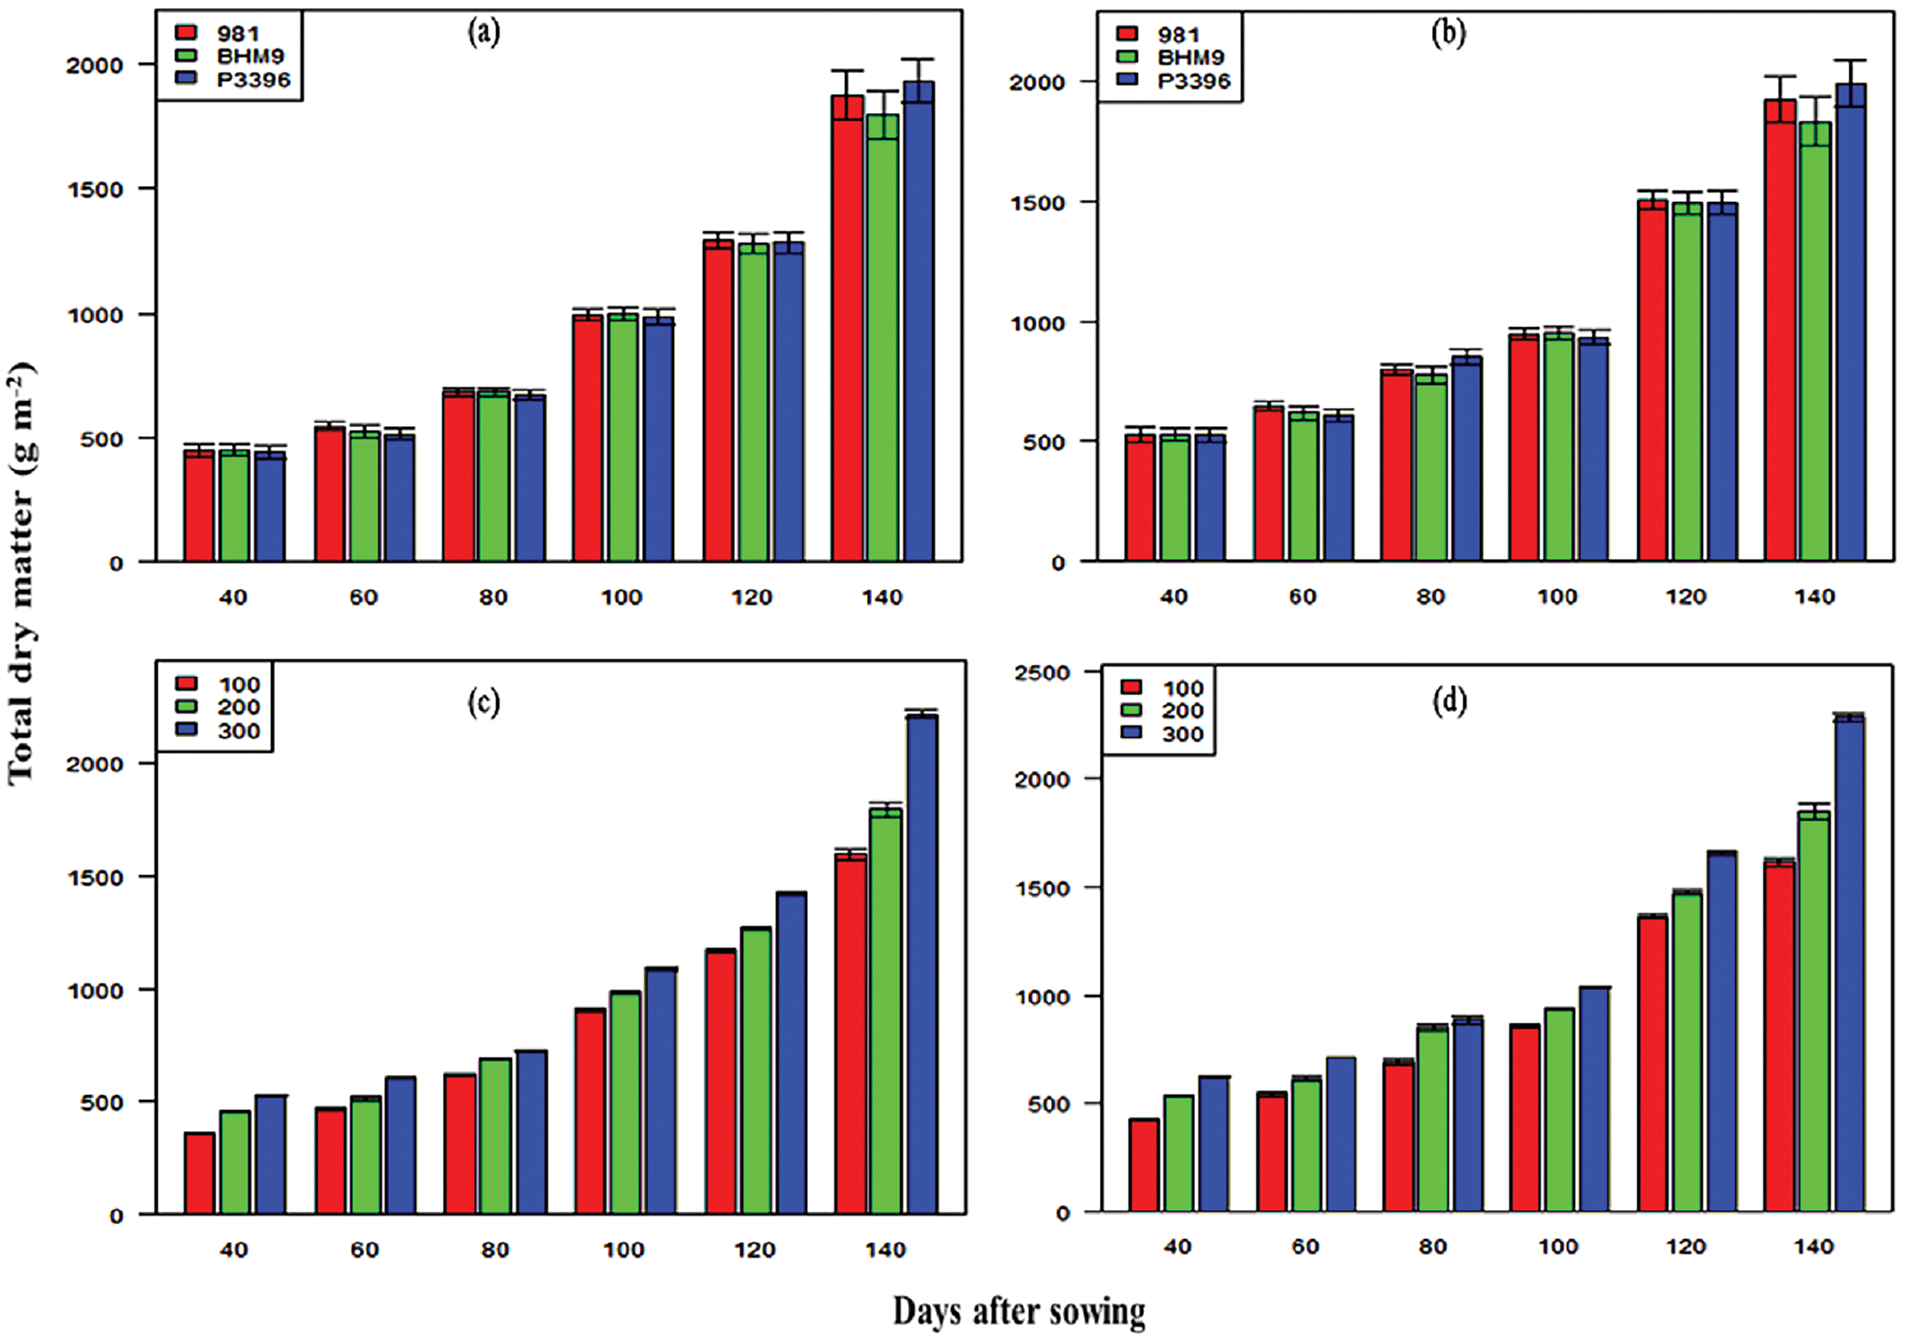
Figure 5: Effects of hybrid maize variety (a,b) and nitrogen level (c,d) on total dry matter (g m2) on different days after sowing from 2016–2017 and 2017–2018
3.5 SPAD Value-Based Analysis of Leaf Chlorophyll a (Chl a) and Leaf Chlorophyll b (Chl b) Content as Influenced Varieties and Levels of Nitrogen
The SPAD values for the hybrid maize varieties significantly varied across growth stages (Fig. 6). The values ranged from 43.19–67.63 in 2016–2017 and 42.10–68.30 in 2017–2018. The P3396 hybrid consistently presented the highest SPAD values. Nitrogen significantly influenced the SPAD values, with maximum values observed at 300 kg N ha−1 (36.99–71.86 in 2016–2017 and 37.40–71.90 in 2017–2018). The Chl a content significantly varied across maize varieties and nitrogen levels (Fig. 7), with P3396 showing the highest values (0.95–1.19 mg g−1 in 2016–2017 and 0.95–1.15 mg g−1 in 2017–2018). Nitrogen application at 300 kg N ha−1 resulted in the highest Chl a content at all stages (0.91–1.16 mg g−1 in 2016–2017 and 0.95–1.17 mg g−1 in 2017–2018). The Chl b content increased until 100 DAS but then decreased (Fig. 8). BHM 9 presented the highest Chl b values (0.84–1.17 mg g−1 in 2016–2017 and 0.89–1.19 mg g−1 in 2017–2018). Nitrogen significantly affected the Chl b content, with the highest values occurring at 300 kg N ha−1 (0.89–1.15 mg g−1 in 2016–2017 and 0.78–1.14 mg g−1 in 2017–2018).
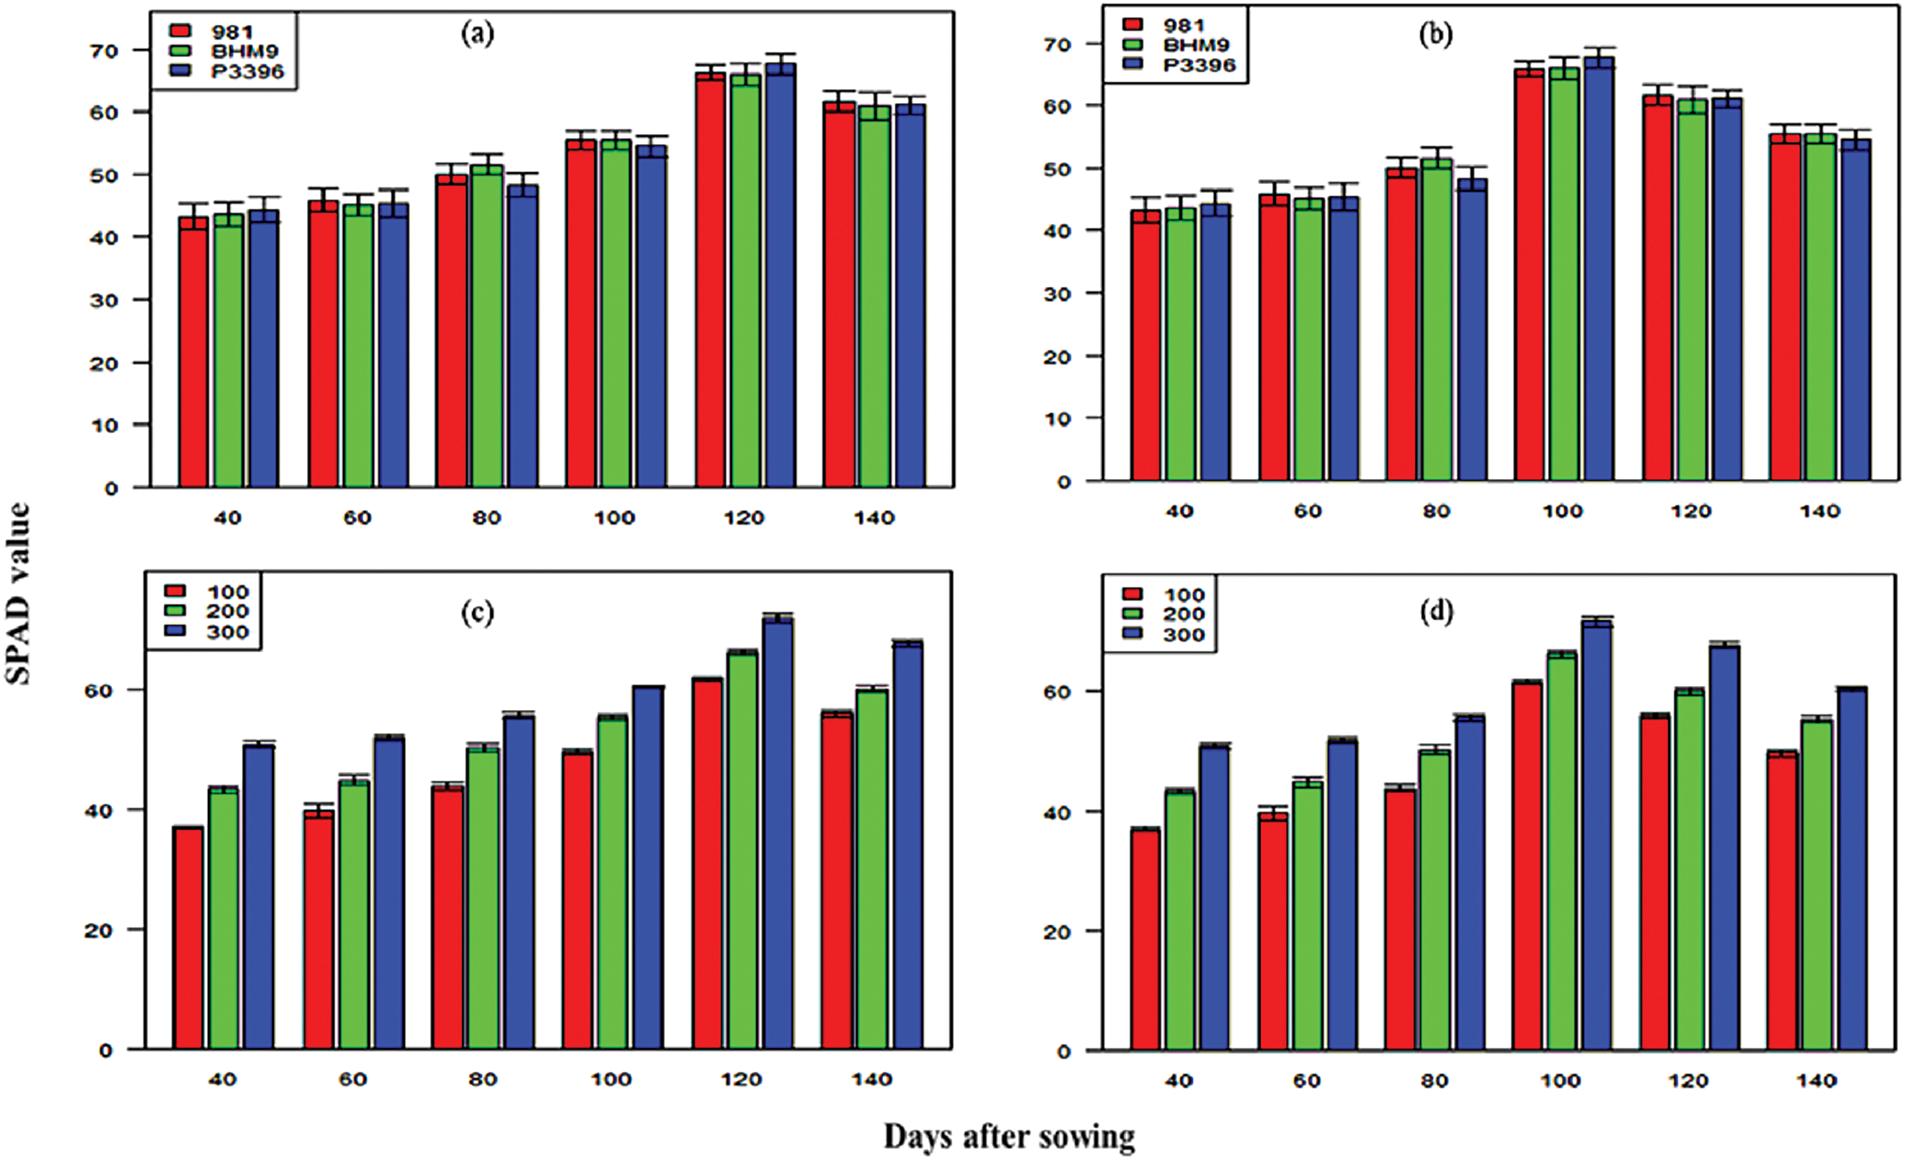
Figure 6: Effects of hybrid maize variety (a,b) and nitrogen level (c,d) on SPAD values on different days after sowing from 2016–2017 and 2017–2018
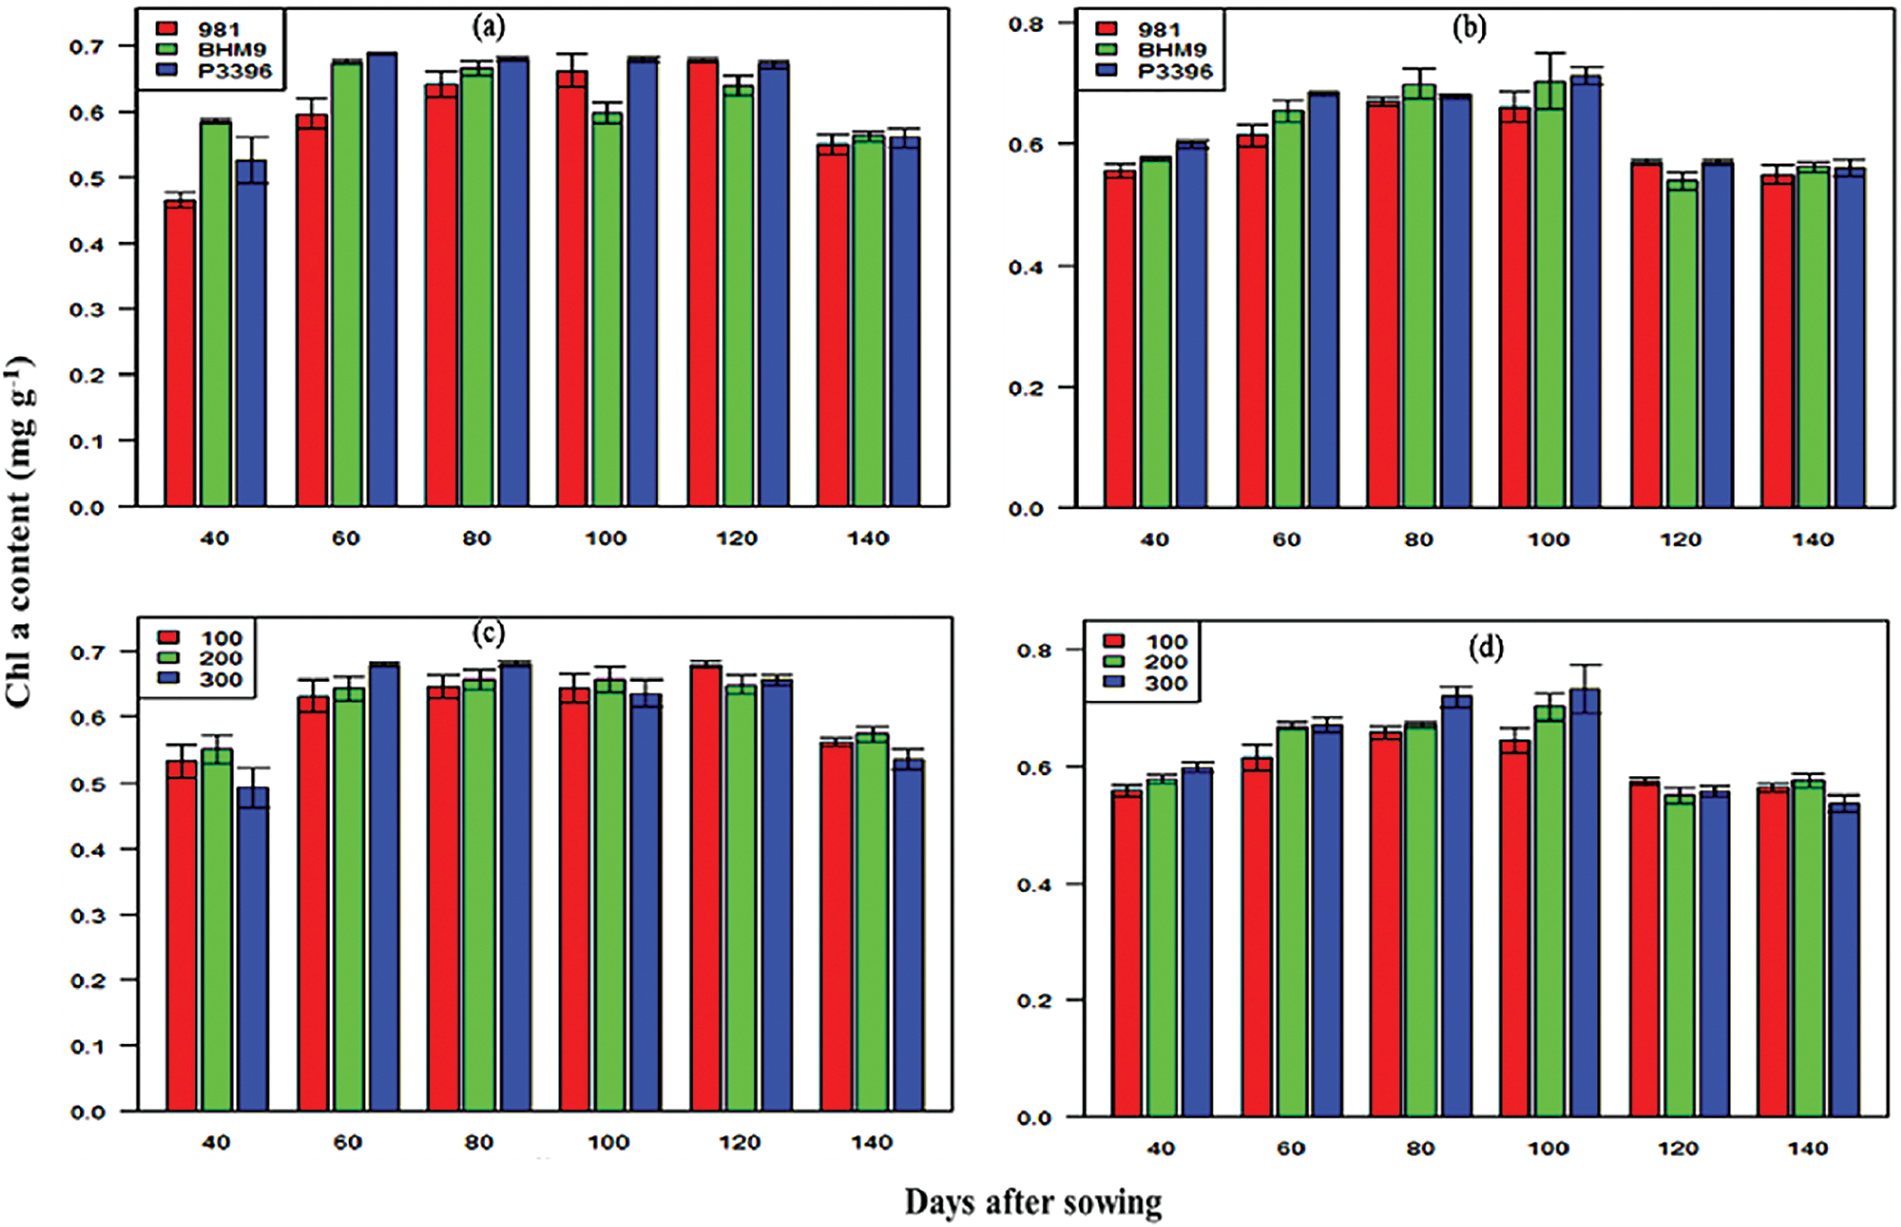
Figure 7: Effects of hybrid maize variety (a,b) and nitrogen level (c,d) on the Chl a content on different days after sowing from 2016–2017 and 2017–2018
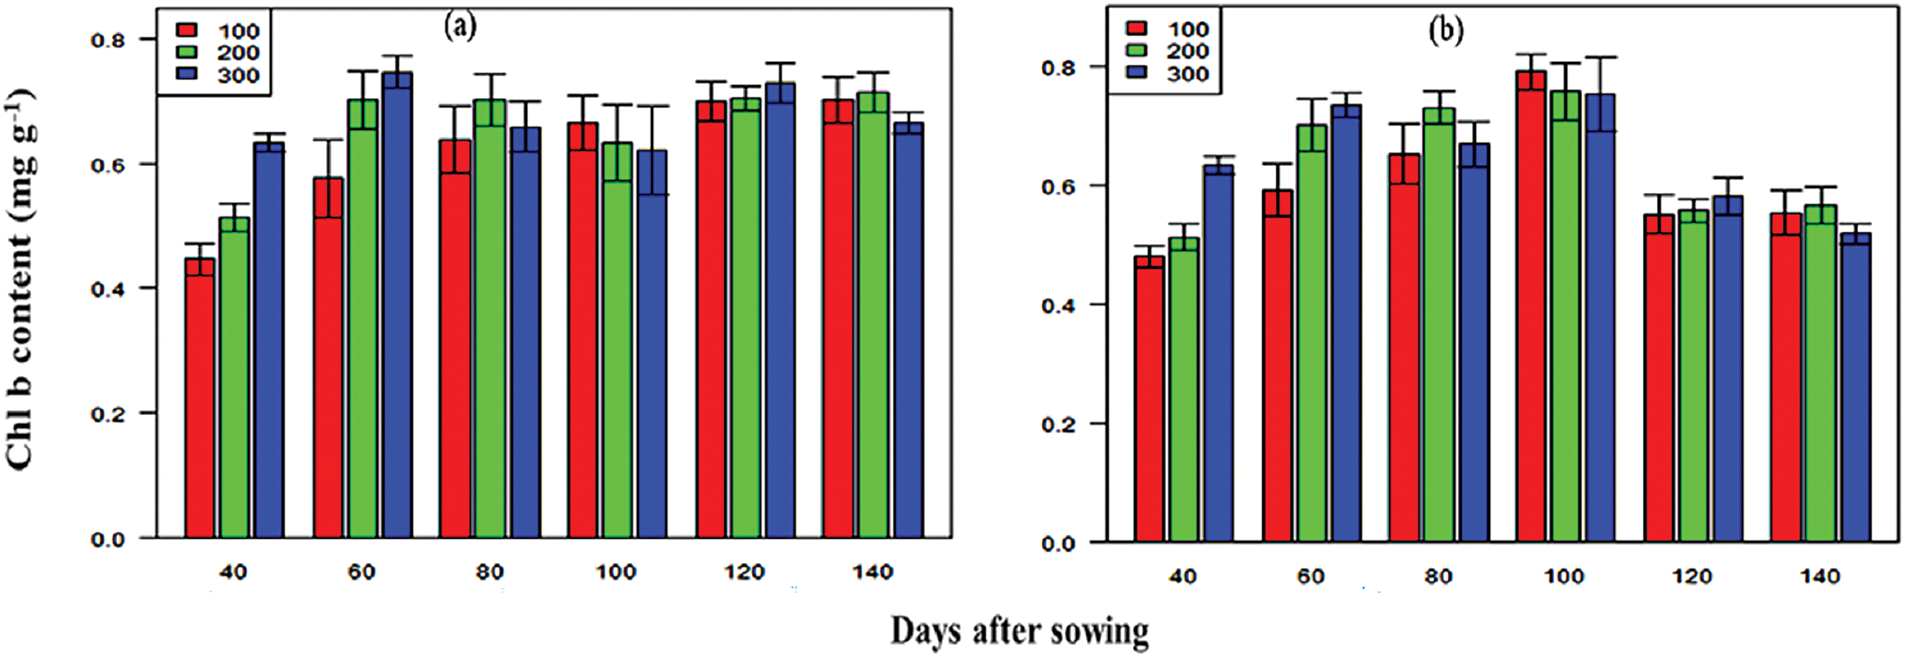
Figure 8: Effects of nitrogen level (a,b) on the Chl b content on different days after sowing from 2016–2017 and 2017–2018
3.6 Leaf Carotenoid Content (LCC) and Leaf Nitrogen Content (LNC) of Maize Hybrids Influence Varieties and Levels of Nitrogen
The LCC significantly varied across maize varieties and nitrogen levels (Fig. 9). BHM 9 presented the highest LCC (0.19–0.24 mg g−1 in 2016–2017 and 0.37–0.42 mg g−1 in 2017–2018) (Fig. 9).
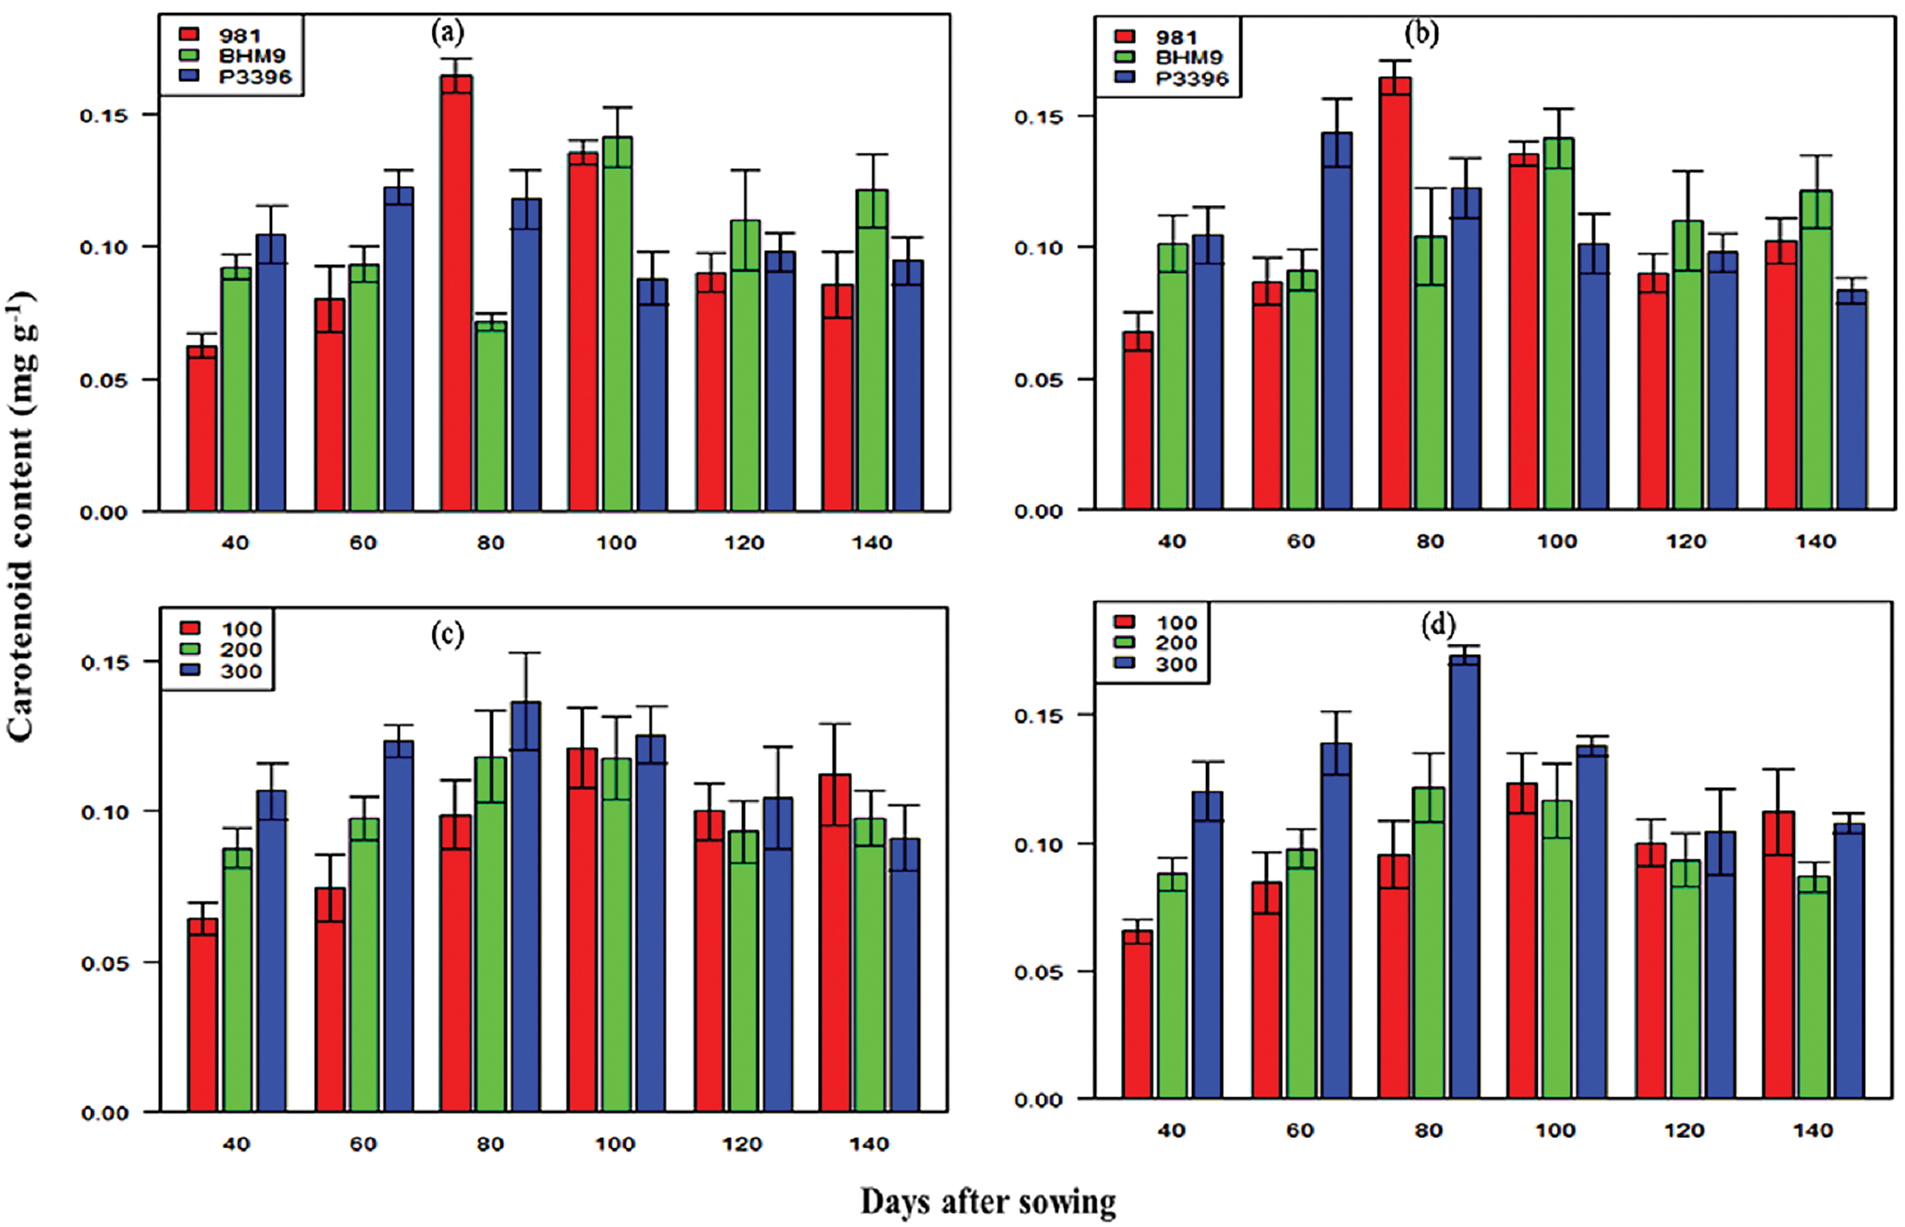
Figure 9: Effects of hybrid maize variety (a,b) and nitrogen level (c,d) on leaf carotenoid content (LCC) on different days after sowing from 2016–2017 and 2017–2018
Nitrogen at 300 kg N ha−1 resulted in the highest LCC (0.19–0.24 mg g−1 in 2016–2017 and 0.37–0.42 mg g−1 in 2017–2018). LNC steadily increased up to 100 DAS and varied between varieties (Fig. 10). BHM 9 had the highest LNC (1724 ppm at 120 DAS in 2016–2017 and 1713 ppm in 2017–2018). Nitrogen at 300 kg N ha−1 resulted in the highest LNC (1757 ppm at 140 DAS in 2016–2017 and 1740 ppm at 100 DAS in 2017–2018). The combination of BHM 9 × 300 kg N ha−1 resulted in the highest LNC.
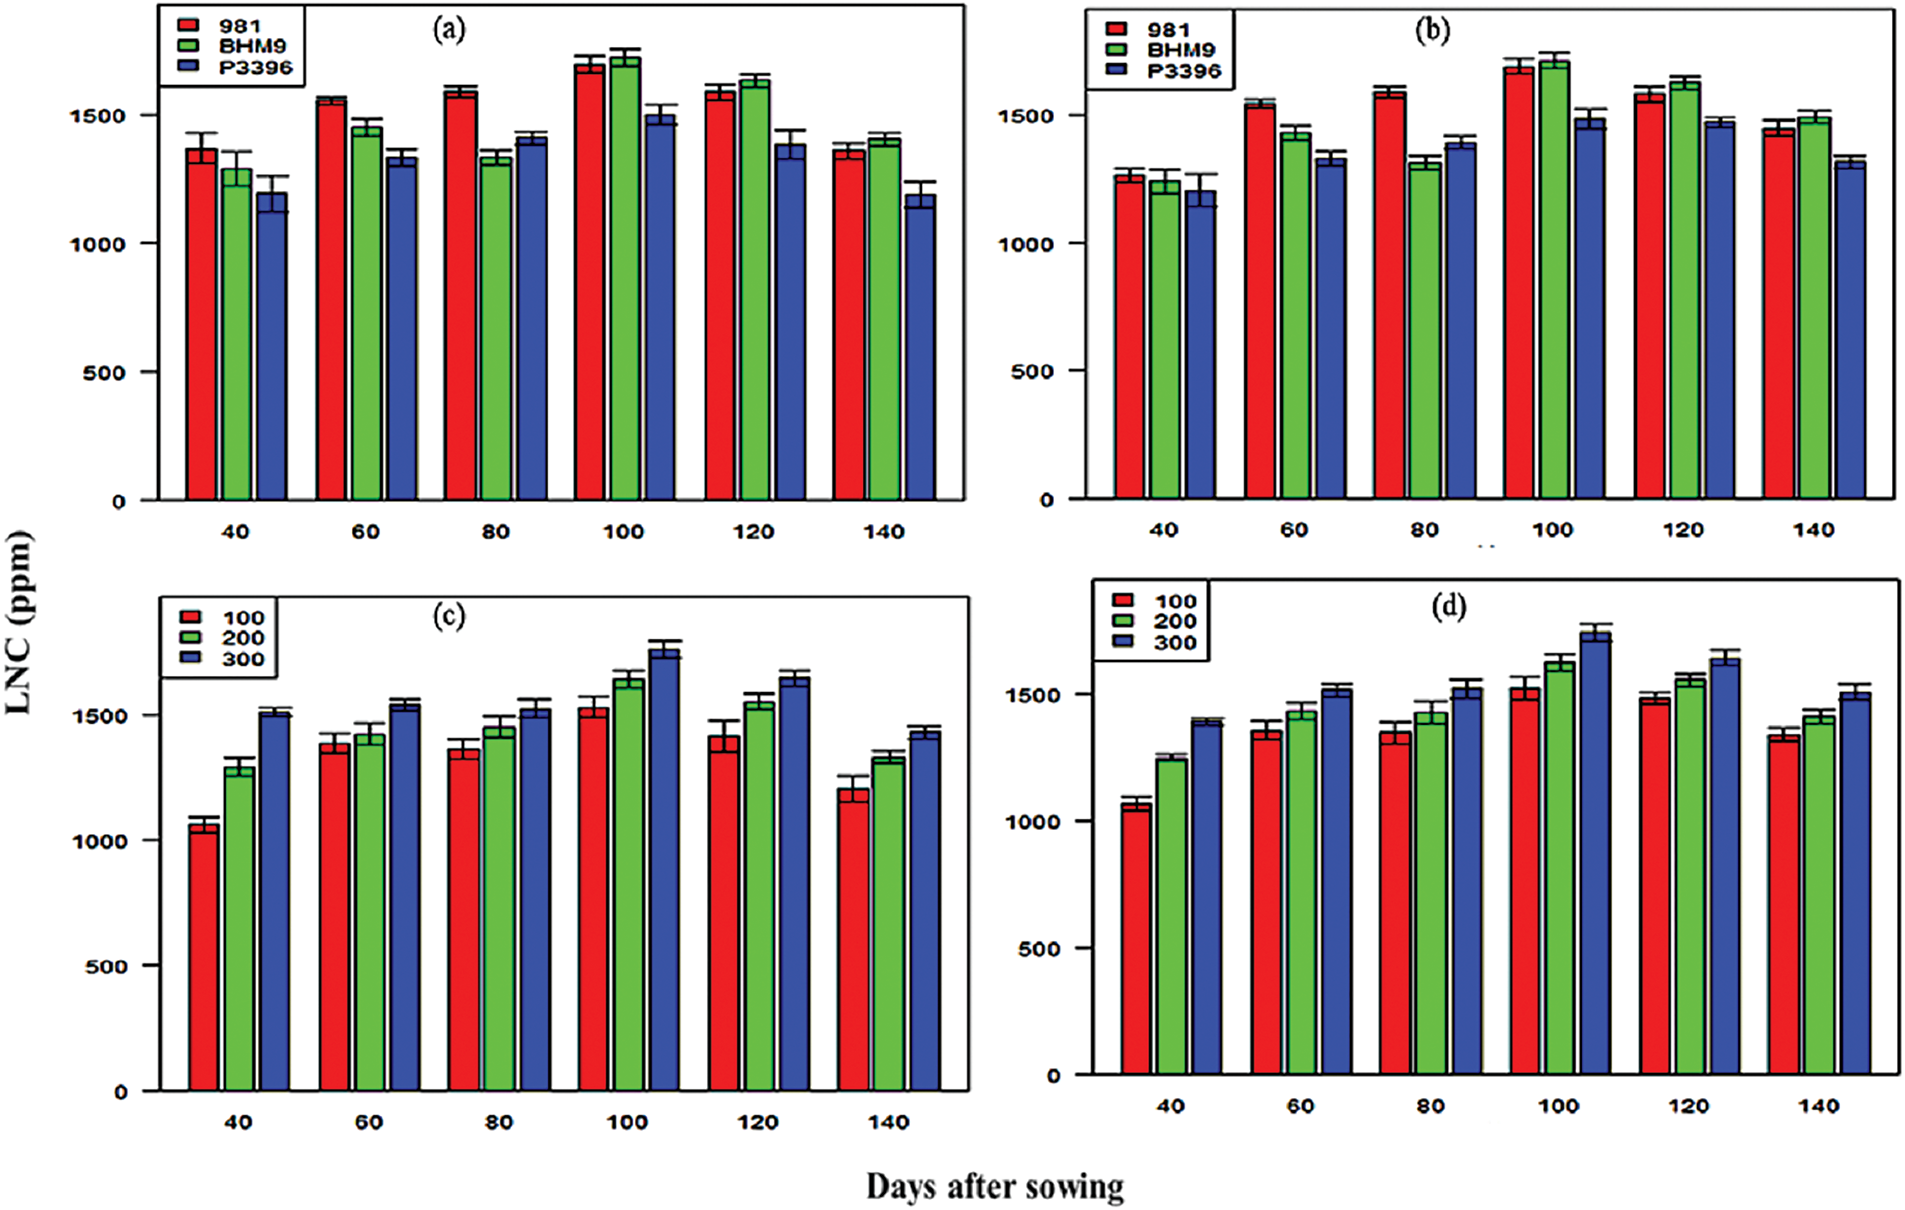
Figure 10: Effects of hybrid maize variety (a,b) and nitrogen level (c,d) on the leaf nitrogen content (LNC) on different days after sowing from 2016–2017 and 2017–2018
3.7 Yield and Yield Contributing Traits of Maize Hybrids as Influenced by Varieties and Nitrogen Levels
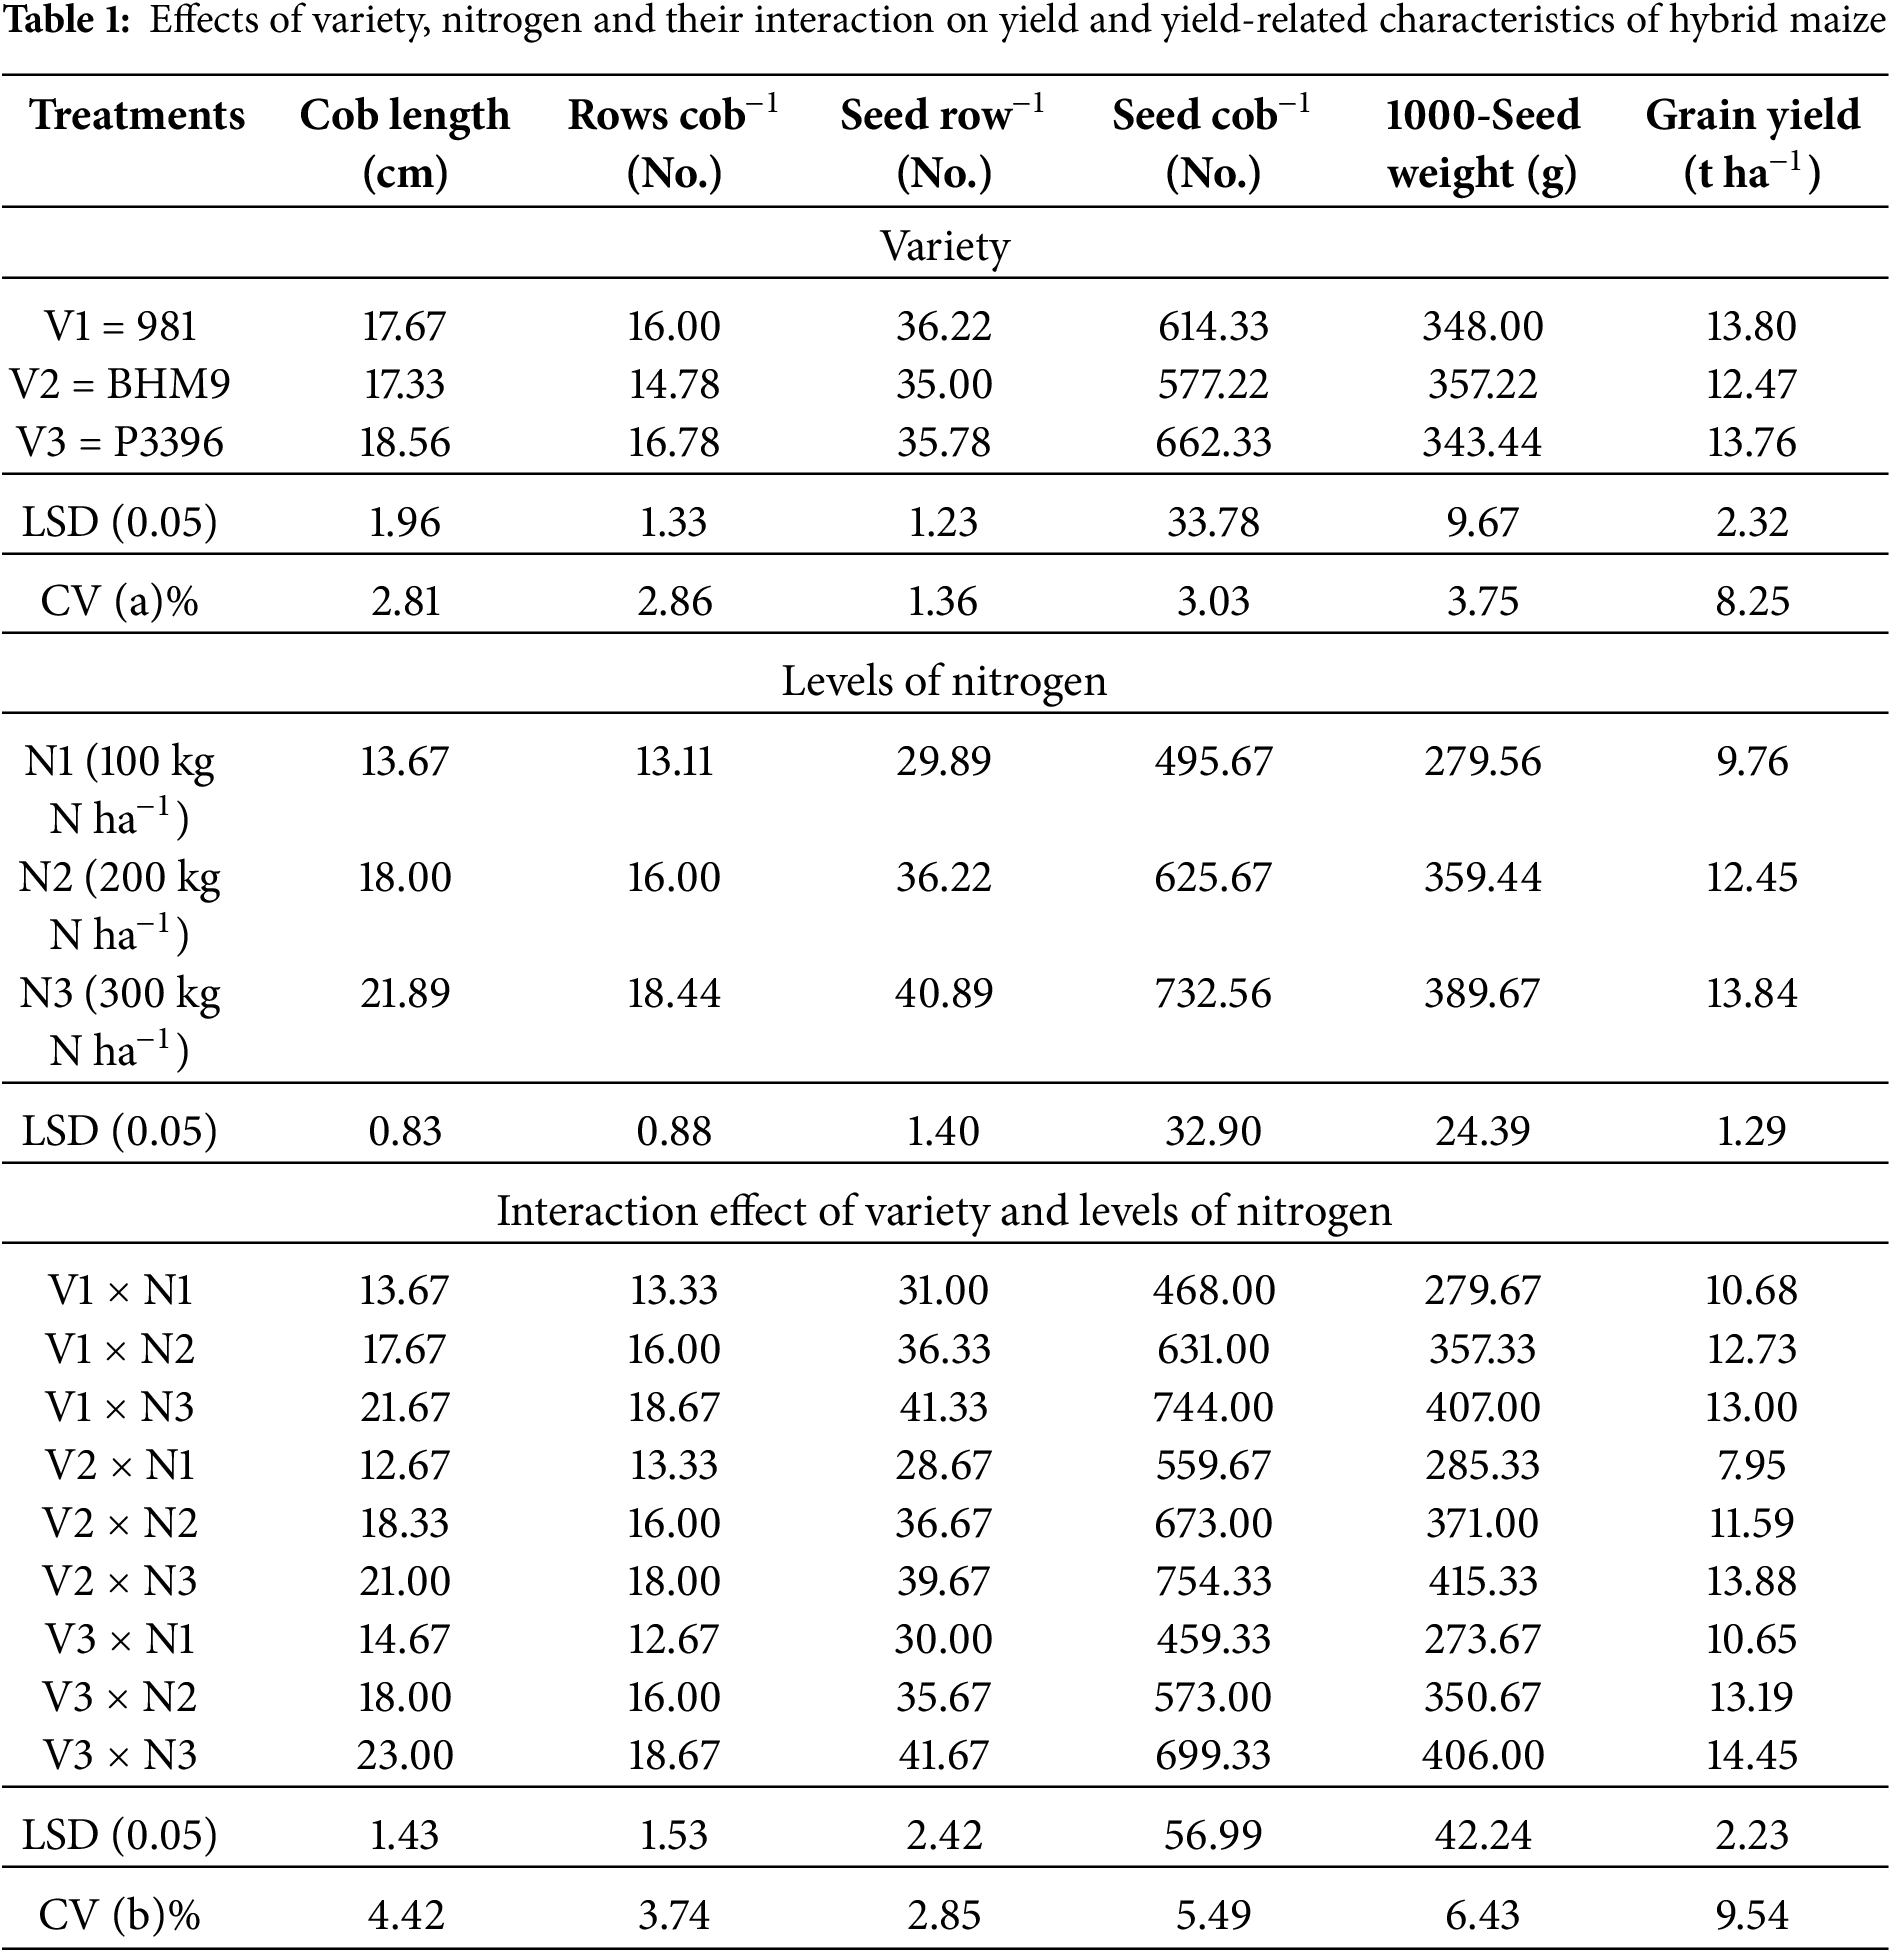
Plant height, ear height, phenological stages, seed number per cob (NSPC), 1000-seed weight (TSW), and grain yield (GY) were significantly affected by hybrid varieties, nitrogen (N) levels, and their interactions (Table S1). The tallest plants were recorded in BHM 9 (241.86 cm) and the shortest in Hybrid 981 (190.84 cm). Nitrogen application increased plant height from 204.97 cm at N1 (100 kg N ha−1) to 227.45 cm at N3 (300 kg N ha−1), with the maximum (251.68 cm) in BHM 9 × N3 and minimum (181.85 cm) in Hybrid 981 × N1 (Table S1). Ear height followed a similar trend, ranging from 70.00 cm (Hybrid 981 × N1) to 94.33 cm (BHM 9 × N3). Days to 50% tasselling and silking increased with nitrogen; Hybrid 981 × N1 was earliest to tassel and silk (66.33 and 74.67 days, respectively), while P3396 × N3 was latest (97.67 and 101.67 days) (Table S1). NSPC was highest in P3396 × N3 and lowest in BHM 9 × N1, while TSW ranged from 273.67 g (Hybrid 981 × N1) to 415.33 g (P3396 × N3) (Table S1). Grain yield varied significantly, with the highest (14.45 t ha−1) in P3396 × N3, and the lowest (7.95 t ha−1) in Hybrid 981 × N1. Overall, increased nitrogen enhanced yield and yield traits across all hybrids (Table 1).
3.8 Nitrogen Response: Plant Height, Leaf Area Index (LAI), NDVI, CC, and TDM
The plant height, LAI, and NDVI of hybrid maize responded linearly to increasing nitrogen levels (Fig. S3). The R2 values for plant height were 0.97 (981), 0.98 (BHM 9), and 0.99 (P3396), indicating taller plants with higher nitrogen doses. The LAI also showed a strong response, with R2 values of 0.96 (981, BHM 9) and 0.98 (P3396), whereas the NDVI increased linearly, with R2 values of 0.93 (981), 0.99 (BHM 9), and 0.95 (P3396). The CC and TDM of hybrid maize also exhibited significant linear responses to nitrogen. For CC, the R2 values were 0.99 (981), 0.94 (BHM 9), and 0.95 (P3396), and for TDM, the R2 values were 0.95 (981), 0.99 (BHM 9), and 0.97 (P3396), indicating increased TDM and CC with increasing nitrogen levels.
3.9 Genotypic (rg) and Phenotypic (rp) Correlation Matrix of Hybrid Maize Traits
The genotypic (rg) and phenotypic (rp) correlation matrices of hybrid maize traits presented greater genotypic correlations, indicating a stronger genetic influence on trait associations (Fig. 11). Plant height had significant positive correlations with several traits: LAI (rg = 0.79, rp = 0.75), NDVI (rg = 0.56, rp = 0.50), CC (rg = 0.64, rp = 0.60), SPAD (rg = 0.64, rp = 0.57), and TDM (rg = 0.91, rp = 0.89). The LAI was also strongly correlated with the NDVI (rg = 0.88, rp = 0.81), CC (rg = 0.96, rp = 0.94), SPAD (rg = 0.96, rp = 0.91), LNC (rg = 0.75, rp = 0.71), and TDM (rg = 0.70, rp = 0.69). The NDVI was significantly correlated with CC (rg = 0.93, rp = 0.88), SPAD (rg = 0.91, rp = 0.84), and LNC (rg = 0.80, rp = 0.70). CC was strongly correlated with SPAD (rg = 0.97, rp = 0.94), LNC (rg = 0.83, rp = 0.78), and TDM (rg = 0.55, rp = 0.54), with environmental factors influencing CC more than other traits did.
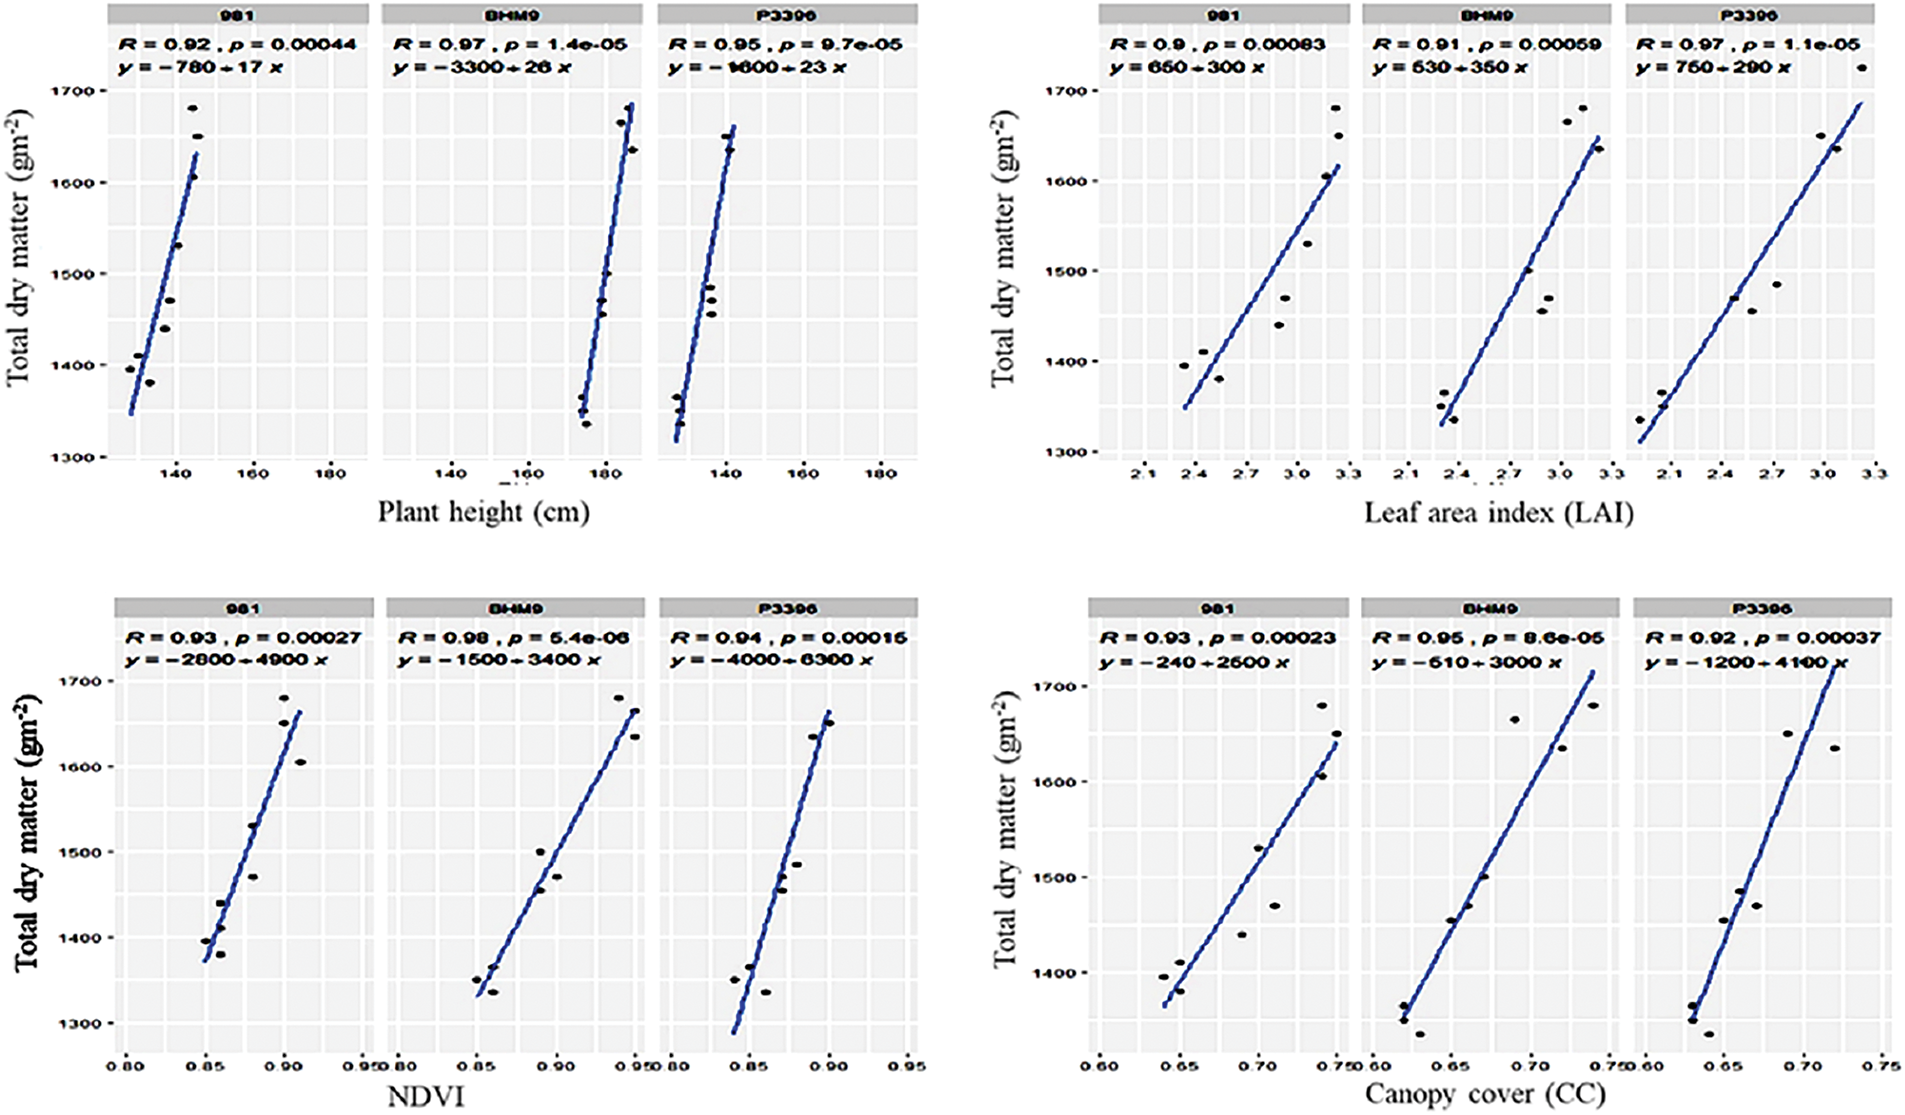
Figure 11: Relationships between total dry matter (g m−2) and plant height, leaf area index, NDVI, and CC of hybrid maize varieties
3.10 Relationships between Traits and TDM
Regression analysis revealed strong linear relationships between morphophysiological traits and TDM in hybrid maize (Fig. 11). The plant height, LAI, and NDVI were positively correlated with the TDM, with R2 values of 0.99 (981), 0.94 (BHM 9), and 0.95 (P3396) for the plant height; 0.90 (981), 0.91 (BHM 9), and 0.97 (P3396) for the LAI; and 0.93 (981), 0.98 (BHM 9), and 0.94 (P3396) for the NDVI.
3.11 Relationships between CC SPAD, LNC, Chl, and TDM
Canopy cover (CC), SPAD, LNC, chlorophyll content, and carotenoid content presented positive linear relationships with TDM (Fig. 11). The CC had R2 values of 0.93 (981), 0.95 (BHM 9), and 0.92 (P3396); the SPAD had R2 values of 0.96 (981), 0.99 (BHM 9), and 0.96 (P3396); and the LNC had R2 values of 0.93 (981), 0.92 (BHM 9), and 0.90 (P3396). Chlorophyll a and carotenoids are also strongly correlated with TDM.
Fig. 12 shows that the SPAD values were positively correlated with Chl a (rg = 0.35, rp = 0.16), Chl b (rg = 0.85, rp = 0.18), Car (rg = 0.31, rp = 0.30), LNC (rg = 0.77, rp = 0.76), and TDM (rg = 0.54, rp = 0.53). Chl a was correlated with Chl b (rg = 0.50, rp = 0.35), Car (rg = 0.61, rp = −0.32), LNC (rg = 0.35, rp = 0.20), and TDM (rg = 0.50, rp = 0.39). Chl b had positive correlations with Car (rg = 0.65, rp = 0.15), LNC (rg = 0.53, rp = 0.19), and TDM (rg = 0.35, rp = 0.14). LNC was significantly correlated with Car (rg = 0.54, rp = 0.43) and TDM (rg = 0.63, rp = 0.33), highlighting the link between nitrogen content and biomass.
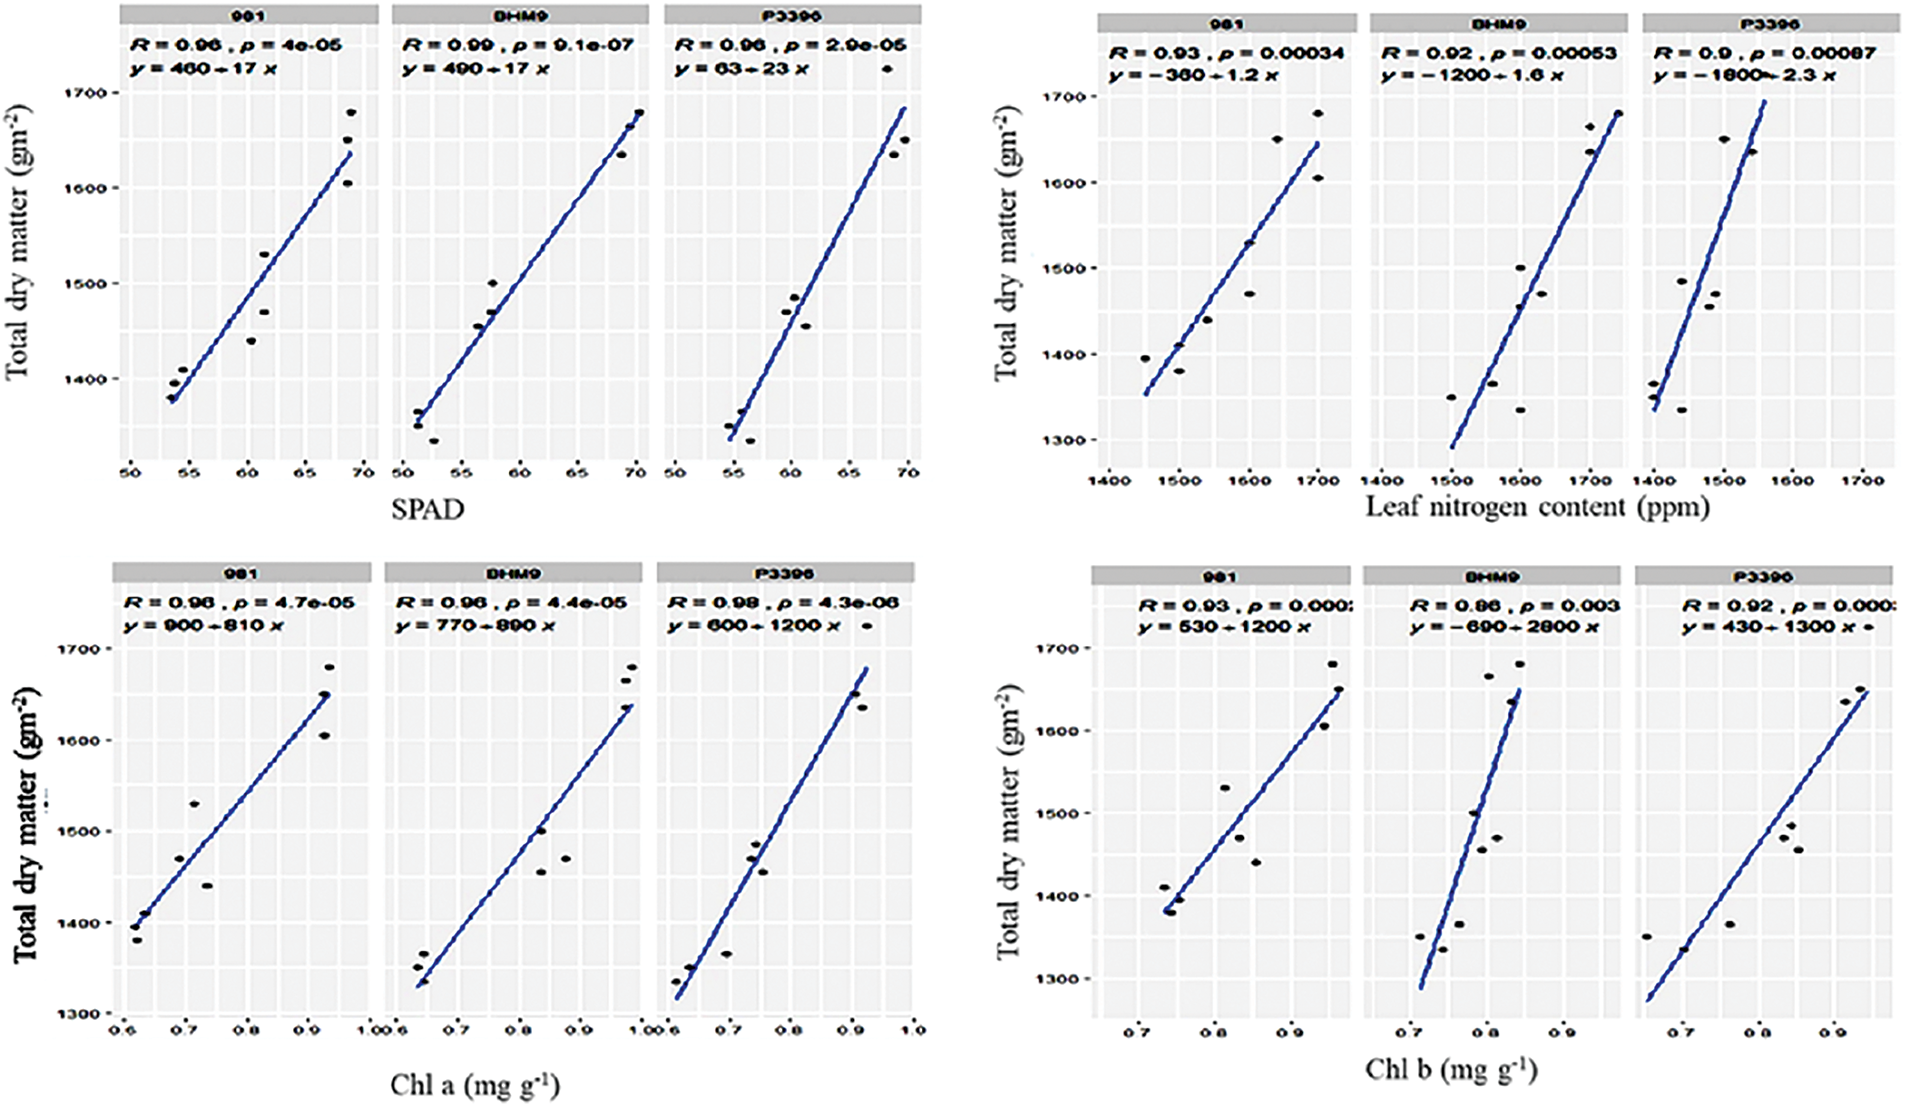
Figure 12: Relationships between total dry matter (g m−2) and SPAD, leaf nitrogen content, Chl a, and Chl b of hybrid maize varieties
3.13 Multivariate Analysis and Correlation Analysis of Morphological and Physiological Traits
Biplot analysis revealed that the first two principal components explained 85.06% of the total variation (Fig. 13). Treatments 8 and 9 (N2 × V3 and N3 × V3) presented high values for traits such as LNC, and hierarchical clustering identified four distinct groups on the basis of trait similarity. Pearson’s correlation coefficients revealed (Fig. 14) strong positive correlations between grain yield and various traits, such as YTPH, EH, NDVI, LAI, NGS, Chl a, PH, SPAD, CC, and LNC, indicating that these traits contribute positively to yield (Fig. 15).
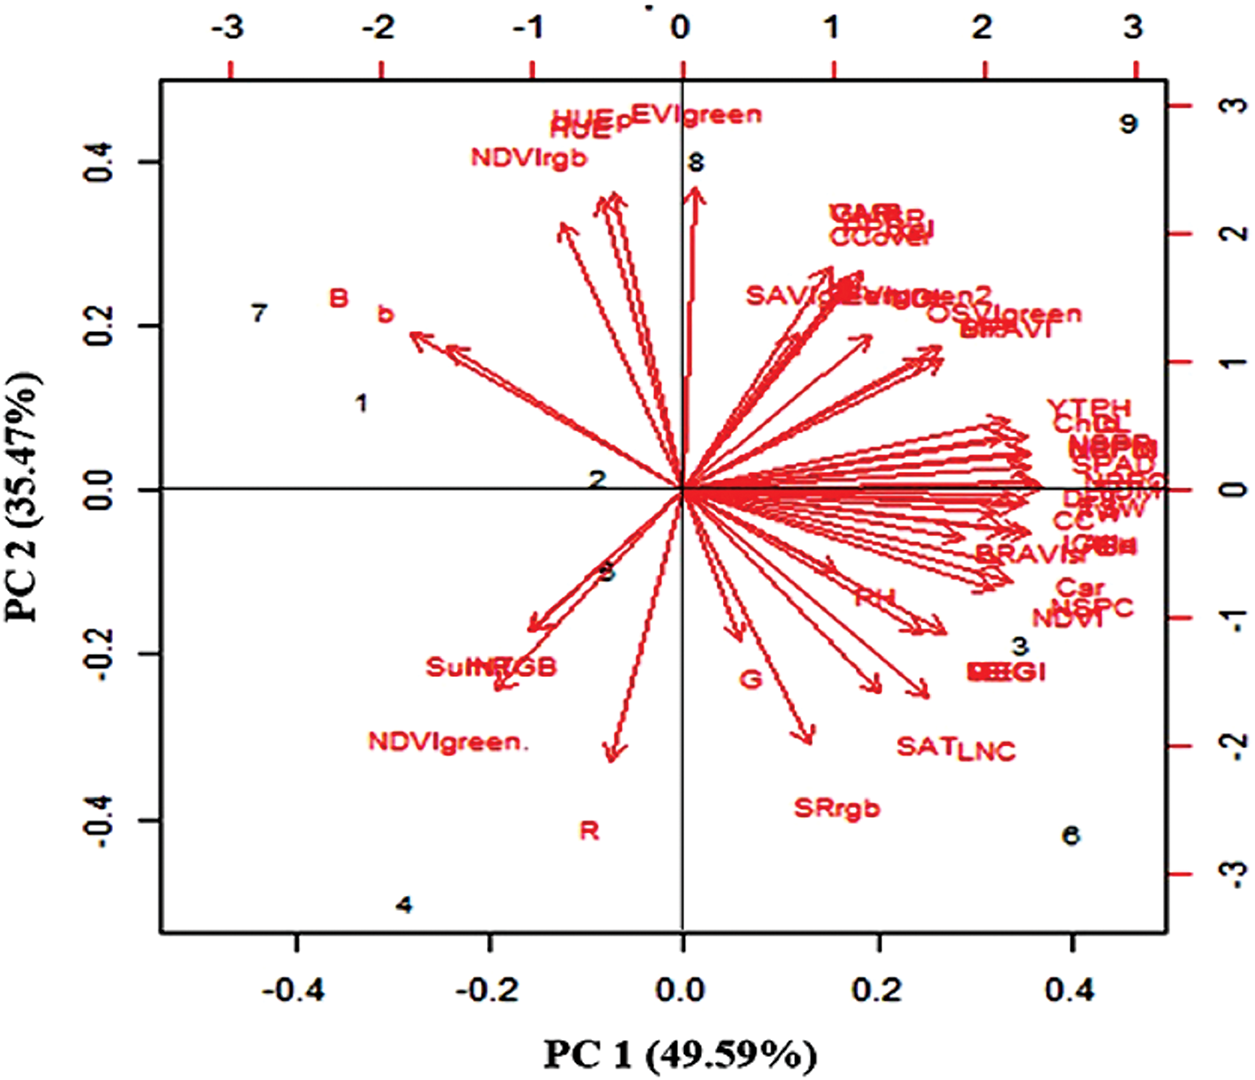
Figure 13: Ordination of treatment by trait biplots of principal component analysis output. The treatments are shown in black, and the traits are shown in red. All traits used for biplots of principal component analysis indicate from top left side are B, b, NDVIrgb, HUEp, HUE, EVIgreen, SAVIgreen, GMR, CCOVER, EVIgreen2, OSVIgreen, BRAVI, NPI, YTPH, Chlb, NPPM, SPAD, NSPR, DFT, FW, CC, GMR, BRAVIsr, Car, NSPC, NDVI, PH, EH, MEGI, LNC, SAT, SRrgb, G, R, NDVIgreen, SumRGB
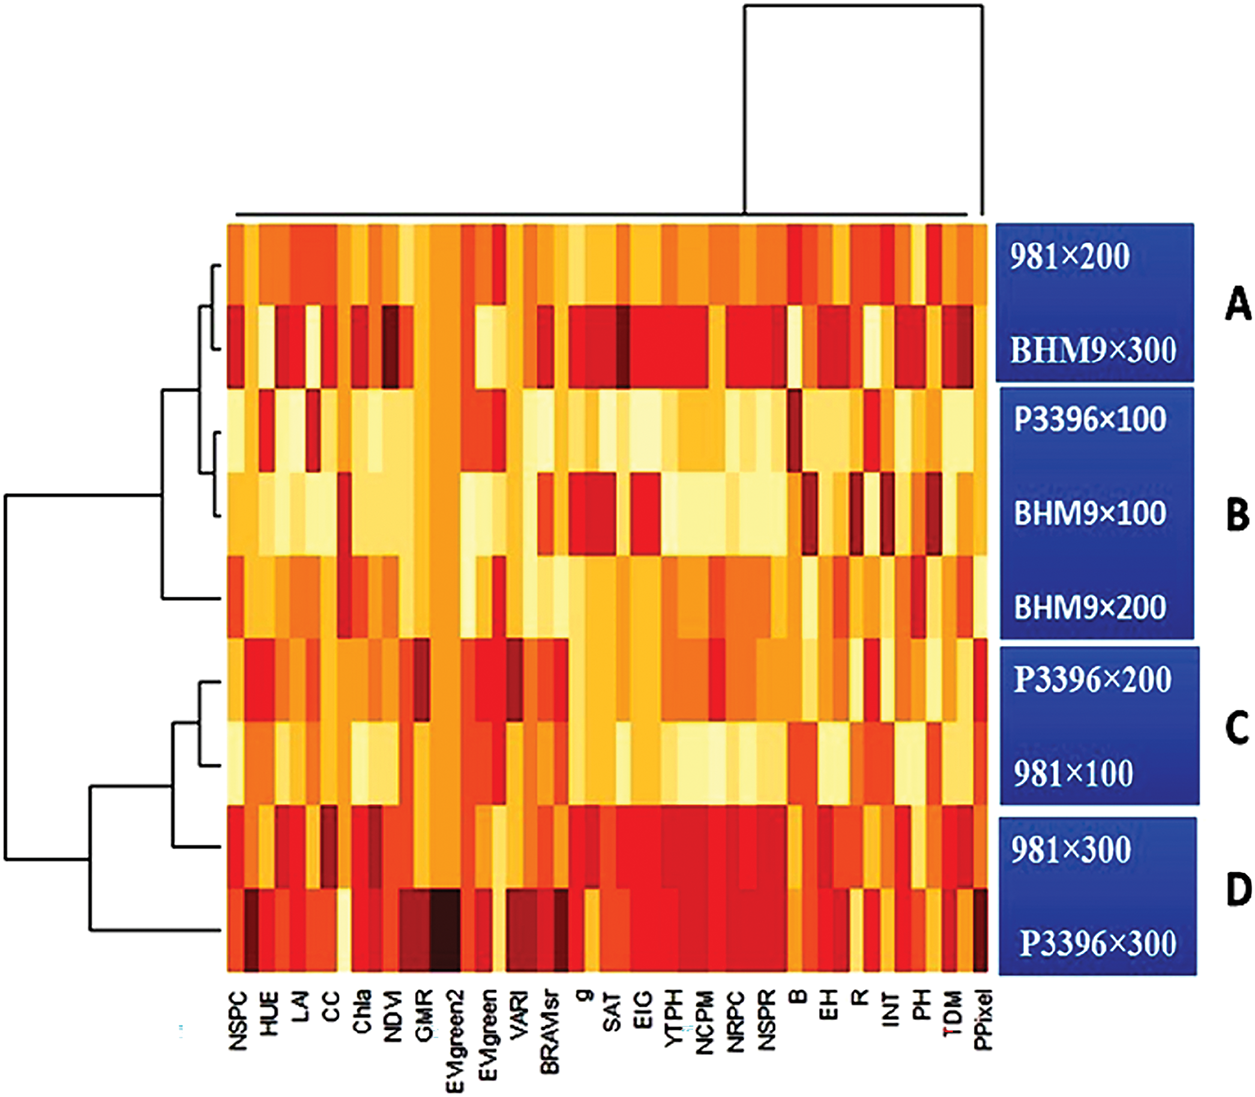
Figure 14: Heatmap showing the clustering pattern of 9 treatments of hybrid maize varieties and nitrogen interactions with 51 morphophysiological traits
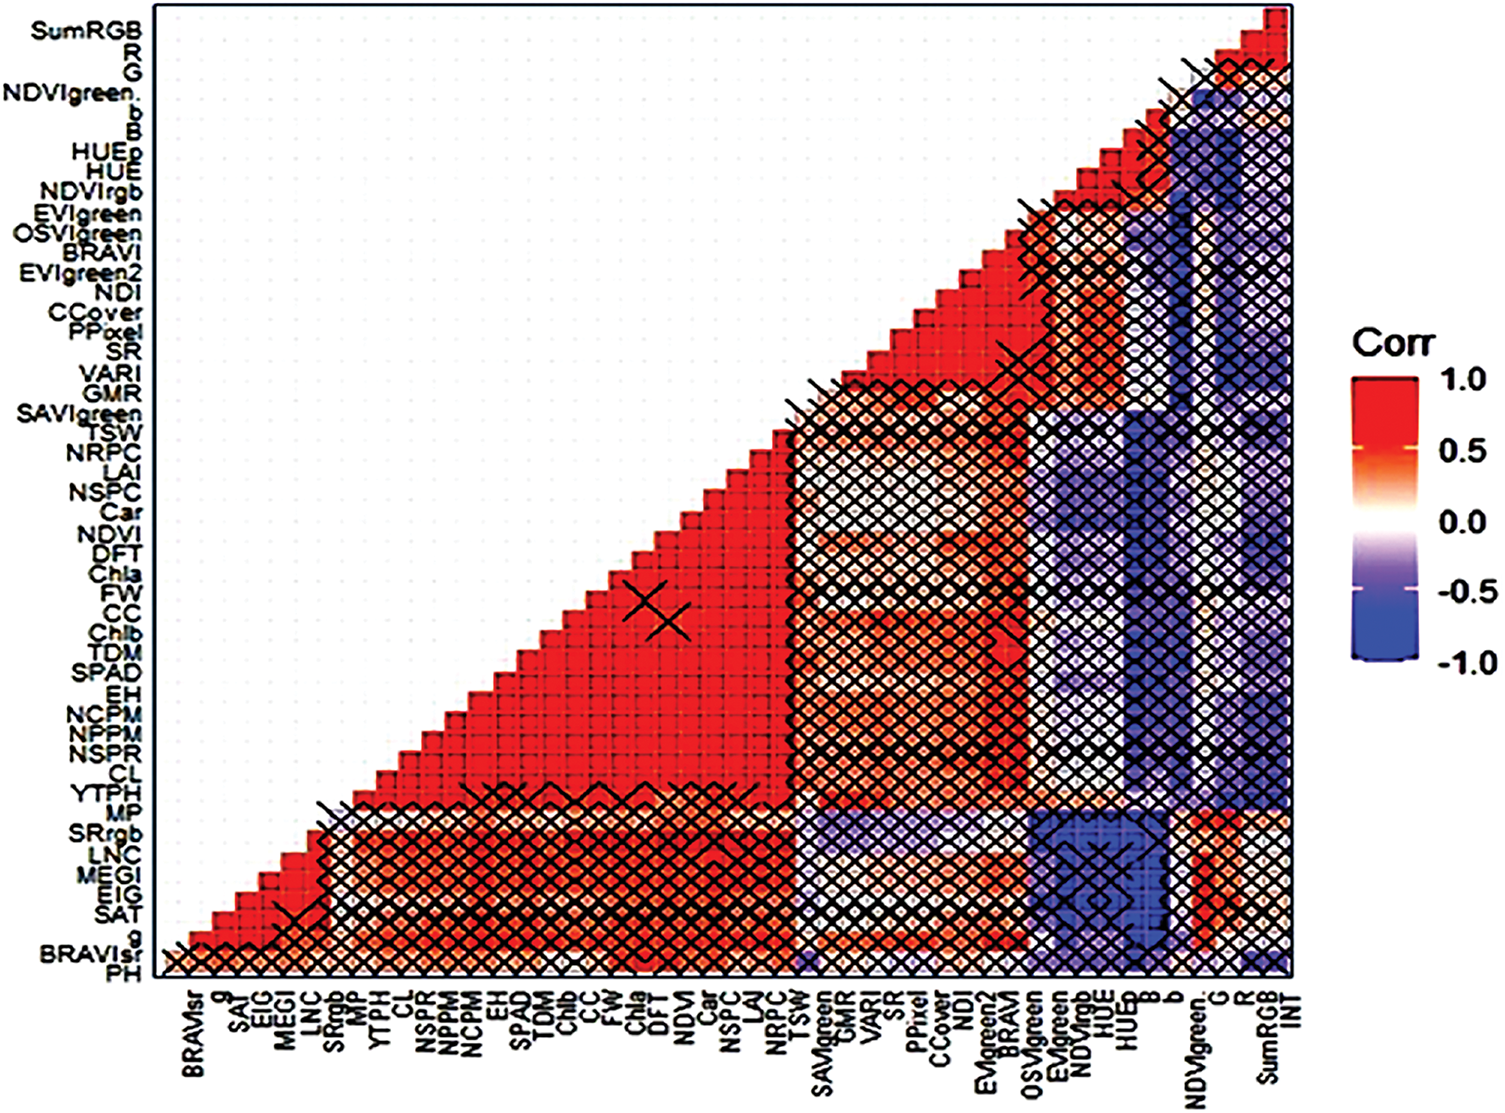
Figure 15: Heatmap showing the correlation matrix of 43 morphophysiological traits, digitally extracted traits, yield and yield-contributing traits. Heatmap displaying the relationship matrix among 43 maize traits. The red diagonal represents a perfect positive relationship between two traits with itself, and the blue diagonal represents a perfect negative correlation between two traits. × = Not significant at the 5% level
3.14 Image Processing and Modelling of Hybrid Maize
Image-based phenotyping of hybrid maize was performed using a Canon digital camera and Android smartphone, capturing JPG format images with a resolution of at least 6 pixels/mm (Fig. 16). Standardized imaging protocols were established to maintain consistency and minimize lighting variation. Autoflash was turned off, and an umbrella was used for shading. A color calibration chart (X-Rite Color Checker) was photographed at the beginning and every 20 min or upon light changes (e.g., cloud cover). Entire maize canopies were kept in the field of view, and manual weed removal ensured clear images for accurate analysis. Images were captured over multiple days and illumination conditions, with an emphasis on reproducibility across platforms.
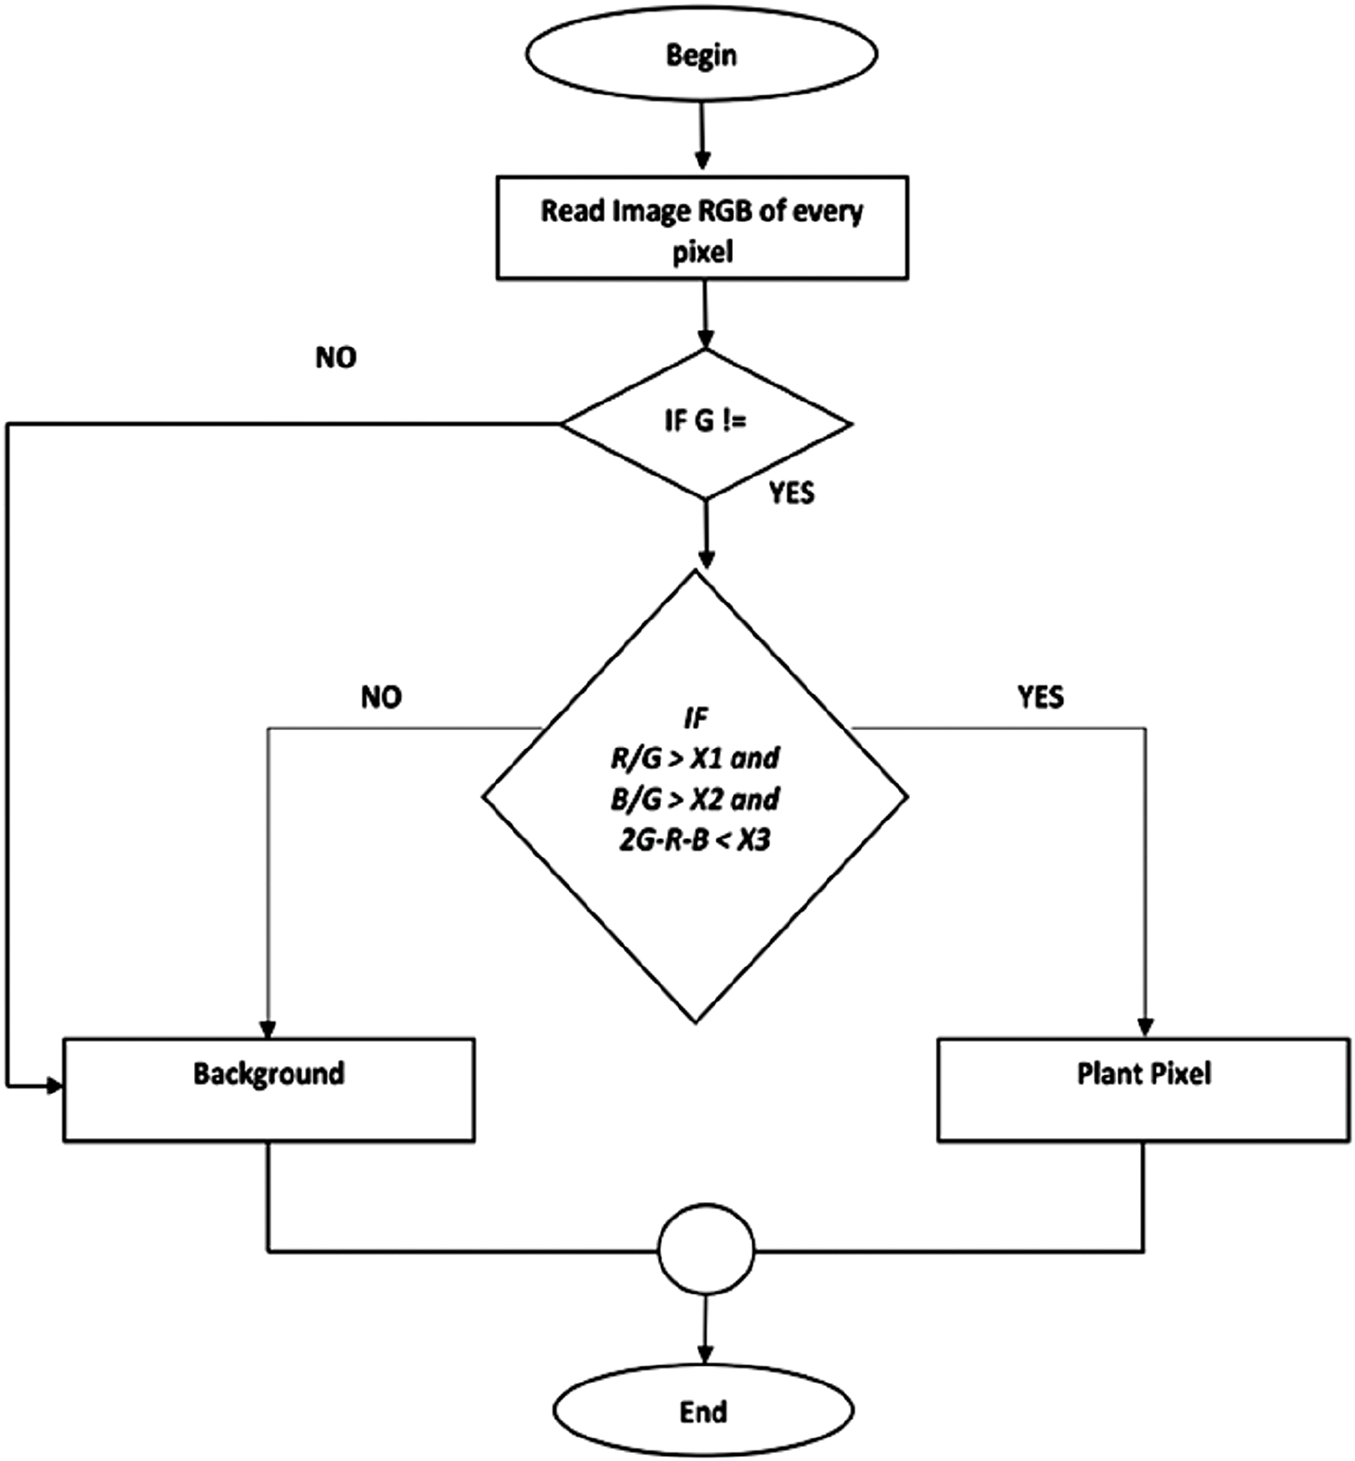
Figure 16: Flowchart algorithm of the overall methodology and modelling
Image analysis was conducted using MCCBARI, an automatic color threshold (ACT) software developed in Java. MCCBARI applies RGB-based thresholds to classify pixels into green canopy (white) and non-canopy (black) using the conditions:
(Default values: X1 = 0.89, X2 = 0.89, X3 = 25; excess green index threshold = 20) following different methods, MCCBARI also reduces noise by removing isolated or non-connected green pixels that may represent artifacts (e.g., residue shadows or small weeds).
Output includes binary images and Excel-compatible text files recording image metadata (e.g., filename, timestamp), green pixel counts, green canopy cover percentage, intensity, saturation, and chroma content (CC). Supported formats include .jpeg and .png. Additionally, RGB components (0–255 scale) were analyzed using a custom “Image Analysis of Fertilizer” program written in Microsoft Visual Basic 6.0 to compute color indices, utilizing the full spectral range of digital photos.
This study aimed to explore the effects of nitrogen levels and hybrid maize varieties on various morphophysiological traits, including plant height, leaf area index (LAI), canopy coverage (CC), total dry matter (TDM) accumulation, and chlorophyll content, to optimize maize productivity. Significant differences in plant height were observed among the hybrid maize varieties, with BARI hybrid maize 9 (BHM9) consistently exhibiting the greatest height. This trait is likely attributed to its genetic potential, which aligns with the findings of Hasan et al. [19], who reported that genetic variation and environmental interactions play crucial roles in such traits. In contrast, the hybrid P3396 presented desirable dwarf traits, which are often associated with increased nutrient use efficiency.
Nitrogen application significantly influenced plant height, corroborating previous studies by Fathi et al. [20] and Qi et al. [21], which highlighted the role of nitrogen in promoting chlorophyll synthesis, photosynthesis, and shoot growth. However, Sadeghi and Bahrani [22] reported contrasting results, possibly due to variations in soil fertility and crop types. Furthermore, relatively high nitrogen levels also positively impacted the leaf area index (LAI), with BHM9 resulting in a relatively high LAI. This trait plays a vital role in optimizing photosynthesis and potential yield, as indicated by Nasab et al. [23]. Nitrogen application, especially at 300 kg ha−1, increased the LAI, supporting the findings of Szabo et al. [24] and Guo et al. [25], who emphasized the role of nitrogen in leaf expansion and light interception. The normalized difference vegetation index (NDVI) values also varied significantly among the hybrids, with Hybrid 981 achieving higher NDVI values due to better canopy coverage, whereas P3396 recorded lower NDVI values due to reduced canopy size. This finding is consistent with that of Lawal et al. [26], who noted that the NDVI can be an effective indicator of canopy health and chlorophyll content. Nitrogen application further improved the NDVI values, supporting previous studies by Hnizil et al. [27] and Lawal et al. [26], which demonstrated that nitrogen enhances the chlorophyll content and leaf area, resulting in a relatively high NDVI. Canopy coverage (CC) reached its peak during anthesis and varied across genotypes and nitrogen treatments. The application of nitrogen improved the CC, which aligns with the observations of Ahmad et al. [28] and Yanli et al. [29], who reported that nitrogen enhances leaf spatial distribution and ground coverage, thus promoting overall plant growth. Similarly, TDM accumulation was significantly affected by both genotype and nitrogen treatment, with higher TDM levels linked to enhanced LAI and effective nitrogen management. These results echo the findings of Raj [30] and Lawal et al. [26], who reported that higher nitrogen levels positively impact TDM. The SPAD values, which reflect chlorophyll content, were highest in P3396, demonstrating its genetic advantage in terms of photosynthetic efficiency. This finding is in line with the observations of Pandey et al. [31], who noted that certain genotypes inherently maintain relatively high chlorophyll contents. Nitrogen application consistently increased SPAD values, supporting the findings of Szabo et al. [24] and Lawal et al. [26], who noted the importance of nitrogen in increasing chlorophyll content.
The chlorophyll a (Chl a) content showed considerable variation among the hybrids, with the highest content observed in P3396, likely due to its genetically enhanced photosynthetic traits. This result is supported by Pandey et al. [31], who reported that genetic factors play a significant role in determining leaf chlorophyll content. In accordance with Szabo et al. [24], nitrogen application further increased the Chl a content, promoting leaf expansion and vigor. Similar trends were observed for the chlorophyll b (Chl b) content, where its variation among hybrids was driven by genetic factors influencing photosynthesis [31]. Nitrogen increased Chl b synthesis, promoting chlorophyll production, as noted by Szabo et al. [24]. The leaf carotenoid content (LCC) increased up to 100 days after sowing (DAS), suggesting favourable growth conditions for all the hybrids. The BARI hybrid maize variety 9 consistently presented the highest LCC, likely due to its genetic potential for pigment synthesis [31]. Higher nitrogen levels enhanced LCC, in line with findings by Szabo et al. [24], emphasizing the importance of nitrogen in carotenoid production. These results underscore the need for targeted nutrient management to optimize carotenoid production and, by extension, yield stability. The highest leaf nitrogen content (LNC) was detected in the BARI hybrid maize 9, particularly under high nitrogen levels, indicating its efficient nitrogen utilization and enhanced photosynthetic activity [31]. This pattern was consistent with Szabo et al. [24], who reported that nitrogen application increases vegetative growth and enhances LNC. The interaction effects were also significant, with nitrogen application increasing the LNC during early growth stages, as observed by Hnizil et al. [27]. Growth traits such as plant and ear height are significantly influenced by both genotype and nitrogen level, with BHM9 performing best under high-nitrogen conditions, which delays flowering and promotes greater plant height [26,27]. Seed yield traits, including the number of seeds per cob (NSPC), varied among hybrids, with P3396 and Hybrid 981 outperforming BHM9. This performance was linked to their superior nitrogen use efficiency. The optimal nitrogen level (300 kg ha−1) maximized the NSPC, supporting the findings of Chun et al. [32] and Gallais and Hirel [33], who emphasized the critical role of nitrogen in kernel development. Nitrogen application was also found to improve the 1000-seed weight (TSW) and grain yield (GY), which is in line with the findings of studies by Ahmad et al. [28], Hammad et al. [34], and Ali and Raouf [35]. These results underscore the importance of hybrid selection and nitrogen optimization to maximize maize yield.
The correlations between genotypic and phenotypic traits revealed that genetic factors had a stronger influence on morphophysiological traits than did environmental factors. Plant height was strongly correlated with the LAI, NDVI, CC, SPAD, and TDM, indicating its genetic linkage to key growth traits. The correlation of the LAI with physiological traits further underscores its role as a critical growth indicator. Additionally, the high correlation between CC, SPAD, and TDM highlights the importance of these traits for assessing maize productivity and adaptability under varying conditions. The relationships between SPAD values and grain yield, as observed by Blackmer and Schepers [36] and Maiti et al. [37], emphasize its potential for assessing nitrogen stress. The positive linear relationships between plant height, LAI, and the NDVI and nitrogen level demonstrated the crucial role of nitrogen in promoting vegetative growth and biomass accumulation. This is reflected in the high R2 values, which further emphasize the importance of nitrogen in leaf expansion, canopy development, and biomass production. Similarly, CC and TDM responded positively to nitrogen, indicating their critical role in enhancing yield potential. Strong correlations between traits such as SPAD, LNC, and chlorophyll contents underscore their utility in assessing crop productivity, with significant links to TDM. The close relationships among chlorophyll a, carotenoids, and photosynthetic efficiency highlight their contributions to biomass growth and maize yield. Multivariate analyses, including biplot analysis, heatmaps, and hierarchical clustering, revealed that treatments 8 and 9 were particularly effective in enhancing key growth traits, with similarities in the treatment groups confirmed by clustering. These analyses provide actionable insights for improving nitrogen management and variety selection to optimize maize productivity.
Additionally, image analysis via standardized protocols and MCCBARI software enabled robust evaluation of green canopy cover, minimizing the influence of external variables such as lighting and weed interference. This quantitative approach offers a reliable tool for optimizing hybrid maize management. The observed correlations align with studies on morphophysiological traits and spectral indices in nitrogen nutrition assessment [38–40], demonstrating the value of integrating morphophysiological and spectral measurements to assess crop health and productivity under varying nitrogen levels.
This study highlights the strong genetic influence on key morphophysiological traits of hybrid maize, as evidenced by high genotypic correlations with total dry matter (TDM), particularly for traits such as plant height (rg = 0.91), LAI, NDVI, and SPAD. Regression analyses further validated these traits as reliable predictors of biomass, with R2 values consistently above 0.90 across different genotypes. Notably, nitrogen application at 300 kg N ha−1 significantly enhanced physiological traits and yield, with P3396 producing the highest grain yield (14.45 t ha−1), followed closely by Hybrid 981. Image-derived parameters like NDVI and SPAD proved effective in assessing nitrogen responsiveness and yield potential, indicating their utility for real-time nutrient management. Overall, the integration of physiological trait analysis with digital imaging tools offers a promising pathway for improving nitrogen use efficiency and achieving high-yield, environmentally sustainable maize production.
Acknowledgement: All the authors are grateful to the Bangladesh Agricultural Research Institute, Gazipur-1701, Bangladesh, for supporting the study. The authors also extend their appreciation to Taif University, Saudi Arabia, for supporting this work through project number TU-DSPP-2024-07.
Funding Statement: This research was financially supported by the Bangladesh Agricultural Research Institute, Gazipur-1701, Bangladesh. This research was also funded by Taif University, Saudi Arabia, Project No.(TU-DSPP-2024-07).
Author Contributions: Conceptualization and methodology: Shamim Ara Bagum, Mahbub Ul Islam, M Shalim Uddin, Sripati Sikder; data collection and analysis: Shamim Ara Bagum, M Shalim Uddin, Ahmed Gaber, Akbar Hossain; writing the manuscript: Shamim Ara Bagum, Mahbub Ul Islam, M Shalim Uddin, Sripati Sikder; reviewing and final editing: M Shalim Uddin, Sripati Sikder, Ahmed Gaber, Akbar Hossain; supervision: M Shalim Uddin, Sripati Sikder, Ahmed Gaber, Akbar Hossain; funding and project administrator: M Shalim Uddin, Sripati Sikder, Ahmed Gaber, Akbar Hossain. All authors reviewed the results and approved the final version of the manuscript.
Availability of Data and Materials: The datasets generated and/or analysed during the current study will be available from the corresponding author upon request.
Ethics Approval: Not applicable.
Conflicts of Interest: The authors declare no conflicts of interest to report regarding the present study.
Supplementary Materials: The supplementary material is available online at https://www.techscience.com/doi/10.32604/phyton.2025.065607/s1.
References
1. Simkin AJ, López-Calcagno PE, Raines CA. Feeding the world: improving photosynthetic efficiency for sustainable crop production. J Exp Bot. 2019;70(4):1119–40. doi:10.1093/jxb/ery445. [Google Scholar] [PubMed] [CrossRef]
2. Rouf T, Prasad K, Kumar P. Maize—a potential source of human nutrition and health: a review. Cogent Food Agric. 2016;2(1):1166995. doi:10.1080/23311932.2016.1166995. [Google Scholar] [CrossRef]
3. Adiaha MS. The impact of Maize (Zea mays L.) and it uses for human development: a review. Int J Sci World. 2017;5(1):93–5. doi:10.14419/ijsw.v5i1.7585. [Google Scholar] [CrossRef]
4. Langner JA, Zanon AJ, Streck NA, Reiniger LR, Kaufmann MP, Alves AF. Maize: key agricultural crop in food security and sovereignty in a future with water scarcity. Rev Bras De Eng Agrícola E Ambient. 2019;23(9):648–54. doi:10.1590/1807-1929/agriambi.v23n9p648-654. [Google Scholar] [CrossRef]
5. Erenstein O, Jaleta M, Sondar K, Mottaleb K, Prasanna BM. It provides food, feed, and industrial raw materials for billions of people and supports food security in some of the world’s poorest regions. Food Secur. 2022;14:1295–319. [Google Scholar]
6. Wossen T, Menkir A, Alene A, Abdoulaye T, Ajala S, Apraku B, et al. Drivers of transformation of the maize sector in Nigeria. Glob Food Secur. 2023;38(1):100713. doi:10.1016/j.gfs.2023.100713. [Google Scholar] [PubMed] [CrossRef]
7. Leghari SJ, Wahocho NA, Laghari GM, Hafeez LA, Mustafa BG, Hussain TK, et al. Role of nitrogen for plant growth and development: a review. Adv Environ Biol. 2016;10(9):209–19. [Google Scholar]
8. Rütting T, Aronsson H, Delin S. Efficient use of nitrogen in agriculture. Nutr Cycl Agroecosyst. 2018 2018;110(1):1–5. doi:10.1007/s10705-017-9900-8. [Google Scholar] [CrossRef]
9. Wang Q, Li S, Li J, Huang D. The utilization and roles of nitrogen in plants. Forests. 2024;15(7):1191. doi:10.3390/f15071191. [Google Scholar] [CrossRef]
10. Rigon J, Capuani S, Fernandes D, Guimarães T. A novel method for the estimation of soybean chlorophyll content using a smartphone and image analysis. Photosynthetica. 2016;54(4):559–66. doi:10.1007/s11099-016-0214-x. [Google Scholar] [CrossRef]
11. Wani SH, Vijayan R, Choudhary M, Kumar A, Zaid A, Singh V, et al. Nitrogen use efficiency (NUEelucidated mechanisms, mapped genes and gene networks in maize (Zea mays L.). Physiol Mol Biol Plants. 2021;27(12):2875–91. doi:10.1007/s12298-021-01113-z. [Google Scholar] [PubMed] [CrossRef]
12. Shen S, Feng B, Zhang D, Zou J, Yang Y, Rees RM, et al. Optimizing N applications increases maize yield and reduces environmental costs in a 12-year wheat-maize system. Field Crops Res. 2025;322:109741. doi:10.1016/j.fcr.2025.109741. [Google Scholar] [CrossRef]
13. Rhezali A, Lahlali R. Nitrogen (N) mineral nutrition and imaging sensors for determining N status and requirements of maize. J Imaging. 2017;3(4):51. doi:10.3390/jimaging3040051. [Google Scholar] [CrossRef]
14. Li D, Li C, Yao Y, Li M, Liu L. Modern imaging techniques in plant nutrition analysis: a review. Comput Electron Agric. 2020;174:105459. doi:10.1016/j.compag.2020.105459. [Google Scholar] [CrossRef]
15. Guerri MF, Distante C, Paolo S, Bougourzi F, Ahmed AT. Deep learning techniques for hyperspectral image analysis in agriculture: a review. ISPRS Open J Photogramm Remote. 2024;12(7):100062. doi:10.1016/j.ophoto.2024.100062. [Google Scholar] [CrossRef]
16. Xiao Q, Bai X, Zhang C, He Y. Advanced high-throughput plant phenotyping techniques for genome-wide association studies: a review. J Adv Res. 2022;35:215–30. doi:10.1016/j.jare.2021.05.002. [Google Scholar] [PubMed] [CrossRef]
17. Upadhyay PK, Singh VK, Shekhawat K, Dwivedi BS, Mishra RP, Singh RK, et al. Sustainable nitrogen management in maize using optical sensor: assessing yield, economics, and environmental impact. Field Crops Res. 2025;322(7):109753. doi:10.1016/j.fcr.2025.109753. [Google Scholar] [CrossRef]
18. Li Y, Chen D, Walker CN, Angus JF. Estimating the nitrogen status of crops using a digital camera. Field Crops Res. 2010;118(3):221–7. doi:10.1016/j.fcr.2010.05.011. [Google Scholar] [CrossRef]
19. Hasan MR, Rahman MR, Hasan AK, Paul SK, Alam AJ. Effect of variety and spacing on the yield performance of maize (Zea mays L.) in old Brahmaputra floodplain area of Bangladesh. Arch Agric Environ Sci. 2018;3(3):270–4. doi:10.26832/24566632.2018.0303010. [Google Scholar] [CrossRef]
20. Fathi A. Role of nitrogen (N) in plant growth, photosynthesis pigments, and N use efficiency: a review. Agrisost. 2022;28:1–8. [Google Scholar]
21. Qi DL, Hu TT, Song X. Effects of nitrogen application rates and irrigation regimes on grain yield and water use efficiency of maize under alternate partial root-zone irrigation. J Integr Agric. 2020;19(11):2792–806. doi:10.1016/s2095-3119(20)63205-1. [Google Scholar] [CrossRef]
22. Sadeghi H, Bahrani MJ. Soil health contributes to variations in crop production and nitrogen use efficiency. Nat Food. 2025;25:2530. [Google Scholar]
23. Nasab AR, Pour AT, Shirani H. Effect of salinity and nitrogen application on growth, chemical composition and some biochemical indices of pistachio seedlings (Pistacia vera L.). J Plant Nutr. 2014;37(10):1612–26. doi:10.1080/01904167.2014.888745. [Google Scholar] [CrossRef]
24. Szabo A, Mousavi SM, Bojtor C, Ragan P, Nagy J, Vad A, et al. Analysis of nutrient-specific response of maize hybrids in relation to leaf area index (LAI) and remote sensing. Plants. 2022;28(11):1197. doi:10.3390/plants11091197. [Google Scholar] [PubMed] [CrossRef]
25. Guo X, Liu W, Yang Y, Liu G, Ming B, Xie R, et al. Matching the light and nitrogen distributions in the maize canopy to achieve high yield and high radiation use efficiency. J Integr Agric. 2025;24(4):1424–35. doi:10.1016/j.jia.2023.12.025. [Google Scholar] [CrossRef]
26. Lawal BR, Ibrahim AE, Adewale GO. Prediction of nitrogen application in maize based on the normalized difference vegetation index (NDVI). Asian J Soil Sci Plant Nutr. 2018;3(4):1–13. doi:10.9734/AJSSPN/2018/43886. [Google Scholar] [CrossRef]
27. Hnizil O, Baidani A, Khlila I, Nsarellah N, Laamari A, Amamou A. Integrating NDVI, SPAD, and canopy temperature for strategic nitrogen and seeding rate management to enhance yield, quality, and sustainability in wheat cultivation. Plants. 2024;13(11):1574. doi:10.3390/plants13111574. [Google Scholar] [PubMed] [CrossRef]
28. Ahmed SS, Begum Y, Nilufar M, Abu A, Shahidul IM. Effects of row distance and nitrogen rate on canopy efficiency and yield of maize. Int J Biol Sci. 2018;12(1):126–35. doi:10.12692/ijb/12.1.126-135. [Google Scholar] [CrossRef]
29. Yanli L, Shaokun L, Jihua W, Ruizhi JL, Wang Z. Differentiating wheat varieties with different leaf angle distributions using NDVI and canopy cover. N Z J Agril Res. 2007;50(5):1149–56. doi:10.1080/00288230709510397. [Google Scholar] [CrossRef]
30. Raj A. Site specific nutrient management in hybrid maize [master’s thesis]. Ranchi, India: Birsa Agricultural University; 2016. [Google Scholar]
31. Pandey RK, Maranville JW, Chetima MM. Deficit irrigation and nitrogen effects on maize in a Sahelian environment: II. Shoot growth, nitrogen uptake and water extraction. Agric Water Manag. 2000;46(1):15–27. doi:10.1016/s0378-3774(00)00074-3. [Google Scholar] [CrossRef]
32. Chun L, Chen F, Zhang F, Mi GH. Root growth, nitrogen uptake and yield formation of hybrid maize with different N efficiency. Plant Nutr Fertil Sci. 2005;11:615–9. [Google Scholar]
33. Gallais A, Hirel B. An approach to the genetics of nitrogen use efficiency in maize. J Exp Bot. 2004;55:295–306. doi:10.1093/jxb/erh006. [Google Scholar] [PubMed] [CrossRef]
34. Hammad HM, Ahmad A, Khaliq T, Farhad W, Mubeen M. Optimizing rate of nitrogen application for higher yield and quality in maize under semiarid environment. Crop Environ. 2011;2(1):38–41. [Google Scholar]
35. Ali R, Raouf S. Effects of rates and nitrogen application timing on yield, agronomic characteristics and nitrogen use efficiency in corn. Int J Agric Crop Sci. 2012;4(9):534–9. [Google Scholar]
36. Blackmer TM, Schepers JS. Use of chlorophyll meter to monitor nitrogen status and schedule fertigation for corn. J Prod Agric. 1995;8(1):56–60. doi:10.2134/jpa1995.0056. [Google Scholar] [CrossRef]
37. Maiti D, Das DK, Karak T, Banerjee M. Management of nitrogen through the use of leaf color chart (LCC) and soil plant analysis development (SPAD) or chlorophyll meter in rice under irrigated ecosystem. Sci World J. 2004;4:838–46. doi:10.1100/tsw.2004.137. [Google Scholar] [PubMed] [CrossRef]
38. Mistele B, Schmidhalter U. Tractor-based quadrilateral spectral reflectance measurements to detect biomass and total aerial nitrogen in winter wheat. Agron J. 2010;102(2):499–506. doi:10.2134/agronj2009.0282. [Google Scholar] [CrossRef]
39. Erdle K, Mistele B, Schmidhalter U. Comparison of active and passive spectral sensors in discriminating biomass parameters and nitrogen status in wheat cultivars. Field Crops Res. 2011;124(1):74–84. doi:10.1016/j.fcr.2011.06.007. [Google Scholar] [CrossRef]
40. Baresel JP, Rischbeck P, Hu Y, Kipp S, Hu Y, Barmeier G, et al. Use of a digital camera as alternative method for nondestructive detection of the leaf chlorophyll content and the nitrogen nutrition status in wheat. Comput Electron Agric. 2017;140(2):25–33. doi:10.1016/j.compag.2017.05.032. [Google Scholar] [CrossRef]
Cite This Article
 Copyright © 2025 The Author(s). Published by Tech Science Press.
This work is licensed under a Creative Commons Attribution 4.0 International License , which permits unrestricted use, distribution, and reproduction in any medium, provided the original work is properly cited.
 Downloads
 Citation Tools