
 Submit a Paper
 Propose a Special lssue
 Open Access
ARTICLE

Detection of Rice Bacterial Leaf Blight Using Hyperspectral Technology and Continuous Wavelet Analysis
1 Nanxun Innovation Institute, Zhejiang University of Water Resources and Electric Power, Hangzhou, 310018, China
2 School of Computer Science and Technology, Zhejiang University of Water Resources and Electric Power, Hangzhou, 310018, China
3 College of Artificial Intelligence, Hangzhou Dianzi University, Hangzhou, 310018, China
* Corresponding Author: Lin Yuan. Email:
Phyton-International Journal of Experimental Botany 2025, 94(7), 2033-2054. https://doi.org/10.32604/phyton.2025.066286
Received 03 April 2025; Accepted 16 June 2025; Issue published 31 July 2025
 View Full Text
 Download PDF
Abstract
Plant diseases are a major threat that can severely impact the production of agriculture and forestry. This can lead to the disruption of ecosystem functions and health. With its ability to capture continuous narrow-band spectra, hyperspectral technology has become a crucial tool to monitor crop diseases using remote sensing. However, existing continuous wavelet analysis (CWA) methods suffer from feature redundancy issues, while the continuous wavelet projection algorithm (CWPA), an optimization approach for feature selection, has not been fully validated to monitor plant diseases. This study utilized rice bacterial leaf blight (BLB) as an example by evaluating the performance of four wavelet basis functions—Gaussian2, Mexican hat, Meyer, and Morlet—within the CWA and CWPA frameworks. Additionally, the classification models were constructed using the k-nearest neighbors (KNN), random forest (RF), and Naïve Bayes (NB) algorithms. The results showed the following: (1) Compared to traditional CWA, CWPA significantly reduced the number of required features. Under the CWPA framework, almost all the model combinations achieved maximum classification accuracy with only one feature. In contrast, the CWA framework required three to seven features. (2) The choice of wavelet basis functions markedly affected the performance of the model. Of the four functions tested, the Meyer wavelet demonstrated the best overall performance in both the CWPA and CWA frameworks. (3) Under the CWPA framework, the Meyer-KNN and Meyer-NB combinations achieved the highest overall accuracy of 93.75% using just one feature. In contrast, under the CWA framework, the CWA-RF combination achieved comparable accuracy (93.75%) but required six features. This study verified the technical advantages of CWPA for monitoring crop diseases, identified an optimal wavelet basis function selection scheme, and provided reliable technical support to precisely monitor BLB in rice (Oryza sativa). Moreover, the proposed methodological framework offers a scalable approach for the early diagnosis and assessment of plant stress, which can contribute to improved accuracy and timeliness when plant stress is monitored.Keywords
Plant diseases and pests are some of the most destructive biotic stress factors in agricultural production, and they cause global crop losses of approximately 20%–40% a year (FAO, 2021) [1]. In addition to reducing yields, these issues also trigger secondary ecological problems, such as an imbalance in the soil microbial community and pollution with pesticide residues. These have become major restrictions to the sustainable development of agriculture [2]. Traditional monitoring methods that primarily rely on manual field surveys face challenges, such as poor timeliness, labor intensity, and limited spatial coverage. Thus, their use makes it difficult to meet the demands of precision agriculture [3]. Given these challenges, hyperspectral technology, with its abilities to acquire high-dimensional data, provides a novel and promising pathway to monitor plant stress. The rapid development of hyperspectral technology, coupled with the advances in the miniaturization of sensors and reductions in the costs of acquisition, has significantly expanded its application in monitoring plant disease [4]. Breakthroughs in computational imaging and satellite remote sensing have further improved the efficiency of collecting data [5]. For instance, Zhou et al. (2019) demonstrated that UAV-borne hyperspectral systems offer advantages in operational flexibility and radiometric accuracy. This has led to the collection of large-scale, high-resolution data collection at a lower cost [6]. More importantly, hyperspectral data, with its continuous narrow-band spectral coverage, can capture subtle changes in the processes of plant physiology and biochemistry. This capability enables the detection of abnormal spectral responses during the latent phase of disease development, thus, facilitating early warning and prevention [7–9].
Recent studies have focused on improving the extraction of spectral features and optimizing modeling techniques. For example, Lin et al. (2016) used differential spectral analysis and sensitivity evaluation to develop a quantitative model to predict disease severity in Yunnan pine needles (Pinus yunnanensis). They achieved robust model performance (R2 > 0.99) [10]. Similarly, Mustafa et al. (2023) integrated vegetation indices, such as NDVI and PRI, with machine learning algorithms to enhance the monitoring accuracy of wheat Fusarium head blight and obtained an overall classification accuracy >90% [11]. Hu et al. (2024) employed UAV-based hyperspectral imaging and machine-learning models to predict the yield of oilseed rape (Brassica napus). The random forest (RF) model achieved the highest training accuracy (R2 = 0.925, RRMSE = 5.91%) [12]. However, most existing methods have been limited to analyzing spectral-domain features. Thus, there is still a lack of the comprehensive exploration of spectral transformation-domain characteristics that may better capture the complex responses of plant stress [13–16].
Spectral transformation-domain analysis provides new insights to extract meaningful information from high-dimensional data. Although Fourier-transform methods can reveal global frequency characteristics, they fail to capture the local time-frequency properties of non-stationary signals [17]. In contrast, wavelet analysis uses multi-scale decomposition to simultaneously extract temporal and spectral information. Thus, it is more effective at analyzing complex and dynamic spectral data [18,19]. For instance, Li et al. (2021) combined fractional-order differential and continuous wavelet transform to preprocess the hyperspectral data of winter wheat (Triticum aestivum) and built a model to estimate the LAI using optimal subset regression and SVM. This combination was highly accurate during the flowering and filling stages (R2 = 0.87 and 0.84) [20]. Huang et al. (2021) used continuous wavelet analysis and PSO-SVM to detect Fusarium wilt of wheat and reached an overall accuracy of 93.5% (Kappa = 0.903), thus, outperforming traditional methods [21]. Ren et al. (2023) combined solar-induced chlorophyll fluorescence (SIF) with wavelet energy coefficients (WFs) to create a model to monitor stripe rust in wheat (Triticum aestivum). This change improved the model accuracy (R2 = 0.867) [22]. Despite these advances, conventional wavelet-based approaches face limitations owing to the redundancy of features in high-dimensional data, and the model performance is highly sensitive to the choice of wavelet basis functions [23]. To address these challenges, recent studies have proposed innovative methods that optimize feature extraction and classification. For example, Zhao et al. (2022) introduced the continuous wavelet projection algorithm (CWPA) by combining CWA with the successive projection algorithm (SPA). This approach improved both feature dimensionality reduction and classification accuracy in detecting disease on tea (Camellia sinensis). They achieved an overall accuracy of 98.08% using a random forest (RF) model [24]. However, there has been no systematic research on how to select appropriate wavelet basis functions or test their compatibility with different machine learning algorithms. Existing methods often rely on empirical or subjective choices, thus, limiting their ability to generalize across different plant species and disease conditions.
Rice BLB, caused by Xanthomonas oryzae pv. oryzae (Xoo), is a devastating foliar disease that significantly impacts the yield and quality of rice (Oryza sativa). It is prevalent in the major rice-producing regions of China [25]. The pathogen enters rice plants through leaf hydathodes, mechanical wounds, and roots. This infection leads to the development of yellow-green to dark green streaks on the leaves (Fig. 1). As the disease progresses, these lesions expand and cause the leaves to wilt; this impairs photosynthesis and affects metabolism [26]. The frequency and severity of BLB outbreaks are increasing with climate change and shifts in agricultural practices. This is particularly true in southern rice-growing areas where it has become a major threat. Studies have found that BLB can reduce the yields of rice by 10%–30%, and severe cases can lead to losses >50%, or even total crop failure [27]. Therefore, establishing an accurate and timely monitoring system is crucial to effectively manage the disease and safeguard food security.
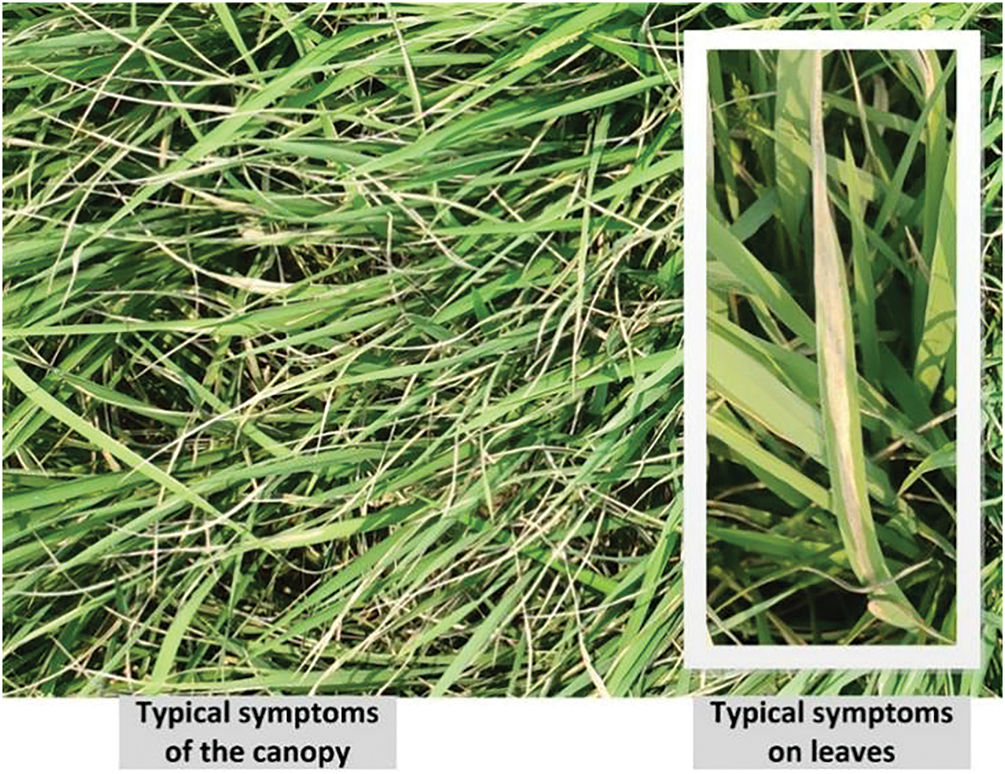
Figure 1: Symptoms of BLB in rice leaves and canopy
This study aimed to evaluate the applicability of different wavelet basis functions to monitor crop disease using rice BLB as the model system at the canopy scale. The specific objectives were as follows: (1) to compare the efficiency of dimensionality reduction and classification accuracies of traditional CWA and CWPA and to validate the potential advantages of CWPA in improving the accuracy of monitoring plant disease; (2) to evaluate the performance of four wavelet basis functions (Gaussian2, Mexican hat, Meyer, and Morlet) at extracting the spectral features of rice BLB, identify their spectral response patterns, and select the optimal basis function to provide theoretical guidance for the extraction of disease features; and (3) to investigate the compatibility of different feature extraction frameworks (CWA/CWPA) with three machine learning algorithms (KNN, RF, and Naïve Bayes) and establish selection criteria for combinations of the optimal wavelet basis function-algorithm that enhance the accuracy of monitoring plant diseases.
2.1 Hyperspectral Data Acquisition
The experiment was conducted in 2022 in Fenghua County, Zhejiang Province, China (121.474925° E, 29.687503° N) using a single-season rice variety (Yongyou 15, developed by the Crop Research Institute of Ningbo Academy of Agricultural Sciences, Ningbo, China) as the test subject for BLB at the grain-filling stage. Within the experimental field, an area with a uniform distribution of BLB symptoms was selected to acquire hyperspectral measurements and assess the severity of diseases. The classification of disease severity utilized the national standard for rice BLB (GB/T 17980.19-2000), and the samples were categorized into three levels of severity: Healthy (40 samples), Mild (80 samples), and Severe (80 samples). Hyperspectral canopy data were collected using a FieldSpec® 4 spectroradiometer (Analytical Spectral Devices, Boulder, CO, USA), which has a wavelength range of 350–2500 nm. Measurements were taken between 10:00 and 14:00 under clear, windless, or slightly windy conditions to minimize atmospheric interference. The sensor probe was positioned 1 m above the rice canopy with a 25° field of view (FOV), and the probe was oriented vertically downward when the data were collected. Ten repeated measurements were taken for each sample point and averaged to enhance the reliability of data. The spectroradiometer was calibrated using a Spectralon® reference panel before and after each measurement to correct for variations in the ambient light. The raw radiance data were converted to spectral reflectance using the following formula:
where Reftarget represents the reflectance of the measured canopy; Refwhite reference represents the reflectance of the reference panel, and Radtarget and Radwhite reference refer to the radiance values of the measured canopy and reference panel, respectively.
This study created rice BLB monitoring models by combining CWA and CWPA with three machine learning algorithms—KNN, RF, and NB—to accurately identify disease and monitor its severity. The data analysis included the following steps: (1) CWA: CWA was applied using four different wavelet basis functions, and the results were integrated with the KNN, RF, and NB algorithms to develop monitoring models. (2) CWPA: CWPA was implemented based on the four wavelet basis functions to assess its applicability to monitor rice BLB. This method was combined with the three machine learning algorithms to construct additional monitoring models. (3) Model Comparison and Basis Function Evaluation: The performance and characteristics of the CWA and CWPA models were compared under different wavelet basis functions. The impact of wavelet basis function selection on model performance was then analyzed. The overall research framework is illustrated in Fig. 2.
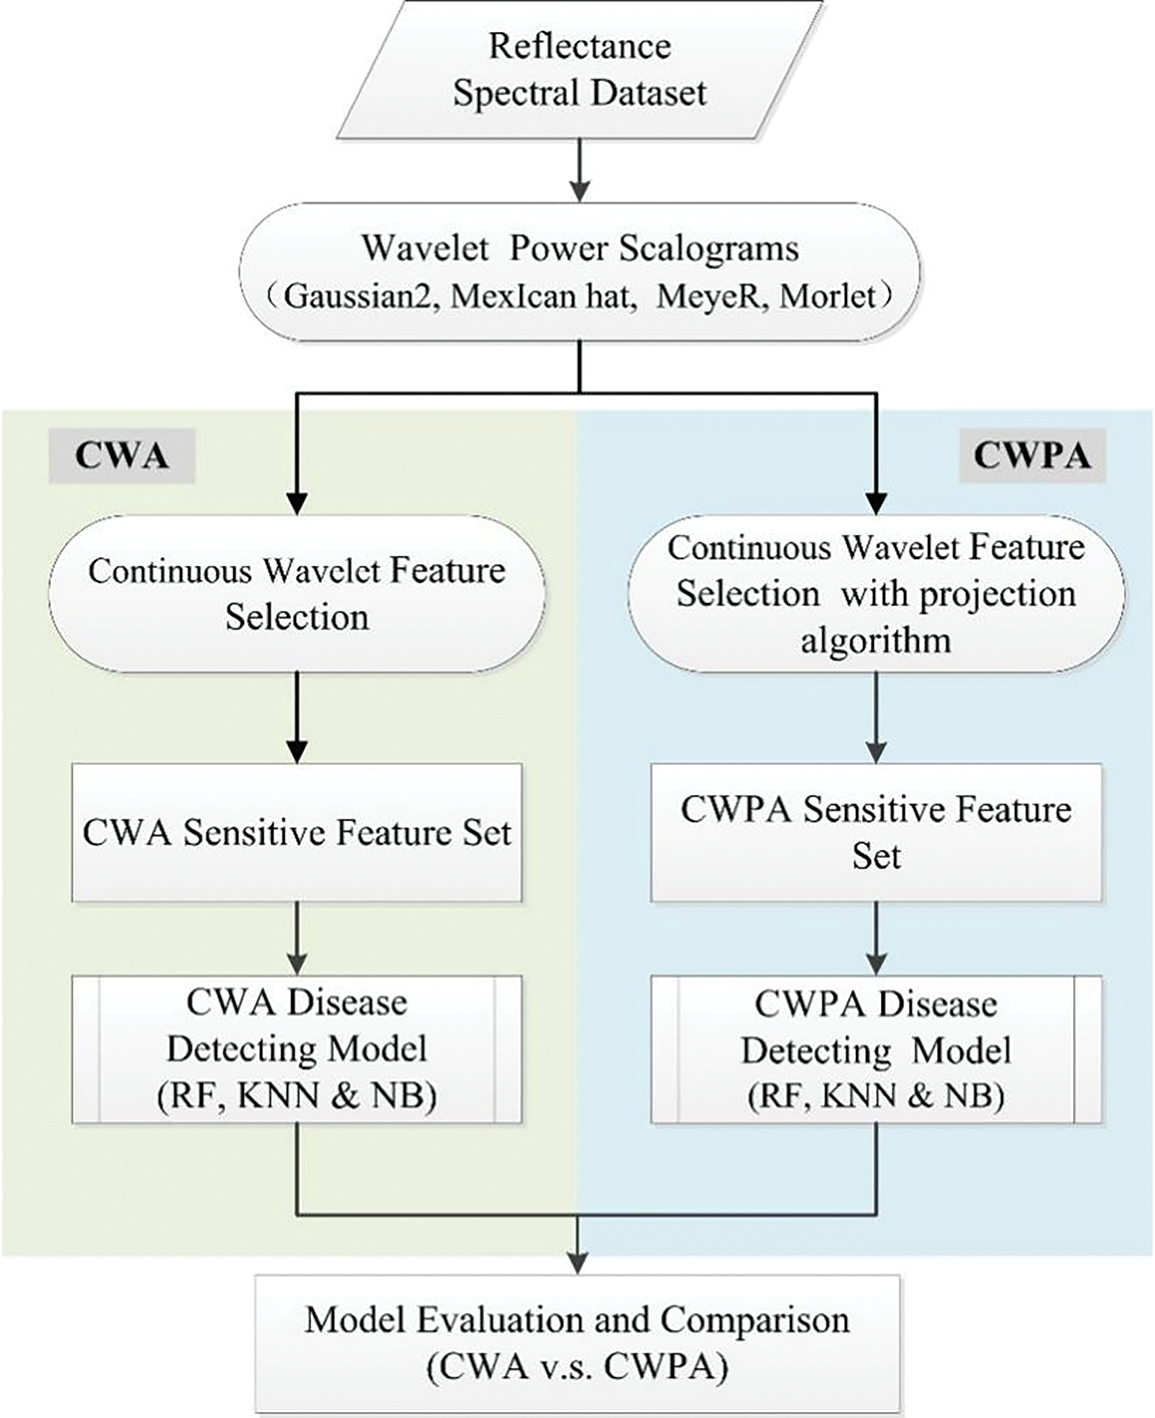
Figure 2: Flowchart of the data analysis
2.2.1 Traditional Continuous Wavelet Analysis Method
Continuous Wavelet Feature Extraction
CWA decomposes the reflectance spectra using continuous wavelet transforms at various scales and wavelengths. By analyzing the resulting wavelet coefficient matrix, feature coefficients sensitive to the target parameters are extracted to form the wavelet feature set [23]. CWA can decompose signals at different scales, thus, capturing variations across frequency components from low to high frequencies. It also suppresses noise by selecting coefficients at specific scales and capturing both overall spectral trends and local fluctuations. The expression for the wavelet basis function used is as follows:
where a is the scale factor and b is the translation factor [24]. After the original spectral signal was decomposed using the wavelet transform, the wavelet coefficients were obtained. The expression for the wavelet coefficients is as follows:
where f (λ) (λ = 1, 2, …, n) represents the reflectance spectrum and n is the number of bands. The wavelet coefficients Wf (ai,bj) (i = 1, 2, …, m; j = 1, 2, …, n) form an m × n wavelet coefficient matrix, representing the decomposition scales (i = 1, 2, …, m) and bands (i = 1, 2, …, n) [20]. Four wavelet basis functions were analyzed to assess the impacts of different wavelet basis functions on the performance of CWA. They included Gaussian2, Mexican Hat, Meyer, and Morlet [23]. The computational complexity was reduced by using the wavelet decomposition scales 2i (i = 0, 1, 2, …, 10) [28]. The curves of the four wavelet functions are shown in Fig. 3.
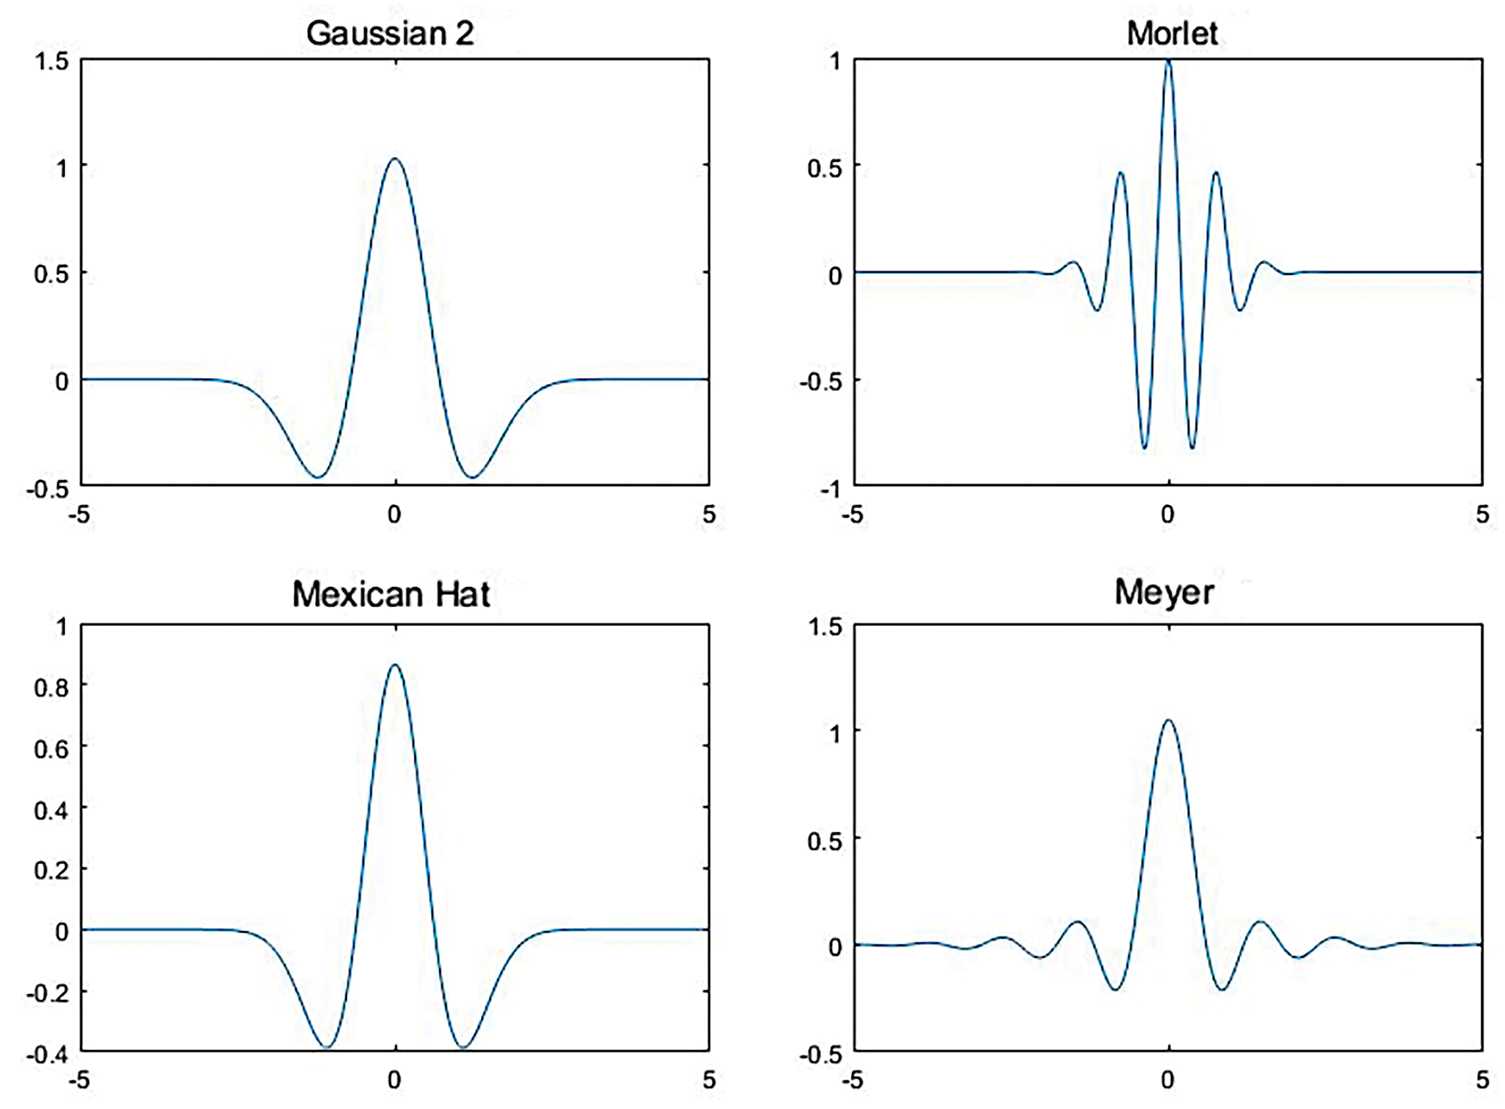
Figure 3: Curves of the four selected wavelet basis functions used in the study
After continuous wavelet decomposition, each spectral curve generated wavelet coefficients at different scales. A one-way analysis of variance (ANOVA) was used to select features sensitive to the three levels of severity of the rice BLB disease (healthy, mild, and severe). An ANOVA was performed on each wavelet coefficient to obtain a p-value matrix of 1588 (bands) × 11 (scales) [29]. This matrix reflected the sensitivity of wavelet coefficients across the spectral bands under different levels of disease severity. Lower p-values indicated higher sensitivity. The top 1% of sensitive coefficients were retained since previous studies showed that this threshold effectively preserves the diagnostically relevant spectral features in detecting stress in vegetation [18,29]. Connected regions with more than 10 pixels were then retained, and the central scale and wavelength of each region were defined as the representative wavelet features.
Construction of a Rice BLB Monitoring Model Based on CWA
Models to monitor rice BLB were constructed using the three machine learning models KNN, RF, and NB. They were based on four sets of selected sensitive feature sets derived from different wavelet basis functions. KNN is an instance-based learning method that classifies samples by calculating the distance between them. It is simple and intuitive, and it is particularly effective at handling nonlinear relationships between features. This model is commonly used to quickly classify and identify plant diseases and has applications for remote sensing to monitor pests. It is particularly true when there is a limited number of training samples [30]. RF is an ensemble learning algorithm that performs classification or regression by combining multiple decision trees. It is known for its strong noise resistance and high prediction accuracy. Thus, it is particularly suitable for scenarios with high-dimensional features and large datasets. RF is widely used to monitor the health of crops, predict disease, and perform other tasks in monitoring plant diseases and processing remote sensing data. This ability is owing to its ability to effectively handle high-dimensional features and complex data structures [31]. NB is a classification method based on the Bayes’ theorem, and it assumes conditional independence between the features. It is computationally efficient and highly adaptable to small datasets. NB is suitable for situations of monitoring plant pests and diseases where the relationships between features are relatively simple, and the dataset is small. Thus, it is useful for preliminary disease detection and classification tasks [32]. The selection of these three classifiers was based on their complementary advantages in terms of interpretability, computational efficiency, and practical performance in previous studies that monitored plant diseases. In particular, KNN offers straightforward decision-making with minimal training costs. Therefore, it can be rapidly implemented. RF is robust and highly accurate in complex, high-dimensional data environments. NB provides fast and reliable results when working with smaller datasets and simpler feature relationships. Together, these models enable a comprehensive comparison of classification performance under varying data conditions, thereby improving the reliability of the evaluation models. These three methods have their own strengths in pattern recognition and are applicable in different scenarios. In this study, these three methods were selected to construct the models, and the results were compared. Five-fold cross-validation was used to evaluate the accuracy of the model and its overall accuracy (OA). The Kappa coefficient was chosen as an evaluation metric. Additionally, because the number of features (NF) was closely related to algorithm efficiency, it was also considered as a model evaluation metric. The data were analyzed and the model constructed using the MATLAB and PyCharm platforms.
CWA has strong spectral information extraction capabilities and can precisely extract spectral features at different scales. However, an ideal spectral feature set should not only be highly sensitive to the target parameters but also ensure that information redundancy between the features is minimized. Relying solely on traditional feature sensitivity analysis for feature selection may result in the insufficient optimization of features, which can affect the model performance. The successive projection algorithm (SPA) is a forward feature selection algorithm that minimizes information redundancy between the feature vectors and selects a feature combination with the lowest redundancy [33]. SPA can effectively reduce information redundancy and help with dimensionality reduction. This improves the efficiency of the model and its ability to generalize. However, it lacks the capacity to process spectral information.
To address this issue, previous research combined the ability of CWA to extract spectral information with the feature optimization ability of SPA. This combination produced the CWPA. This method effectively reduces redundant features and optimizes feature combinations, thereby improving the accuracy and stability of the model [24]. It has achieved significant results in spectral data analysis and offers a promising potential for monitoring plant diseases and pests. Therefore, this study aimed to explore the application of CWPA to monitor BLB in rice and enhance the accuracy and reliability of the monitoring models. The overall methodological framework of CWPA is consistent with the CWA procedure described in Section 2.2.1, including wavelet decomposition, feature matrix construction, and model evaluation using RF, KNN, and NB classifiers. As shown in Fig. 4, the key distinction lies in the subsequent application of SPA on the reconstructed wavelet feature matrix. Variance analysis and significance evaluation were used to identify the most discriminative features across the different NFs. This method effectively compressed the feature dimensionality while remaining highly accurate at classification. It significantly enhanced the computational efficiency of disease monitoring models and made it suitable for large-scale hyperspectral real-time monitoring and the precise identification of diseases in crops.
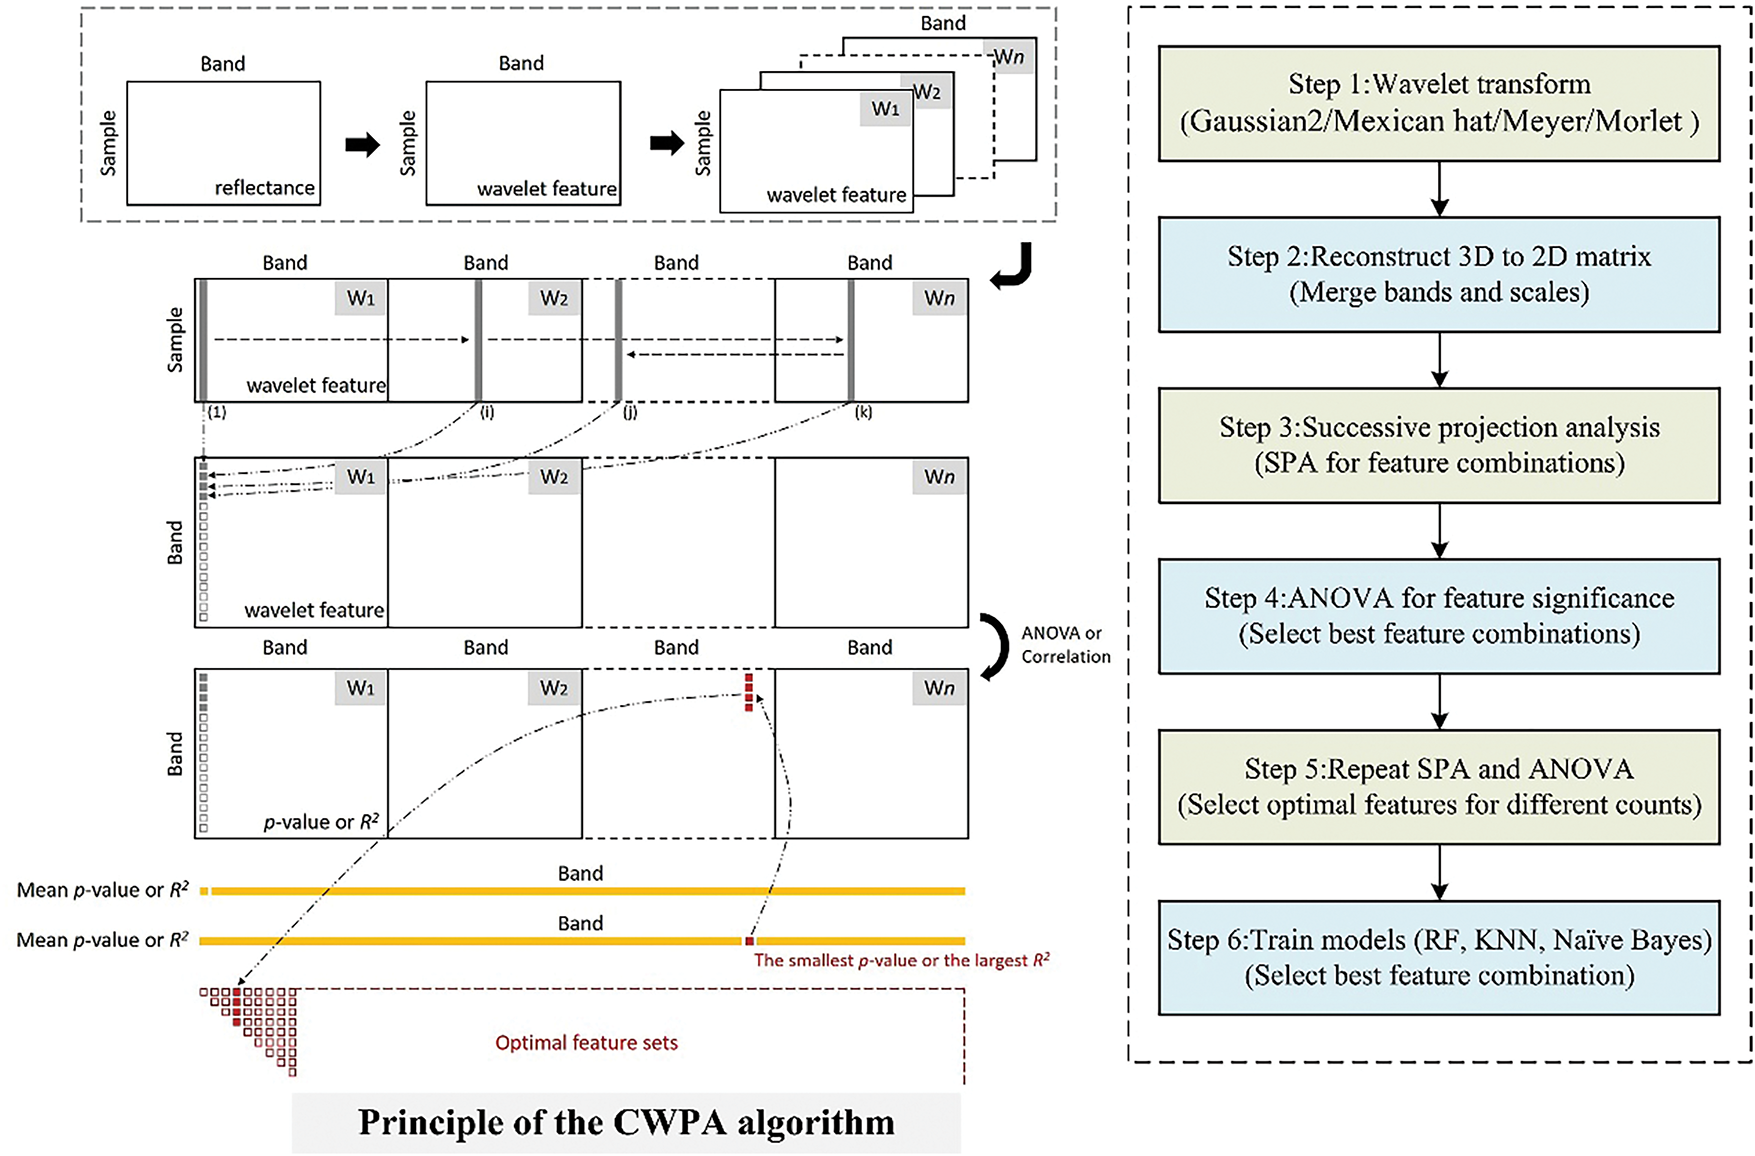
Figure 4: CWPA workflow. The flowchart on the left is cited from Zhao et al., 2022 [24]
CWPA uses the same algorithms and accuracy evaluation metrics to construct the model and evaluate its accuracy as those described in Section 2.2.1 for the CWA method. The data were also analyzed and the model constructed using the MATLAB platform. Additionally, the applicability and advantages of different wavelet basis functions and algorithm combinations were compared. The pros and cons of CWA and CWPA under different feature extraction strategies were analyzed. An efficient model suitable for monitoring BLB in rice was proposed. This study will provide references to remotely monitor other plant diseases and pests.
2.2.3 Other Spectral Analytical Methods
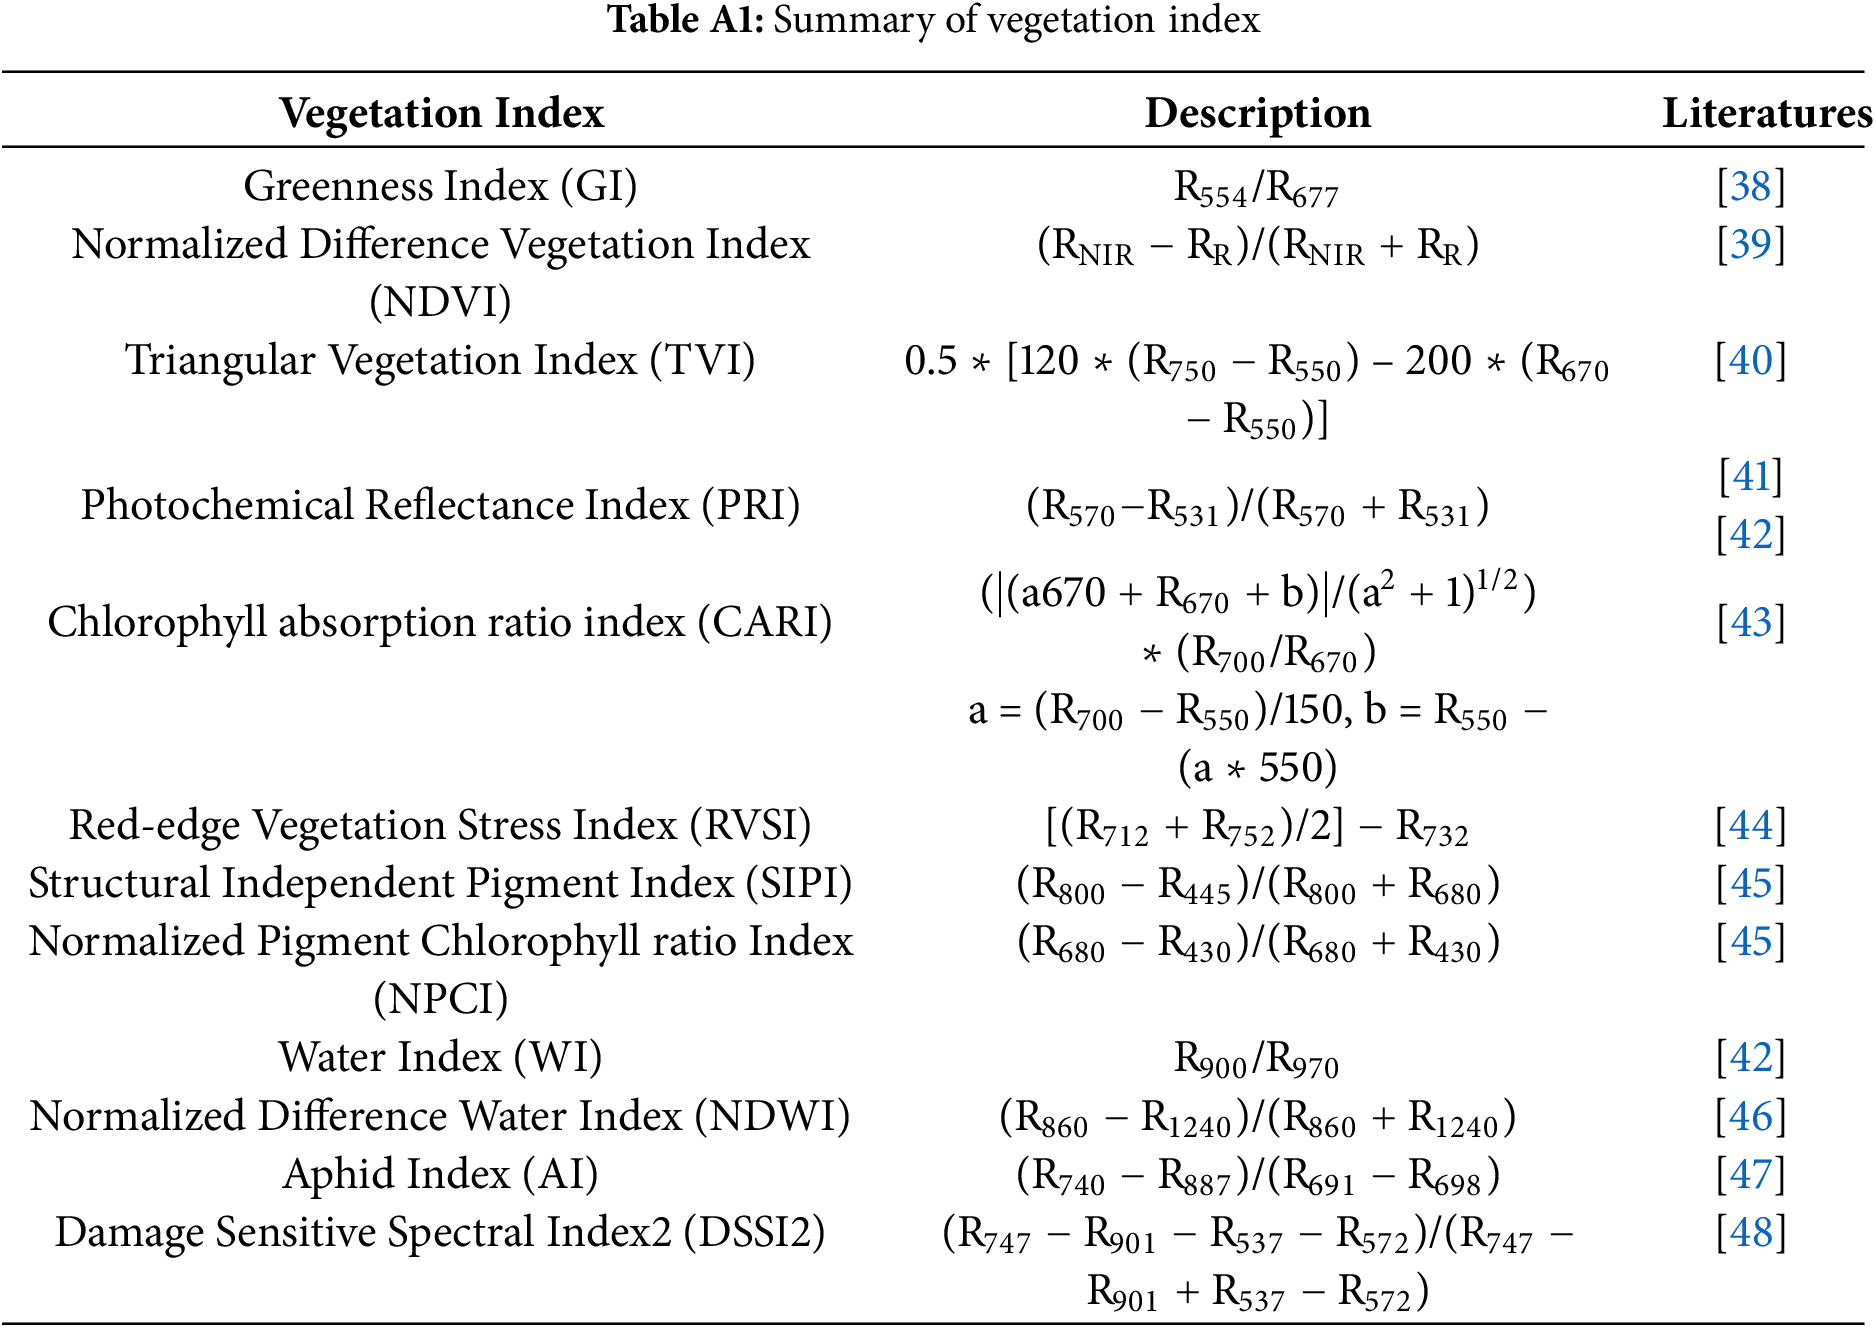
We selected two classical and widely used spectral analysis approaches to further validate the effectiveness and advantages of the proposed CWPA method for hyperspectral disease monitoring. They included a systematic comparison of the vegetation index (VI)-based and principal component analysis (PCA)-based methods using the same dataset. The VI-based methods construct spectral indices using the reflectance values from specific wavelengths to capture physiological traits, such as chlorophyll content, water status, and photosynthetic activity. They have been widely applied to detect crop stress and disease symptoms in the early stages [34]. In this study, we screened 12 representative VIs (Appendix A Table A1) and selected the most informative ones through a one-way ANOVA (p < 0.001) followed by a correlation analysis (R2 > 0.8) to remove redundancy and obtain an optimal feature subset. Alternatively, PCA uses linear transformation to project high-dimensional hyperspectral data into orthogonal components. This enables the reduction of dimensionality reduction while preserving the major data variance. We retained the principal components whose cumulative contribution exceeded 95% as the classification features [35]. The VI-based and PCA-based methods employ the same algorithms and accuracy evaluation metrics as the CWA and CWPA methods to construct the models and assess performance.
3.1 Canopy Spectral Response Characteristics of Rice BLB
The canopy spectral reflectance curves of rice samples with different levels of BLB infection are shown in Fig. 5a, while Fig. 5b shows the corresponding spectral ratio curves. The spectral reflectance values increased and then decreased with the severity of disease in the spectral range of 350–2500 nm. There were significant differences in the spectral characteristics across the wavelength regions. In the visible light range of 350–680 nm, there was little change in the spectral reflectance of all the samples, and they slightly increased in parallel with the severity of the disease. This could be owing to the reduction in chlorophyll content and the degradation of leaf tissues caused by the disease. This resulted in vegetation that was absorbed poorly and enhanced reflection. In the red-edge region (680–800 nm), the spectral reflectance increased rapidly. The healthy sample (Healthy) had the greatest increase, followed by the mild infection sample (Mild). The severe infection sample (Severe) increased the least. Severe disease inhibited the photosynthetic activity of the leaf cells. This slowed the increase in reflectance in the red-edge region, which typically manifests as a red-edge shift. The most significant spectral response differences were observed in the near-infrared plateau region (760–1100 nm). Compared with the healthy sample, the reflectance values of the disease-stressed samples significantly decreased in this region. This decline became more pronounced as the disease severity increased primarily owing to damage to the structures of the leaf cells. This reduced the multiple scattering ability of the near-infrared light and reflected a significant deterioration in the physiological state of the vegetation. These results indicated that the near-infrared plateau region (760–1100 nm) played a crucial role in the identification and assessment of disease severity in rice BLB. It provided key information to quantify the disease and further validated the importance of this wavelength region for the assessments of plant health. Additionally, the ratio spectral curves in Fig. 5b clearly reveal reflectance variations induced by BLB across several sensitive wavelength regions, including 380–500 nm, 600–700 nm, and 750–1000 nm. These variations correspond to progressive physiological and structural alterations, including chlorophyll degradation, tissue damage, and moisture loss, thereby enabling effective differentiation of BLB severity levels. Overall, the rice BLB had a significant impact on the spectral reflectance of the canopy. This was apparent because the spectral curves from samples that varied in their disease severity had specific changes across the visible, red-edge, and near-infrared bands. This characteristic suggested that spectral signal analysis based on hyperspectral data could be an effective tool for the early monitoring of rice BLB and the diagnosis of its severity. These factors indicate the importance of applying this technique for diagnosis.
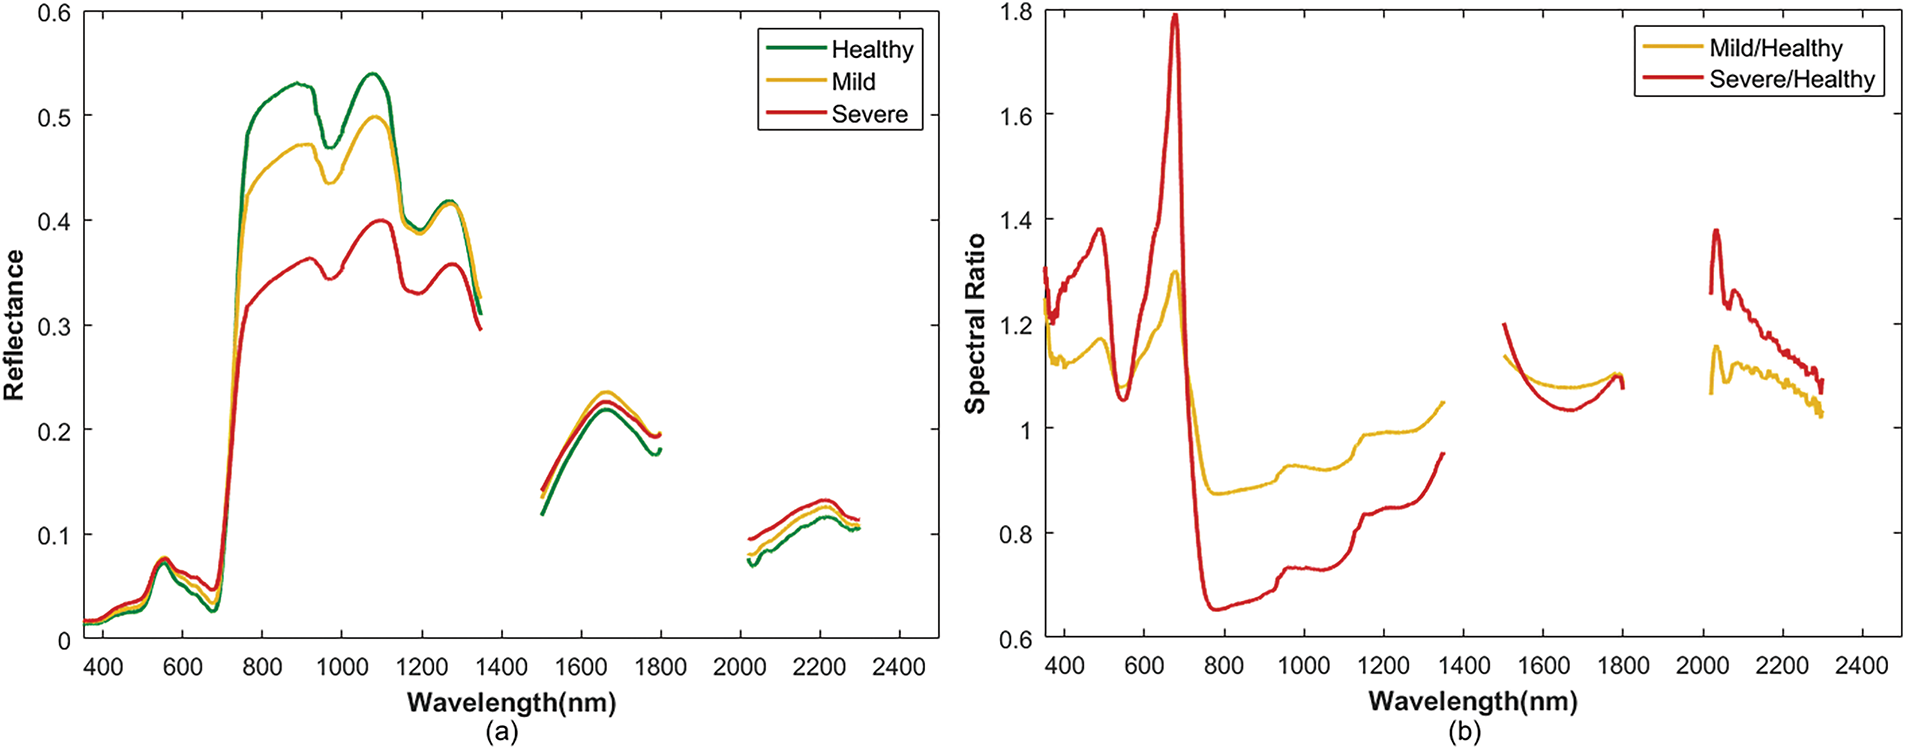
Figure 5: Comparisons of the Spectral Responses between Healthy and Different Disease Severities. (a) Curves of raw reflectance; (b) Spectral ratio curves (Mild/Healthy and Severe/Healthy). The spectral bands from 1350–1500 nm, 1800–2019 nm, and 2301–2500 nm, which were affected by atmospheric water vapor, have been excluded from this figure
3.2 Feature Selection and Model Evaluation Based on Traditional Continuous Wavelet Analysis
The required NF and model accuracy for the models to monitor rice BLB based on different wavelet basis functions and machine learning algorithm combinations are shown in Table 1. It shows that the Meyer wavelet basis function performed the best overall across all three classifiers. The Meyer-RF model achieved an accuracy of 93.73% using six features, whereas the Meyer-KNN and Meyer-NB models achieved an accuracy of 91.25% using seven and six features, respectively. The second-best performer was the Mexican Hat wavelet basis function. Although the model was slightly less accurate than the Meyer function across all three classifiers, it required fewer features. The Morlet wavelet basis function performed the worst, with all three models requiring the same NF (five). The Morlet-RF model achieved an accuracy of 88.75%, and both the Morlet-KNN and Morlet-NB models achieved an accuracy of 85.0%. In terms of machine learning algorithm performance, the RF algorithm overall outperformed the KNN and NB models for monitoring BLB in rice. The highest model accuracy with the RF algorithm across different wavelet basis functions was 93.75% (Meyer-RF), whereas the highest model accuracies for the KNN and NB algorithms <91.25%. Considering both NF and model accuracy, the best model combinations for each wavelet basis function were as follows: Meyer-RF (six features, 93.75% overall accuracy), Mexican Hat-Naïve Bayes (three features, 90.00% overall accuracy), Mexican Hat-RF (five features, 92.50% overall accuracy), and Morlet-RF (five features, 88.75% overall accuracy).
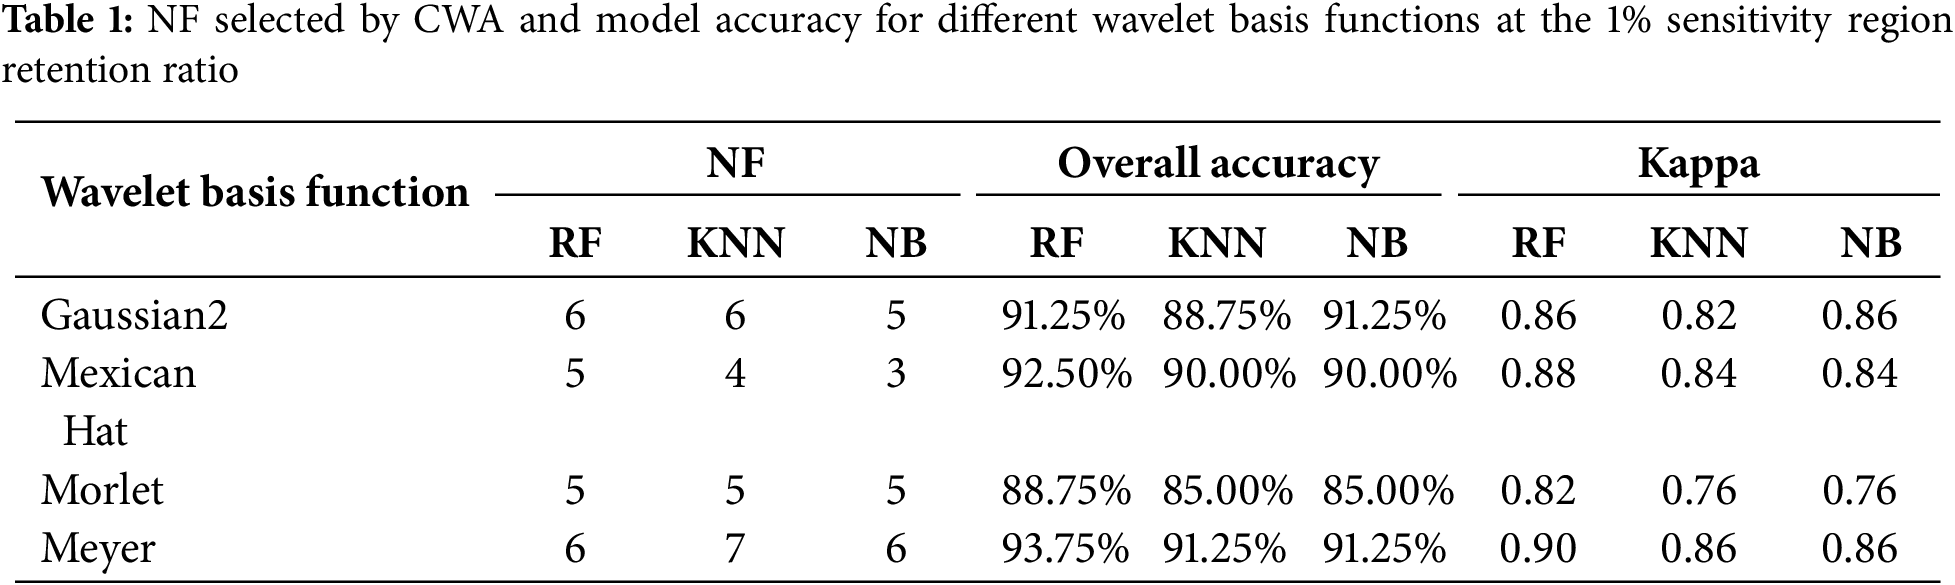
Fig. 6 shows the wavelet coefficient sensitivity spectra of the rice BLB generated by the best models of four different wavelet basis functions. As shown in the figure, although the four wavelet basis functions analyzed the spectral signals differently, the sensitivity spectra they produced were all highly sensitive in the 623–925 nm wavelength range. These responses reflect the important role of this range in disease monitoring. Despite differences in feature extraction scales and frequency domain analysis, all four wavelet basis functions extracted sensitive features within that key spectral range. This further confirmed the spectral response characteristics of visible and near-infrared wavelengths to rice BLB and their effectiveness in monitoring disease.
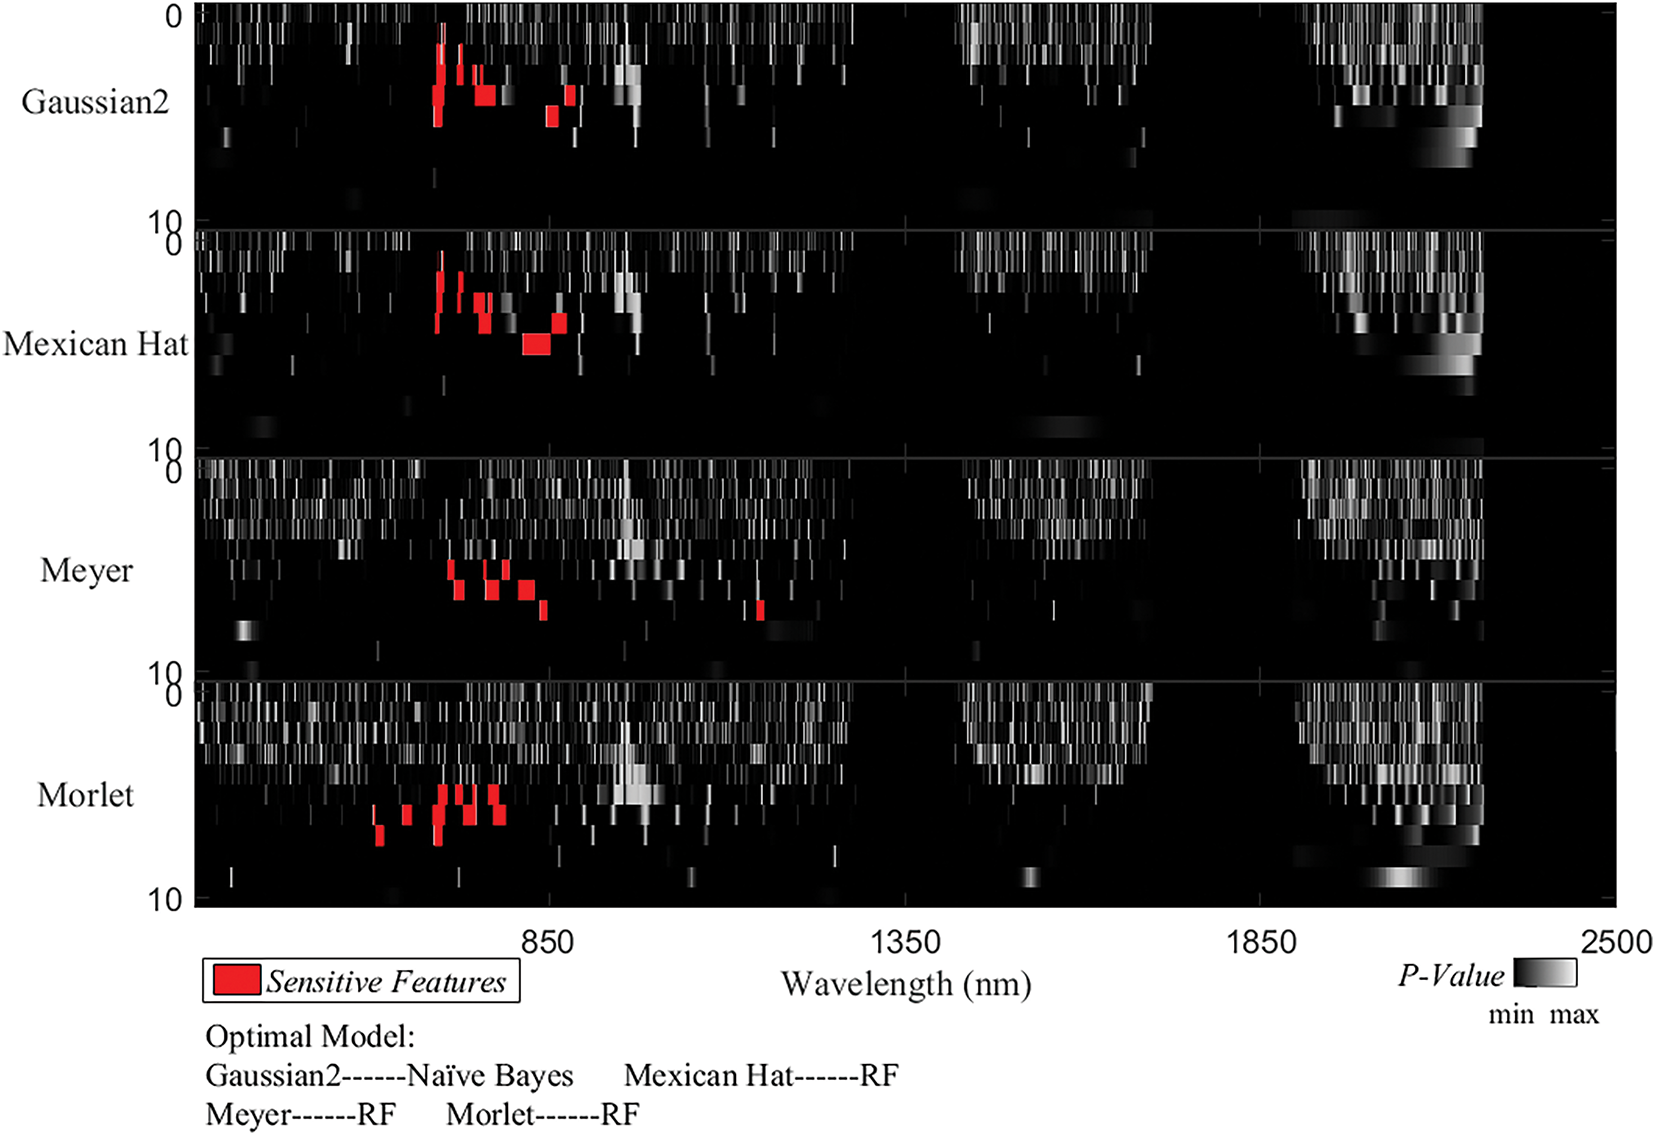
Figure 6: Wavelet Coefficient Sensitivity Spectra and Sensitive Feature (Retaining 1%) Regions for Different Wavelet Basis Functions in CWA. The bands affected by atmospheric water vapor (1350–1500 nm, 1800–2019 nm, and 2301–2500 nm) are excluded in this figure, and the corresponding regions are black
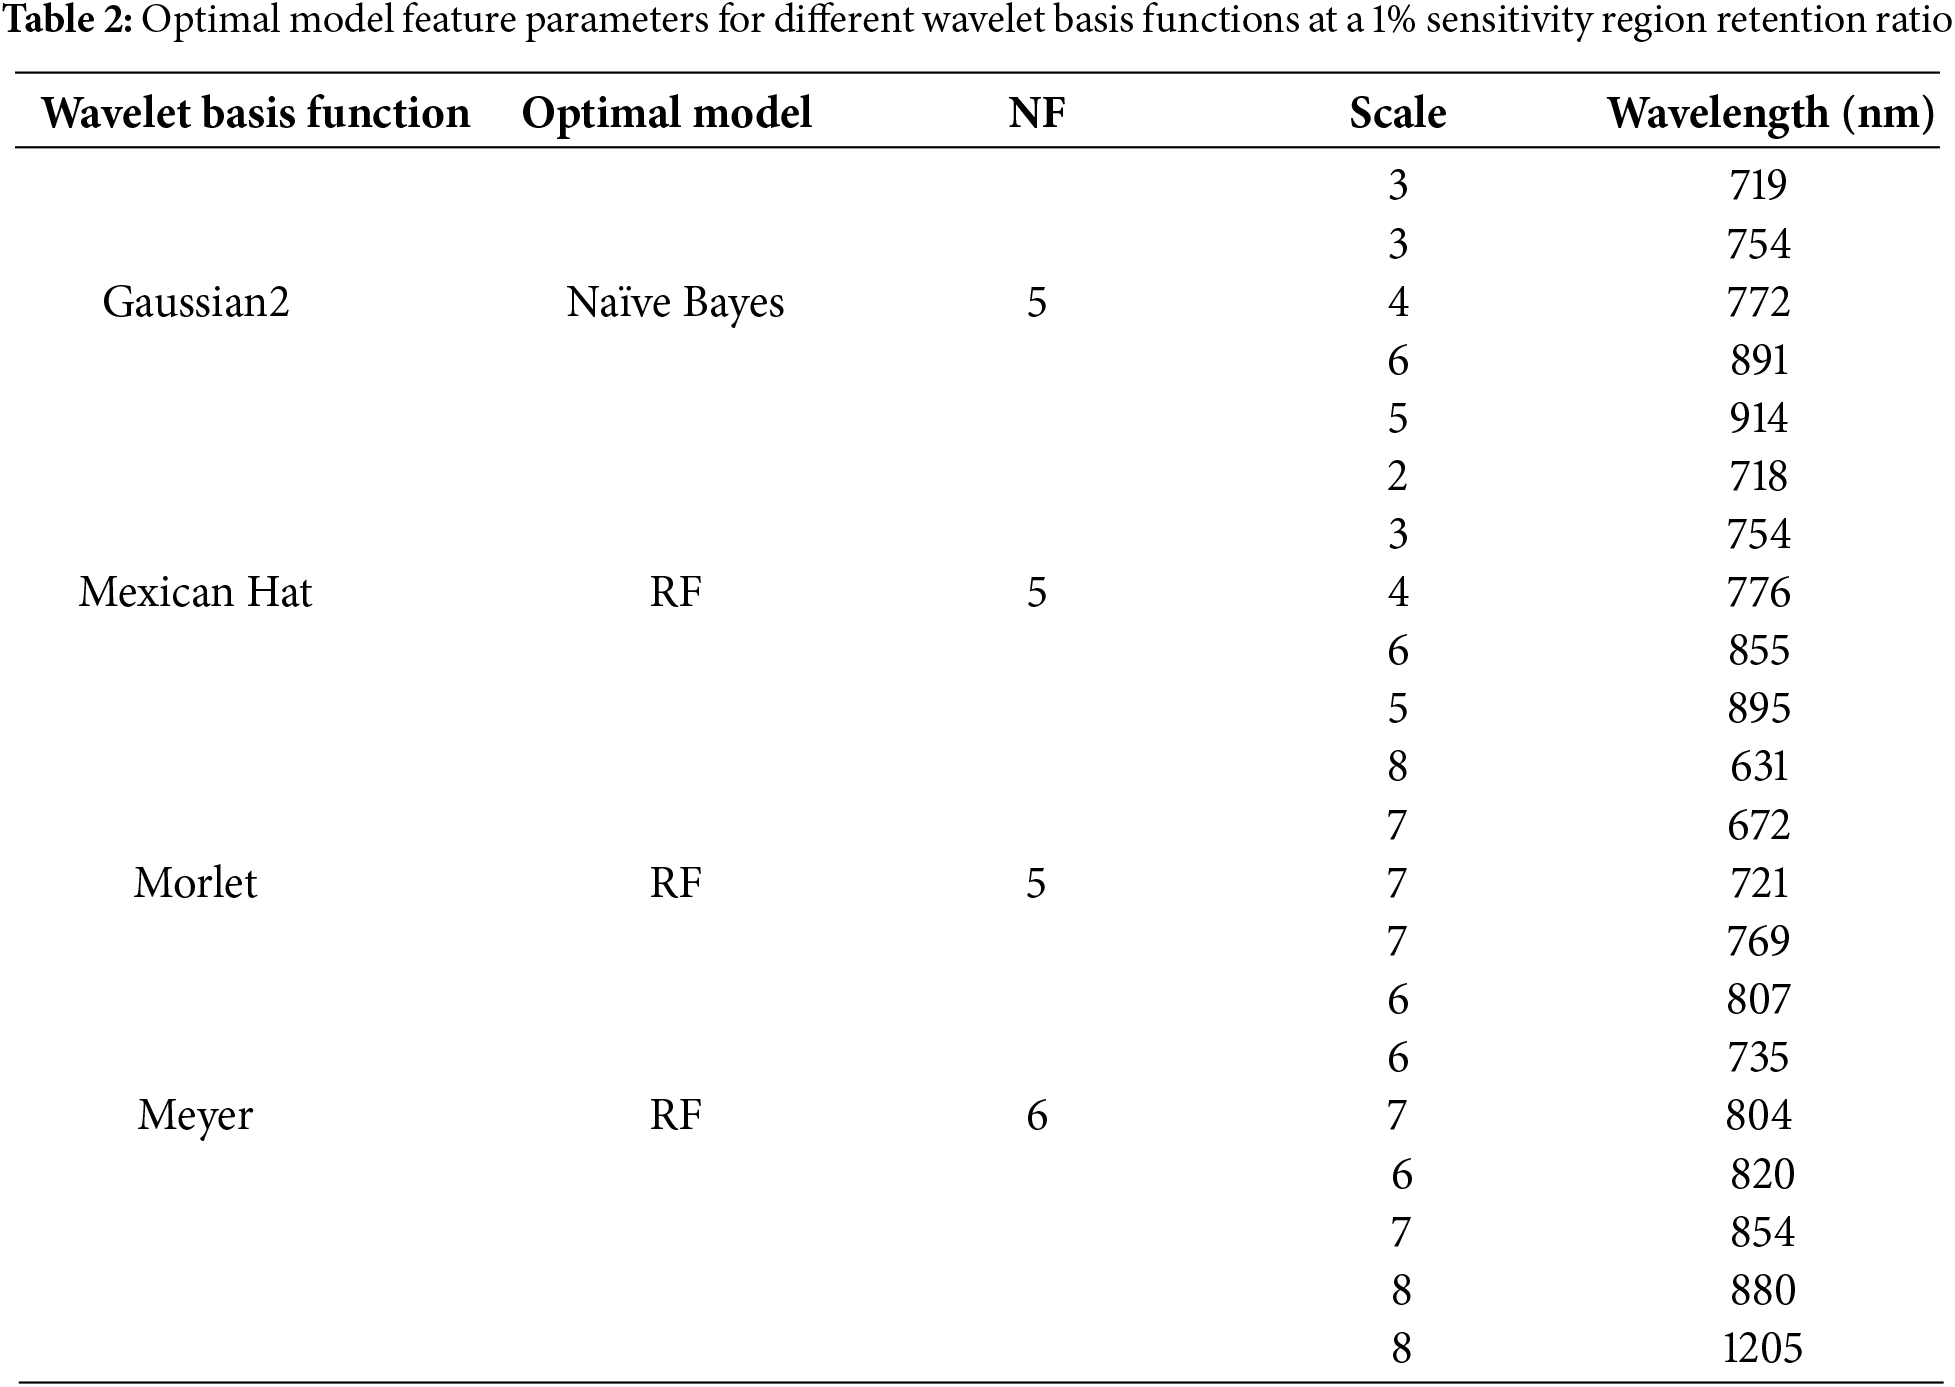
The features selected by the Meyer-RF combination in the 1205 nm shortwave infrared region may have been related to changes in the content of water in the rice leaves. There were strong plant moisture absorption characteristics in the shortwave infrared region, and the damage to leaf cells and water imbalance caused by rice BLB led to significant changes in reflectance in this wavelength range. Therefore, the selection of this feature may have reflected the impacts of disease on leaf physiological properties. In contrast, the features selected by the other models were primarily concentrated in the visible and near-infrared bands (631–914 nm). This indicated that the primary spectral responses of rice BLB were in the photosynthetic pigment absorption region and the sensitive region of cell structure. In the 631–680 nm range, the degradation of chlorophyll induced by the disease weakened the absorption of red light by the photosynthetic pigments. This led to an increase in reflectance. Therefore, the sensitive features in this region effectively captured the changes in pigment caused by the disease. In the 700–800 nm red-edge region, the reflectance of the healthy vegetation typically rapidly increased. The disease suppressed cellular activity and the integrity of leaf internal structures. However, it led to a shift in the red-edge position and a decrease in reflectance. This made it an important indicator to distinguish the severity of disease. The 800–914 nm near-infrared plateau region was highly sensitive to changes in the plant cell structure. These changes were apparent because the collapse of cells and damage to leaf tissue caused by the disease led to a significant reduction in reflectance. This made it a key reflectance region to recognize disease and assess its severity.
The differences in decomposition scales and feature bands of different wavelet basis functions reflected the varying ability of each base function to analyze sensitive regions of the spectral signal. Table 2 summarizes the optimal model feature parameters corresponding to each wavelet basis function under a 1% sensitivity region retention ratio. The Gaussian2 and Mexican Hat wavelet basis functions, with their feature distributions at lower scales (2–6), were more suitable for capturing the details of changes in the local spectral detail. In contrast, the Morlet and Meyer wavelet basis functions, which were more effective at extracting at higher scales (6–8), could effectively analyze the overall changes in the spectral profile caused by the disease. In particular, the Meyer base function extracted features in the shortwave infrared region. This ability further expanded the spectral sensitivity range for monitoring disease. Therefore, combining the base functions with different time-frequency distribution characteristics and multi-band feature analysis can reveal the multi-scale and multi-mechanism effects of rice BLB on the characteristics of the leaf spectra. Thus, this method improved the accuracy and applicability of the disease monitoring models.
As shown in Fig. 7, we further visualized the transformation features of the optimal Meyer wavelet basis function at representative scales and wavelength locations and directly compared them with the original reflectance spectra of healthy, mildly, and severely infected samples. The comparison clearly demonstrates how wavelet transformation captures the spectral variations induced by disease that may not be evident in the raw spectral curves. In particular, broad-scale features reflect the global structural changes in the spectral profiles, while narrow-scale features highlight subtle disturbances in specific ranges of wavelengths. This enables a comprehensive characterization of the spectral response across different levels of severity. These results reinforce the rationale for employing CWPA to detect hyperspectral diseases by integrating both fine- and broad-scale information to improve the robustness and interpretability of the model.
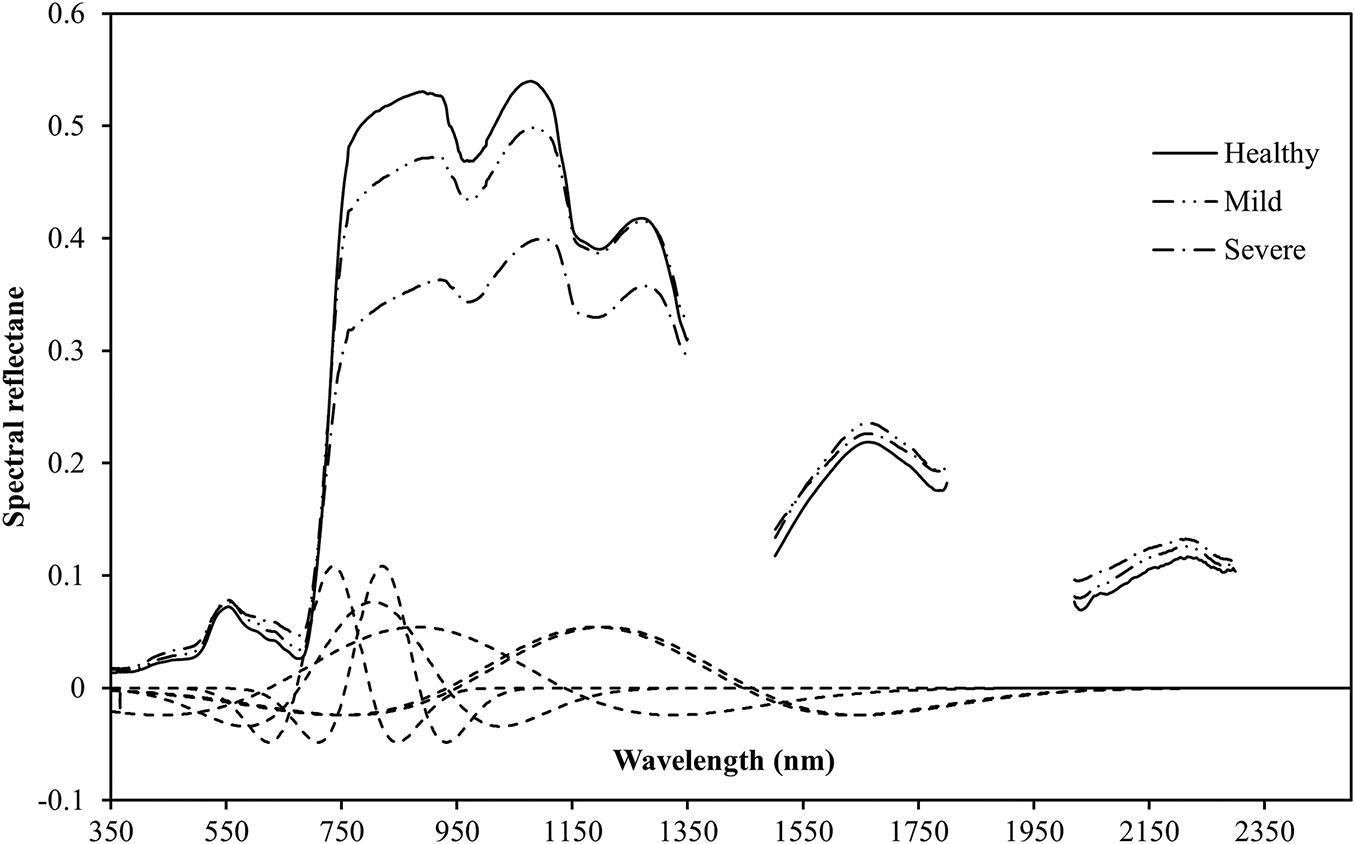
Figure 7: Comparison of the Optimal Wavelet Basis Function Features and Raw Reflectance Spectra across Scales and Wavelengths. The dashed line indicates the mother wavelet at a specific location and scale
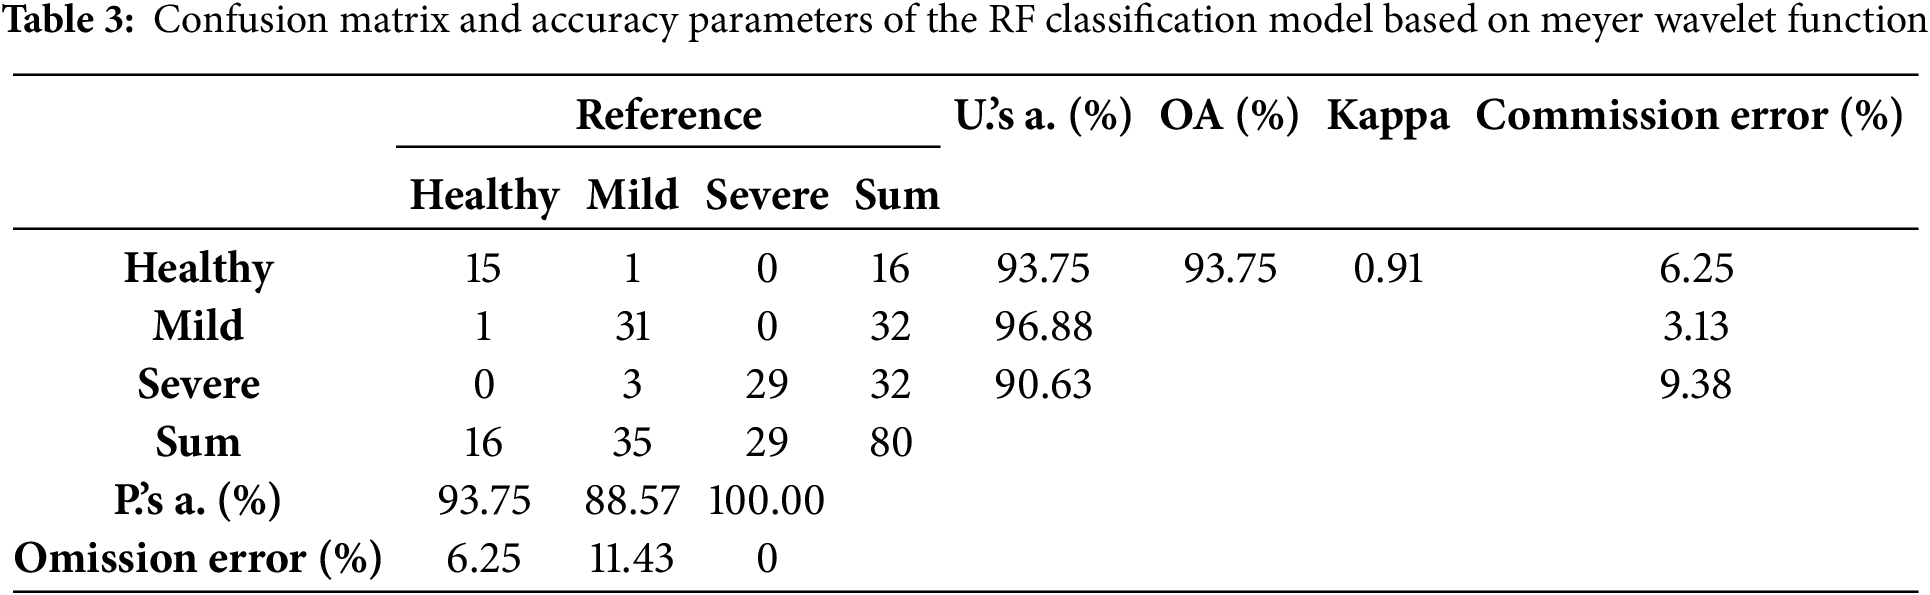
To further evaluate the Meyer-RF model performance to monitor BLB in rice, Table 3 shows the confusion matrix and various accuracy evaluation metrics on three types of samples: Healthy, Mild, and Severe. The Meyer-RF model achieved an overall accuracy (OA) of 93.75% across 80 samples. This indicated that the model could effectively distinguish between different levels of severity of rice BLB and was highly stable and applicable. The Kappa coefficient of the model was 0.91, which indicated that it was highly consistent between the classification results and the actual conditions. There was minimal impact from random classification factors. Further observation of the classification results showed that the model performed best when identifying severe samples, with a producer’s accuracy of 100.0%, and it had a discrimination accuracy of 93.75% for healthy samples. However, the model’s recognition of mild samples was relatively poor, with a producer’s accuracy of only 88.57%. The main classification confusion occurred when mild samples were misclassified as severe samples. This misclassification may have been owing to the overlap of spectral features between mild and severe diseases, the limited ability of wavelet feature extraction to capture subtle changes, and class imbalances in the training data. Future efforts should combine multi-scale feature extraction and improved classification models to enhance the model’s ability to recognize mild diseases, thereby improving the precision and robustness of analyzing disease.
Using CWA, the sensitivity spectra generated by the four wavelet functions demonstrated a high degree of consistency in terms of spectral bands and feature extraction. This similarity may have been related to the closeness in shape of the wavelet functions themselves. For instance, the Gaussian2 and Mexican Hat wavelet functions have similar shapes. They also had similar features in their sensitivity spectra regarding the characteristic bands and intensity distributions. This phenomenon was not only confirmed by the analytical results but also provided important insights to select the decompositions of wavelets in practical applications. After analyzing the sensitivity spectra of wavelet functions, it was possible to capture the local features of the spectral signals more accurately, thereby enhancing the efficiency and precision of the extraction of spectral information. Based on the sensitive feature parameters selected from the four wavelet functions, the RF algorithm outperformed the NB and KNN models in monitoring BLB in rice. This indicated that RF was more adaptable and robust when handling high-dimensional, complex spectral data. Moreover, the proper control of NFs was crucial for the performance of the model. Too many redundant features not only increased the model complexity but could also have led to the model to overfit, which degraded its accuracy. The Meyer wavelet function showed a good balance in feature selection, effectively compressing feature dimensions while ensuring high model accuracy (up to 93.75%). This further demonstrated its superiority and applicability in the monitoring of rice BLB.
3.3 Feature Selection and Model Evaluation Based on Continuous Wavelet Projection Algorithm (CWPA)
Unlike traditional CWA, the CWPA performed simultaneous disease-sensitive feature selection and optimal model construction. Fig. 8 shows the overall accuracy curves of the models with varying numbers of features based on CWPA analysis using four different wavelet functions. For all four wavelet functions, the KNN, RF, and NB models were relatively highly accurate with very few features (NF = 1). The accuracy quickly decreased and then gradually stabilized as the NF increased. However, in some cases with more features, the model accuracy approached or exceeded the accuracy obtained with NF = 1. For example, in the RF model based on the Mexican Hat wavelet function, when the NF was 43, the model accuracy was 92.5%. This was higher than the accuracy at NF = 1. However, an excessive NF significantly reduced the model’s computational efficiency. Considering both accuracy and efficiency, wavelet features at NF = 1 were preferentially selected for further analysis.
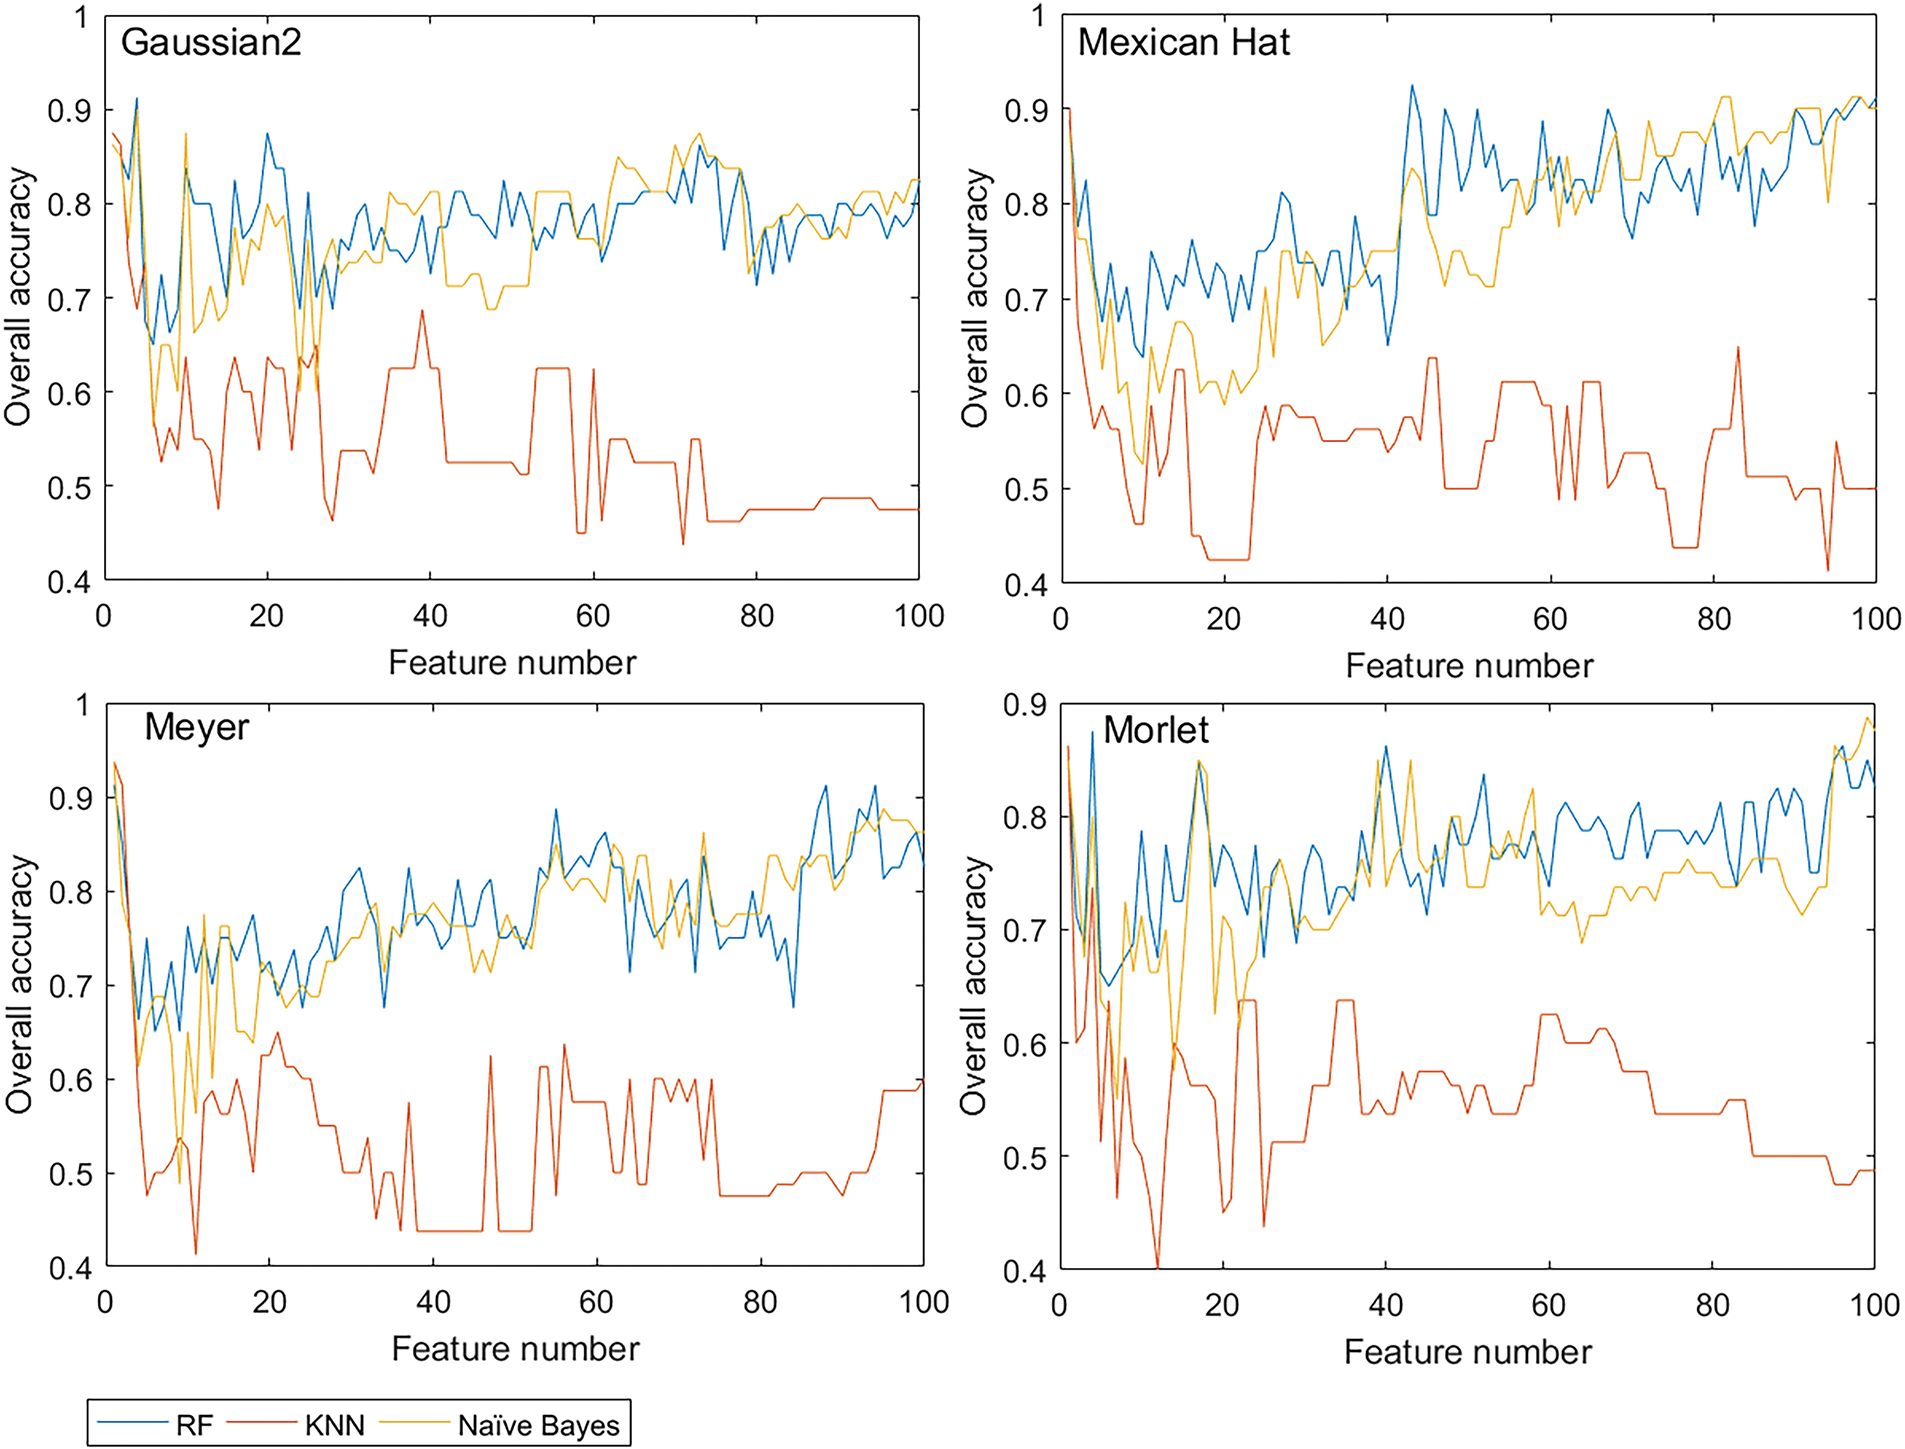
Figure 8: Model accuracy curves for different wavelet functions in CWPA
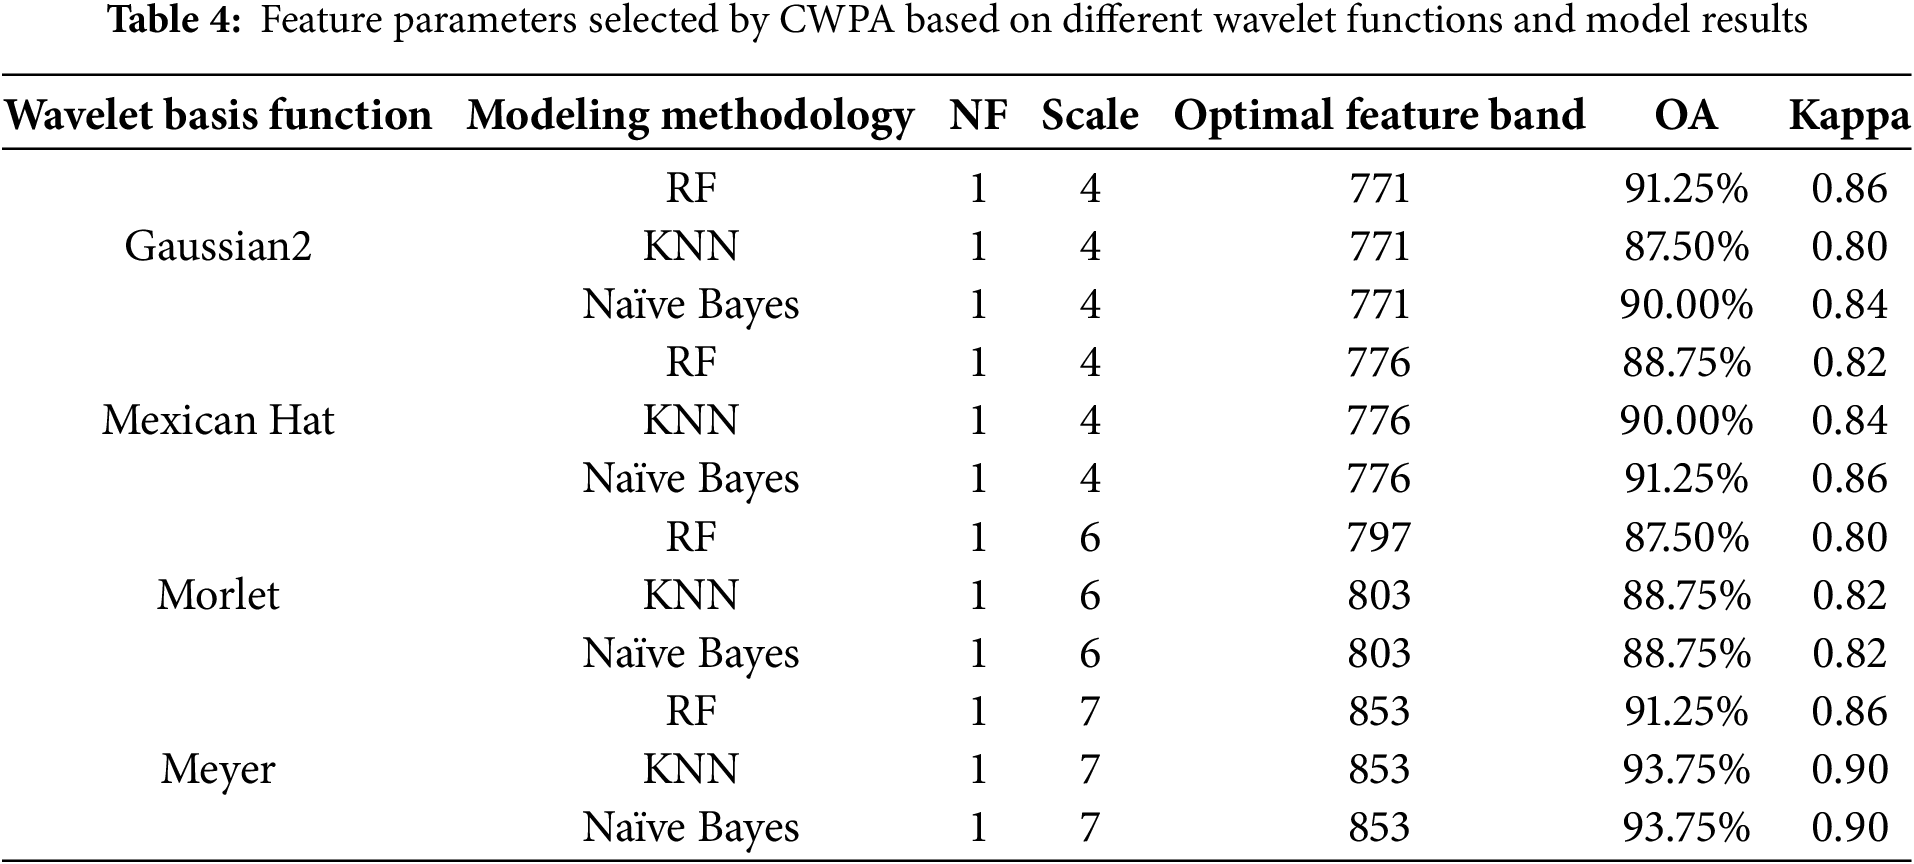
Analysis of the CWPA model under different wavelet functions showed that there were significant differences in the results of classification (Table 4). This was despite the fact that only one sensitive feature was selected for each wavelet function and was primarily distributed at decomposition scales 4, 6, and 7 with the central wavelengths concentrated in the 771–853 nm band. In particular, the Meyer wavelet function performed the best across all the classification models, particularly in the Meyer-KNN and Meyer-NB combinations. When NF = 1 (decomposition scale 7, wavelength 853 nm), the model accuracy reached 93.75%, and the Kappa coefficient was 0.90. This was significantly higher than the other wavelet functions. The Gaussian2 and Mexican Hat wavelet functions performed second best, with their sensitive features located at decomposition scale 4. This corresponded to wavelengths of 771 nm and 776 nm, respectively, and the model accuracies ranged from 87.50% to 91.25%, respectively. The Morlet wavelet function performed the worst, with its sensitive features located at decomposition scale 6. These corresponded to wavelengths of 797 nm (RF) and 803 nm (KNN, NB), and the model accuracy did not exceed 90%. These results suggest that the Meyer wavelet function, owing to its high sensitivity to changes in the shape of spectra, was able to more accurately capture the spectral features when the rice was stressed by BLB stress. This made it the ideal wavelet function for the CWPA analysis. Notably, the key band at 853 nm lies in the near-infrared plateau region, which is highly responsive to changes in the internal structure and water status of leaves. Infection by BLB disrupts the mesophyll integrity and reduces turgor, which leads to decreased reflectance in this region [36,37]. This supports the physiological relevance of 850 nm as a sensitive indicator of BLB stress.
Compared to the CWA method, the CWPA method effectively compressed the feature dimension while retaining key information. It significantly reduced the NF by constructing a feature set with the lowest information redundancy through continuous projection algorithms and evaluating the contribution of each feature to the overall feature set. In this study, the CWPA method still had a highly accurate model even when selecting only one sensitive feature. This further validated its effectiveness and advantages in feature selection. Additionally, the selected sensitive features were all concentrated in the 771–853 nm near-infrared region. This indicates that this band was closely related to changes in the structure and physiology of that canopy that were caused by rice BLB. These changes significantly impacted the characteristics of spectral reflectance. Future research could explore the spectral mechanisms of disease occurrence and development in this key band and its potential in remote sensing monitoring applications.
3.4 Comparison of the Performance of Two Wavelet Spectral Analysis Models
The performance comparison between CWA and CWPA models constructed using different wavelet functions (Gaussian2, Mexican Hat, Morlet, and Meyer) is shown in Tables 1 and 4. The results indicated that the performance of wavelet function under both the CWA and CWPA frameworks was generally consistent. However, there were differences in terms of NF and accuracy of the model. First, the Meyer wavelet function performed the best in terms of the impact of different wavelet functions on the performance of the model. Under both CWA and CWPA, the Meyer-RF, Meyer-KNN, and Meyer-NB combinations all achieved model accuracies >90%, and the highest level of accuracy was 93.75%. The Kappa coefficients >0.86, which indicated that they were highly stable and able to generalize. In contrast, the Morlet wavelet function performed the worst, with levels of model accuracy that ranged from 85.0% to 88.75% and a Kappa coefficient <0.82. This indicated that it was not able to characterize spectral features or effectively capture the spectral changes induced by diseases. Next, in terms of the differences between CWA and CWPA model performance, CWPA had significant advantages in feature optimization and computational efficiency when there was a similar model accuracy. Although CWA could extract more spectral features (three to seven), the issue of feature redundancy was evident. This led to increased computational complexity and limited model performance. In contrast, CWPA, by introducing the SPA, compressed the NF to 1. This change significantly improved the efficiency of computation while ensuring the integrity of spectral information. For example, in the case of the Meyer wavelet function, the Meyer-KNN and Meyer-NB combinations in CWPA were highly accurate (OA = 93.75%) that was similar to CWA. However, with only one feature, it significantly reducing the model’s complexity and enhancing practicality. Further, from an algorithmic mechanism and applicability perspective, CWA adopted a full-scale feature extraction strategy that increased the feature redundancy and noise interference. This particularly limited the response speed of the model in field-based real-time monitoring. In contrast, CWPA integrated innovative feature selection into the process of wavelet transformation. This led to the optimal projection of spectral information. It not only retained disease-sensitive information but also effectively compressed the feature dimension, thus, improving computational efficiency. The combination of the Meyer wavelet function and CWPA exhibited excellent performance by balancing both high-precision monitoring and feature simplification. This can offer technical support for the development of lightweight, real-time disease monitoring systems. Overall, a comparison of the CWA and CWPA models revealed that CWPA could compress the feature dimension to the optimal level (NF = 1) while maintaining the accuracy of model. This significantly reduced the complexity of computation. The synergistic effect of the Meyer wavelet function and CWPA was the most notable. It was highly accurate and efficient with single-feature modeling. This work further studied the influence of different wavelet basis functions and the integration of CWPA with various machine learning models to identify the optimal strategy for BLB monitoring. Thus, it supports the development of a new technological pathway for hyperspectral crop disease monitoring that enables rapid and real-time identification and assessment of disease.
3.5 Comparison with Other Spectral Analytical Methods
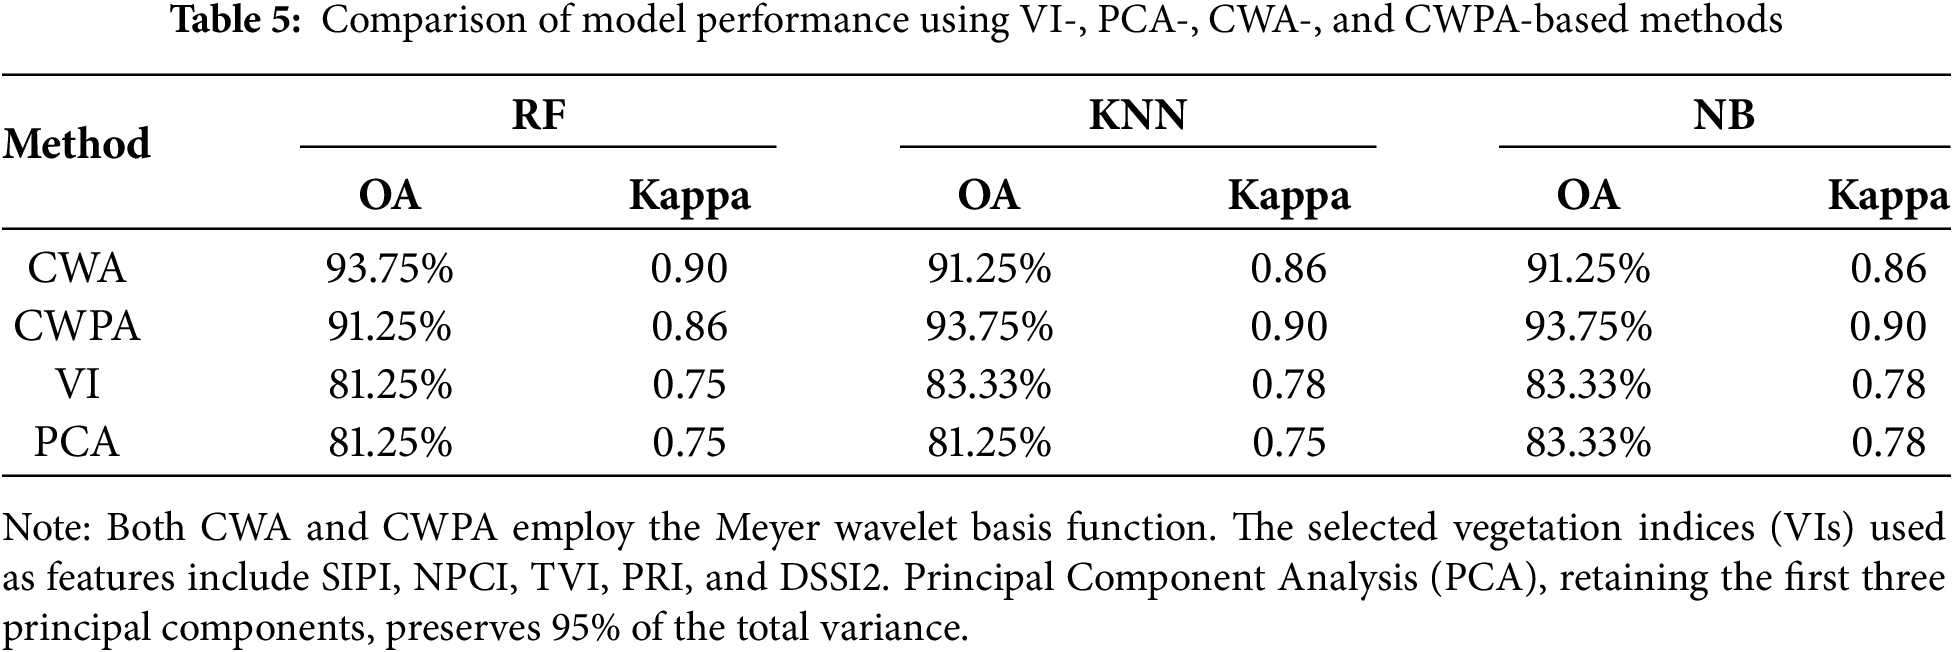
The comparative results of model performance using VI-, PCA-, CWA-, and CWPA-based methods are summarized in Table 5. In terms of classification accuracy, the CWPA method out-performed both the VI and PCA approaches in overall accuracy (OA) and Kappa coefficient. For instance, use of the KNN classifier revealed that the CWPA-based model achieved an OA of 93.75% and a Kappa coefficient of 0.90, which were significantly higher than those of the VI-based method (OA = 83.33%, Kappa = 0.76) and the PCA-based method (OA = 81.25%, Kappa = 0.74). Moreover, CWPA achieved similar or superior accuracy using only one selected feature, whereas the VI and PCA approaches required five vegetation indices and the first three principal components, respectively. This indicated that CWPA substantially reduced the complexity of this model. In terms of computational efficiency, the CWPA effectively reduced the training time by minimizing the feature dimensionality. Thus, CWPA is suitable for high-frequency data processing and real-time field monitoring. In contrast, the VI- and PCA-based methods were limited in their feature compression capabilities and less effective at preserving disease-sensitive spectral information. Their use resulted in inferior generalization and robustness. Compared with these traditional approaches, CWPA leverages continuous wavelet transform (CWT) for multiscale spectral decomposition, which captures both global trends and local fluctuations in the spectral signal. When combined with the successive projections algorithm (SPA), CWPA can further optimize the selection of disease-sensitive features by offering superior noise suppression and feature compression. Furthermore, CWPA was highly adaptable and robust when integrated with different wavelet basis functions, such as Meyer and Mexican Hat, and classifiers. This further improved its practicality and potential for broader application. Based on the empirical findings of this study, CWPA was superior overall at detecting rice bacterial leaf blight, a disease known to produce distinct spectral responses.
This study evaluated the differences in performance between CWA and CWPA to monitor BLB disease in rice. It explored the relationship between different wavelet functions, feature extraction methods, and model accuracy. The main conclusions were as follows: (1) CWA Model Effectiveness and Feature Redundancy: The CWA model effectively interpreted the spectral response to diseases but suffered from feature redundancy that impacted its efficiency. Through multi-scale feature extraction, CWA revealed the spectral changes caused by rice BLB, particularly when combined with the Meyer wavelet function and the RF classifier. The overall accuracy ranged from 91.25% to 93.75%. This significantly outperformed the other wavelet functions. However, the model relied on six features extracted from the 763–941 nm range across 6–8 scales, which causes feature redundancy, reduces the computational efficiency and limits the model’s real-time monitoring capacity for large-scale disease monitoring. (2) CWPA Model Optimized Feature Dimension for High Precision and Efficiency: The CWPA model balanced high precision and efficiency by optimizing the feature dimension. By combining the SPA, CWPA reduced the feature dimension, using only a single feature at scale 7 (853 nm). This achieved 93.75% OA in both the KNN and NB classifiers. This significant reduction in computational complexity addressed the feature redundancy problem in CWA. Thus, CWPA is suitable for real-time field monitoring and large-scale data processing. (3) CWPA Overcame the Efficiency Bottleneck While Ensuring High Precision: A comparative analysis revealed that the CWA model faced significant feature redundancy (NF = 6), whereas the CWPA model combined spectral feature extraction from CWA with the feature selection mechanism of SPA. This resulted in a compressed feature dimension (NF = 1) and maintained the model accuracy while significantly enhancing the computational efficiency and breaking through the efficiency bottleneck of traditional models. Both the CWA and CWPA models highlighted the spectral response characteristics of the 623–925 nm visible and near-infrared bands for rice BLB. This demonstrated their diagnostic value to identify disease and assess its severity. Notably, the Meyer wavelet function, with its excellent time-frequency localization, was highly versatile at interpreting spectral-space features. It provides theoretical support and technical pathways for the mechanistic analysis and precise monitoring of rice BLB.
In conclusion, the CWPA model outperformed the traditional CWA model in terms of disease feature extraction, computational efficiency, and monitoring accuracy. This was particularly true for hyperspectral real-time monitoring and the construction of lightweight disease detection systems. This study offers new insights and empirical evidence for the application of the CWPA algorithm in disease monitoring and feature selection. Future research could explore the following areas: (1) optimizing the CWPA algorithm to enhance its robustness in complex backgrounds and integrating real-time remote sensing data for efficient online monitoring; (2) expanding multi-disease monitoring to apply the model in the precise management and control of multiple crop diseases; and (3) integrating multi-source remote sensing data with deep learning technologies to build more comprehensive disease detection models, improving the intelligent level of multi-scale, multi-dimensional disease monitoring. This study provides theoretical support and a technical pathway for the application of hyperspectral remote sensing in agricultural disease monitoring, with significant practical value in the monitoring and control of crop diseases.
Acknowledgement: None.
Funding Statement: This research was supported by the ‘Pioneer’ and ‘Leading Goose’ R&D Program of Zhejiang (Grant No. 2023C02018), Zhejiang Provincial Natural Science Foundation of China (Grant No. LTGN23D010002), National Natural Science Foundation of China (Grant No. 42371385), Funds of the Natural Science Foundation of Hangzhou (Grant No. 2024SZRYBD010001), and Nanxun Scholars Program of ZJWEU (Grant No. RC2022010755).
Author Contributions: The authors confirm their contributions to the paper as follows: Lin Yuan conceptualized and designed the study and drafted the initial manuscript. Chenwei Nie supervised the project and contributed to the research design. Kaihao Shi, Qimeng Yu, and Zhongting Shen performed data analysis, while Yingtan Yu and Xingjian Zhou conducted the experiments. Jingcheng Zhang reviewed and revised the final manuscript. All authors reviewed the results and approved the final version of the manuscript.
Availability of Data and Materials: The datasets generated and/or analyzed during the current study are available from the corresponding author on reasonable request.
Ethics Approval: Not applicable.
Conflicts of Interest: The authors declare that they have no conflicts of interest to report regarding the present study.
Appendix A
References
1. FAO. The state of food security and nutrition in the world 2021. Rome, Italy: FAO; 2021. [Google Scholar]
2. Jiang ZH, Gao LH, Yin W. Soil microorganisms: a new dimension for sustainable agriculture and environmental development. J Microbiol. 2020;40(3):1–7. (In Chinese). doi:10.3969/j.issn.1005-7021.2020.03.001. [Google Scholar] [CrossRef]
3. Li W. Research progress on application of hyperspectral remote sensing technology in pest and disease monitoring. Mod Agric Sci Technol. 2019;14:126–8. (In Chinese). doi:10.3969/j.issn.1007-5739.2019.14.076. [Google Scholar] [CrossRef]
4. Rayhana R, Ma Z, Liu Z, Xiao G, Ruan Y, Sangha JS. A review on plant disease detection using hyperspectral imaging. IEEE Trans AgriFood Electron. 2023;1(2):108–34. doi:10.1109/TAFE.2023.3329849. [Google Scholar] [CrossRef]
5. Khan A, Vibhute AD, Mali S, Patil CH. A systematic review on hyperspectral imaging technology with a machine and deep learning methodology for agricultural applications. Ecol Inform. 2022;69(4):101678. doi:10.1016/j.ecoinf.2022.101678. [Google Scholar] [CrossRef]
6. Zhou R, Ou Y, Yu B, Wang Q. Geometric and radiometric correction methods for multirotor UAV-borne hyperspectral imaging systems. J Southwest Univ Nat Sci Ed. 2019;41(9):141–7. (In Chinese). doi:10.13718/j.cnki.xdzk.2019.09.018. [Google Scholar] [CrossRef]
7. Pascucci S, Pignatti S, Casa R. Special issue hyperspectral remote sensing of agriculture and vegetation. Remote Sens. 2020;12(21):3665. doi:10.3390/rs12213665. [Google Scholar] [CrossRef]
8. Bian L, Wang Z, Zhang Y, Li L, Zhang Y, Yang C, et al. A broadband hyperspectral image sensor with high spatio-temporal resolution. Nature. 2024;635(8010):73–81. doi:10.1038/s41586-024-07286-3. [Google Scholar] [CrossRef]
9. Golhani K, Balasundram SK, Vadamalai G, Pradhan B. A review of neural networks in plant disease detection using hyperspectral data. Inf Process Agric. 2018;5(3):354–71. doi:10.1016/j.inpa.2018.05.002. [Google Scholar] [CrossRef]
10. Lin QN, Huang HG, Chen L. Simulation of needle reflectance spectrum and sensitivity analysis of biochemical parameters of pinus yunnanensis in different healthy status. Spectrosc Spect Anal. 2016;36(8):2538–45. (In Chinese). doi:10.3964/j.issn.1000-0593(2016)08-2538-08. [Google Scholar] [CrossRef]
11. Mustafa G, Zheng H, Li W, Yin Y, Wang Y, Zhou M, et al. Fusarium head blight monitoring in wheat ears using machine learning and multimodal data from asymptomatic to symptomatic periods. Front Plant Sci. 2023;13:1102341. doi:10.3389/fpls.2022.1102341. [Google Scholar] [PubMed] [CrossRef]
12. Hu H, Ren Y, Zhou H, Lou W, Hao P, Lin B, et al. Oilseed rape yield prediction from UAVs using vegetation index and machine learning: a case study in East China. Agriculture. 2024;14(8):1317. doi:10.3390/agriculture14081317. [Google Scholar] [CrossRef]
13. Zhang N, Yang GJ, Zhao CJ, Zhang JC, Yang XD, Pan YC, et al. Progress and prospects of hyperspectral remote sensing technology for crop diseases and pests. Natl Remote Sens Bull. 2021;25(1):403–22. (In Chinese). doi:10.11834/jrs.20210196. [Google Scholar] [CrossRef]
14. Cao YF, Yuan PS, Wang HY, Tchalla WK, Fan JQ, Xu HL. Monitoring index of rice bacterial blight based on hyperspectral fractal dimension. Trans Chin Soc Agric Mach. 2021;52(9):134–40. (In Chinese). doi:10.6041/j.issn.1000-1298.2021.09.015. [Google Scholar] [CrossRef]
15. Liu ZY, Feng S, Zhao DX. Research on spectral feature extraction and detection method of rice leaf blast by UAV hyperspectral remote sensing. Spectrosc Spect Anal. 2024;44(5):1457–63. (In Chinese). doi:10.3964/j.issn.1000-0593(2024)05-1457-07. [Google Scholar] [CrossRef]
16. Deng Y, Wang J, Chen SX. Hyperspectral inversion model of forest soil organic matter based on PCA-DBO-SVR. Spectrosc Spect Anal. 2025;45(2):569–83. doi:10.3964/j.issn.1000-0593(2025)02-0569-15. [Google Scholar] [CrossRef]
17. Siddique MF, Ahmad Z, Ullah N, Kim J. A hybrid deep learning approach: integrating short-time fourier transform and continuous wavelet transform for improved pipeline leak detection. Sensors. 2023;23(19):8079. doi:10.3390/s23198079. [Google Scholar] [PubMed] [CrossRef]
18. Cheng T, Rivard B, Sánchez-Azofeifa GA. Continuous wavelet analysis for the detection of green attack damage due to mountain pine beetle infestation. Remote Sens Environ. 2010;114(4):899–910. doi:10.1016/j.rse.2009.12.005. [Google Scholar] [CrossRef]
19. Rivard B, Feng J, Gallie A. Continuous wavelets for the improved use of spectral libraries and hyperspectral data. Remote Sens Environ. 2008;112(6):2850–62. doi:10.1016/j.rse.2008.01.016. [Google Scholar] [CrossRef]
20. Li C, Wang Y, Ma C, Ding F, Li Y, Chen W, et al. Hyperspectral estimation of winter wheat leaf area index based on continuous wavelet transform and fractional order differentiation. Sensors. 2021;21(24):8497. doi:10.3390/s21248497. [Google Scholar] [PubMed] [CrossRef]
21. Huang L, Wu K, Huang W, Dong Y, Ma H, Liu Y, et al. Detection of fusarium head blight in wheat ears using continuous wavelet analysis and PSO-SVM. Agriculture. 2021;11(10):998. doi:10.3390/agriculture11100998. [Google Scholar] [CrossRef]
22. Ren KH, Dong YY, Huang WJ. Monitoring of winter wheat stripe rust by collaborating canopy SIF with wavelet energy coefficients. Comput Electron Agric. 2023;215:108366. doi:10.1016/j.compag.2023.108366. [Google Scholar] [CrossRef]
23. Zhang J, Wang B, Zhang X, Liu P, Dong Y, Wu K, et al. Impact of spectral interval on wavelet features for detecting wheat yellow rust with hyperspectral data. Int J Agric Biol Eng. 2018;11(6):138–44. doi:10.25165/j.ijabe.20181106.4168. [Google Scholar] [CrossRef]
24. Zhao XH, Zhang JC, Pu RL. The continuous wavelet projections algorithm: a practical spectral-feature-mining approach for crop detection. Crop J. 2022;10(5):1264–73. doi:10.1016/j.cj.2022.04.018. [Google Scholar] [CrossRef]
25. Editorial Committee of Crop Diseases and Insect Pests in China. Crop diseases and insect pests in China. Beijing, China: Agricultural Press; 1979. p. 13–22. (In Chinese). [Google Scholar]
26. Yu LJ, Zhang GL, Ding XW, Gao Y. Progress in identification and application of resistance genes to bacterial blight. J Plant Physiol. 2012;48(3):223–31. (In Chinese). [Google Scholar]
27. Yu JH, Li JJ, Weng LS. Screening and evaluation of bacterial blight resistance in Xa23 gene lines with different indica rice genetic backgrounds. J South Agric. 2021;52(10):1–14. (In Chinese). doi:10.3969/j.issn.2095-1191.2021.10.009. [Google Scholar] [CrossRef]
28. Cheng T, Rivard B, Sánchez-Azofeifa A. Spectroscopic determination of leaf water content using continuous wavelet analysis. Remote Sens Environ. 2011;115(2):659–70. doi:10.1016/j.rse.2010.11.001. [Google Scholar] [CrossRef]
29. Zhang JC, Yuan L, Pu RL. Comparison between wavelet spectral features and conventional spectral features in detecting yellow rust for winter wheat. Comput Electron Agric. 2014;100:79–87. doi:10.1016/j.compag.2013.11.01. [Google Scholar] [CrossRef]
30. Sharma M, Biswas M. WDRKNN: weighted distance representation based nearest neighbor for hyperspectral remote sensing imagery classification. In: Proceedings of the 2023 14th International Conference on Computing Communication and Networking Technologies (ICCCNT); 2023 Jul 6–8; Delhi, India. Piscataway, NJ, USA: IEEE; 2023. p. 1–6. doi:10.1109/ICCCNT56998.2023.10306930. [Google Scholar] [CrossRef]
31. Yang S, Hu L, Wu H, Ren H, Qiao H, Li P, et al. Integration of crop growth model and random forest for winter wheat yield estimation from UAV hyperspectral imagery. IEEE J Sel Top Appl Earth Obs Remote Sens. 2021;14:6253–69. doi:10.1109/JSTARS.2021.3089203. [Google Scholar] [CrossRef]
32. Singh AK, Sunkara R, Kadambi GR, Palade V. Spectral-spatial classification with naive Bayes and adaptive FFT for improved classification accuracy of hyperspectral images. IEEE J Sel Top Appl Earth Obs Remote Sens. 2024;17:1100–13. doi:10.1109/JSTARS.2023.3327346. [Google Scholar] [CrossRef]
33. Gao T, Wu JZ, Mao WH. Method for quickly determining maturity of single corn seed. Trans Chin Soc Agric Mach. 2019;50(S1):399–403. (In Chinese). doi:10.6041/j.issn.1000-1298.2019.S0.061. [Google Scholar] [CrossRef]
34. Zhao H, Yang C, Guo W, Zhang L, Zhang D. Automatic estimation of crop disease severity levels based on vegetation index normalization. Remote Sens. 2020;12(12):1930. doi:10.3390/rs12121930. [Google Scholar] [CrossRef]
35. Chen Z, Wang J, Wang T. Early diagnosis and pathogenesis monitoring of wheat powdery mildew caused by Blumeria graminis using hyperspectral imaging. Comput Electron Agric. 2022;197(1):106921. doi:10.1016/j.compag.2022.106921. [Google Scholar] [CrossRef]
36. Bai X, Zhou Y, Feng X, Tao M, Zhang J, Deng S, et al. Evaluation of rice bacterial blight severity from lab to field with hyperspectral imaging technique. Front Plant Sci. 2022;13:1037774. doi:10.3389/fpls.2022.1037774. [Google Scholar] [PubMed] [CrossRef]
37. Wu Y, Li H, Wang J. Early detection of bacterial blight in hyperspectral images based on random forest and adaptive coherence estimator. Sustainability. 2022;14(20):13168. doi:10.3390/su142013168. [Google Scholar] [CrossRef]
38. Zarco-Tejada PJ, Berjón A, López-Lozano R, Miller JR, Martín P, Cachorro V, et al. Assessing vineyard condition with hyperspectral indices: leaf and canopy reflectance simulation in a row-structured discontinuous canopy. Remote Sens Environ. 2005;99(3):271–87. doi:10.1016/j.rse.2005.09.002. [Google Scholar] [CrossRef]
39. Rouse JW, Haas RH, Schell JA, Deering DW. Monitoring vegetation systems in the Great Plains with ERTS. NASA Spec Publ. 1973;351:309–17. [Google Scholar]
40. Zhao D, Huang L, Li J, Qi J. A comparative analysis of broadband and narrowband derived vegetation indices in predicting LAI and CCD of a cotton canopy. ISPRS J Photogramm Remote Sens. 2004;59(1–2):1–14. doi:10.1016/j.isprsjprs.2004.09.002. [Google Scholar] [CrossRef]
41. Huang Z, Turner BJ, Dury SJ, Wallis IR, Foley WJ. Estimating foliage nitrogen concentration from HYMAP data using continuum removal analysis. Remote Sens Environ. 2007;109(1):25–36. doi:10.1016/j.rse.2006.12.002. [Google Scholar] [CrossRef]
42. Naidu RA, Perry EM, Pierce FJ, Mekuria T. The potential of spectral reflectance technique for the detection of Grapevine leafroll-associated virus-3 in two red-berried wine grape cultivars. Comput Electron Agric. 2009;66(1):38–45. doi:10.1016/j.compag.2008.11.007. [Google Scholar] [CrossRef]
43. Kim MS, Daughtry CST, Chappelle EW, McMurtrey JE. The use of high spectral resolution bands for estimating absorbed photosynthetically active radiation (APAR). In: Proceedings of the 6th International Symposium on Physical Measurements and Signatures in Remote Sensing; 1994 Jan 17–21; Val d’Isère, France. p. 299–306. [Google Scholar]
44. Merton R. Monitoring community hysteresis using spectral shift analysis and the red-edge vegetation stress index. In: Proceedings of the 7th Annual JPL Airborne Earth Science Workshop; 1998 Jan 12–16; Pasadena, CA, USA. p. 12–6. [Google Scholar]
45. Devadas R, Lamb DW, Simpfendorfer S, Backhouse D. Evaluating ten spectral vegetation indices for identifying rust infection in individual wheat leaves. Precis Agric. 2009;10(6):459–70. doi:10.1007/s11119-008-9100-2. [Google Scholar] [CrossRef]
46. Gao BC. NDWI—a normalized difference water index for remote sensing of vegetation liquid water from space. Remote Sens Environ. 1996;58(3):257–66. doi:10.1016/S0034-4257(96)00067-3. [Google Scholar] [CrossRef]
47. Mirik M, Michels GJJr, Kassymzhanova-Mirik S, Elliott NC. Reflectance characteristics of Russian wheat aphid (Hemiptera: aphididae) stress and abundance in winter wheat. Comput Electron Agric. 2006;57(2):123–34. doi:10.1016/j.compag.2007.03.002. [Google Scholar] [CrossRef]
48. Mirik M, Michels GJ Jr, Kassymzhanova-Mirik S, et al. Using digital image analysis and spectral reflectance data to quantify damage by greenbug (Hemiptera: aphididae) in winter wheat. Comput Electron Agric. 2006;51(1–2):86–98. doi:10.1016/j.compag.2005.11.004. [Google Scholar] [CrossRef]
Cite This Article
 Copyright © 2025 The Author(s). Published by Tech Science Press.
This work is licensed under a Creative Commons Attribution 4.0 International License , which permits unrestricted use, distribution, and reproduction in any medium, provided the original work is properly cited.
 Downloads
 Citation Tools