
 Submit a Paper
 Propose a Special lssue
 Open Access
ARTICLE

Tissue-Specific Transcriptomic Responses and Viral Accumulation in Lily Cultivars Infected with Cucumber Mosaic Virus
1 Floriculture Research Division, National Institute of Horticultural and Herbal Science, Rural Development Administration, Wanju, 55365, Republic of Korea
2 Department of Horticultural Science, Kyungpook National University, Daegu, 41566, Republic of Korea
3 Institute of Agricultural Science and Technology, Kyungpook National University, Daegu, 41566, Republic of Korea
* Corresponding Author: Yun-Jae Ahn. Email:
(This article belongs to the Special Issue: Plant Responses to Stress Factors)
Phyton-International Journal of Experimental Botany 2026, 95(1), 7 https://doi.org/10.32604/phyton.2026.073138
Received 11 September 2025; Accepted 09 December 2025; Issue published 30 January 2026
 View Full Text
 Download PDF
Abstract
Cucumber mosaic virus (CMV) threatens lily production by reducing floral quality and enabling carry-over via infected planting stock. To explore tissue-specific host responses, we analyzed a legacy, single-replicate RNA-seq dataset from two cultivars, ‘Cancun’ and ‘Connecticut King’ (CK), profiling leaf (source) and bulb (sink) tissues at 0 and 28 days post-inoculation (dpi), alongside leaf DAS-ELISA. Principal component analysis indicated that tissue identity dominated the transcriptome (PC1 = 47.7%), with CMV treatment driving within-tissue shifts over time. Exploratory Gene Ontology/KEGG summaries and a focused marker panel revealed a consistent split: in leaves, genes linked to jasmonate/WRKY-associated defense (e.g., WRKY40/41/51/53; AOS/OPR1/2; CYP74A/DDE2) tended to show higher expression at 28 dpi, whereas cell-wall/transport-related terms were reduced; in bulbs, transcripts associated with photosynthetic/organellar maintenance (LHCB/CAB, HCF107) and β-amylase-linked carbohydrate turnover were more prominent, with comparatively limited elevation of canonical defense modules. Leaf ELISA trajectories were compatible with this framework: CK showed a transient peak at 14 dpi followed by a decline at 24 dpi, whereas ‘Cancun’ increased progressively. Taken together, the concordance among ordination, enrichment patterns, marker behavior, and leaf titers in this non-replicated dataset is consistent with a working model in which stronger or earlier leaf responses may contribute to partial containment and reduced systemic accumulation. We propose a compact leaf marker set (WRKY40/41/51/53; AOS/OPR1/2; CYP74A/DDE2) and bulb candidates (β-amylase; LHCB/CAB/HCF107) as hypothesis-generating indicators of containment and sink maintenance. These tissue-resolved patterns provide a descriptive framework and a starting point for future validation by qPCR and replicated RNA-seq across additional cultivars, with the long-term goal of informing selection and stock hygiene in lily production.Keywords
Cucumber mosaic virus (CMV) is among the most widespread plant pathogens worldwide, infecting over 1200 plant species across more than 100 families [1,2,3]. Beyond its impact on food crops, CMV also threatens ornamental horticulture, where outbreaks have been reported in lilies (Lilium spp.), chrysanthemums, tulips, and many other floricultural plants [4,5,6]. In these hosts, CMV causes mosaic and mottling of leaves, chlorosis, vein clearing, deformation of leaves and flowers, and general growth stunting. In lilies specifically, infections lead to severe foliar mosaics, distortion of new leaves, necrotic spotting, and deterioration of bulb quality [7]. Such symptoms reduce the aesthetic value and marketability of both cut flowers and bulbs, with reported yield losses ranging from 20% under typical conditions to over 50% in severe outbreaks [5].
Plant viruses like CMV extensively reprogram host gene expression, altering cellular pathways to favor infection or counteract defenses [8]. For example, Arabidopsis RCY1 confers resistance to a yellow strain of CMV, and this resistance is accompanied by elevated defense gene expression and salicylic acid (SA) accumulation [9]. In contrast, mutations in essential host factors like eIF4E can confer CMV resistance by impeding viral protein translation [10]. To capture such host responses, high-throughput transcriptomic tools (especially RNA sequencing) are now widely used to profile global expression changes during infection and identify virus-responsive genes and pathways. RNA-seq studies in model plants have illuminated key CMV-responsive pathways. For instance, in tobacco, hundreds of genes are differentially expressed upon CMV infection, notably those linked to reactive oxygen species, SA signaling, and plant-pathogen interactions, which are strongly activated in a resistant cultivar [11]. Similarly, transcriptomic analysis in Arabidopsis revealed broad modulation of defense- and hormone-related genes by CMV [12]. Notably, such approaches are now extending to ornamental crops: transcriptome profiling in CMV-infected chrysanthemum identified stress- and hormone-related genes modulated by the virus [4], and an RNA-seq study in lily uncovered a NAC transcription factor associated with CMV resistance [13]. These findings underscore the broad utility of RNA-seq in elucidating plant-virus interactions. In virus-inoculated leaves (the primary source tissues), plants often exhibit a sharp depression in photosynthetic activity alongside heightened immune signaling. Many viruses actively induce a “sink” metabolism in infected source leaves, repressing photosynthesis while diverting resources toward defense and viral replication [14].
Correspondingly, strong defense responses are triggered in these leaves (e.g., pathogenesis-related proteins and hormone-mediated pathways), as the plant attempts to contain the infection. In contrast, lily bulbs serve as nutrient-storage tissues and sinks for photoassimilates, their infection has more prolonged and pernicious consequences. Because lilies are propagated clonally through bulbs, any virus reaching the bulb can persist and carry over to the next generation [15]. Indeed, systemic virus invasion of sink tissues leads to deterioration of bulb quality and yield losses (often >50% in severe cases) [5]. This makes infection of the bulb a major economic concern, as it not only stunts long-term plant vigor but also threatens the production of healthy, marketable bulbs and flowers. Despite these implications, to our knowledge no study has yet systematically compared virus-induced transcriptomic changes between source leaves and storage tissues in lily. Previous RNA-seq analyses in ornamental hosts have focused only on leaves [13], leaving a significant knowledge gap regarding how sink tissues like bulbs respond at the molecular level to virus stress.
Reports in lilies indicate variation in CMV impact across species or hybrids, and some germplasm shows notable tolerance, for example, Lilium regale has been characterized as virus-resistant and yielded CMV-responsive defense regulators via RNA-seq [13,16]. However, formal comparative studies at the cultivar level within commercial Lilium remain scarce. Most assessments in lilies have emphasized symptom observation or presence/absence diagnostics (ELISA/RT-PCR, multiplex RT-PCR) rather than molecular dissection of tolerance mechanisms [5,15,17]. This evidence gap leaves breeding programs with few robust molecular markers for CMV tolerance, slowing progress toward resistant cultivars. Moreover, defense signaling that is excessively activated can aggravate disease through cell-death pathways, whereas moderated responses may support tolerance, underscoring the need for integrated genotype- and tissue-level analyses of CMV responses in lily.
In this study, we integrate comparative transcriptome profiling with quantitative measurements of viral accumulation. Two Lilium cultivars with contrasting CMV responses were analyzed, and gene expression was profiled in source leaves and storage bulbs at a later stage of infection alongside mock controls. In parallel, leaf virus titers were tracked by ELISA, enabling linkage between leaf viral dynamics and the tissue-resolved transcriptomes. This combined approach jointly compares tissue- and cultivar-specific molecular responses to CMV and connects them to virus accumulation, yielding candidate defense pathways and genes that can guide molecular marker development and breeding strategies for CMV-tolerant lilies.
2.1 Plant Materials and Virus Inoculation
In vitro-propagated plantlets of Lilium ‘Cancun’ and ‘Connecticut King’ were supplied by the tissue culture facility, National Institute of Horticultural and Herbal Science (Republic of Korea). The Cucumber mosaic virus (CMV) Teaan strain was propagated in Nicotiana tabacum (Xanthi-nc) and mechanically inoculated onto test plants at the three-leaf stage. Virus-infected leaf sap was extracted in 0.1 M sodium phosphate buffer (pH 6.9) and applied to Lilium leaves using carborundum dust to facilitate infection. Each plant was inoculated twice to ensure successful viral transmission, while mock-inoculated plants received only buffer without the virus. Symptom development was monitored, and leaf and bulb samples were collected at 0 and 28 days post-inoculation (dpi) for transcriptomic analysis. The 0 dpi samples represent baseline tissues before systemic infection was established and were used as a reference state in which CMV was not yet detectable by DAS-ELISA. The 28 dpi time point was used as a late systemic stage, when systemic mosaic symptoms and growth reduction were clearly visible in the inoculated plants in this experiment. An independent cohort grown and inoculated under identical conditions was used for ELISA sampling at 0, 14, and 24 dpi.
2.2 RNA Extraction and Sequencing
Leaf and bulb samples from ‘Cancun’ and ‘Connecticut King’ were collected at 0 and 28 days post-inoculation (dpi). Total RNA was extracted using the Qiagen RNeasy Plant Mini Kit (Qiagen, Germany) according to the manufacturer’s protocol. RNA quality and concentration were assessed using a NanoDrop spectrophotometer (Thermo Fisher Scientific) and an Agilent 2100 Bioanalyzer (Agilent Technologies). RNA integrity was determined using the RNA Integrity Number (RIN), and only samples with RIN values ≥7.0 were used for sequencing. Libraries were prepared with the Illumina TruSeq RNA Sample Preparation Kit (Illumina, USA), and sequencing was performed on an Illumina HiSeq 2000 platform, generating 100 bp paired-end reads. The resulting raw sequence reads were subjected to quality control filtering before assembly.
2.3 De Novo Transcriptome Assembly, Mapping, and Exploratory Differential Expression
The Illumina adapter sequence was removed from the sequencing data using Cutadapt, and read preprocessing was performed with the SolexaQA package, employing DynamicTrim and LengthSort [18]. De novo transcriptome assembly was performed using Velvet (v.1.1.06) and Oases (v.0.2.01) software based on the de Bruijn graph algorithm [19,20]. Trimming resulted in reads with a mean length of 88.57 bp across all samples and a minimum length of 25 bp. The final assembled transcripts, obtained by optimizing the k-mer and removing duplicate sequences, were used for downstream analyses [21]. Cleaned reads from each sample were then mapped to the assembled sequences using Bowtie2 [22], and a gene-by-sample count matrix was generated from the alignment output.
Since this study is based on a legacy dataset in which only one RNA-seq library was available per condition (cultivar × tissue × time), count data were normalized primarily to correct for differences in sequencing depth using the DESeq framework [23], and fold changes between conditions were estimated from these normalized counts. Genes were classified as differentially expressed within this dataset using a false discovery rate (FDR) threshold of 0.05 with the Benjamini-Hochberg procedure as a heuristic filter. In the absence of biological replication, the resulting DEG lists and associated FDR values should be interpreted as exploratory rankings of expression patterns rather than as formally inferential statistics from a replicated design.
2.4 Functional Enrichment Analysis
Assembled transcripts were functionally annotated by comparing them with gene sequences in the euKaryotic Orthologous Groups (KOG), NCBI non-redundant (NR), and Kyoto Encyclopedia of Genes and Genomes (KEGG) databases using the BLASTX algorithm with an e-value threshold of 1 × 10⁻¹⁰. Gene Ontology (GO) annotation was performed by assigning functional classifications based on sequence similarity to proteins in the GO database, with an e-value cutoff of 1 × 10⁻¹⁰ and selection of the best hits [24].
For each comparison, up- and down-regulated gene sets defined within this dataset (Section 2.3) were analyzed separately for functional enrichment. Enrichment of GO terms and KEGG pathways was evaluated using a hypergeometric test with Benjamini-Hochberg correction for multiple testing (FDR). In line with the non-replicated design of the RNA-seq experiment, these enrichment analyses are used here as descriptive tools to summarize over-represented functional categories among the exploratory DEG lists, and the associated FDR values serve as heuristic ranking criteria rather than as formally inferential statistics.
GO enrichment analysis was conducted using Blast2GO [21], with GO terms classified into Biological Process (BP), Cellular Component (CC), and Molecular Function (MF) categories. FDR values (≤0.05) are reported to highlight categories that appear most over-represented in this dataset. The number of assembled transcripts assigned to each GO term was counted using in-house scripts from SEEDERS Co.
2.5 Data Analysis and Visualization
A gene × sample count matrix was assembled from the RNA-seq output for two cultivars (‘Cancun’, ‘Connecticut King’), two tissues (leaf, bulb), and two time points (0 and 28 dpi), yielding eight samples in total. A separate sample metadata table encoded sample, cultivar, tissue, and time. Raw counts were normalized using the DESeq “median-of-ratios” size-factor method: for each gene, we computed the geometric mean across samples; per-sample size factors were obtained as the median of counts/geometric-mean ratios; and counts were divided by these size factors. A log2 transformation (log2(normalized + 1)) was then applied to stabilize the dispersion. To emphasize structure driven by high-variance transcripts, we selected up to the top 5000 most variable genes based on the variance of the log2-normalized matrix.
PCA analysis PCA was performed on the (genes × samples) matrix transposed to samples × genes using scikit-learn (PCA with two components). The proportion of variance explained by PC1 and PC2 is reported in the axis labels. Points are colored by tissue and shaped by cultivar. For paired conditions (same cultivar × tissue at 0 and 28 dpi), vectors (0 → 28 dpi) were drawn to visualize infection-driven trajectories; time labels (“0 d”, “28 d”) were placed near each point with small offsets to avoid overlap. Pearson correlation coefficients were computed from the log2-normalized expression matrix for all sample pairs and displayed as a heatmap, with samples ordered as in the PCA plot. Because only one RNA-seq library was available per condition, the PCA and correlation heatmap provide a descriptive ordination and summary of sample relationships rather than inferential statistics. Analyses used Python 3 (NumPy, pandas, scikit-learn, SciPy) and Matplotlib.
GO/KEGG enrichment analysis For GO/KEGG enrichment visualization, up- and down-regulated gene sets defined within this dataset (Section 2.3) were first obtained from cultivar-specific contrasts (28 dpi vs. 0 dpi). Genes were classified as Up or Down when |log2 fold-change| ≥ 1.0; FDR values from the DESeq framework were used as a heuristic ranking criterion where available, rather than as formal significance thresholds. For tissue-level summaries, DEG lists were then combined across cultivars (Cancun ∪ CK) within each direction (Up/Down). Enrichment statistics for GO terms and KEGG pathways were computed as described in Section 2.4 (one-sided Fisher’s exact test with Benjamini-Hochberg FDR correction). Terms were ranked by FDR and, secondarily, by overlap size and GeneRatio. To aid interpretation in this exploratory dataset, for each panel (Leaf-Up, Leaf-Down, Bulb-Up, Bulb-Down) up to 10 terms with the lowest FDR were displayed; in cases where very few terms met a strict cutoff, an FDR ≤ 0.10 was used only to select terms for plotting. GeneRatio is defined as k/term_size, where k is the number of genes in the DEG set intersecting the term. Bubble area is proportional to k (overlap), and color encodes −log10(FDR). These plots are intended to summarize functional categories that appear over-represented among the exploratory DEG lists rather than to provide formal hypothesis tests.
Heatmap For the marker-focused heatmap, four log2 fold-change contrasts were used: ‘Cancun’ leaf (28 dpi vs. 0 dpi), ‘Connecticut King’ leaf (28 dpi vs. 0 dpi), ‘Cancun’ bulb (28 dpi vs. 0 dpi), and ‘Connecticut King’ bulb (28 dpi vs. 0 dpi). Candidate genes were identified by keyword matching of functional annotations (TAIR symbol/description, GO, and KEGG orthology) across five categories: defense/salicylic acid (SA), jasmonate/ethylene (JA/ET) signaling, WRKY/NAC transcription factors, reactive oxygen species (ROS)/antioxidant processes, and photosynthesis. Within each category, genes were ranked by across-contrast variance and up to eight top genes were retained; remaining slots (up to a maximum of 40 genes) were filled by the highest-variance genes to ensure coverage of additional responsive candidates. The heatmap was generated from the four log2 fold-change values per gene after row-wise z-scaling and clipping to the range [−2.5, 2.5]. Rows were clustered using hierarchical clustering (average linkage, Euclidean distance). Because these contrasts are derived from a non-replicated design, the heatmap should be interpreted as a descriptive summary of candidate marker behavior rather than a statistically validated expression signature.
2.6 CMV Quantification by DAS-ELISA
Plants used for ELISA were grown and inoculated with the CMV-Teaan strain as described in Section 2.1. Leaf and bulb tissues of ‘Cancun’ and ‘Connecticut King’ were collected at 0, 14, and 24 days post-inoculation (dpi). The 0 dpi samples were taken immediately after mock or CMV treatment and represent a pre-systemic baseline stage; at this time point, CMV absorbance values remained at background levels and virus was not detectable above the DAS-ELISA threshold in either cultivar.
For each condition, approximately 100 mg of tissue was homogenized in the kit extraction buffer at a 1:10 (g/v) ratio and clarified by brief centrifugation. Virus concentration was measured by double-antibody sandwich ELISA (DAS-ELISA) using a commercial CMV kit (Agdia, Elkhart, USA), following the manufacturer’s instructions. Aliquots of 100 μL per well were loaded, and absorbance was read at 405 nm (OD405) on a microplate reader. Mock-inoculated tissues and buffer blanks served as negative controls, and a CMV-positive control was included on each plate. Biological replicates were assayed with technical duplicates.
3.1 Global Separation of Transcriptomes by Tissue and Time
Principal component analysis (PCA) of the eight RNA-seq libraries revealed a strong tissue effect (leaf vs. bulb) along PC1, which explained 47.7% of the variance (Fig. 1A). For both cultivars, the 0 → 28 dpi vectors progressed largely within the tissue clusters, indicating infection-driven shifts that were smaller than the baseline leaf-bulb difference. PC2 (25.9% variance) further separated samples by time within tissues. Consistently, the sample-sample Pearson correlation heatmap showed high within-tissue similarity and lower cross-tissue similarity (Fig. 1B). Together, these global patterns in this dataset indicate that tissue identity largely structures the transcriptome landscape, with CMV treatment producing tissue-anchored shifts across cultivars. We note that one library per condition was sequenced, so these ordinations are descriptive summaries rather than inferential statistics.
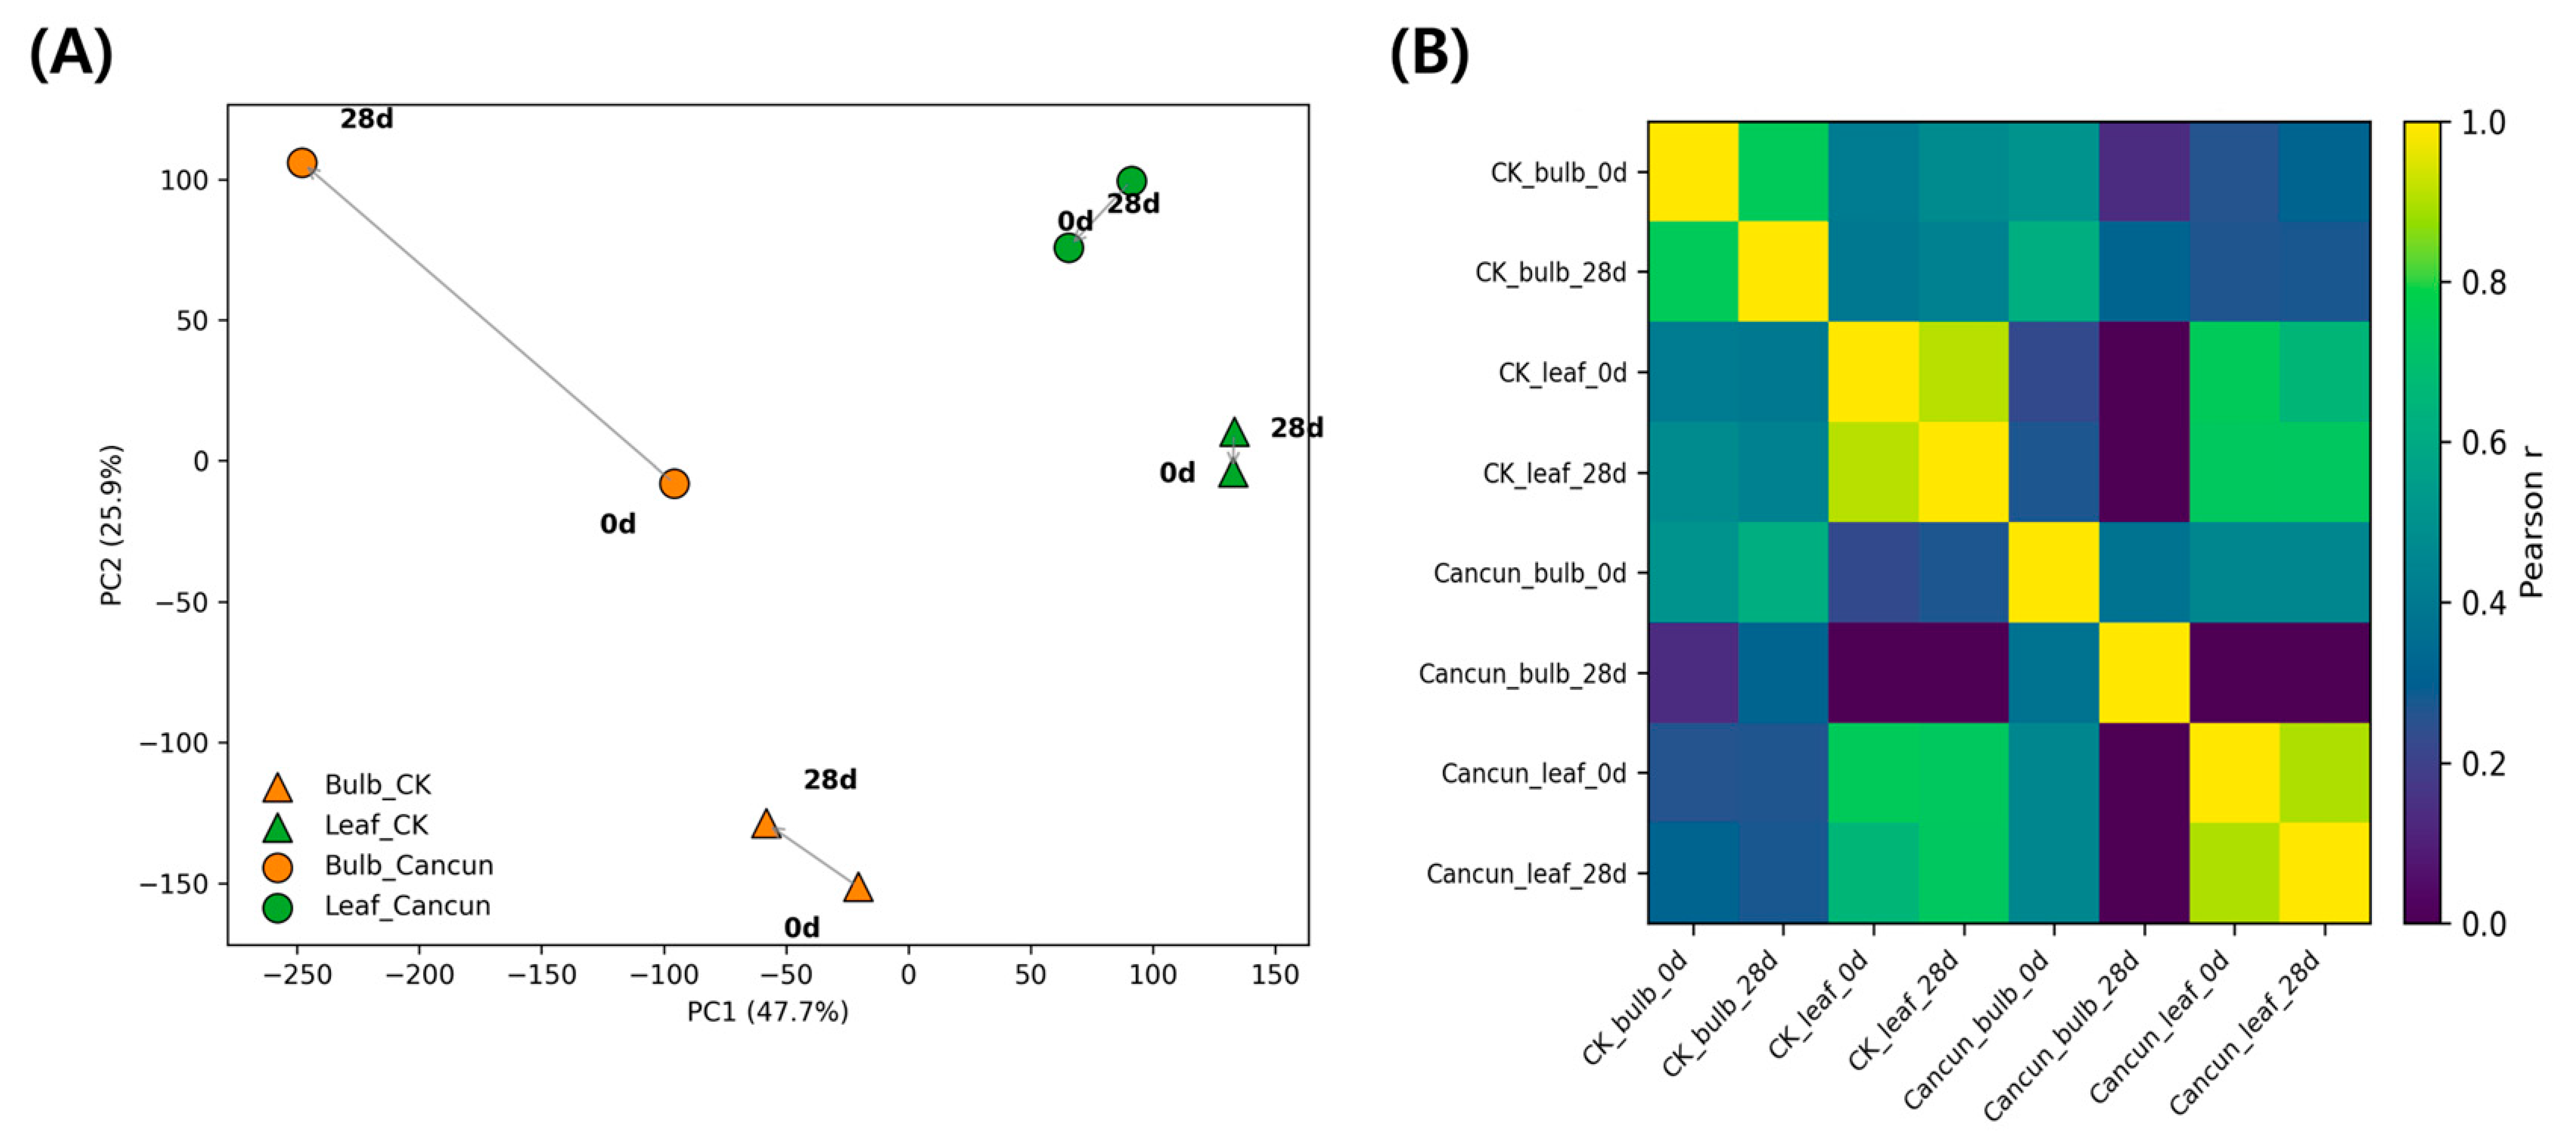
Figure 1: PCA of RNA-seq and sample-sample correlation heatmap. (A) Principal component analysis (PCA) of leaf (green) and bulb (orange) samples from Lilium cultivars ‘Cancun’ (●) and ‘Connecticut King’ (▲) at 0 and 28 days post-inoculation (dpi). Arrows connect the same cultivar × tissue pair from 0 → 28 dpi; labels indicate time points. PC1 and PC2 explain 47.7% and 25.9% of the variance, respectively. RNA-seq was performed with one library per condition; this is a single-replicate, descriptive ordination rather than an inferential analysis. (B) Pearson correlation matrix calculated from log2-transformed, DESeq-style normalized expression for the same eight samples shown in (A). Higher correlations (yellow) indicate similar global transcriptional profiles; lower correlations (purple/blue) indicate dissimilarity.
3.2 Functional Programs Modulated by CMV Infection Differ between Leaves and Bulbs
Across tissues, the exploratory GO/KEGG analyses suggested distinct functional signatures associated with CMV treatment (Fig. 2 and Fig. 3). In leaves, up-regulated DEGs were associated with GO terms related to carbohydrate catabolism and translation, including polysaccharide catabolic process, ribosome and structural constituent of ribosome, together with stress- and defense-related categories (defense response, response to biotic stimulus, oxidoreductase activity, heme binding). Concordantly, KEGG highlights in this dataset included JA/ET-linked regulators (transcription factor MYC2, jasmonate ZIM domain-containing protein) and primary/translation modules (beta-amylase, replication factor A1, small subunit ribosomal protein S7, histone H4, L-3-cyanoalanine/cysteine synthase, phosphoserine aminotransferase). By contrast, leaf down-regulated sets appeared enriched for cell-wall remodeling and transport together with mobile genetic element/replication features, with GO terms such as xyloglucan:xyloglucosyl transferase activity, cell wall, carbohydrate metabolic process, apoplast, RNA-directed DNA polymerase activity, RNA-templated DNA biosynthetic process, and DNA integration. KEGG mirrored these trends with decreases in xyloglucan:xyloglucosyl transferase (including TCH4), aquaporin PIP, 1-aminocyclopropane-1-carboxylate synthase, HSP20 family protein, EREBP-like factor, calcium-binding protein CML, and ribose-5-phosphate isomerase A.
In bulbs, the dominant up-regulated signal pointed to chromatin/replication and RNA metabolism. Top GO terms in the exploratory enrichment analysis comprised nucleosome, nucleosome assembly, RNA-directed DNA polymerase activity, RNA-templated DNA biosynthetic process, RNA-DNA hybrid ribonuclease activity, and RNA binding, together with polysaccharide catabolic process and beta-amylase activity. KEGG likewise featured histones (histone H3/H4), ribosomal protein L21e, S-adenosylmethionine synthetase, lipoxygenase, EREBP-like factor, pectate lyase, glycerol-3-phosphate acyltransferase, and chalcone synthase, suggesting chromatin-associated remodeling with concurrent lipid/phenylpropanoid and cell-wall-modifying activities in this dataset. Bulb down-regulated DEGs were comparatively broad, with GO terms capturing ATP/nucleotide binding and kinase/phosphorylation processes (ATP binding, nucleotide binding, protein kinase activity, protein phosphorylation), together with cell-wall/carbohydrate metabolism and apoptotic process. KEGG decreases included components of translation and ribosome biogenesis/trafficking (elongation factor 2, midasin), protein homeostasis (heat shock 70 kDa protein 1/6/8), DNA replication/repair (replication factor A1), regulatory proteins (plant MYB, transformation/transcription domain-associated protein), cell-wall enzymes (xyloglucan:xyloglucosyl transferase), specialized metabolism (indol-3-yl-methylglucosinolate hydroxylase), and ion transport (P-type Ca2+ transporter type 2C).
Together, these descriptive patterns suggest that, in this dataset, leaves tend to emphasize immune and hormone-related (JA/ET-linked) programs while dampening selected cell-wall and water-transport modules, whereas bulbs show a coordinated chromatin-replication/RNA-associated program with selective suppression of kinase/transport and protein homeostasis functions. Full GO/KEGG term names and FDR values are provided in Supplementary Table S1, and should be interpreted as exploratory summaries rather than formally tested effects.
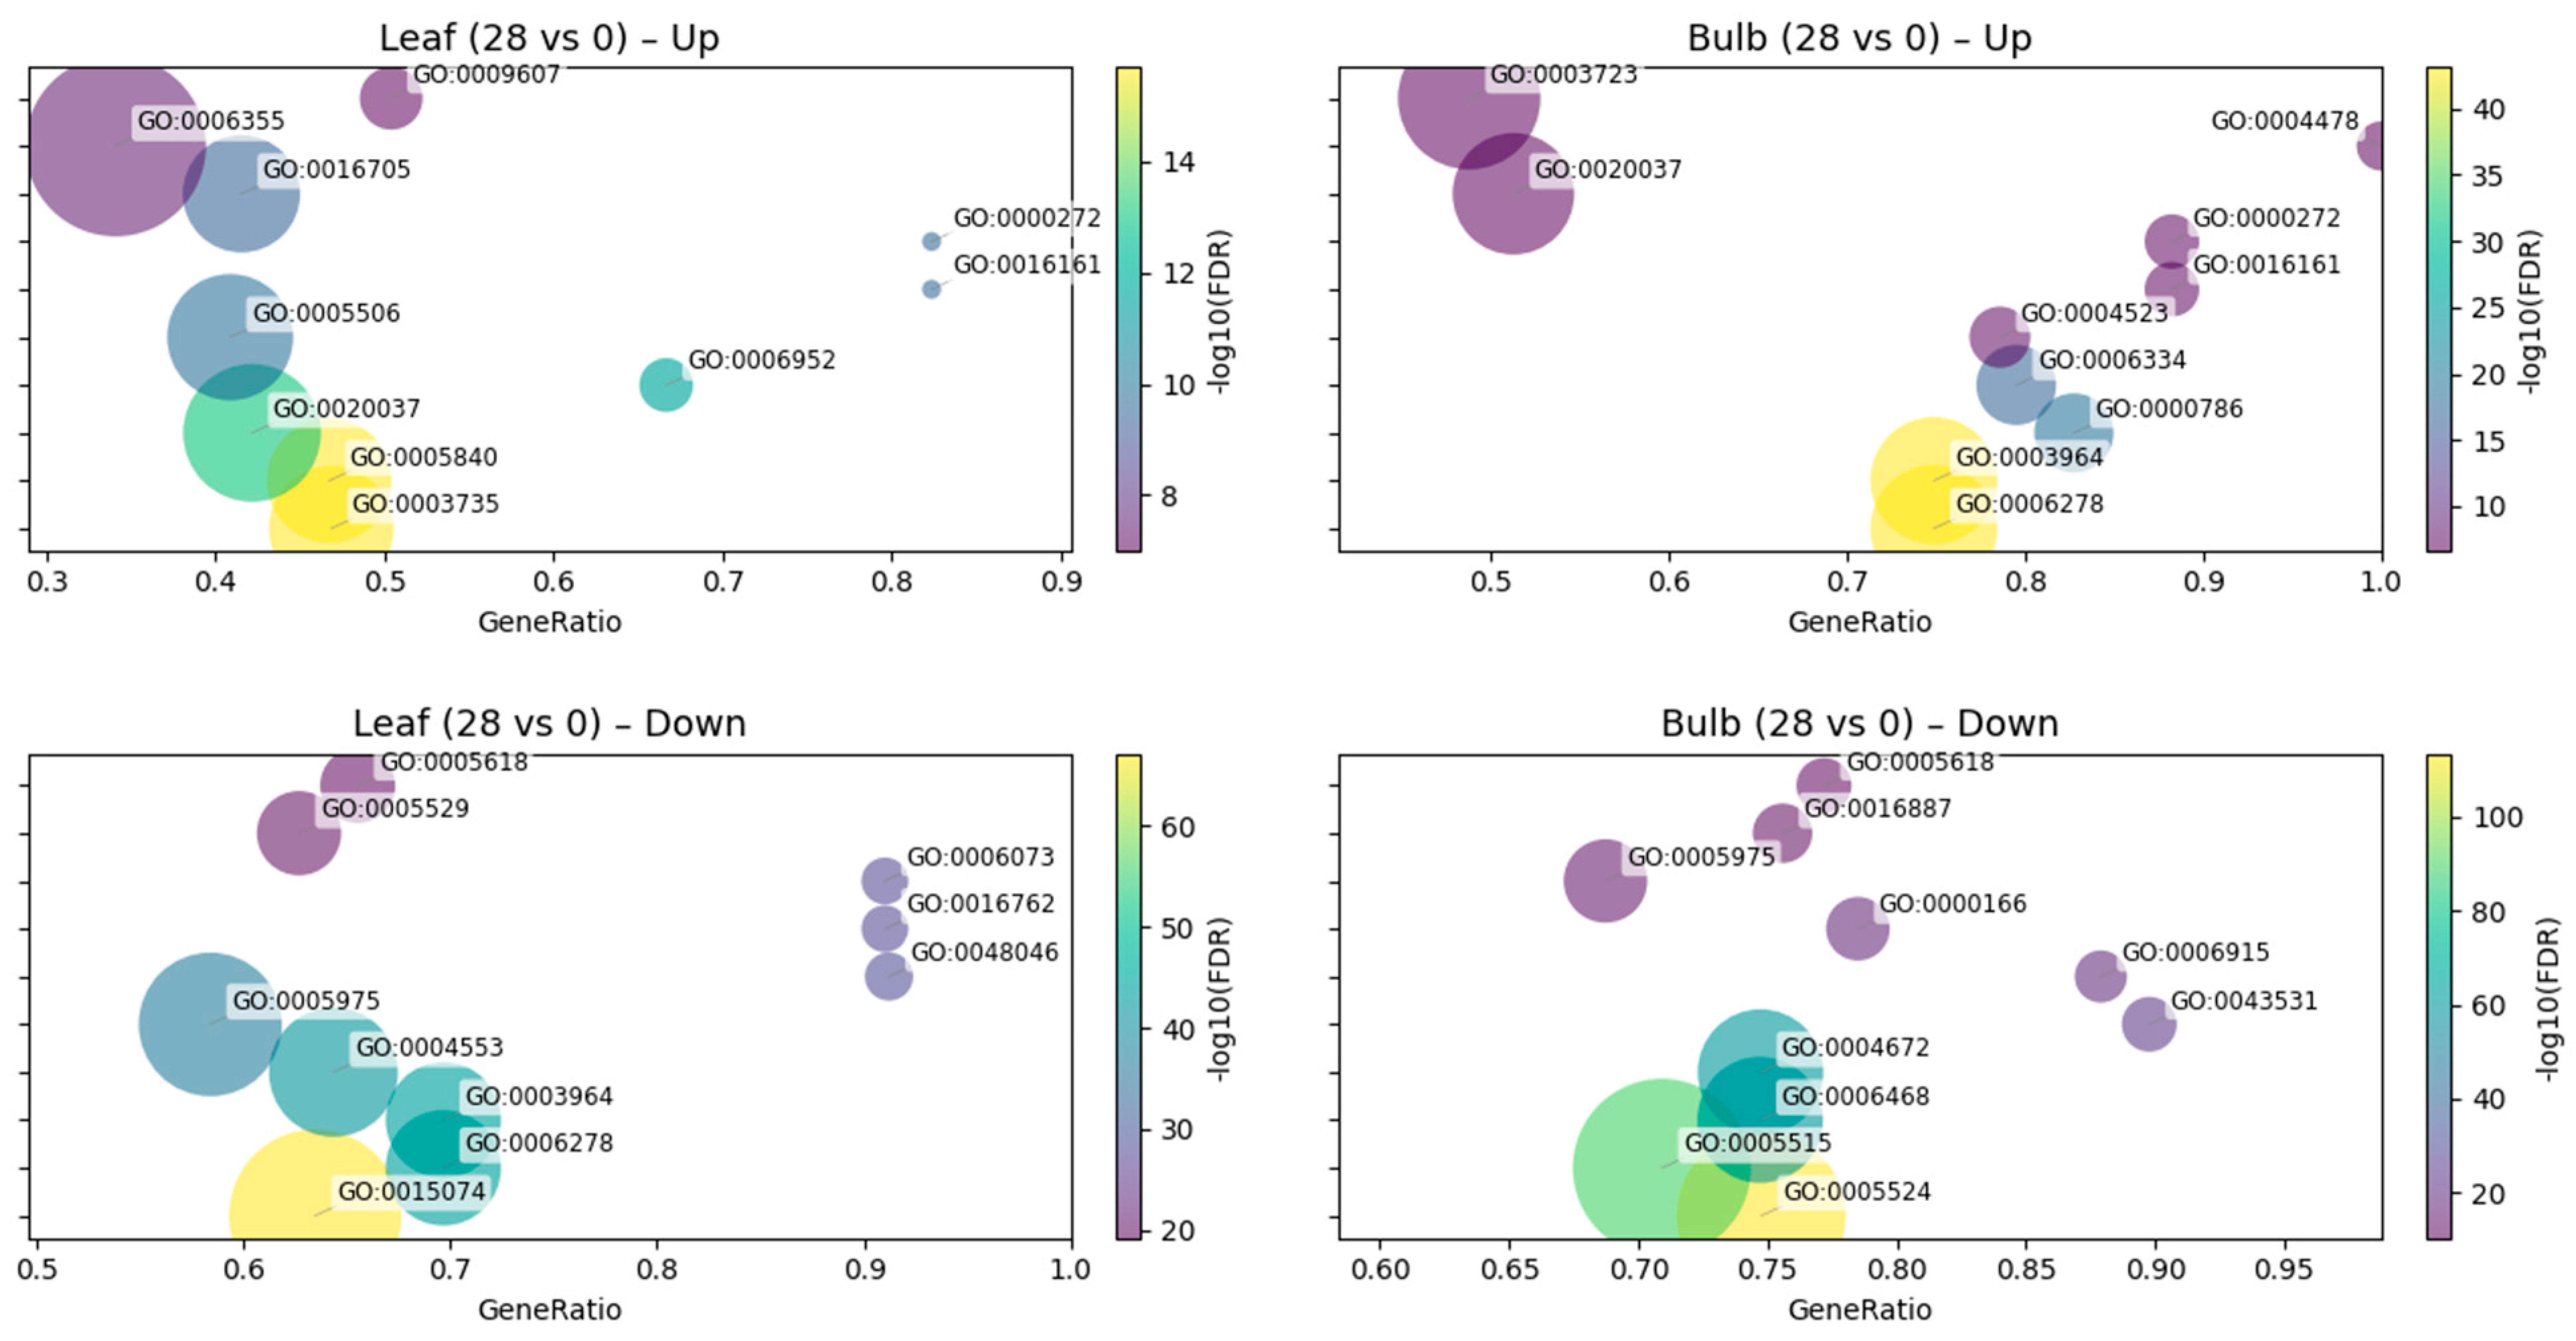
Figure 2: GO term enrichment of DEGs at 28 dpi versus 0 dpi. Dot-plots show over-represented Gene Ontology (GO) terms for the union of DEGs across cultivars within each tissue. The x-axis indicates GeneRatio (overlap/term_size). Bubble size encodes the number of overlapping DEGs, and color encodes the −log10(FDR) (BH corrected Fisher’s exact test). For readability, term labels are attached to bubbles (y-axis tick labels hidden) and automatically adjusted to avoid overlap; labels are clamped to remain inside axes. Up to 10 terms/panel are displayed (FDR ≤ 0.05, relaxed to 0.10 if fewer than 10 terms are available). Background: all genes with GO annotation in the dataset.
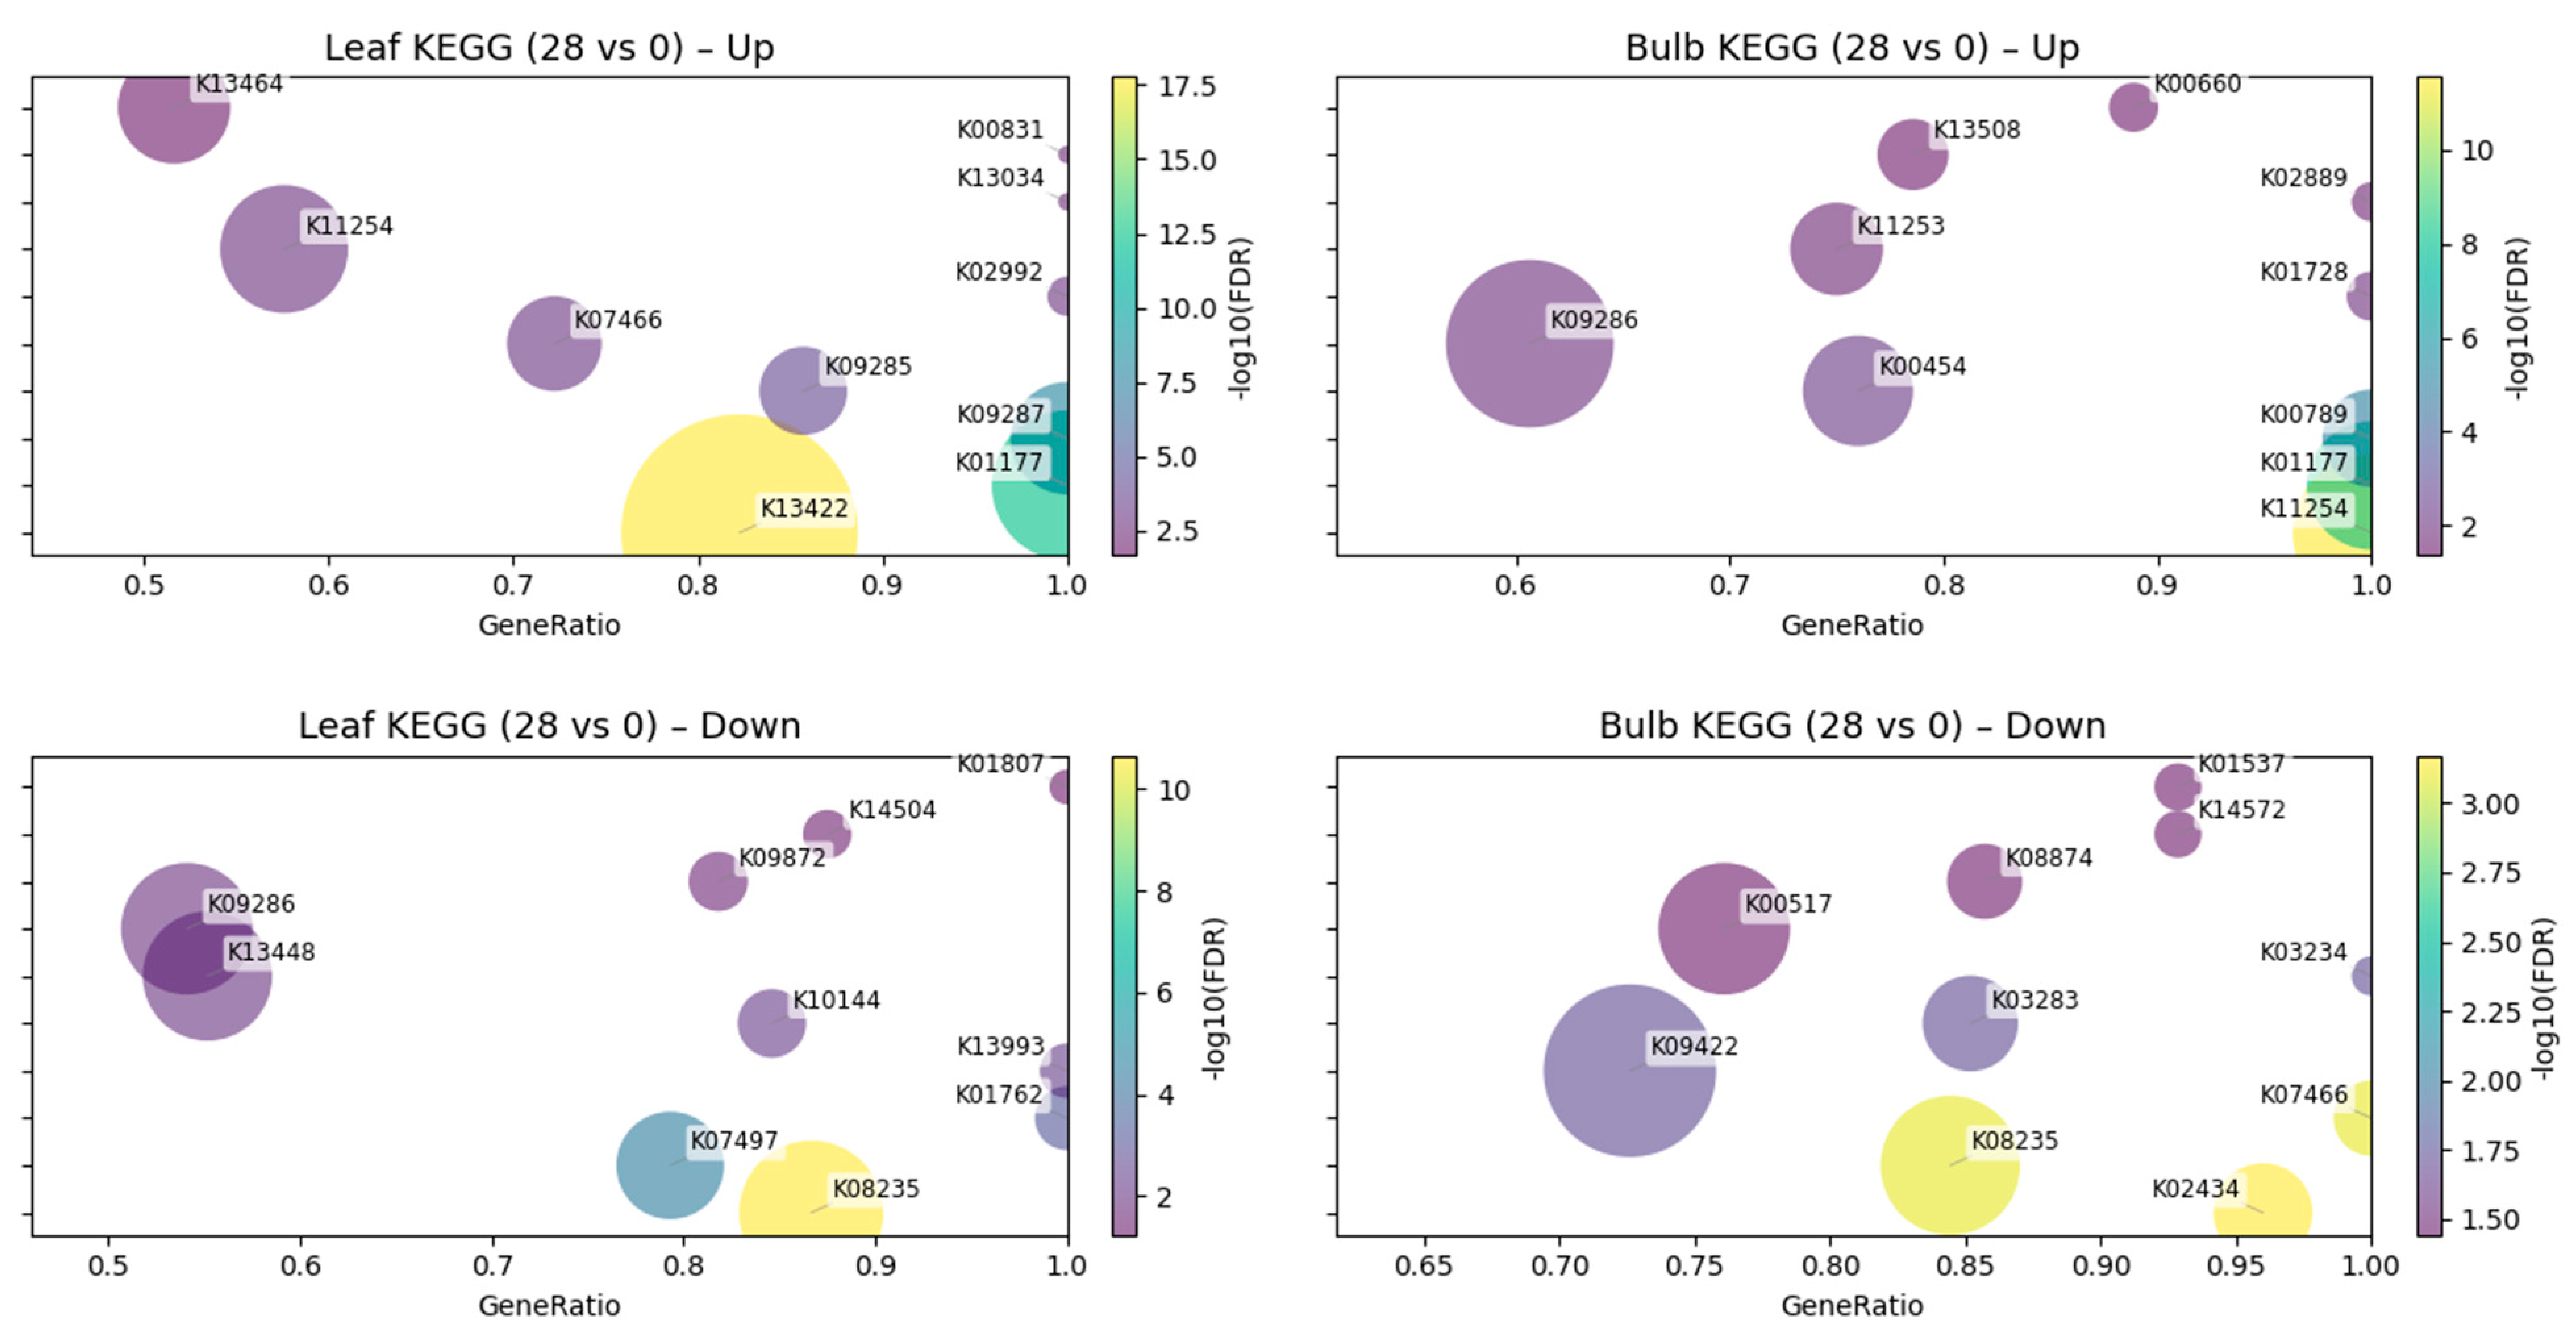
Figure 3: KEGG pathway enrichment of DEGs at 28 dpi versus 0 dpi. Dot-plots based on KEGG Orthology (KO) annotations. x-axis shows GeneRatio; bubble size indicates overlap; color denotes −log10(FDR). Up to 10 pathways/panel are shown (FDR ≤ 0.05, relaxed to 0.10 when KO coverage is sparse; minimum term size = 5). Labels are placed directly on bubbles and constrained to remain inside the plot area. Background: all genes with KO annotation.
3.3 Tissue-Divergent Response Modules Resolved by Marker Genes
To visualize gene-level trends underlying the global patterns, we compiled a focused panel (≤40 genes) spanning defense/SA, JA/ET signaling, WRKY/NAC transcription factors, ROS/antioxidant enzymes, and photosynthesis. Row-wise z-scaled log2 fold changes (28 dpi vs. 0 dpi) revealed a pronounced tissue bias in this dataset that was consistent across cultivars (Fig. 4).
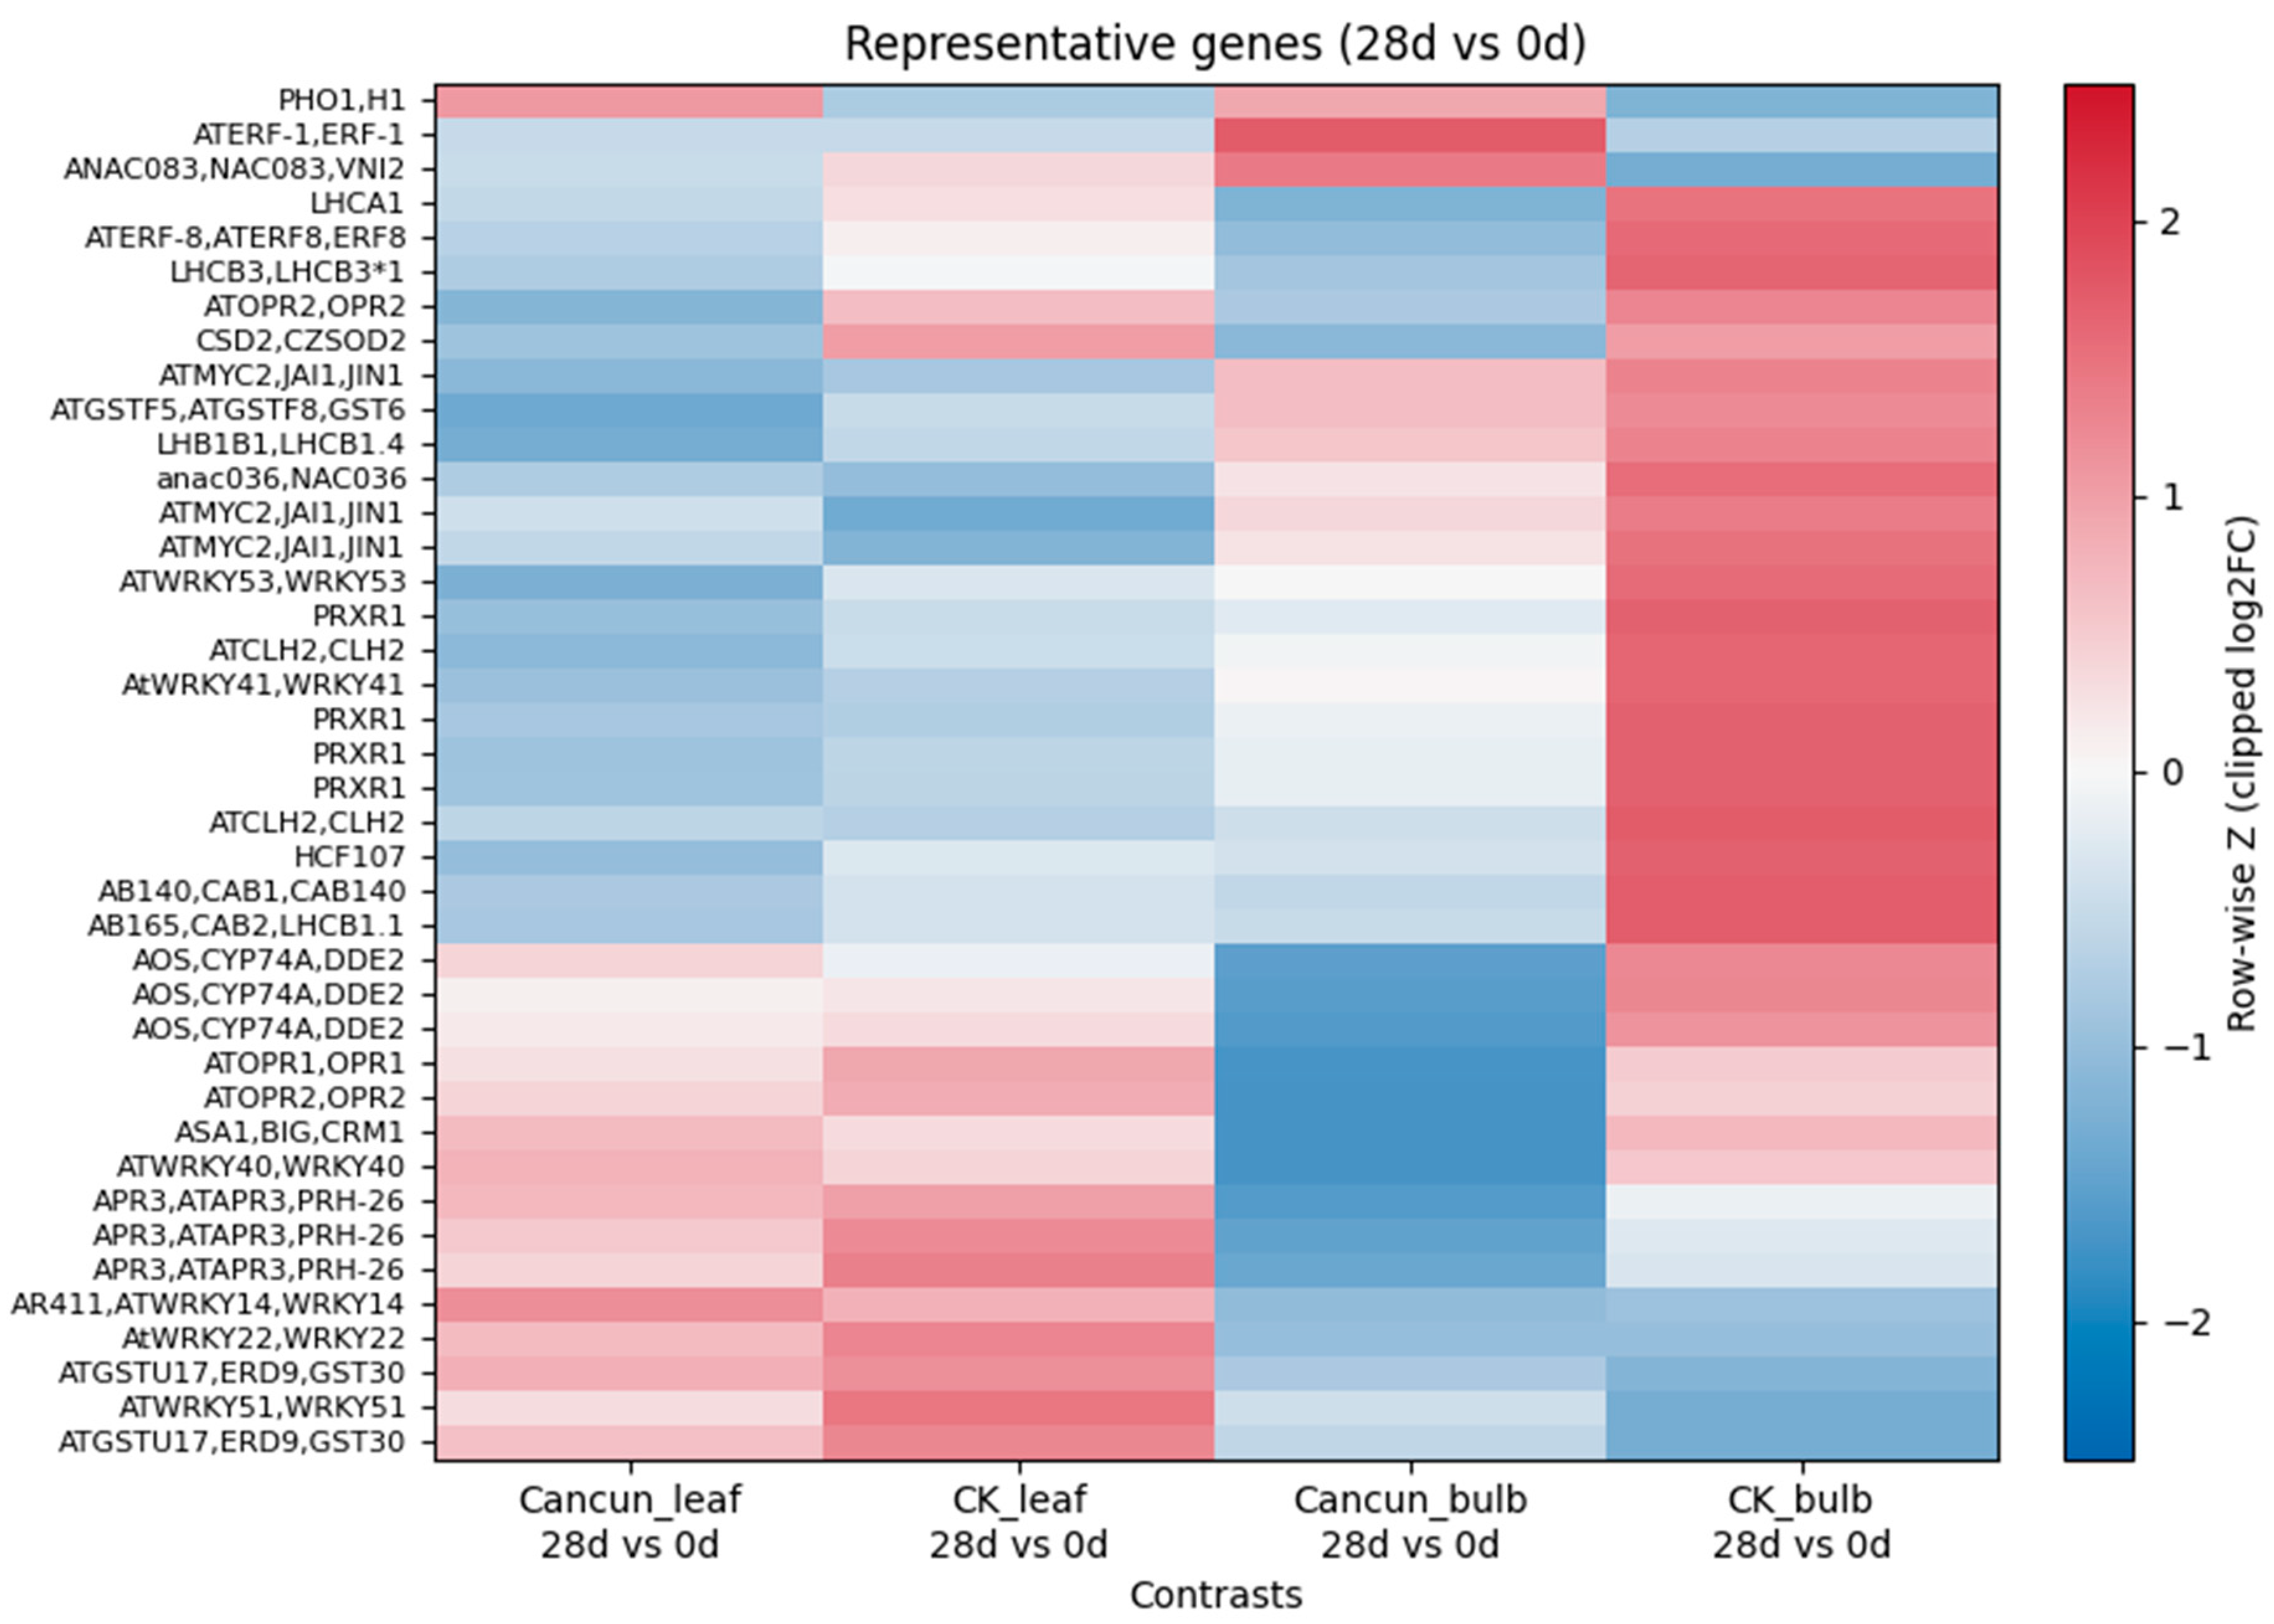
Figure 4: Heatmap of selected genes (≤40) spanning defense/SA, JA/ET, WRKY/NAC TFs, ROS/antioxidant, and photosynthesis categories. Each column shows the 28 vs. 0 dpi log2 fold change within a tissue and cultivar (Cancun_leaf, CK_leaf, Cancun_bulb, CK_bulb). Values were row-wise z-scaled and clipped to [−2.5, 2.5]; rows were hierarchically clustered (average linkage, Euclidean distance). Warmer colors indicate higher expression at 28 d relative to 0 d.
In leaves, both ‘Cancun’ and ‘Connecticut King’ showed preferential up-regulation of the JA pathway and a stress-response module. Canonical biosynthetic and signaling components (AOS/CYP74A/DDE2 and OPR1/OPR2) were among the genes with the largest positive fold changes, together with multiple WRKY family transcription factors (e.g., WRKY40/51/22/14) and glutathione-S-transferase-type detoxification markers (e.g., GSTU/ERD). These increases were accompanied by elevated expression of pathogenesis-related markers (PRXR-type entries) and auxin/tryptophan-pathway enzymes (ASA1/BIG/CRM1), a combination that is consistent with mobilization of immunity-linked metabolism in infected foliage within this dataset. The pattern appeared particularly pronounced in CK leaves, where the entire JA/WRKY/GST block shifted toward higher expression.
In the same marker panel, bulbs tended to show the opposite tendency. Compared with 0 dpi, 28 dpi bulbs displayed stronger induction of photosynthesis- and chloroplast-associated transcripts (LHCA/LHCB antenna proteins, CAB family, HCF107) together with chlorophyll-cycle and redox enzymes (CSD2) and several ethylene/NAC regulators (ERF1/ERF8 and NAC083/VNI2). MYC2-related entries were also elevated in bulbs, pointing to a remodeled hormone-associated network in this storage tissue in the context of CMV treatment.
The separation of “leaf-defense” versus “bulb-photosynthetic/organellar maintenance” signatures was most pronounced in CK, but the same directionality was evident in ‘Cancun’ as well. Overall, the gene-level map in Fig. 4 is consistent with the enrichment view: in this exploratory analysis, leaves tend to emphasize immune and JA/ET-linked programs whereas bulbs favor organellar and metabolic maintenance with selective hormone-transcription factor engagement (compare with the GO/KEGG summaries in Fig. 2 and Fig. 3).
3.4 Virus Accumulation Dynamics in Leaves Differ by Cultivar
Leaf DAS-ELISA revealed distinct CMV trajectories between the two cultivars (Fig. 5). In ‘Cancun’, mean leaf OD405 values rose monotonically across the series (0 → 14 → 24 dpi), indicating continuous accumulation through the sampling window. In ‘Connecticut King’ (CK), leaf titers displayed a transient maximum at 14 dpi followed by a decline at 24 dpi. These patterns were reproducible across the biological replicates measured (technical duplicates per replicate were concordant), and the trajectories are displayed for each cultivar as separate panels in Fig. 5.
To relate the serology to the transcriptome patterns, we compared the leaf ELISA trajectories with the 28 dpi expression profiles. In CK, the early rise and subsequent decline in ELISA signal are compatible with the stronger JA-/WRKY-associated expression pattern observed at 28 dpi in leaves (Fig. 4) and with the down-shift of wall/transport-related terms in the exploratory enrichment analyses (Fig. 2 and Fig. 3). Conversely, the progressive increase in ‘Cancun’ leaves is compatible with the comparatively weaker shift of these candidate defense markers by 28 dpi in the marker panel. Because RNA-seq was sampled only at 0 and 28 dpi and without replication, these correspondences should be viewed as hypothesis-generating rather than as evidence for time-resolved causality. In addition, ELISA was performed on leaves only, so any inferences about sink/bulb behavior are drawn from the descriptive RNA-seq results rather than from serology.
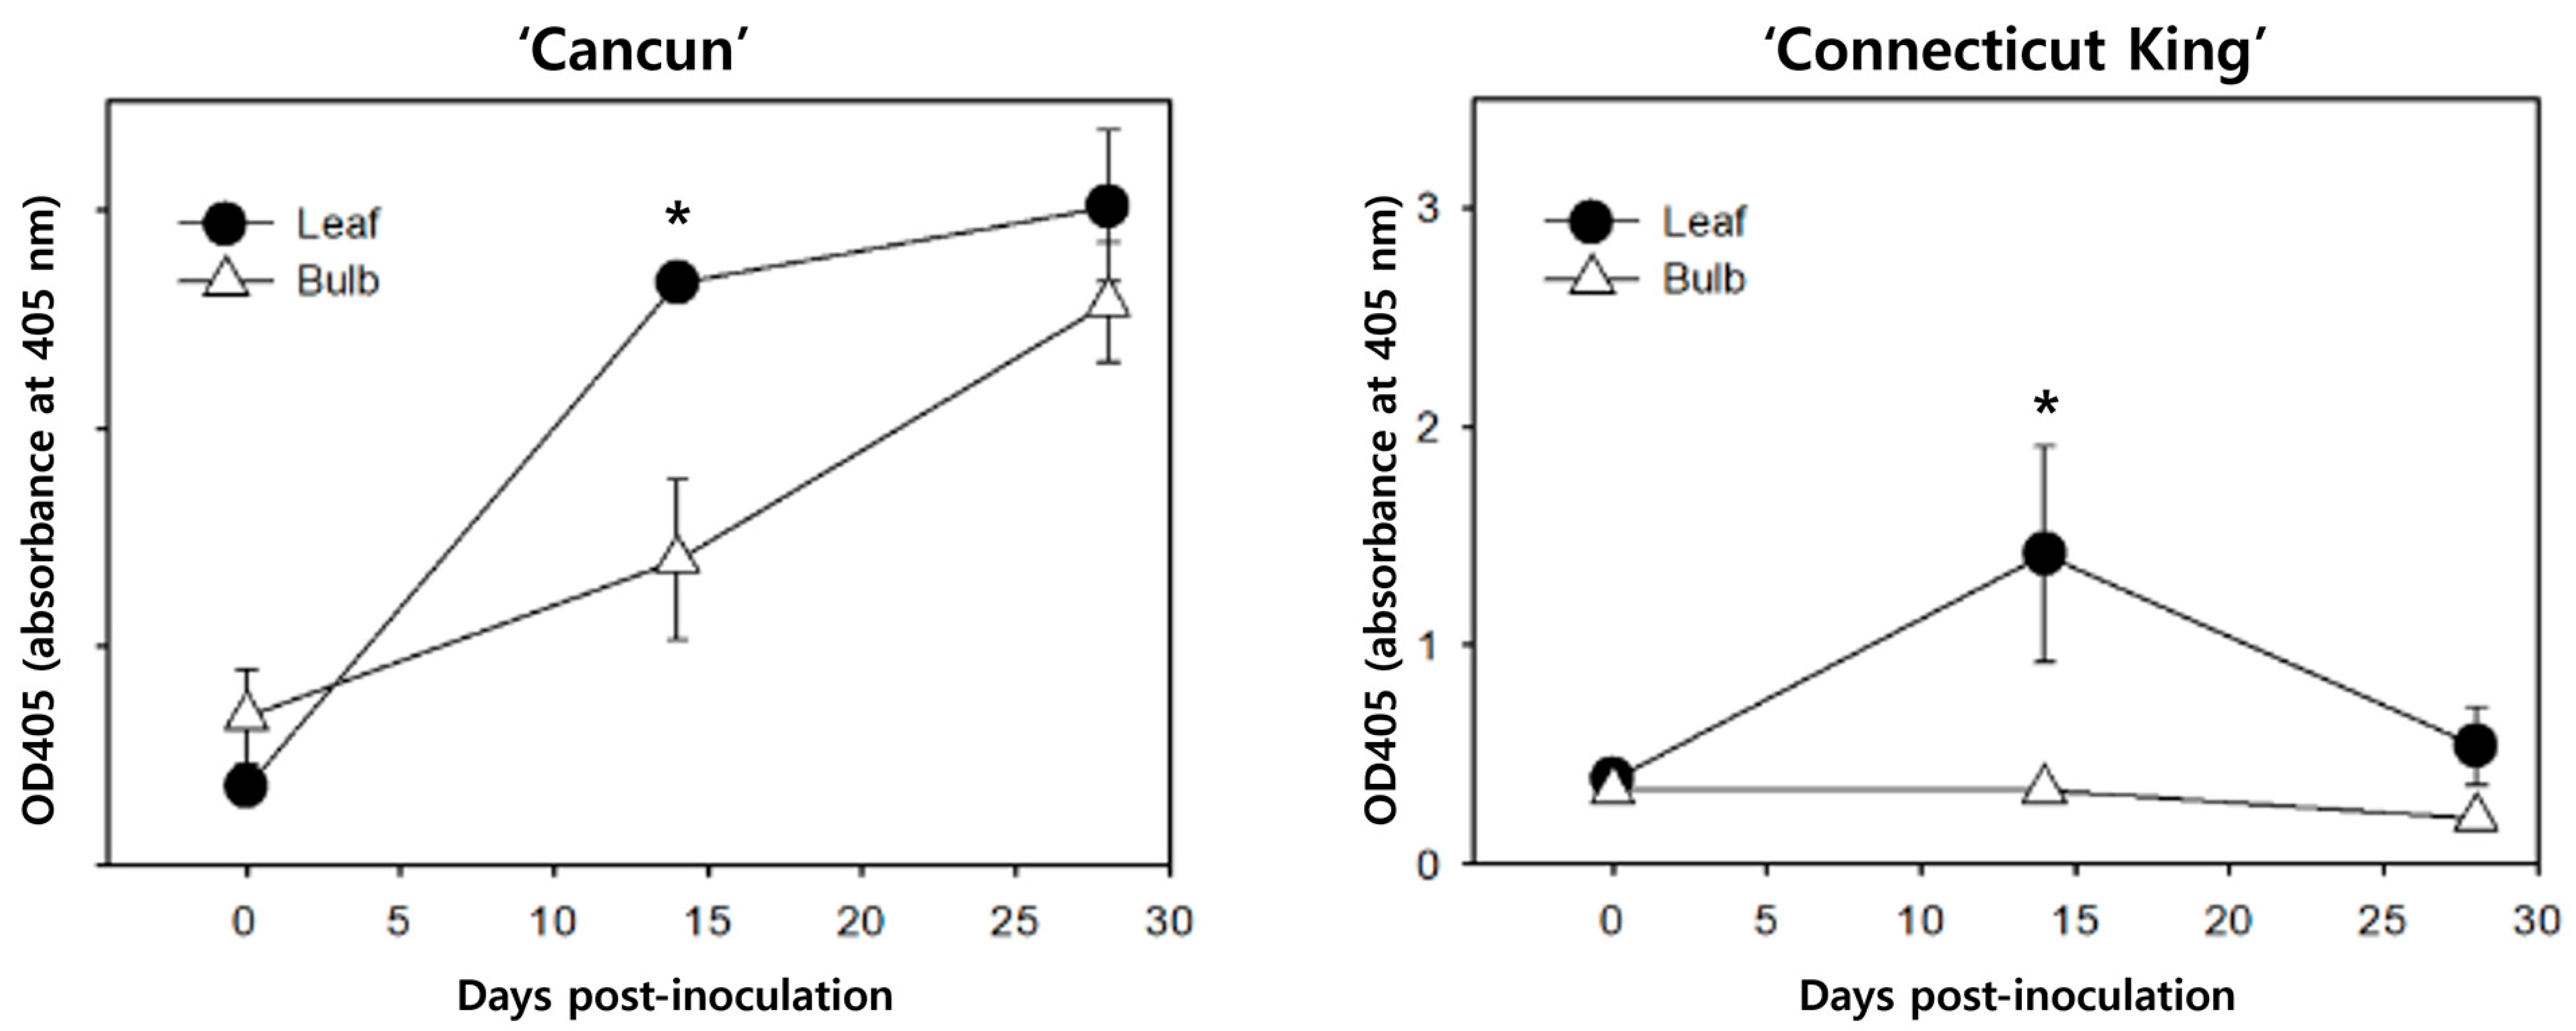
Figure 5: Cucumber mosaic virus accumulation in leaves and bulbs of Lilium cultivars ‘Cancun’ (left) and ‘Connecticut King’ (right) measured by DAS-ELISA at 0, 14, and 24 days post-inoculation (dpi). Symbols represent mean absorbance at 405 nm (OD405) ± SEM of biological replicates, each measured in technical duplicate. Asterisks denote p < 0.05 from two-way ANOVA (factors: organ, time) with Tukey’s HSD on simple effects when the interaction was significant (per cultivar).
4.1 Global Structure of the Transcriptome
In our dataset, tissue identity was the principal determinant of variance: PC1 (47.7%) separated leaf and bulb samples cleanly in both cultivars, and the infection trajectories (0 → 28 dpi) were within-tissue shifts rather than cross-tissue jumps (Fig. 1A,B). Thus, at 28 dpi the CMV treatment effect was superimposed on, but did not eclipse, the strong baseline differences between a photosynthetic source tissue and a storage sink. This global pattern motivates our tissue-resolved analyses and frames the later enrichment and marker-based summaries.
Placing these ordinations in context, plant viruses must traverse cell-to-cell interfaces and vasculature to achieve systemic infection, and their success is constrained by tissue-specific barriers [25,26]. Our observation that infection produced consistent but tissue-anchored shifts is therefore consistent with a scenario in which pre-existing tissue programs shape infection trajectories and systemic progression remains contingent on movement across source-sink interfaces, rather than overriding those programs.
The emphasis on bulbs as a distinct cluster is biologically and economically relevant for lilies. Bulbs are the vegetatively propagated material, and virus persistence in stored bulbs is a recognized driver of carry-over across production cycles; practical management even prioritizes bulb testing during storage as more reliable than leaf testing at floral stages. These industry observations reinforce why separating leaf and bulb transcriptomes is useful for interpreting disease risk in Lilium [5,27].
In addition, most molecular CMV studies in lily have profiled leaves and identified resistance regulators (e.g., LrNAC35, LreEF1A4) [13,16], but have not jointly contrasted source vs. sink programs within one experiment. Our ordinations therefore provide a tissue-comparative framework for lilies by showing that CMV-associated shifts ride on robust tissue identity, motivating the tissue-specific enrichment and marker analyses that follow. At the same time, because only one RNA-seq library was available per condition, these global patterns should be viewed as descriptive and hypothesis-generating, rather than as statistically validated effects from a replicated design.
4.2 Functional Programs That Diverge between Leaves and Bulbs
In leaves, CMV treatment was associated with up-regulation of defense- and hormone-linked functions together with translation/oxidoreductase terms, and with down-regulation of cell-wall remodeling and water/transport categories (Supplementary Table S1 and Fig. 2A,C). The KEGG panels highlight induction of JA-related components (e.g., MYC/JAZ context) and decreases in xyloglucan modifiers and aquaporins (Fig. 3, Leaf Up/Down). These descriptive patterns are in line with current views that jasmonate signaling can contribute to antiviral outcomes and potentiate silencing/defense layers in infected leaves, and they are compatible with the idea that restricting wall-loosening and membrane transport may constrain local cell-to-cell spread toward the vasculature [28,29]. Recent syntheses on hormone-virus crosstalk and movement through plasmodesmata (PD) are consistent with both points [30,31].
In bulbs, the dominant Up sets in the exploratory enrichment analysis involved nucleosome/chromatin, RNA metabolism, polysaccharide catabolism (β-amylase), and chloroplast/assembly factors, whereas Down sets were broader, touching ATP/kinase functions and elements of translation/proteostasis (Fig. 2B,D; Fig. 3, Bulb Up/Down). Induction of β-amylase and carbohydrate-use modules alongside maintenance of photosynthetic machinery is consistent with sink-side carbon reallocation under stress, where starch turnover supports metabolic homeostasis rather than a full-scale immune escalation [32]. Work on stress/sugar signaling shows that amylases often rise under carbon draw or starvation-like cues, providing a mechanistic link to the bulb enrichment patterns observed here [33,34].
Taken together, the enrichment contrasts in this dataset are consistent with a source-sink split: leaves tend to prioritize immune/JA programs and temper wall/transport processes that would favor spread, whereas bulbs appear to emphasize metabolic maintenance and carbon remobilization with limited up-shift of canonical defense machinery. The proximity of these trends to established mechanisms, WRKY/JA-centered reprogramming in antiviral defense and PD/cell-wall control of movement lends plausibility to our interpretation of the tissue-resolved responses [35,36], but these inferences remain provisional given the non-replicated design.
4.3 Marker-Guided Tissue Responses and Viral Load Dynamics
In the marker panel (Fig. 4), leaves of both cultivars showed coordinated induction of JA-pathway enzymes (AOS/OPR1/2, CYP74A/DDE2) and multiple WRKY transcription factors (e.g., WRKY40/41/51/53), together with GST-type detox markers. Bulbs tended to show the inverse tendency: higher photosynthesis/assembly signals (LHCB/CAB, HCF107) and β-amylase, with comparatively weak induction of canonical defense markers. These tissue-specific signatures are compatible with the ELISA curves (Fig. 5): ‘Connecticut King’ (CK) exhibited a transient leaf peak at 14 dpi followed by decline, whereas ‘Cancun’ showed progressive increases in leaves. Bulb titers were not measured by ELISA; bulb-related inferences are drawn solely from the transcriptome patterns (Fig. 2, Fig. 3 and Fig. 4).
The leaf program aligns with current views that jasmonate signaling can contribute to antiviral defense and potentiate RNA-silencing layers, while WRKY factors often act as positive regulators of antiviral responses. These mechanisms provide a plausible basis for the containment-like pattern observed in CK leaves, but they are not directly demonstrated here [28,29,37]. The concurrent down-trend of wall/transport terms (Fig. 2 and Fig. 3) complements this working model, given that cell-to-cell and systemic movement rely on plasmodesmata and wall remodeling; restricting those processes could reduce spread from source leaves into the vasculature [31,38]. In CMV specifically, the movement protein interacts with cell-wall apoplastic factors such as ascorbate oxidase, underscoring why wall-linked changes in leaves could influence systemic delivery [39].
On the bulb side, enrichment of β-amylase and chloroplast/antenna assembly factors suggests carbon remobilization with maintenance of photosynthetic capacity rather than broad immune escalation. β-amylase up-regulation under stress/carbon draw is well documented in plants, and together with LHCB/CAB it points to a tolerance/maintenance mode that may help preserve storage-tissue function during infection [40,41]. The observation that CK shows declining leaf titers together with a maintenance-skewed bulb program is consistent with limited systemic establishment in our working model, although bulb titers were not directly measured and causality cannot be inferred from these data alone.
Practically, this exploratory marker-titer concordance nominates leaf readouts (WRKY40/41/51/53; AOS/OPR1/2; CYP74A/DDE2) as candidate indicators of early containment capacity, and bulb readouts (β-amylase; LHCB/CAB/HCF107) as candidate indicators of sink-side maintenance. However, these markers should be regarded as hypotheses generated from a non-replicated dataset; their predictive value and robustness will require validation by qPCR and/or replicated RNA-seq across additional cultivars, timepoints, and environmental contexts before practical deployment. Given the clonal propagation of lilies via bulbs and the risk of carry-over of infected planting stock, the tissue-aware marker sets proposed here may nevertheless provide a useful starting point for designing such validation studies [5].
4.4 Tissue-Specific Implications for Breeding and Stock Management
Within the limitations of this dataset, our results suggest two potential levers for breeding and stock management. First, leaves (source tissue) tend to show coordinated induction of JA/WRKY markers with concurrent dampening of wall/transport functions (Fig. 2, Fig. 3 and Fig. 4). In ‘Connecticut King’, this pattern coincides with a transient leaf titer peak followed by decline (Fig. 5), which is compatible with the idea that earlier or stronger leaf responses could contribute to partial containment. For breeding and screening, a compact leaf panel containing WRKY40/41/51/53 and JA-pathway enzymes (AOS/OPR1/2, CYP74A/DDE2) emerges from this study as a promising candidate readout of containment capacity in challenge tests around 7–14 dpi, but its utility remains to be established empirically.
Second, bulbs (sink tissue) emphasize photosynthetic/assembly factors (LHCB/CAB, HCF107) and β-amylase rather than broad immune escalation (Fig. 2, Fig. 3 and Fig. 4). Given that lilies are propagated via bulbs, limiting sink establishment is critical for preventing carry-over. For stock management and quality control, our results support the concept that storage-phase ELISA on bulbs could in principle be paired with a small bulb expression panel (LHCB/CAB/HCF107; β-amylase) to flag lots that maintain tissue function while keeping virus below actionable thresholds. At present, however, this remains a working hypothesis; testing such a scheme would require replicated trials, defined threshold criteria, and evaluation across multiple genetic backgrounds.
Taken together, the tissue split in this exploratory study offers a simple conceptual framework: prioritize genotypes that are able to mount an early leaf JA/WRKY shift and that show limited sink-side establishment under infection pressure, and then ask whether these tendencies are reproducible across environments and genotypes. In practice, favoring CK-like profiles characterized by leaf containment and bulb protection over ‘Cancun’-like patterns of progressive accumulation is an attractive idea, but it still needs to be validated in dedicated breeding and stock-management trials.
Finally, adding early-timepoint qPCR checks on the leaf and bulb marker sets would be an important step toward substantiating the tissue-specific readouts proposed here, and pairing selection with routine bulb ELISA during storage should help to test whether these markers track virus dynamics reliably in real-world propagation pipelines. This recommendation is consistent with current practice in lilies, where post-storage bulb testing is widely considered more reliable than flowering-stage leaf tests, and where serological or RT-PCR diagnostics are standard for stock hygiene [5,17]. In this sense, our study provides a descriptive, tissue-resolved transcriptomic framework that can be used to generate and refine marker candidates for future replicated validation.
Across two commercial lilies challenged with CMV, the transcriptome in this legacy dataset separated first by tissue and then by infection state: in leaves, CMV treatment was associated with a shift toward a JA/WRKY-biased defense program and reduced expression of wall/transport-related functions, whereas bulbs emphasized photosynthetic/organellar maintenance and β-amylase-linked carbon use. These tissue-specific tendencies were qualitatively similar across cultivars and were compatible with the virological readouts: ‘Connecticut King’ showed a transient leaf titer peak followed by decline, while ‘Cancun’ accumulated progressively in leaves. Agreement among ordination, exploratory enrichment patterns, marker behavior, and ELISA kinetics is consistent with a simple working model in which stronger or earlier leaf responses may contribute to partial containment and reduced sink-side establishment, although cause-effect relationships cannot be inferred from these data.
From a practical perspective, our findings suggest potential levers for breeding and stock hygiene in Lilium, while remaining provisional. The leaf marker set highlighted here (WRKY40/41/51/53; AOS/OPR1/2; CYP74A/DDE2) and bulb-associated candidates (β-amylase; LHCB/CAB/HCF107) emerge as promising indicators of containment capacity and sink maintenance that warrant further testing, for example by qPCR and/or replicated RNA-seq in additional cultivars and at earlier timepoints (e.g., 7–14 dpi). In the longer term, such markers could be combined with storage-phase bulb testing (ELISA or RT-PCR) as part of tissue-aware quality control, with the goal of favoring CK-like profiles (leaf containment with limited sink establishment) over patterns resembling ‘Cancun’. At present, however, these applications should be viewed as hypotheses to be evaluated in dedicated validation trials. Overall, our tissue-resolved CMV transcriptome analysis provides a descriptive framework and a set of candidate markers that can guide the design of future replicated studies aimed at improving selection and stock hygiene in lily production.
Acknowledgement:
Funding Statement: This work was carried out with the support of “Cooperative Research Program for Agriculture Science and Technology Development (Project No. PJ00926803)” Rural Development Administration, Republic of Korea.
Author Contributions: The authors confirm contribution to the paper as follows: Conceptualization, Yun-Im Kang; methodology, Yun-Im Kang; software, Ki-Byung Lim and Yun-Jae Ahn; validation, Yun-Jae Ahn; formal analysis, Yun-Im Kang; investigation, Yun-Im Kang; resources, Youn Jung Choi, Su Young Lee and Young-Ran Lee; data curation, Youn Jung Choi, Su Young Lee and Young-Ran Lee; writing—original draft preparation, Yun-Im Kang; writing—review and editing, Yun-Im Kang and Yun-Jae Ahn; visualization, Yun-Im Kang and Yun-Jae Ahn; supervision, Yun-Jae Ahn; project administration, Youn Jung Choi, Su Young Lee and Young-Ran Lee. All authors reviewed and approved the final version of the manuscript.
Availability of Data and Materials: The data that support the findings of this study are available from the corresponding author, Yun-Jae Ahn, upon reasonable request.
Ethics Approval: Not applicable.
Conflicts of Interest: The authors declare no conflicts of interest.
Supplementary Materials: The supplementary material is available online at https://www.techscience.com/doi/10.32604/phyton.2026.073138/s1.
Abbreviations
| AOS | Allene oxide synthase (JA biosynthesis) |
| BH | Benjamini-Hochberg (FDR correction) |
| CAB/LHCB | Chlorophyll a/b-binding proteins (light-harvesting antenna) |
| CK | Connecticut King (cultivar) |
| CMV | Cucumber mosaic virus |
| DAS-ELISA | Double-antibody sandwich enzyme-linked immunosorbent assay |
| DEG | Differentially expressed gene |
| dpi | Days post-inoculation |
| FDR | False discovery rate |
| GO | Gene Ontology |
| JA | Jasmonic acid (signaling pathway) |
| KEGG | Kyoto Encyclopedia of Genes and Genomes |
| padj | Adjusted p-value (multiple-testing corrected) |
| PCA | Principal component analysis |
| PRX/PRXR | Peroxidase/peroxidase-related marker |
| qPCR | Quantitative polymerase chain reaction |
| ROS | Reactive oxygen species |
| WRKY/NAC/ERF | Plant transcription factor families |
References
1. Shi J , Yu L , Song B . Proteomics analysis of Xiangcaoliusuobingmi-treated Capsicum annuum L. infected with Cucumber mosaic virus. Pestic Biochem Physiol. 2018; 149: 113– 22. doi:10.1016/j.pestbp.2018.06.008. [Google Scholar] [CrossRef]
2. Zhang L , Hanada K , Palukaitis P . Mapping local and systemic symptom determinants of cucumber mosaic cucumovirus in tobacco. J Gen Virol. 1994; 75( 11): 3185– 91. doi:10.1099/0022-1317-75-11-3185. [Google Scholar] [CrossRef]
3. Li N , Yu C , Yin Y , Gao S , Wang F , Jiao C , et al. Pepper crop improvement against cucumber mosaic virus (CMV): a review. Front Plant Sci. 2020; 11: 598798. doi:10.3389/fpls.2020.598798. [Google Scholar] [CrossRef]
4. Choi H , Jo Y , Lian S , Jo KM , Chu H , Yoon JY , et al. Comparative analysis of Chrysanthemum transcriptome in response to three RNA viruses: cucumber mosaic virus, Tomato spotted wilt virus and Potato virus X. Plant Mol Biol. 2015; 88( 3): 233– 48. doi:10.1007/s11103-015-0317-y. [Google Scholar] [CrossRef]
5. Gong H , Dusengemungu L , Lv P , Igiraneza C . Advancements in lily viruses management: challenges and solutions in elimination and detection. Horticulturae. 2023; 9( 7): 790. doi:10.3390/horticulturae9070790. [Google Scholar] [CrossRef]
6. Madhavan S , Balasubramanian V , Selvarajan R . Viruses infecting bulbous ornamental plants and their diagnosis and management. In: Virus diseases of ornamental plants: characterization, identification, diagnosis and management. Singapore: Springer; 2021. p. 277– 99. doi:10.1007/978-981-16-3919-7_15. [Google Scholar] [CrossRef]
7. Chen L , Guo C , Yan C , Sun R , Li Y . Genetic diversity and phylogenetic characteristics of viruses in lily plants in Beijing. Front Microbiol. 2023; 14: 1127235. doi:10.3389/fmicb.2023.1127235. [Google Scholar] [CrossRef]
8. Kalapos B , Juhász C , Balogh E , Kocsy G , Tóbiás I , Gullner G . Transcriptome profiling of pepper leaves by RNA-Seq during an incompatible and a compatible pepper-tobamovirus interaction. Sci Rep. 2021; 11: 20680. doi:10.1038/s41598-021-00002-5. [Google Scholar] [CrossRef]
9. Sekine KT , Kawakami S , Shu H , Kubota M , Ichinose Y , Shah J , et al. High Level Expression of a Virus Resistance Gene, RCY1, Confers Extreme Resistance to Cucumber mosaic virus in Arabidopsis thaliana. Mol Plant Microbe Interact. 2008; 21( 11): 1398– 407. doi:10.1094/mpmi-21-11-1398. [Google Scholar] [CrossRef]
10. Keima T , Hagiwara-Komoda Y , Hashimoto M , Neriya Y , Koinuma H , Iwabuchi N , et al. Deficiency of the eIF4E isoform nCBP limits the cell-to-cell movement of a plant virus encoding triple-gene-block proteins in Arabidopsis thaliana. Sci Rep. 2017; 7: 39678. doi:10.1038/srep39678. [Google Scholar] [CrossRef]
11. Liu D , Cheng Y , Gong M , Zhao Q , Jiang C , Cheng L , et al. Comparative transcriptome analysis reveals differential gene expression in resistant and susceptible tobacco cultivars in response to infection by cucumber mosaic virus. Crop J. 2019; 7( 3): 307– 21. doi:10.1016/j.cj.2018.11.008. [Google Scholar] [CrossRef]
12. Xu Q , Shen L , Jin L , Wang M , Chang F , Guo Z . Comparative transcriptome analysis of CMV or 2b-deficient CMV-infected dcl2dcl4 reveals the effects of viral infection on symptom induction in Arabidopsis thaliana. Viruses. 2022; 14( 7): 1582. doi:10.3390/v14071582. [Google Scholar] [CrossRef]
13. Sun D , Zhang X , Zhang Q , Ji X , Jia Y , Wang H , et al. Comparative transcriptome profiling uncovers a Lilium regale NAC transcription factor, LrNAC35, contributing to defence response against cucumber mosaic virus and tobacco mosaic virus. Mol Plant Pathol. 2019; 20( 12): 1662– 81. doi:10.1111/mpp.12868. [Google Scholar] [CrossRef]
14. Zhang J , Wang T , Jia Z , Jia X , Liu Y , Xuan J , et al. Transcriptome analysis reveals a comprehensive virus resistance response mechanism in pecan infected by a novel badnavirus pecan virus. Int J Mol Sci. 2022; 23( 21): 13576. doi:10.3390/ijms232113576. [Google Scholar] [CrossRef]
15. Xu L , Ming J . Development of a multiplex RT-PCR assay for simultaneous detection of Lily symptomless virus, Lily mottle virus, Cucumber mosaic virus, and Plantago asiatica mosaic virus in Lilies. Virol J. 2022; 19( 1): 219. doi:10.1186/s12985-022-01947-3. [Google Scholar] [CrossRef]
16. Sun D , Ji X , Jia Y , Huo D , Si S , Zeng L , et al. LreEF1A4, a translation elongation factor from Lilium regale, is pivotal for cucumber mosaic virus and tobacco rattle virus infections and tolerance to salt and drought. Int J Mol Sci. 2020; 21( 6): 2083. doi:10.3390/ijms21062083. [Google Scholar] [CrossRef]
17. Niimi Y , Han DS , Mori S , Kobayashi H . Detection of Cucumber mosaic virus, lily symptomless virus and lily mottle virus in Lilium species by RT-PCR technique. Sci Hortic. 2003; 97( 1): 57– 63. doi:10.1016/S0304-4238(02)00125-5. [Google Scholar] [CrossRef]
18. Cox MP , Peterson DA , Biggs PJ . SolexaQA: at-a-glance quality assessment of Illumina second-generation sequencing data. BMC Bioinform. 2010; 11( 1): 485. doi:10.1186/1471-2105-11-485. [Google Scholar] [CrossRef]
19. Zerbino DR , Birney E . Velvet: algorithms for de novo short read assembly using de Bruijn graphs. Genome Res. 2008; 18( 5): 821– 9. doi:10.1101/gr.074492.107. [Google Scholar] [CrossRef]
20. Schulz MH , Zerbino DR , Vingron M , Birney E . Oases: robust de novo RNA-seq assembly across the dynamic range of expression levels. Bioinformatics. 2012; 28( 8): 1086– 92. doi:10.1093/bioinformatics/bts094. [Google Scholar] [CrossRef]
21. Kim JE , Choe J , Lee WK , Kim S , Lee MH , Kim TH , et al. De novo gene set assembly of the transcriptome of diploid, oilseed-crop species Perilla citriodora. J Plant Biotechnol. 2016; 43( 3): 293– 301. doi:10.5010/jpb.2016.43.3.293. [Google Scholar] [CrossRef]
22. Langmead B , Salzberg SL . Fast gapped-read alignment with Bowtie 2. Nat Methods. 2012; 9: 357– 9. doi:10.1038/nmeth.1923. [Google Scholar] [CrossRef]
23. Anders S , Huber W . Differential expression analysis for sequence count data. Genome Biol. 2010; 11( 10): R106. doi:10.1186/gb-2010-11-10-r106. [Google Scholar] [CrossRef]
24. Ashburner M , Ball CA , Blake JA , Botstein D , Butler H , Cherry JM , et al. Gene Ontology: tool for the unification of biology. Nat Genet. 2000; 25( 1): 25– 9. doi:10.1038/75556. [Google Scholar] [CrossRef]
25. Morozov SY , Solovyev AG . Mechanisms of plant virus cell-to-cell transport: new lessons from complementation studies. Front Plant Sci. 2024; 15: 1453464. doi:10.3389/fpls.2024.1453464. [Google Scholar] [CrossRef]
26. Waigmann E , Citovsky V . Phosphorylation of viral movement proteins–regulation of cell-to-cell trafficking: response. Trends Microbiol. 2001; 9( 1): 8. doi:10.1016/s0966-842x(00)01900-4. [Google Scholar] [CrossRef]
27. Asjes CJ . Control of aphid-borne Lily symptomless virus and Lily mottle virus in Lilium in the Netherlands. Virus Res. 2000; 71( 1–2): 23– 32. doi:10.1016/S0168-1702(00)00185-4. [Google Scholar] [CrossRef]
28. Ros-Moner E , Jiménez-Góngora T , Villar-Martín L , Vogrinec L , González-Miguel VM , Kutnjak D , et al. Conservation of molecular responses upon viral infection in the non-vascular plant Marchantia polymorpha. Nat Commun. 2024; 15: 8326. doi:10.1038/s41467-024-52610-0. [Google Scholar] [CrossRef]
29. Zhang H , Wang F , Song W , Yang Z , Li L , Ma Q , et al. Different viral effectors suppress hormone-mediated antiviral immunity of rice coordinated by OsNPR1. Nat Commun. 2023; 14( 1): 3011. doi:10.1038/s41467-023-38805-x. [Google Scholar] [CrossRef]
30. Wang A . Cell-to-cell movement of plant viruses via plasmodesmata: a current perspective on potyviruses. Curr Opin Virol. 2021; 48: 10– 6. doi:10.1016/j.coviro.2021.03.002. [Google Scholar] [CrossRef]
31. Bayer EM , Benitez-Alfonso Y . Plasmodesmata: channels under pressure. Annu Rev Plant Biol. 2024; 75: 291– 317. doi:10.1146/annurev-arplant-070623-093110. [Google Scholar] [CrossRef]
32. Chen YS , David Ho TH , Liu L , Lee DH , Lee CH , Chen YR , et al. Sugar starvation-regulated MYBS2 and 14-3-3 protein interactions enhance plant growth, stress tolerance, and grain weight in rice. Proc Natl Acad Sci U S A. 2019; 116( 43): 21925– 35. doi:10.1073/pnas.1904818116. [Google Scholar] [CrossRef]
33. Jiang Z , Chen Q , Chen L , Liu D , Yang H , Xu C , et al. Sink strength promoting remobilization of non-structural carbohydrates by activating sugar signaling in rice stem during grain filling. Int J Mol Sci. 2022; 23( 9): 4864. doi:10.3390/ijms23094864. [Google Scholar] [CrossRef]
34. Ouyang N , Sun X , Tan Y , Sun Z , Yu D , Liu H , et al. Senescence-specific expression of RAmy1A accelerates non-structural carbohydrate remobilization and grain filling in rice (Oryza sativa L.). Front Plant Sci. 2021; 12: 647574. doi:10.3389/fpls.2021.647574. [Google Scholar] [CrossRef]
35. Viswanath KK , Kuo SY , Tu CW , Hsu YH , Huang YW , Hu CC . The role of plant transcription factors in the fight against plant viruses. Int J Mol Sci. 2023; 24( 9): 8433. doi:10.3390/ijms24098433. [Google Scholar] [CrossRef]
36. Zheng C , Zhou J , Yuan X , Zheng E , Liu X , Cui W , et al. Elevating plant immunity by translational regulation of a rice WRKY transcription factor. Plant Biotechnol J. 2024; 22( 4): 1033– 48. doi:10.1111/pbi.14243. [Google Scholar] [CrossRef]
37. Sun S , Li S , Zhou X , Yang X . WRKY1 represses the WHIRLY1 transcription factor to positively regulate plant defense against geminivirus infection. PLoS Pathog. 2023; 19( 4): e1011319. doi:10.1371/journal.ppat.1011319. [Google Scholar] [CrossRef]
38. Tee EE , Faulkner C . Plasmodesmata and intercellular molecular traffic control. New Phytol. 2024; 243( 1): 32– 47. doi:10.1111/nph.19666. [Google Scholar] [CrossRef]
39. Kumari R , Kumar S , Singh L , Hallan V . Movement protein of cucumber mosaic virus associates with apoplastic ascorbate oxidase. PLoS One. 2016; 11( 9): e0163320. doi:10.1371/journal.pone.0163320. [Google Scholar] [CrossRef]
40. Fulton DC , Stettler M , Mettler T , Vaughan CK , Li J , Francisco P , et al. β-AMYLASE4, a noncatalytic protein required for starch breakdown, acts upstream of three active β-amylases in Arabidopsis chloroplasts. Plant Cell. 2008; 20( 4): 1040– 58. doi:10.1105/tpc.107.056507. [Google Scholar] [CrossRef]
41. Liu J , Miao H , Wang Y , Zhang J , Zhang J , Zhen Y , et al. Elucidating the role of MaBAM9b in starch degradation. Plant Sci. 2022; 325: 111497. doi:10.1016/j.plantsci.2022.111497. [Google Scholar] [CrossRef]
Cite This Article
 Copyright © 2026 The Author(s). Published by Tech Science Press.
This work is licensed under a Creative Commons Attribution 4.0 International License , which permits unrestricted use, distribution, and reproduction in any medium, provided the original work is properly cited.
 Downloads
 Citation Tools