
 Submit a Paper
 Propose a Special lssue
 Open Access
ARTICLE

Growth and Yield Responses of Soledad Chili Pepper (Capsicum annuum L.) to the Application of Chitosan and Bacillus subtilis
1 Instituto de Agroingeniería, Universidad del Papaloapan Campus Loma Bonita, Av. Ferrocarril s/n, CD. Universitaria, Loma Bonita, C.P. 68400, Oaxaca, México
2 Programa de Maestría en Producción y Porcesamiento Agricola, Instituto de Agroingeniería, División de Estudios de Posgrado, Universidad del Papaloapan Campus Loma Bonita, Av. Ferrocarril s/n, CD. Universitaria, Loma Bonita, C.P. 68400, Oaxaca, México
3 Instituto de Química Aplicada, Universidad del Papaloapan Campus Tuxtepec, Circuito Central #200, Colonia Parque, Industrial, Tuxtepec, C.P. 6830, Oaxaca, México
4 Programa de Doctorado, División de Estudios de Posgrado, Universidad del Papaloapan Campus Tuxtepec, Circuito Central #200, Colonia Parque Industrial, Tuxtepec, C.P. 6830, Oaxaca, México
* Corresponding Authors: Adolfo Amador Mendoza. Email: ; Saribel Zilli Gutiérrez. Email:
(This article belongs to the Special Issue: Endophytic Microbiota: Prospects and Challenges for Application Towards Sustainable Agriculture and Environmental Management)
Phyton-International Journal of Experimental Botany 2026, 95(1), 10 https://doi.org/10.32604/phyton.2025.073856
Received 27 September 2025; Accepted 01 December 2025; Issue published 30 January 2026
 View Full Text
 Download PDF
Abstract
The cultivation of Soledad pepper (Capsicum annuum L.) is essential in Oaxaca and Veracruz, but it faces issues with pests and diseases, which affect yield and cause economic losses. To mitigate these impacts, farmers have started using biostimulants such as chitosan and plant growth promoting bacteria instead of agrochemicals due to their environmental and health benefits. This study evaluated the effect of Bacillus subtilis and chitosan, both individually and combined, on the growth, yield, and fruit quality of Soledad pepper under greenhouse conditions. Four treatments were applied at different stages of the crop cycle: Q (Chitosan), BS (Bacillus subtilis), Q + BS (Chitosan + Bacillus subtilis), and T (Control). The results showed that the combination of chitosan and Bacillus subtilis significantly improved plant growth, especially in height and stem diameter. The chitosan treatment produced the highest number of fruits and plant weight, while the combination of chitosan and Bacillus subtilis enhanced fruit quality, increasing characteristics such as size, weight, pericarp thickness, and physicochemical parameters, notably in brix degrees, citric acid percentage, and pH, outperforming the individual treatments and the control.Keywords
The production of green chili (Capsicum annuum L.) plays a fundamental role in the agrifood sector, representing a significant source of income and food worldwide. According to data from the Food and Agriculture Organization of the United Nations (FAO), in 2022, the global production of green chili and bell peppers reached approximately 36.972 million tons, with China leading production at 16.811 million tons, followed by Mexico with 3.685 million tons [1].
In Mexico, green chili production has shown remarkable growth. In 2023, production reached 3.6 million tons, making the country one of the world’s leading producers. States such as Sinaloa, Chihuahua, and Zacatecas were the main contributors, collectively accounting for 59.7% of the national volume [2]. In the Papaloapan region, in the states of Oaxaca and Veracruz, the production of Soledad chili (Capsicum annuum L.) covers a cultivated area of 358 and 1382 hectares, respectively, with an annual production of 2305 t, according to the Agricultural and Fisheries Information Service (SIAP). This crop not only serves as an economic livelihood for local farmers but also represents a vital component of the region’s agricultural identity [3].
It is important to highlight that, despite significant production, the demand for green chili in international markets remains high. In 2023, Mexico exported 1.1 million tons of green chili, with a value of USD 1.2 billion, reflecting a 5.8% increase in volume and a 9.5% increase in value compared to the previous year [4,5]. These data emphasize the importance of green chili in the global and local agricultural economy, as well as the need to maintain sustainable and efficient agricultural practices to meet the growing demand in both national and international markets.
Despite its promising productivity, Soledad chili is threatened by various biotic factors, such as pests and diseases, which can affect any stage of its growth cycle. These phytosanitary problems not only reduce the quality and quantity of the harvest but also cause significant economic losses for local farmers. Many of them resort to the use of agrochemicals to protect their crops; however, the indiscriminate and excessive use of these products entails risks and consequences, such as air contamination, pollution of groundwater, soil erosion, and the accumulation of toxic leachates. Therefore, it is essential to find sustainable solutions that minimize these negative impacts and ensure the longterm viability of agricultural activities [6].
One such alternative is the use of chitosan, a biopolymer derived from chitin, which has demonstrated multifunctional properties in agriculture. Beyond its role as a growth stimulant, chitosan acts as an elicitor of plant defense responses and improves nutrient absorption and water use efficiency. Recent studies highlight its nanostructured formulations and synergistic interactions with beneficial microorganisms as promising tools for sustainable crop production [7,8]. It has been shown to stimulate the synthesis of key phytohormones such as indoleacetic acid, indole-3-butyric acid, and gibberellins, promoting growth and yield in crops like wheat, corn, strawberries, tobacco, and rice [9,10].
Additionally, several studies have documented that the application of chitosan can increase plant height, stem diameter, leaf number, and photosynthetic activity in horticultural crops under tropical conditions. B. subtilis is a beneficial bacterium widely used as a biofertilizer and biocontrol agent in agriculture. One of its most remarkable abilities is the promotion of plant growth through the synthesis and regulation of phytohormones such as auxins, gibberellins, abscisic acid, and ethylene. These phytohormones play a crucial role in plant growth, development, and stress response. The use of B. subtilis in sustainable agriculture has gained relevance due to its ability to enhance crop growth, increase disease resistance, and reduce dependence on chemical fertilizers and pesticides [11,12,13]. These advances in knowledge and technology promote the search for agricultural management strategies that reduce economic costs and environmental damage while increasing productivity. Given the need to implement more sustainable production techniques, this research focuses on evaluating the effect of microbial inoculants and biofertilizers on the growth, yield, and fruit quality of Soledad chili (Capsicum annuum L.) under controlled greenhouse conditions. This approach aims to generate valuable information that contributes to the adoption of more environmentally friendly and sustainability promoting agricultural practices. Therefore, the objective of this research was to evaluate the individual and combined effects of B. subtilis and chitosan on the growth, yield, and fruit quality of Soledad chili (Capsicum annuum L.) under greenhouse conditions. Based on previous evidence indicating that chitosan and Bacillus subtilis can enhance plant growth, yield, and fruit quality through complementary physiological and microbiological mechanisms, it was hypothesized that their combined application would exert a synergistic effect on Soledad chili pepper plants. Specifically, the integration of chitosan and Bacillus subtilis was expected to promote greater vegetative growth, higher fruit yield, and improved physicochemical fruit quality compared to individual treatments or the control.
2.1 Establishment of the Experiment
The first part of this research was conducted in the chemistry and biology laboratory of the Agroengineering Institute. Subsequently, for agronomic management, a “vulture wing” type greenhouse was used. Both are located at the facilities of the Universidad del Papaloapan, Loma Bonita Campus, in the municipality of Loma Bonita, Oaxaca, Mexico, with coordinates 18°05′56.5″ N and 95°53′48.0″ W, at an altitude of 38 m above sea level.
2.2 Establishment of the Experiment
A randomized block experimental design was conducted with four treatments, each with 20 repettions, equivalent to 20 plants per treatment. The treatments included were: Q (UNPA Chitosan + Nutrient Solution), BS (Bacillus subtilis), Q + BS (UNPA Chitosan + Bacillus subtilis), and T (Nutrient Solution), as detailed in Table 1.
Table 1: Description of the treatments applied.
| Treatments | Description |
|---|---|
| Q (2 g/L; 0.2% p/v) | UNPA Chitosan + Nutrient Solution |
| BS (1 × 10⁹ UFC·mL−1; 0.015 g/L) | Bacillus subtilis + Nutrient Solution |
| Q (2 g/L; 0.2% p/v) + BS (1 × 10⁹ UFC·mL−1; 0.015 g/L) | UNPA Chitosan + Bacillus subtilis + Nutrient Solution |
| T | Nutrient Solution |
The treatments were applied at the time of sowing and then at 15, 30, and 45 days after sowing, as well as at 15, 30, 45, 60, 75, 90, 105, and 120 days after transplanting (DAT). It is important to mention that the transplanting was done when the plants were 45 days from sowing. The bioproducts were applied at a dose of 15 mL per plant using the drench technique. As a solvent for chitosan, slightly acidified distilled water (pH 5.6) with 1% v/v glacial acetic acid was used to facilitate complete dissolution and ensure stability. In all treatments, the standard Hoagland and Arnon (1950) nutrient solution was used, composed of macronutrients (NO3−, NH4+, PO43−, K+, Ca2+, Mg2+, SO42−) and micronutrients (Fe, Mn, Zn, Cu, and B), adjusted to a pH of 6.0 ± 0.2.
The Bacillus subtilis strain was provided by the Bioprocess Laboratory of the University of Papaloapan (UNPA) at the Loma Bonita campus. The lactic acid strain was reactivated in Man Rogosa Sharpe (MRS) medium, incubating at 38°C for 48 h in an incubator (Felisa®, FE132AD, Ciudad de México, Mexico). The resulting bacterial suspension was adjusted to a concentration of 1 × 10⁹ CFU·mL−1 [13].
2.4 Preparation of the Bioinoculant
Two grams of chitosan were dissolved in one liter of distilled water acidified with 1% v/v glacial acetic acid and kept under constant agitation for 15 min to ensure complete dissolution. For Bacillus subtilis, 15 mL of the bacterial concentrate (1 × 10⁹ CFU·mL−1) were added to one liter of distilled water and maintained under constant agitation for 15 min. Finally, for the combined product, two grams of chitosan and 15 mL of the Bacillus subtilis concentrate were added to one liter of acidified water, keeping constant agitation for 15 min.
2.5.1 Production and Inoculation of Plants
Seeds of the Soledad chili variety CHISER-522 were used, donated by the Huastecas Experimental Field of the National Institute of Forestry, Agricultural and Livestock Research [14]. Sowing was carried out on 29 November 2022 following the methodology of [15], using polystyrene trays with 200 cavities and employing Peat Moss as a substrate, which was moistened to field capacity. A 1 cm hole was made in each cavity, where one seed was placed. The seed was then covered with a light layer of moist Peat Moss substrate. After 15 days of sowing, the evaluated bioproducts (Bacillus subtilis, chitosan, and chitosan + Bacillus subtilis) were applied, along with a nutrient solution Steiner [16] at a concentration of 25% for the first two weeks. The concentration was then increased to 50% until the time of transplanting. After 45 days, the seedlings were transplanted into bags containing 8 kg of worm compost, placing the plant with the root ball directly in the center of the bag.
2.5.2 Transplanting, Irrigation, and Fertilization.
After 45 days, the seedlings were transplanted into bags containing 8 kg of vermicompost, placing the plant with the root ball directly in the center of the bag. Subsequently, for the irrigation and fertilization of the crop, the hydroponic irrigation system available in the greenhouse was used. For conducting the experiment, daily irrigation was applied, or as needed by the plant, for a duration of 20 min at the following times: 8:00 a.m. and 6:00 p.m. The nutrient solution and dosage used were based on Steiner (1984). The pH of the solution was adjusted to 6, and the electrical conductivity (EC) was set between 2.5 and 3.5 mS cm−1. It is important to mention that the nutrient solutions varied according to the phenological stage of the crop. From 4 days after sowing until 25 days after sowing, the solution was applied at a concentration of 25%. Then, from day 26 to 45 days after sowing, the solution was used at a concentration of 50%. The same concentration was maintained after transplanting until 75 days posttransplant. Finally, from 76 days after transplanting until 120 days after transplanting, the nutrient solution was applied at 75% concentration until the end of the crop’s vegetative cycle.
The experiment was conducted using a randomized complete block design (RCBD) with four treatments: Q (chitosan), BS (Bacillus subtilis), Q + BS (chitosan + Bacillus subtilis), and T (control, nutrient solution). Each treatment had 20 biological replicates, equivalent to 20 independent plants per treatment. The plants were randomly distributed within blocks in an ambient temperature greenhouse, ensuring that each block included one replicate of each treatment to control environmental variability. The layout within the greenhouse consisted of rows spaced 30 cm apart between plants and 50 cm between rows, maintaining uniform light conditions and air circulation.
Treatments were applied using the drench technique directly at the base of each plant, ensuring contact with the root zone. Each plant received a volume of 15 mL per application. The first application was at 15 days after sowing, followed by applications at 30 and 45 days after sowing, as well as at 15, 30, 45, 60, 75, 90, 105, and 120 days after transplanting (DAT). For the combined treatment (Q + BS), 2 g/L chitosan and 15 mL/L bacterial concentrate (1 × 10⁹ CFU/mL) per liter of solution were mixed and applied following the same protocol.
2.5.5 Morphological Evaluation
Three harvests were conducted: the first at 69 days after transplanting (DAT), the second at 89 DAT, and the third at 105 DAT. The morphological evaluation began 15 days after sowing and continued every 15 days, specifically at 30 and 45 days after sowing, and then at 15, 30, 45, 60, 75, 90, and 105 days after transplanting (DAT). All morphological measurements (plant height, stem diameter, leaf area, and number of leaves) were taken on the same marked plants throughout the experiment to ensure a consistent evaluation of growth over time. Each treatment included 20 plants (n = 20), and the data are presented as mean ± standard error (SE).
It was measured in seedlings at 14, 30, and 45 days after sowing (dds) [17]. After transplanting, the number of leaves was recorded every 15 days on the same plants per treatment.
The stem diameter was measured using a digital caliper (Truper®, CALDI-6MP, Ciudad de México, México), which involved placing the caliper 5 cm above the base of the plant stem. Measurements were taken every 15 days during the vegetative, flowering, and fruiting stages [18]. The same plants were measured at each interval.
To measure the height, a measuring tape was used from the ground level to the apical meristem of the plant’s primary stem [18]. Measurements were made on the same selected plants per treatment.
The leaf area was determined using the method described by Swart [19]. The measurement was performed on a fully expanded true leaf of more than 2 cm. The length in cm (L), width in cm (W), and area in cm2 (A) were measured for individual leaves.
2.5.10 Number of Fruits and Yield per Plant
The total number of fruits per plant was counted starting from the setting of each plant; fruits that reached their commercial size with bright green coloration were selected. They were then weighed with an electronic scale (Rhino®, BAS-20, Ciudad de México, México) to obtain the total yield of fruit per plant [20]. Yield per plant (g plant−1) was calculated as the sum of the fresh weight of all fruits harvested per plant. The average fruit weight (g) was obtained by dividing the total fresh weight by the number of fruits.
2.6 Physicochemical Determination
2.6.1 Number of Fruits and Yield per Plant
Chlorophyll content was determined according to the methodology of Porra [21]. A mature leaf was collected from the middle part of each of the marked plants used in the morphological measurements for each treatment, ensuring repeated measurements on the same plants over time. Leaves were stored in a cooler during transport from the greenhouse to the laboratory, washed with deionized water, and cut into pieces of approximately 2 cm2. For pigment extraction, 3 g of leaves per treatment (n = 3) were weighed and placed in a mortar with 6 mL of 80% acetone, grinding until a homogeneous sample was obtained. Then, 4 mL of the supernatant were transferred to 15 mL conical tubes and centrifuged at 10,000 rpm for 20 min, avoiding direct light. Finally, 0.25 mL of each extract supernatant was diluted to 10 mL with 80% acetone. Measurements were performed using a VELAB™ UV-Visible spectrophotometer, model VE-5100UV, placing 1 mL of each sample in 10 mm quartz cuvettes. Absorbance readings were taken at 470, 647, and 664 nm for each pigment. Results are expressed as mean ± standard error (SE) of three replicates (n = 3).
2.6.2 Cellular Extract of Petiole, Electrical Conductivity, and pH
To determine the nutrients present in the plant, an extract from the petiole was used. A mature leaf from the middle part of the same marked plants used in the morphological evaluation was selected for each treatment and stored in Ziploc bags inside a cooler at 5°C. Leaves were collected at 8:00 a.m. Sap was extracted with a press, obtaining 2 mL for analysis in multiparameter photometers for nitrogen (HORIBA® LAQUAtwin NO311, Ciudad de México, México), phosphates (HANNA® Checker HI706, Ciudad de México, México), potassium (HORIBA® LAQUAtwin K-11, Ciudad de México, México), electrical conductivity (HANNA® LAQUAtwin EC-11, Ciudad de México, México), and pH (HORIBA® LAQUAtwin pH-11, Ciudad de México, México). For soluble solids determination (°Brix), a digital refractometer (HANNA® HI96801, Ciudad de México, México) was used [22]. For phosphate determination, 1 mL of HI717-25 reagent A was added to a cuvette and brought up to 10 mL with HI717-25 reagent B; the mixture was used as a blank in the spectrophotometer, then 0.5 mL of the sample was added for reading in the multiparameter photometer (HANNA® HI83399, Ciudad de México, México) [23]. All measurements were performed in triplicate (n = 3) and results are expressed as mean ± SE.
2.6.3 Quality Parameters in Fruits
Fruits were classified into three size categories (small, medium, and large) according to the Mexican Standard for non-industrialized food products for human consumption: fresh chili (Capsicum spp.) [24]. Ten fruits were evaluated per group and treatment (n = 20), and data are expressed as mean ± SE.
2.6.4 Length and Diameter (cm)
Two cuts were taken from the fruits of small, medium, and large sizes, with 10 repetitions per treatment. A measuring tape was used to measure the length, and a digital caliper (Truper®, CALDI-6MP, Ciudad de México, México) was used for the diameter. Values are expressed as mean ± SE (n = 20).
This was calculated as the average of 10 fruits of three sizes: small, medium, and large for each treatment from two harvests, using a digital scale (Rhino®, BAPRE-3, Ciudad de México, México) model BAPRE-3 with a precision of 0.2 g and a compact design [25]. Results are expressed as mean ± SE.
2.6.6 Pericarp Thickness and Number of Locules
Ten fruits from each size category per treatment were evaluated. Fruits were cut in half, pericarp thickness was measured using a digital caliper (Truper®, CALDI-6MP, Ciudad de México, México), and the number of locules was counted. Data are expressed as mean ± SE.
2.6.7 Pericarp Thickness and Number of Locules
Ten chilies of small, medium, and large sizes were selected for each treatment. Three grams of each sample were weighed and homogenized in a blender with 20 mL of deionized water for 2 min. For the determination of Brix degrees, two drops of the mixture were placed on a digital refractometer (HANNA® HI96801, Ciudad de México, México). For total titratable acidity (TTA), the obtained sample was placed in a 125 mL Erlenmeyer flask, and 3 drops of 1% phenolphthalein reagent were added. The sample was titrated with standardized 0.1 N NaOH until the endpoint color (very pale pink) was reached. The reference color solution was prepared by mixing 1 g of phenolphthalein and diluting it to 100 mL with ethanol. The percentage of acid present in the sample was reported by applying the following formula:
Electrical conductivity was determined using a conductivity meter (HORIBA®, LAQUAtwin EC-11, Ciudad de México, México), and pH was measured with a pH meter (HORIBA®, LAQUAtwin pH-11, Ciudad de México, México). Ten grams of fruits from each size category per treatment were homogenized with 20 mL of deionized water for 2 min, and two drops were used for reading. Results are expressed as mean ± SE (n = 20).
This was carried out following the methodology of Maurya [26], with some modifications. Ten fruits of small, medium, and large sizes were selected for each treatment (control, chitosan, Bacillus subtilis, and chitosan + Bacillus subtilis). First, they were cut into slices and placed on a stainless steel tray to be dried in an oven at 60°C for 48 h. After this process, 0.2 g of each sample was placed in a test tube, and 16 mL of ethanol was added, then heated to 80°C for 4 h, shaking every 30 min. The mixture was allowed to cool and settle for approximately 1 h, and the supernatant was filtered using Whatman filter paper. The determination of capsaicin was carried out using a spectrophotometric method. Absorbance readings at 280 nm were taken using a UV-Vis spectrometer (Thermo Scientific™, GENESYS™ 50, Waltham, MA, USA). Finally, the calibration curve was prepared with pure capsaicin (Sigma-Aldrich®, St. Louis, MO, USA) dissolved in ethanol in a concentration range of 10–200 mg L−1 [27]. Results are expressed as mean ± SE.
Data were processed using InfoStat 2017 for Windows. For variables measured repeatedly over time (plant height, stem diameter, number of leaves, chlorophyll a and b, sap electrical conductivity, pH, and sap nutrient concentrations), a repeated-measures ANOVA was performed to evaluate the effects of treatment, time, and their interaction. For fruit-quality variables (morphological and physicochemical traits) evaluated across three fruit sizes (small, medium, and large), a two-way ANOVA (treatment × fruit size) was applied. When significant effects were detected (p ≤ 0.05), means were separated using Tukey’s post-hoc test. Graphs were generated with SigmaPlot 12.00 for Windows. Values are reported as means ± SE (n = 20 plants for morphological and yield traits; n = 3 replicates for physiological and chemical analyses).
3.1 Characterization of Chitosan
The results of the analysis of shrimp exoskeleton samples, UNPA chitosan, and Sigma chitosan are presented in Table 2, showing the contents of minerals (% M), Demineralization (% DM), Deproteinization (% DP), proteins (% P), moisture (% H), and pH (hydrogen potential) in each sample.
Table 2: Mineral, protein, moisture, and pH content of shrimp exoskeleton, UNPA chitosan, and Sigma chitosan (mean ± SE, n = 3) with significance letters according to Tukey’s test (p ≤ 0.05).
| Sample | %M | %DM | %P | %DP | %H | pH |
|---|---|---|---|---|---|---|
| Shrimp exoskeleton | 24.6 ± 0.01a | 0a | 44.62 ± 0.03a | 0a | 6.5 ± 0.01a | 8.8 ± 0.01a |
| Chitosan UNPA | 2.71 ± 0.03b | 97.28 ± 0.01b | 7.43 ± 0.01b | 83.34 ± 0.01b | 11.5 ± 0.02b | 3.4 ± 0.01b |
| Chitosan SIGMA | 4.5 ± 0.01c | 95.46 ± 0.02b | 8.92 ± 0.02c | 80.01 ± 0.02b | 11.33 ± 0.01b | 3.4 ± 0.01b |
From the analyses performed, differences were found between the samples in terms of their chemical composition and physical properties. The shrimp exoskeleton shows a high content of minerals (24.6%) and proteins (44.62%), making it a rich source of these components. This composition is expected, considering the structural and protective function of the exoskeleton in shrimp. Additionally, the low moisture level (6.5%) and slightly alkaline pH (8.8) are consistent with the typical characteristics of marine biological materials. On the other hand, both UNPA chitosan and SIGMA chitosan show much lower contents of minerals and proteins, indicating a process of demineralization and deproteinization during their production. These results suggest efficient removal of impurities and undesirable components to obtain high purity chitosan. However, a notable increase in moisture content is observed in the chitosans (11.5% and 11.33%, respectively), which can be attributed to the extraction and purification process. Furthermore, both chitosans exhibit an acidic pH (3.4), probably due to the acidic nature of the deproteinization processes. The differences in chemical composition and physical properties between the shrimp exoskeleton and the derived chitosans have important implications for their industrial applicability. While the shrimp exoskeleton can be valued as a natural source of minerals and proteins in the food and supplement industries, UNPA and SIGMA chitosans are more suitable for agricultural applications due to their purity and specific physicochemical properties. Finally, these results highlight the importance of understanding the chemical composition and properties of biological materials and their derivatives for effective use in various industrial and nutritional applications. The results of the colorimetric analysis for the shrimp exoskeleton, UNPA chitosan, and SIGMA chitosan are presented in Table 3. The color coordinates L* (luminance), A* (red/green axis), and B* (yellow/blue axis) are shown, along with the color description and corresponding color chart.
These results reveal significant differences in color profiles among the analyzed samples. The shrimp exoskeleton exhibits a “pale grayish medium tone” with L* (luminance), A* (red/green axis), and B* (yellow/blue axis) values of 62.23, 1.17, and 16.3, respectively. This color may be characteristic of the chemical composition and structure of the exoskeleton, with the presence of natural pigments that give it this specific hue. On the other hand, both UNPA chitosan and SIGMA chitosan show lighter and less saturated colors compared to the shrimp exoskeleton. UNPA chitosan presents a “grayish medium white tone”, with L*, A*, and B* values of 75.63, 0.56, and 3.46, respectively. Meanwhile, SIGMA chitosan exhibits a “medium brown tone”, with L*, A*, and B* values of 65.56, 4.8, and 12.1. These colors may be influenced by the extraction and purification process of chitosan, as well as by the chemical composition of the starting materials.
Table 3: Color parameters (L, A*, B*, mean ± SE, n = 3) of the different analyzed samples: shrimp exoskeleton, UNPA chitosan, and Sigma chitosan.
| Sample | Colorimetry | Color | Color Chart | ||
|---|---|---|---|---|---|
| L* | A* | B* | |||
| Shrimp exoskeleton | 62.23 ± 0.01a | 1.17 ± 0.01a | 16.3 ± 0.01a | #A5947A |  |
| Chitosan UNPA | 75.63 ± 0.02b | 0.56 ± 0.01b | 3.46 ± 0.02b | #BEBAB4 |  |
| Chitosan SIGMA | 65.56 ± 0.01c | 4.8 ± 0.02c | 12.1 ± 0.03c | #B09C8A |  |
The difference in color profiles between shrimp exoskeleton and derived chitosans may be important in terms of their application in various industries. For example, the lighter and neutral color of chitosans may make them more suitable for use in applications where the color of the material is an important factor, such as in the food or pharmaceutical industries. Meanwhile, the characteristic color of shrimp exoskeleton may be useful in applications where the aim is to harness its natural and authentic properties, such as in the manufacturing of cosmetic products or dietary supplements. These results highlight the importance of considering the color profile along with other physical and chemical properties when selecting and using biological materials and their derivatives in various industrial and research applications.
3.2 Infrared Spectroscopy (FT-IR)
An FT-IR analysis was performed to confirm the structure of UNPA chitosan, comparing it with Sigma chitosan by identifying the characteristic bands of this polymer. Fig. 1 shows the obtained FT-IR spectra, where the O–H and N–H groups are observed at 3445 and 3280 cm−1, respectively. The band corresponding to the C–N group is found at 1554 cm−1, while the amide III band is located at 1377 cm−1. The bands for the C=O linkages of amide I are identified at 1630 cm−1, and the stretching bands N–H for amide I are found at 3260 cm−1. For Sigma chitosan, the most representative bands of the biopolymer are found at 3438 cm−1, corresponding to the N–H stretching for amide I and the broad vibration of the hydroxyl groups. Another characteristic band of the carbonyl group is observed at 1633 cm−1. It is important to note that these bands are presented with lower intensity compared to UNPA chitosan.
3.3 Growth Response in Seedlings
In Fig. 2, the results of the morphological parameters in seedlings are presented, evaluated at 15, 30, and 45 days after sowing (DAS), aiming to measure plant height (A), stem diameter (B), and number of leaves (C). The results revealed that at 15, 30, and 45 DAS, the combined treatment of Q + BS showed greater height, with means of 6.88 ± 0.10, 10.82 ± 0.26, and 17.54 ± 0.46 cm, respectively. However, at 15 DAS, no significant differences were observed among the treatments T, Q, and BS. Similarly, at 30 and 45 DAS, there were no significant differences between treatments Q and T, but significant differences were detected in the treatment with BS, which presented the lowest height, with means of 8.67 ± 0.21 and 14.22 ± 0.40 cm, respectively. Regarding stem diameter, the most effective treatment at 15, 30, and 45 DAS was the combination of Q + BS, with means of 1.49 ± 0.10, 1.55 ± 0.10, and 2.20 ± 0.10 mm, respectively. However, at 15 DAS, no significant differences were found between treatments Q and BS, with treatment BS presenting a lower diameter, showing no significant differences with treatment T. At 30 DAS, no significant differences were found between treatments Q and T either. Similarly, at 45 DAS, no significant differences were found among all treatments.
In relation to the number of leaves, no significant differences were observed among the four treatments at 15, 30, and 45 DAS. This phenomenon suggests that while the combination of Q + BS showed advantages in height and stem diameter at certain time points, it did not significantly influence the number of leaves. These results highlight the importance of considering the combination of different treatments to maximize growth and development in seedlings under specific conditions.
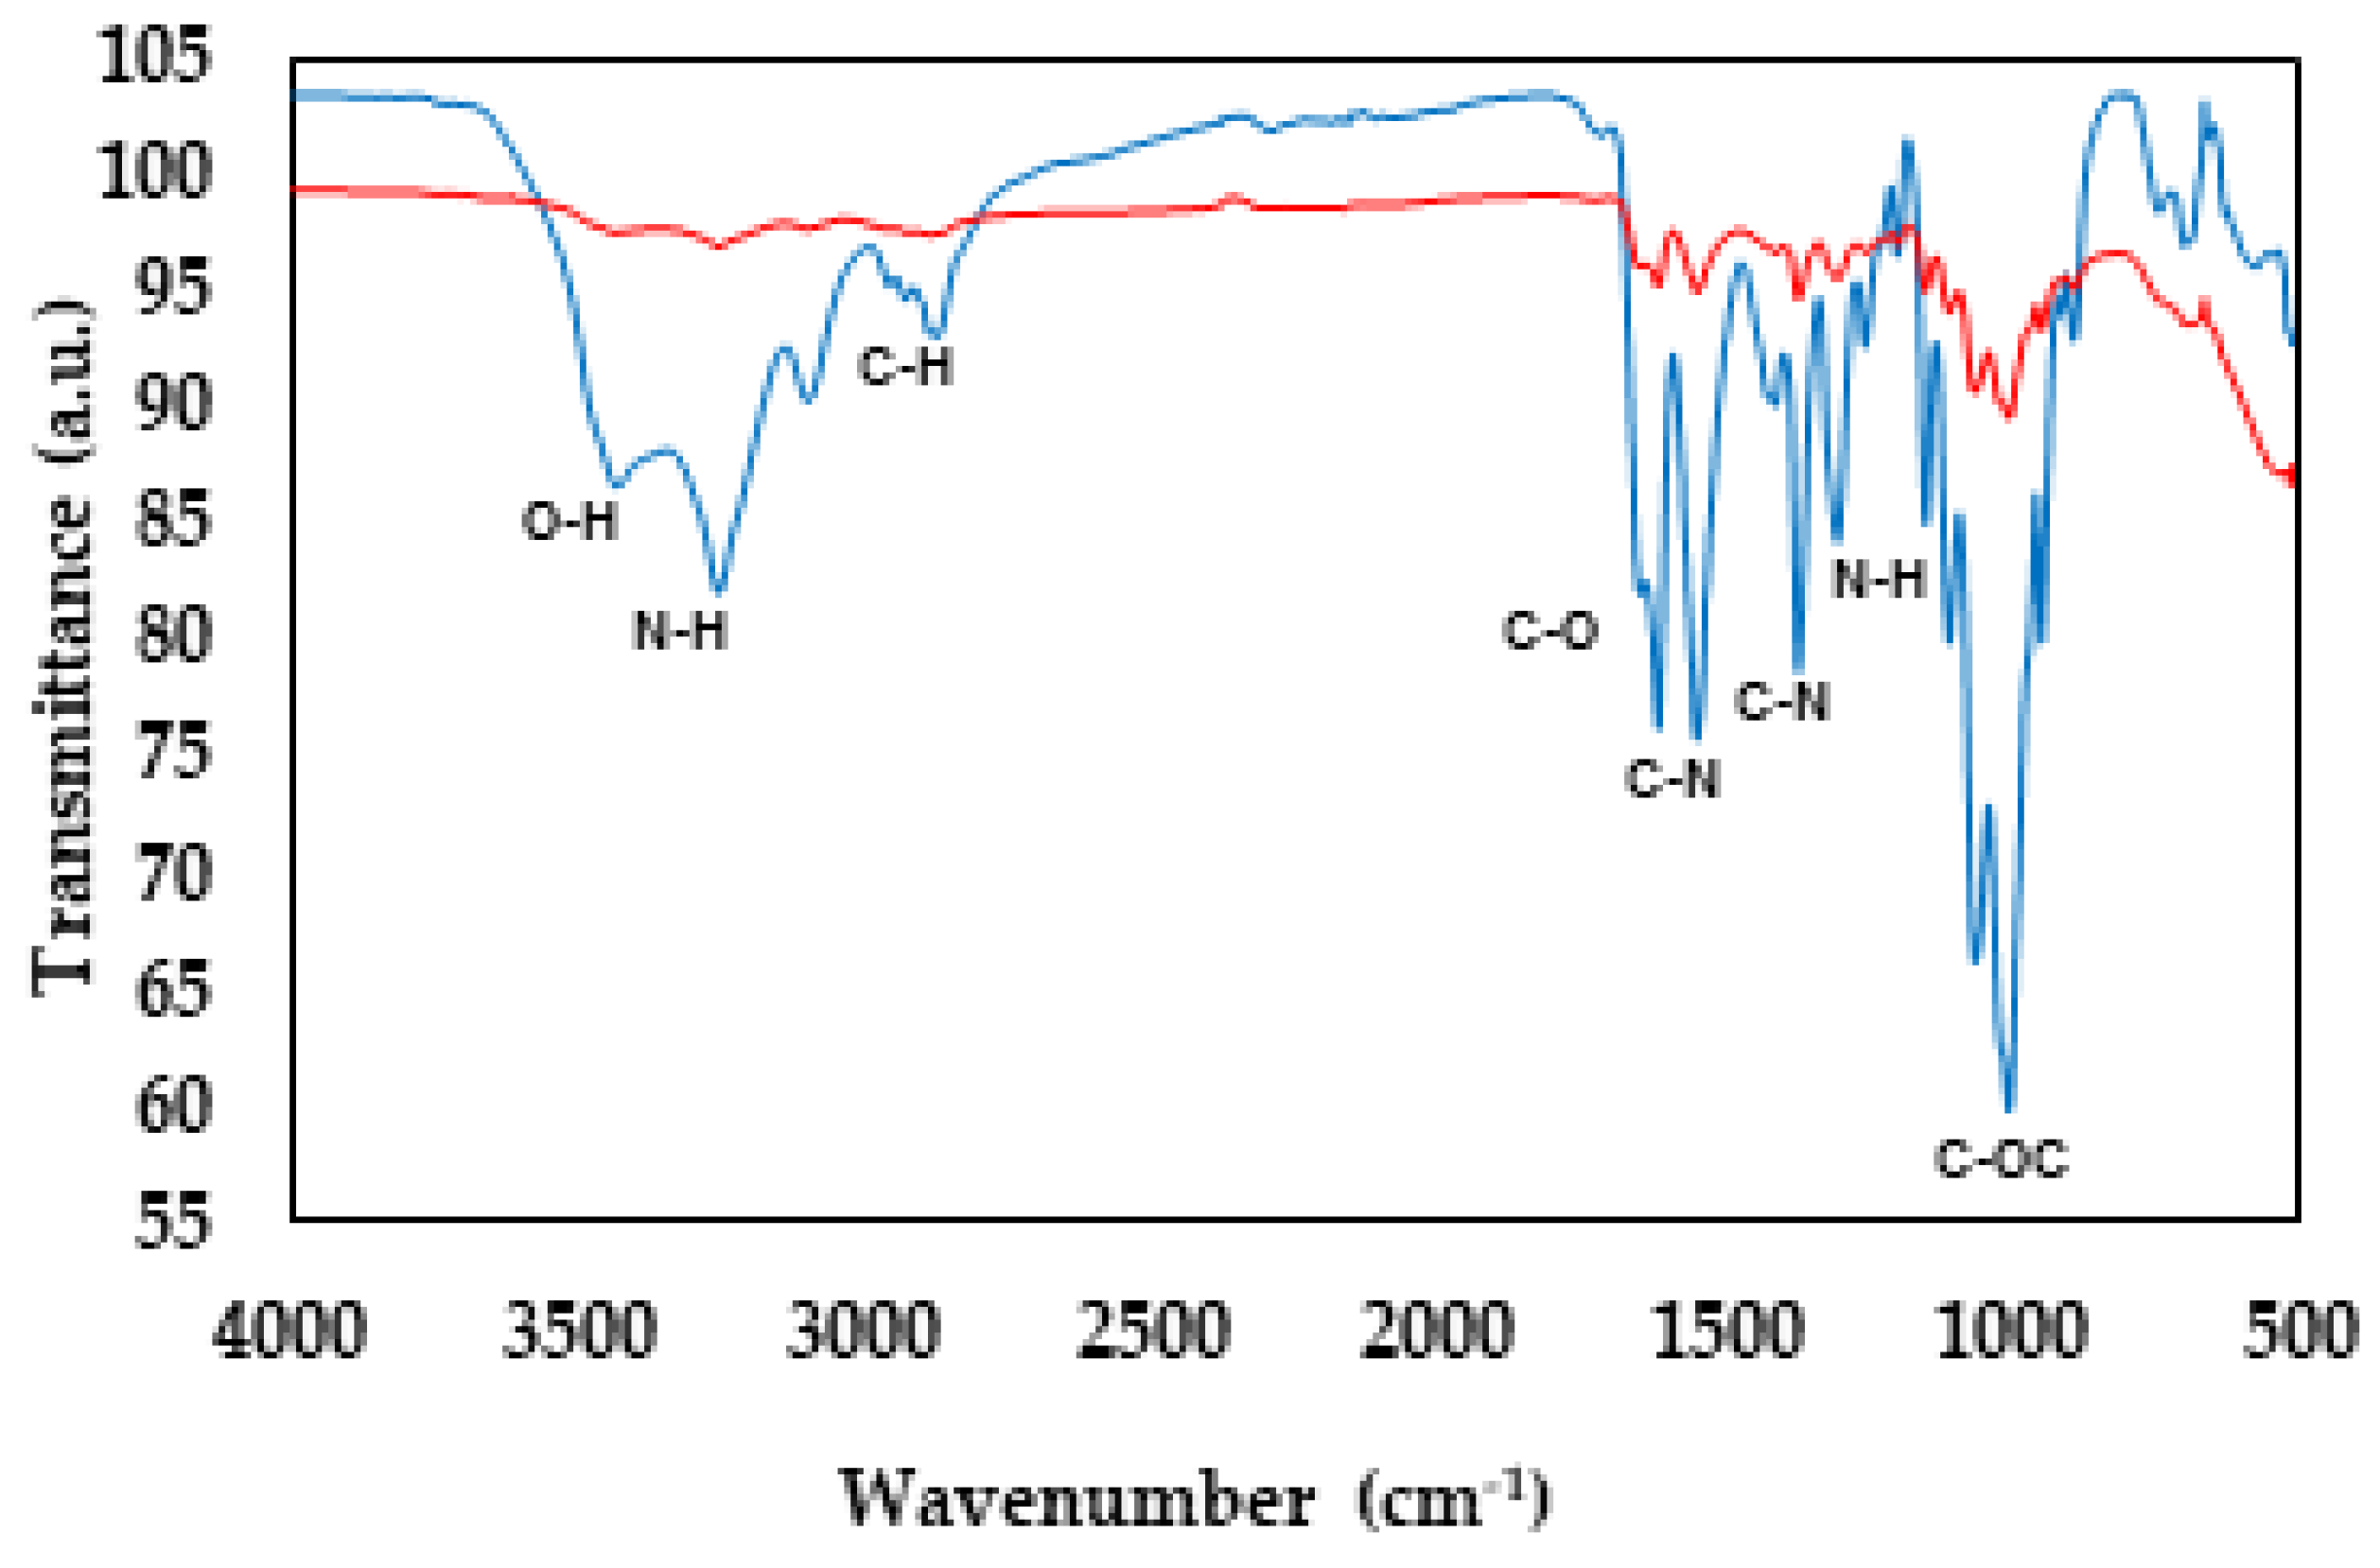
Figure 1: FTIR spectra of chitosan (UNPA) — extracted from shrimp exoskeletons and chitosan (SIGMA) — over a wavelength range of 4000 cm−1 to 500 cm−1.
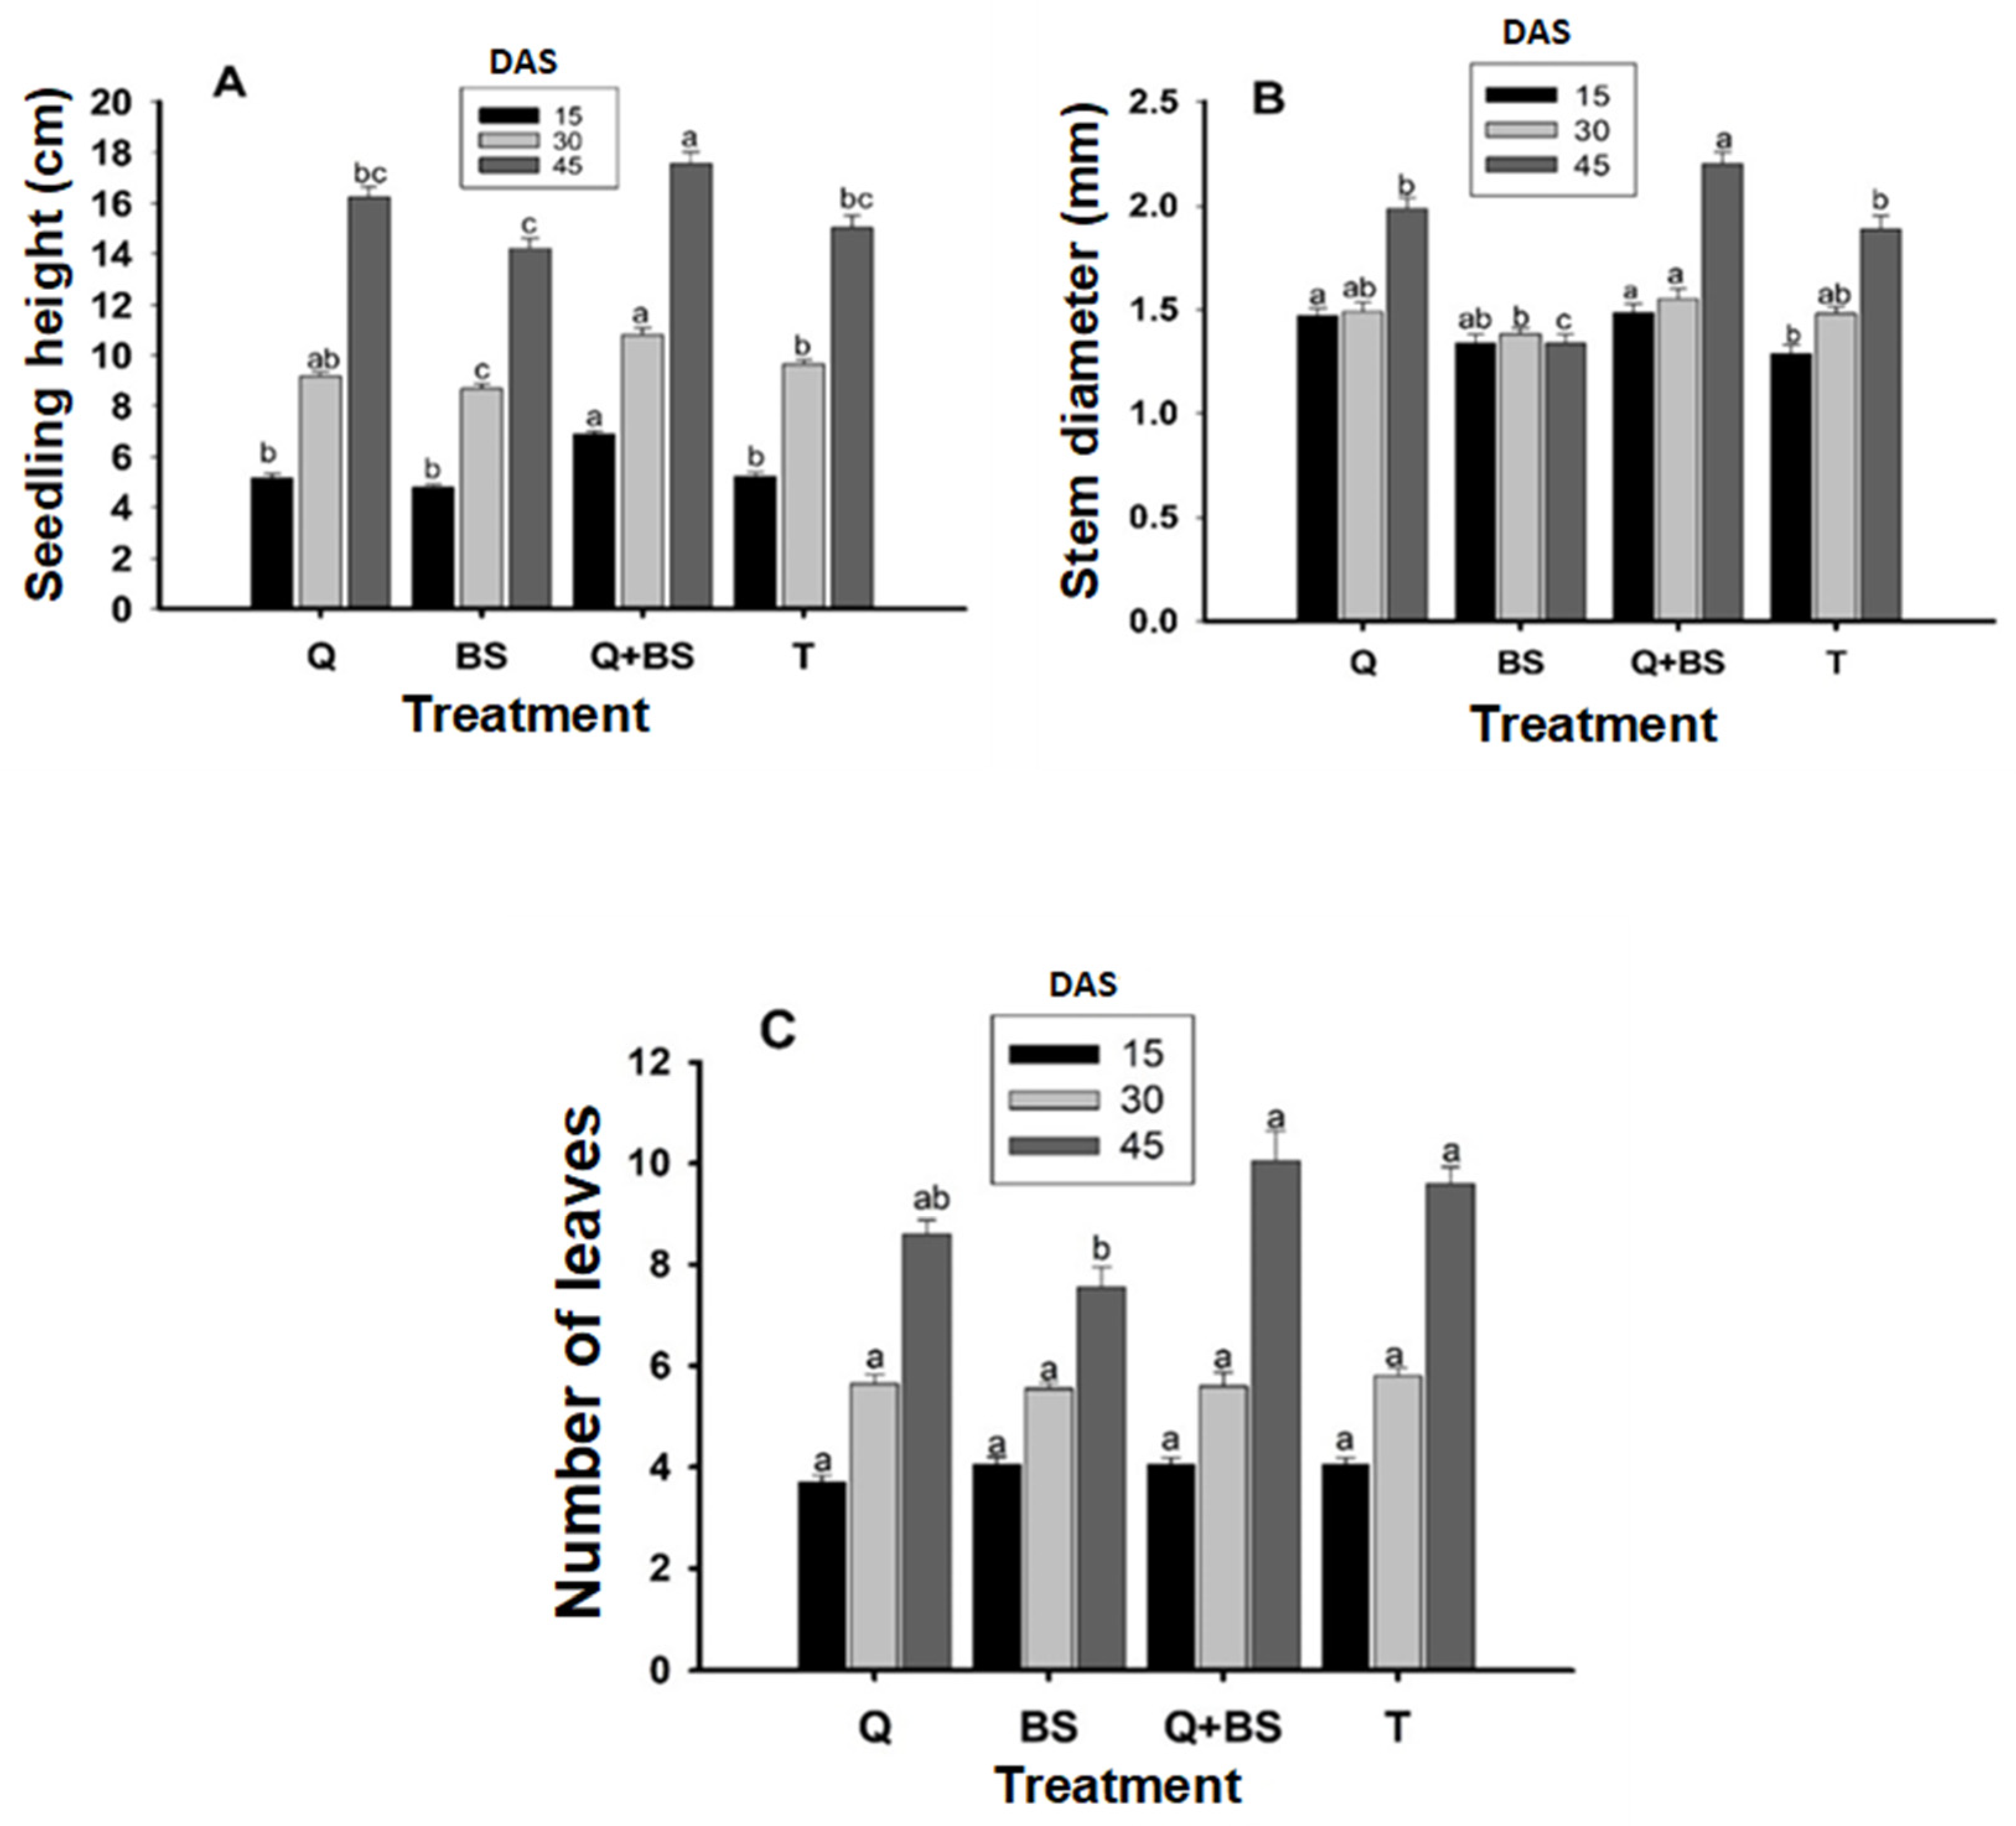
Figure 2: Plant height (cm) (A), stem diameter (mm) (B), and number of leaves (C) in Chile Soledad (Capsicum annuum L.), evaluated at 15, 30, and 45 days after sowing (DAS). Each value represents the mean ± standard error (n = 20). Treatments: Q = UNPA chitosan, BS = Bacillus subtilis, Q + BS = UNPA chitosan + Bacillus subtilis, and T = Control. Columns sharing the same letter are not significantly different according to Tukey’s test (p < 0.05).
In Fig. 3, the morphological growth parameters of Soledad chili plants are presented, evaluated at 15, 30, 45, 60, 75, 90, and 105 days after transplanting (DAT). These parameters include plant height (A), stem diameter (B), leaf area (C), and the number of shoots (D). It was observed that for the height variable, no significant differences were found between treatments at 15, 30, 45, 90, and 105 DAT. However, at 60 DAT, the treatment with BS showed a greater height (120.19 ± 2.68 cm), distinguishing itself from the control and the combination of Q + BS, although it did not show significant differences with the application of Q, which reached a height of (114.8 ± 2.33 cm). Similarly, at 75 DAT, the combination of Q + BS presented the greatest height (137.50 ± 3.65 cm), with no significant differences with the BS treatment (133.60 ± 3.19 cm), but significant differences compared to the other treatments. Regarding stem diameter, the control showed significant differences compared to the other treatments (Q, BS, and Q + BS), with the combination of Q + BS exhibiting the greatest diameter (0.307 ± 0.006 cm). Furthermore, no significant differences were observed between treatments and the control at 30, 45, 60, 75, 90, and 105 DAT.
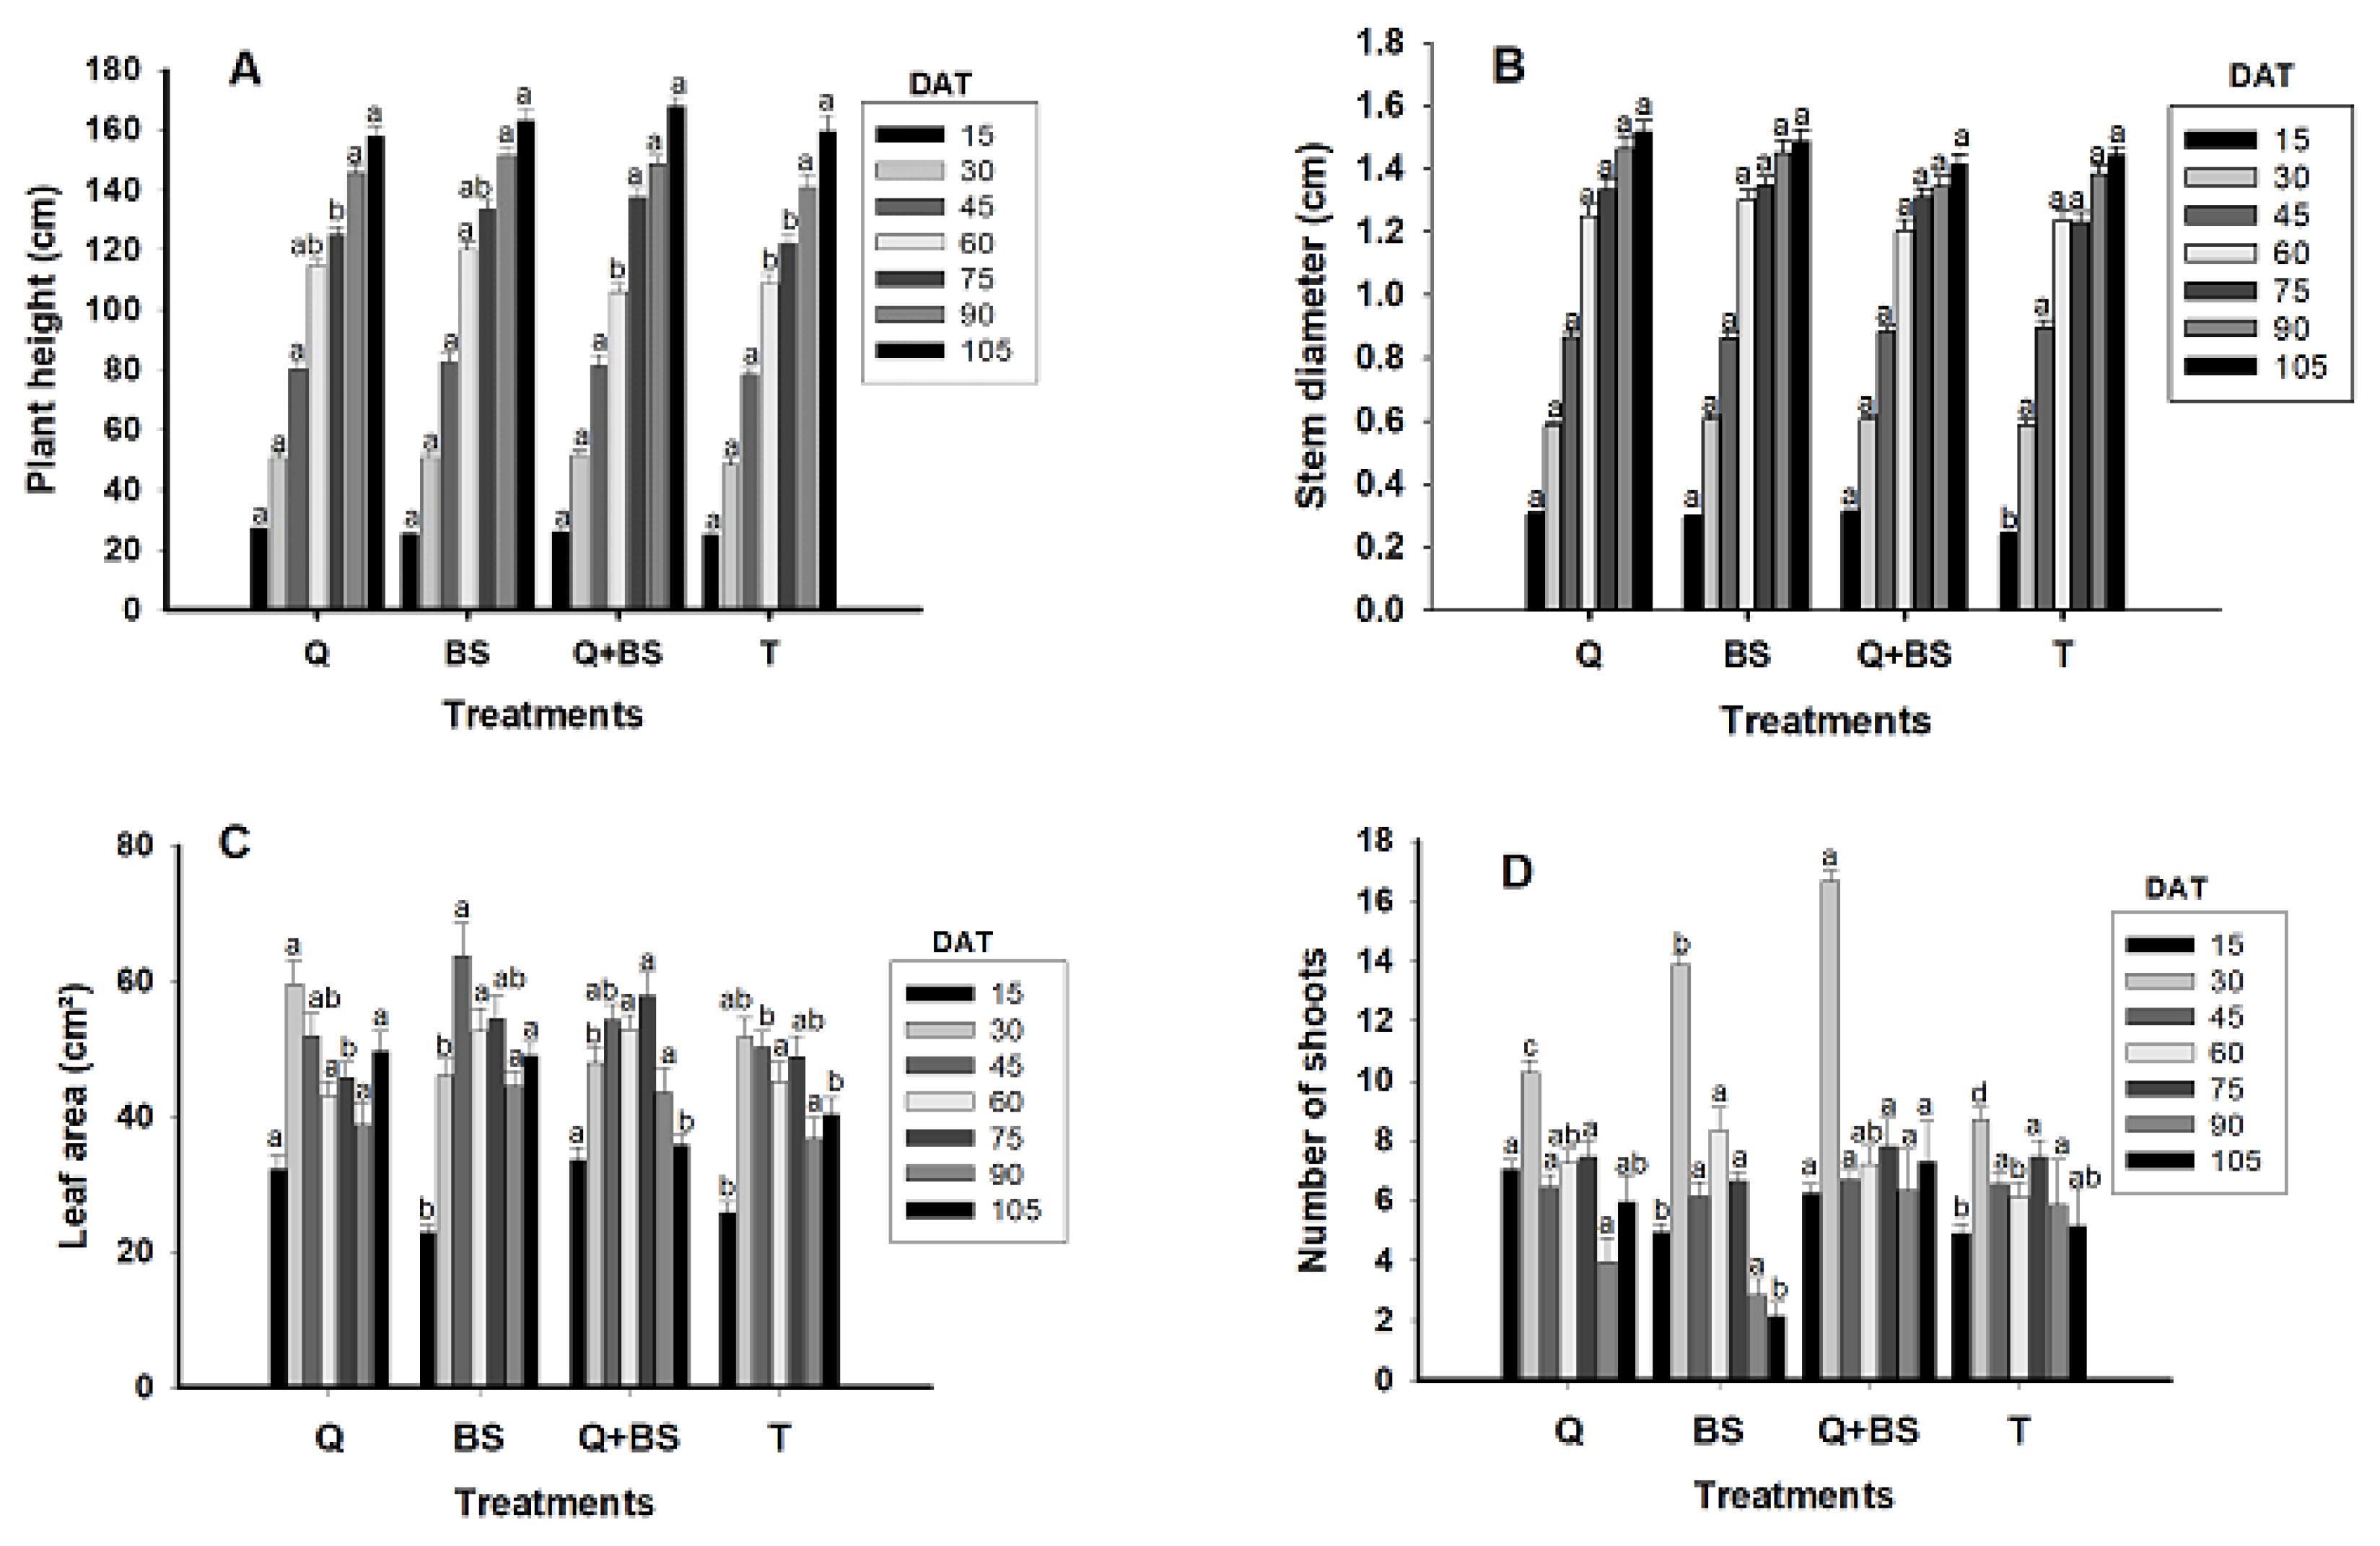
Figure 3: Plant height (cm) (A), stem diameter (cm) (B), leaf area (cm2) (C), and number of shoots (D) in Chile Soledad (Capsicum annuum L.), evaluated from 15 to 105 days after transplanting (DAT). Each value represents the mean ± standard error (n = 20). Treatments: Q = UNPA chitosan, BS = Bacillus subtilis, Q + BS = UNPA chitosan + Bacillus subtilis, and T = Control. Columns sharing the same letter are not significantly different according to Tukey’s test (p < 0.05).
In relation to leaf area, the best treatments at 15 DAT were Q and Q + BS (33.65 ± 1.77 and 32.16 ± 2.01 cm2, respectively), with no significant differences between them, but significant differences when compared to the control and BS. At 30 DAT, the greatest leaf area was obtained with the application of Q (59.57 ± 3.49 cm2), followed by the control, with no significant differences between these two treatments. However, the control did not show significant differences concerning the other treatments (BS and Q + BS). In the following time intervals, significant differences between treatments varied, highlighting the superiority of the combined treatment Q + BS at 75 DAT. Regarding the number of shoots, at 15 DAT, the application of Q and Q + BS showed better results (7.05 ± 0.29 and 6.25 ± 0.29 shoots, respectively), with no significant differences between them, but significant differences compared to the other treatments. In summary, variability was observed in the performance of the treatments throughout the study period, emphasizing the effectiveness of the combination of Q + BS in various aspects of the growth of Soledad chili plants. These results may be useful for optimizing cultivation practices and improving the yield of this particular crop.
3.5 Determination of Photosynthetic Pigments (Chlorophyll a and b)
In Fig. 4, the results obtained for photosynthetic pigments at 30, 60, 90, and 105 days after transplanting (DAT) are shown for chlorophyll A (A), B (B), and chlorophyll A y B (C). It was observed that for chlorophyll A at 30 DAT, no significant differences were found between the treatments compared to the control treatment (T). However, at 60, 90, and 105 DAT, the treatment with Q showed higher concentrations of chlorophyll A (5.97 ± 0.35, 2.41 ± 0.03, and 2.14 ± 0.07 μg mL−1, respectively).
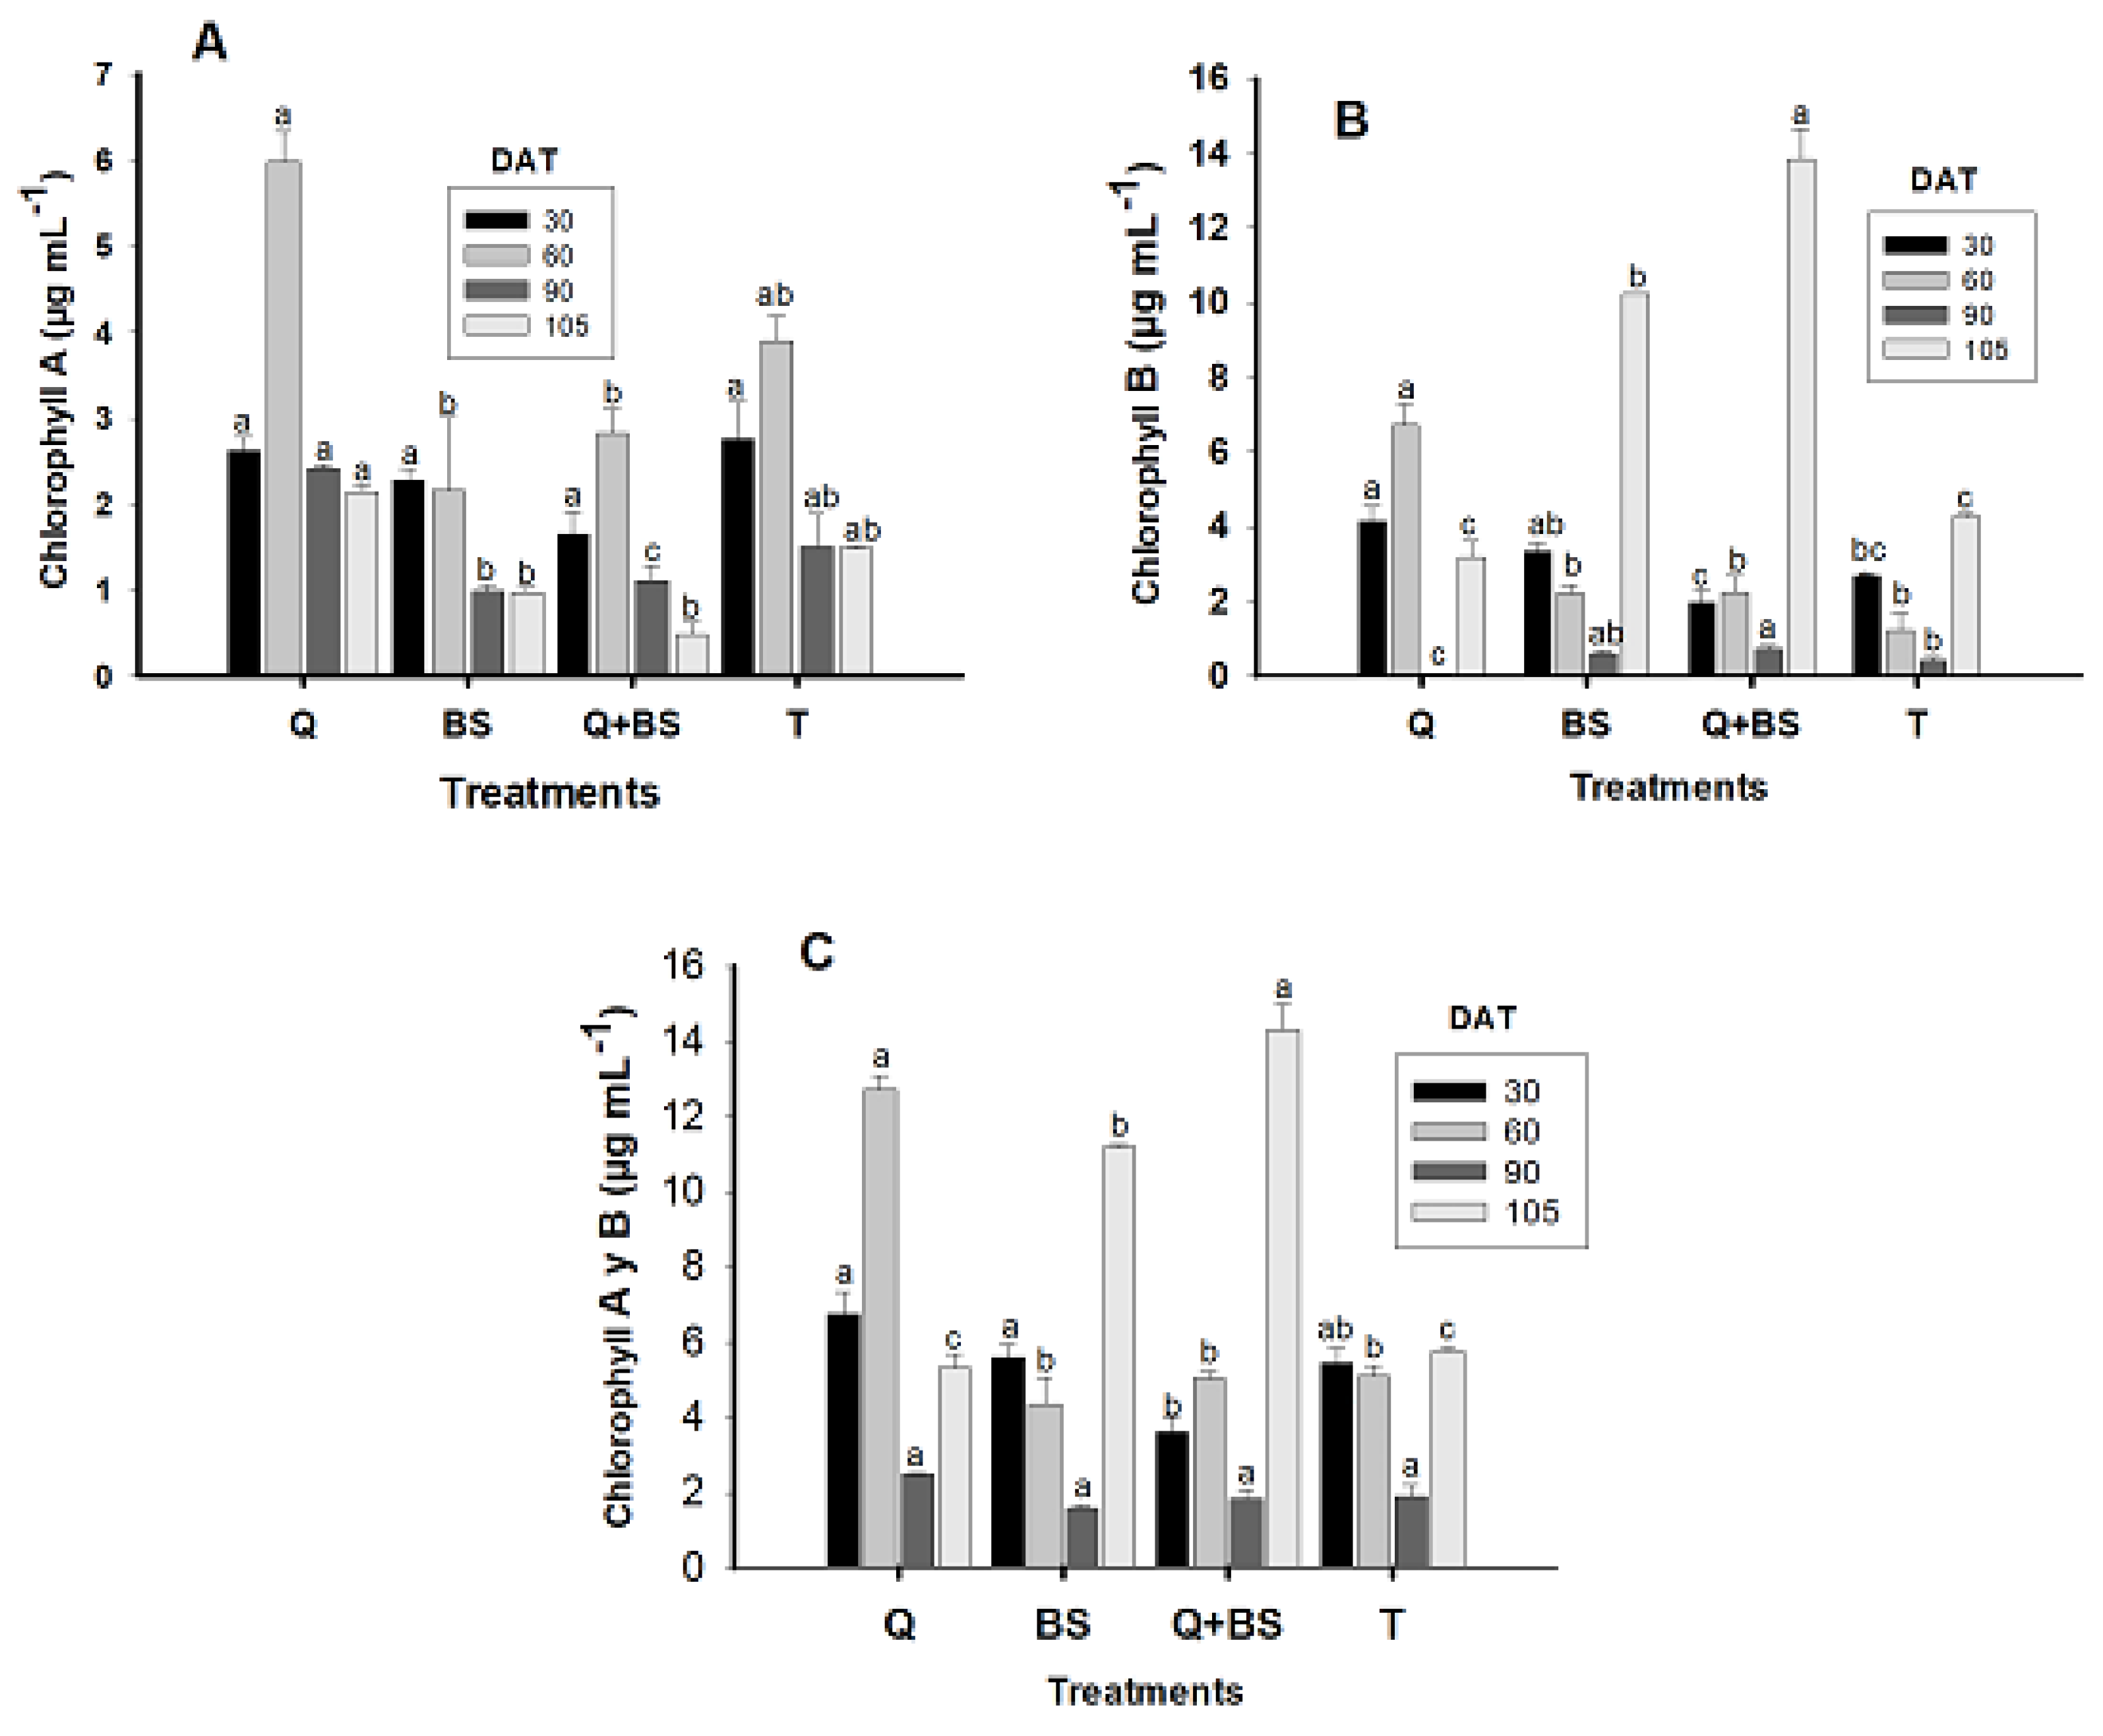
Figure 4: Chlorophyll A (μg mL−1) (A), chlorophyll B (μg mL−1) (B), and total chlorophyll (A + B) (μg mL−1) (C) in Chile Soledad (Capsicum annuum L.), evaluated at 30, 60, 90, and 105 days after transplanting (DAT). Each value represents the mean ± standard error (n = 20). Treatments: Q = UNPA chitosan, BS = Bacillus subtilis, Q + BS = UNPA chitosan + Bacillus subtilis, and T = Control. Columns sharing the same letter are not significantly different according to Tukey’s test (p < 0.05).
At 60 DAT, the control (T) did not show a significant difference compared to the application of Q, nor did the application of BS and the combination of Q + BS compared to the control, with the BS application presenting the lowest levels of chlorophyll A at a concentration of 2.15 ± 0.85 μg mL−1. At 90 DAT, the application with BS showed no significant differences compared to T, with the combination of Q + BS presenting the lowest concentration of chlorophyll A (1.10 ± 0.17 μg mL−1). At 105 DAT, no significant differences were found between the treatment with Q and the control; however, Q showed higher chlorophyll values but did present differences compared to the treatments with BS and the combination Q + BS.
Regarding chlorophyll B, the best results at 30 and 60 DAT were obtained with the application of Q, showing concentrations of (4.13 ± 0.42 and 6.74 ± 0.55 μg mL−1, respectively). For 90 and 105 DAT, the highest concentration was observed in the combination of Q + BS (0.73 ± 0.08 and 13.87 ± 0.82 μg mL−1, respectively), followed by the application of BS with 3.34 ± 0.20 μg mL−1, which showed no significant differences. The application of BS showed no differences compared to T at 60 and 90 DAT, with a concentration of 2.69 ± 0.03 μg mL−1, nor with the combination of Q + BS, which presented the lowest concentration of chlorophyll B (1.96 ± 0.33 μg mL−1). It was observed that the combination of Q + BS and the individual application of Q showed promising results in the concentrations of chlorophyll A and B at different evaluation times. These findings suggest the potential of these treatments to enhance photosynthesis and, consequently, the growth and development of Chile Soledad plants under specific conditions.
3.6 Cellular Extract Content of Petiole
The analysis of sap in the petiole allowed establishing the relationship between the application of chitosan, Bacillus subtilis, and the combination of UNPA chitosan with Bacillus subtilis in the variables of electrical conductivity (μs cm−1) (A), pH (B), and Brix degrees (C) at 30, 60, 90, and 105 days after transplanting (DAT), as shown in Fig. 5. It was determined that at 30, 60, and 105 DAT, there were no significant differences in electrical conductivity among the treatments compared to the control (T); however, at 90 DAT, the treatment that presented the highest electrical conductivity was T (600 μs cm−1), which showed a significant difference compared to the other treatments, followed by the application of Q (453 ± 17.55 μs cm−1). Regarding the treatment with BS, it presented a conductivity of (364.66 ± 2.90 μs cm−1), while the combined treatment Q + BS had the lowest electrical conductivity (246.33 ± 11.34 μs cm−1). Concerning the pH values recorded (B), from 30 DAT, the pH of the crop did not show significant differences among the treatments, remaining above 5 ± 0.40; at 60 DAT, the treatments with the highest pH were BS (6 ± 0.40) and T (6.1 ± 0.05), with no significant differences between them. At 90 DAT, the BS and T treatments presented a pH of 6.1 ± 0.03, with no significant differences between them, while Q had a pH of (4.7 ± 0.05) and Q + BS (3.06 ± 0.03). Finally, at 105 DAT, the treatments with the highest pH were Q + BS and T (5.5 ± 0.05), with no significant differences between them, nor between Q and BS (4.76 ± 0.12) and (5.03 ± 0.03), respectively. Lastly, regarding the concentration of Brix degrees (Fig. 6C), at 30, 60, 90, and 105 DAT, the treatment with the highest concentration was observed with the application of Q, with values exceeding 3 ± 0.03. However, at 30 DAT, there were no significant differences compared to the combined treatment Q + BS, which showed a value of 2.53 ± 0.06. At 60 DAT, significant differences were observed among all treatments, where BS, T, and Q + BS had values of 3.76 ± 0.06, 3 ± 0.05, and 2.26 ± 0.03, respectively. At 90 DAT, the combined application Q + BS presented values of 3.1 ± 0.01, followed by the control with values of 2.7 ± 0.0, while BS had the lowest values of 2.1 ± 0.0. Similarly, at 105 DAT, it was determined that the highest value, followed by Q, was T with values of 3.76 ± 0.0; however, for the combined application Q + BS and BS, no significant differences were observed (2.16 ± 0.12 and 1.8 ± 0.05).
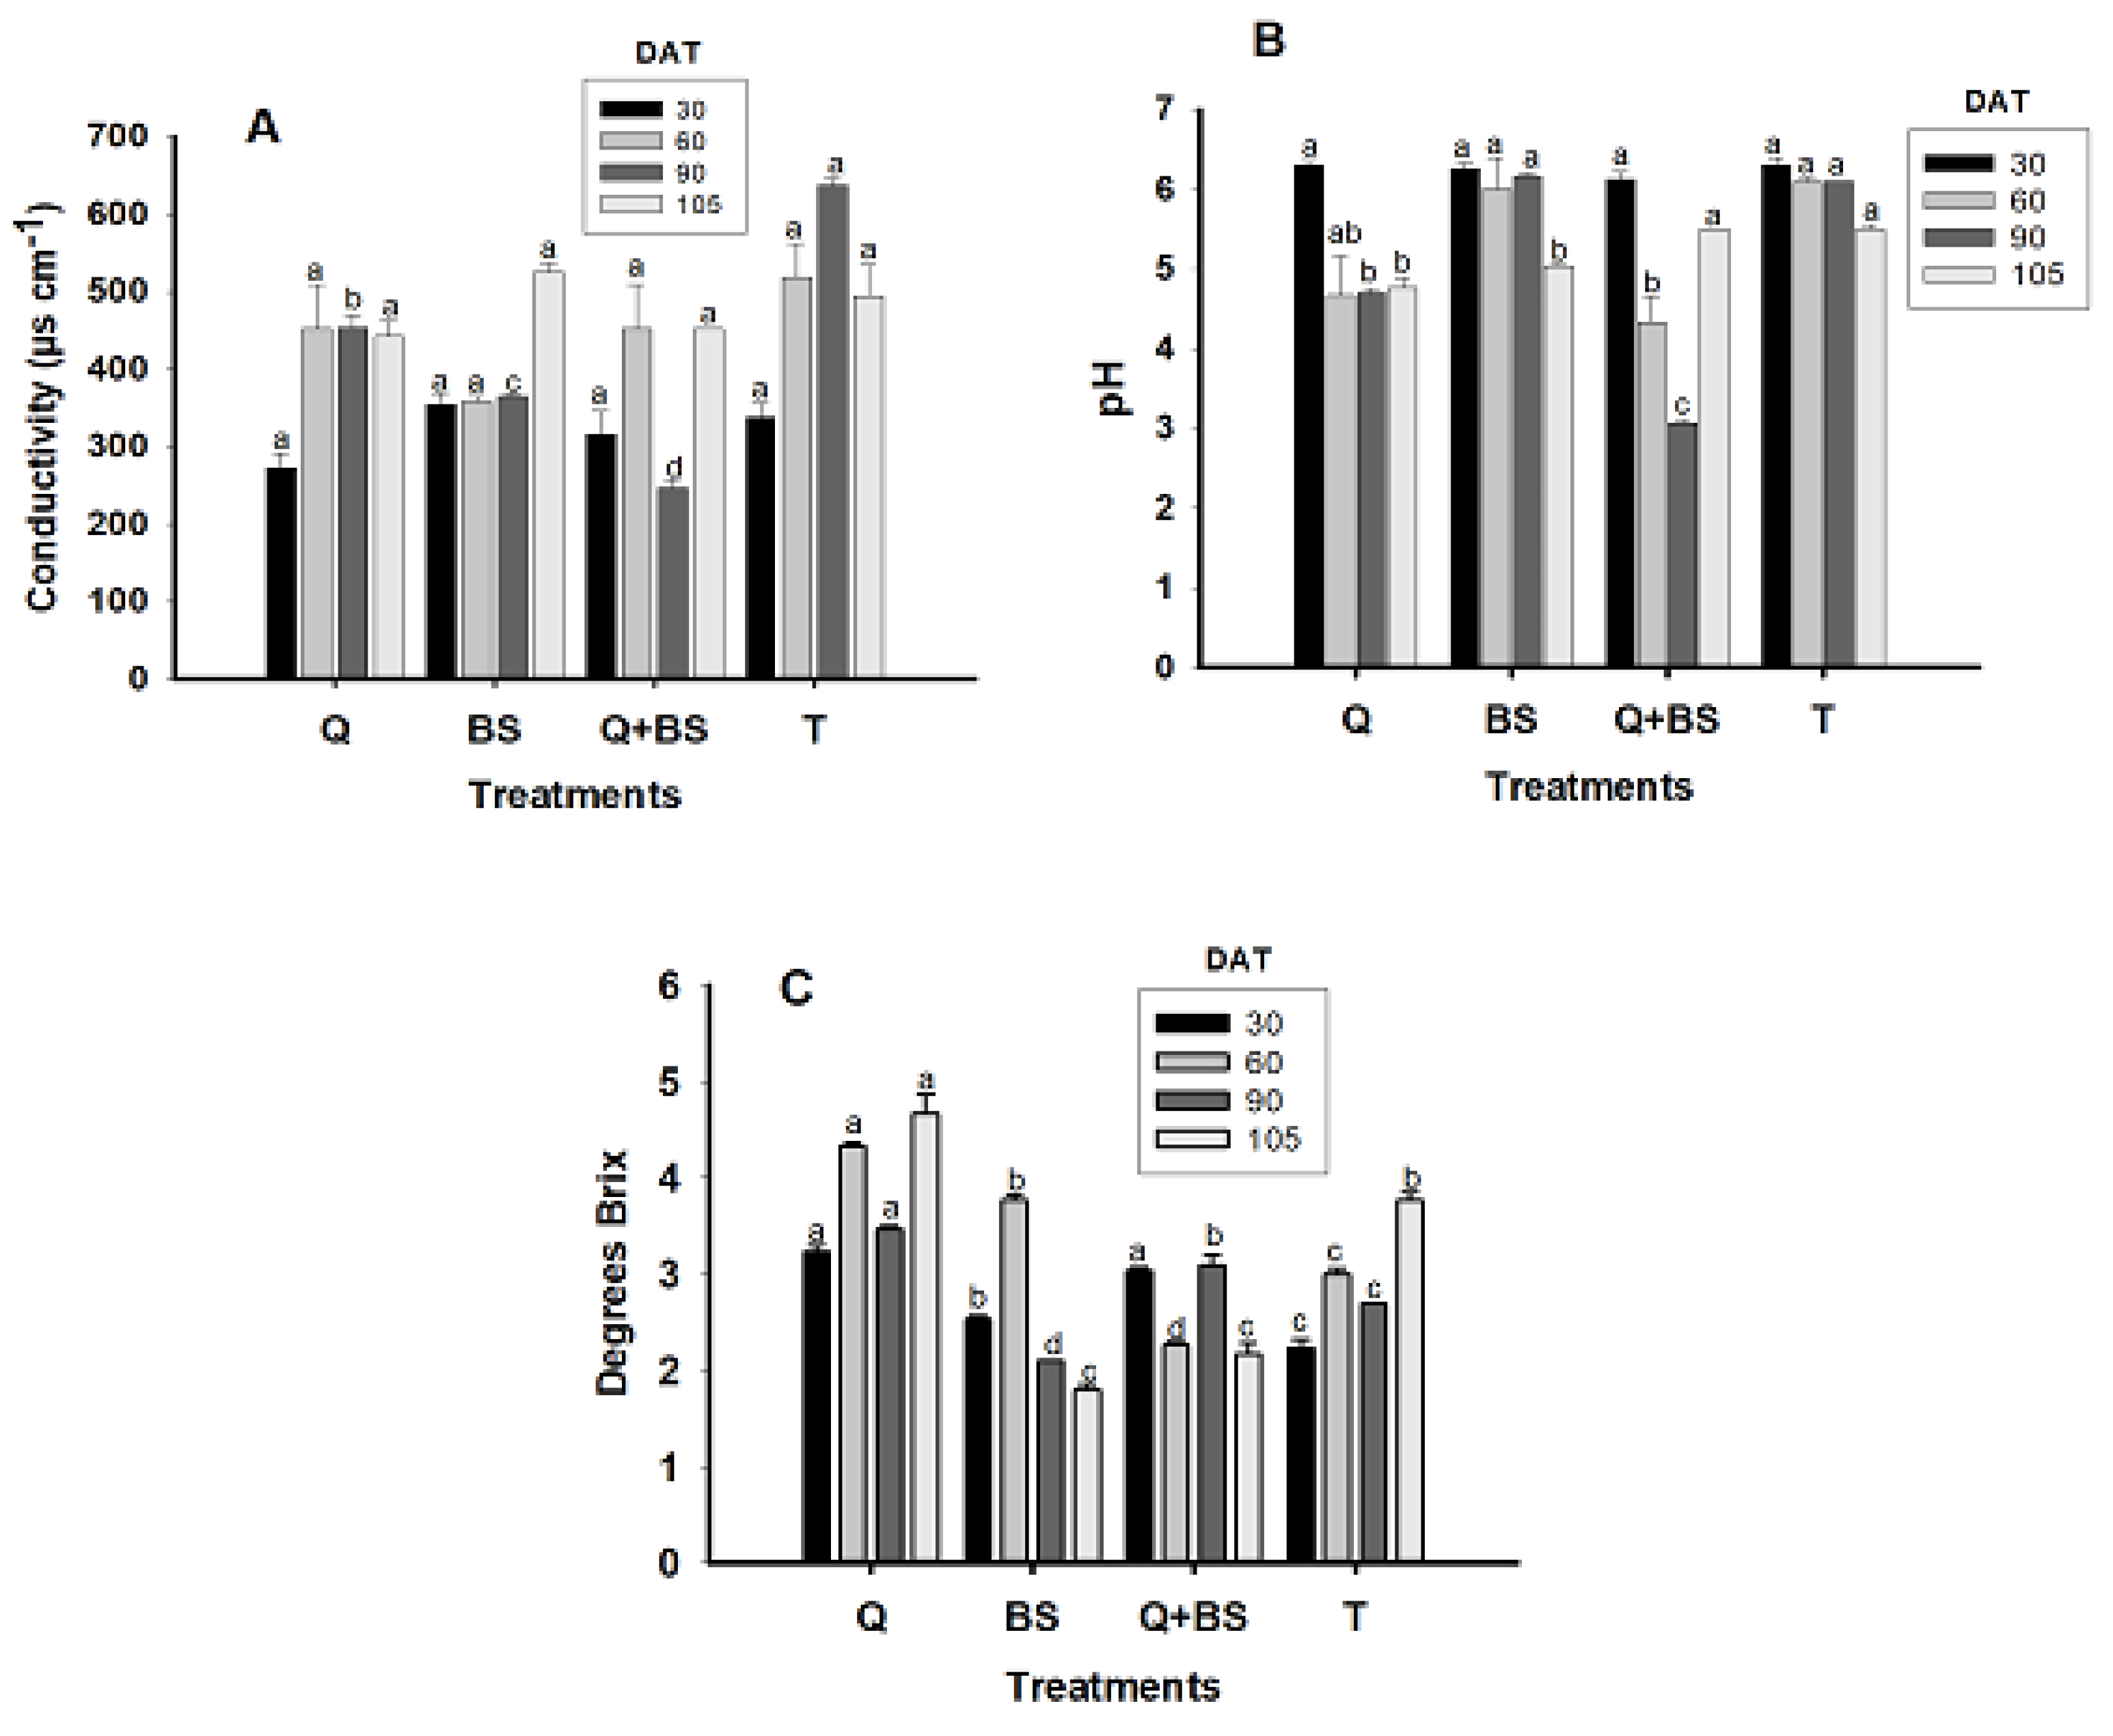
Figure 5: Electrical conductivity (dS m−1) (A), pH (B), and soluble solids (°Brix) (C) in Chile Soledad (Capsicum annuum L.), evaluated at 30, 60, 90, and 105 days after transplanting (DAT). Each value represents the mean ± standard error (n = 20). Treatments: Q = UNPA chitosan, BS = Bacillus subtilis, Q + BS = UNPA chitosan + Bacillus subtilis, and T = Control. Columns sharing the same letter are not significantly different according to Tukey’s test (p < 0.05).
The results of the concentration of nitrates, phosphates, and potassium in sap (mg L−1) evaluated at 30, 60, 90, and 105 DAT for each treatment are shown in Fig. 6. At the end of the evaluation, it was determined that the highest concentration of nitrates at 30, 60, 90, and 105 DAT was found in the treatment with Q, showing values exceeding (1000 ± 33.33 mg L−1); however, at 30, 60, and 90 DAT, no significant differences were observed with the treatment with BS, which showed values exceeding (900 ± 33.33 mg L−1). However, at 60 and 90 DAT, no significant differences were shown between treatments compared to the control, but differences were noted at 105 DAT. Regarding the concentration of phosphates present in the sap, it was determined that the highest concentration at 30, 60, 90, and 105 DAT was found with the application of BS, showing values of (820 ± 20.81, 430 ± 51.96, 992.66 ± 3.17, and 490 ± 40.41 mg L−1), respectively; however, at 60 DAT, no significant difference was shown compared to the application with Q and the combination of Q + BS. Regarding the concentration of potassium, it was determined that at 30, 60, and 90 DAT, no significant differences were observed concerning the treatments, but at 90 DAT, the combination of Q + BS showed a higher concentration (1566.66 ± 33.33 mg L−1); however, it did not present differences compared to treatments Q and BS.
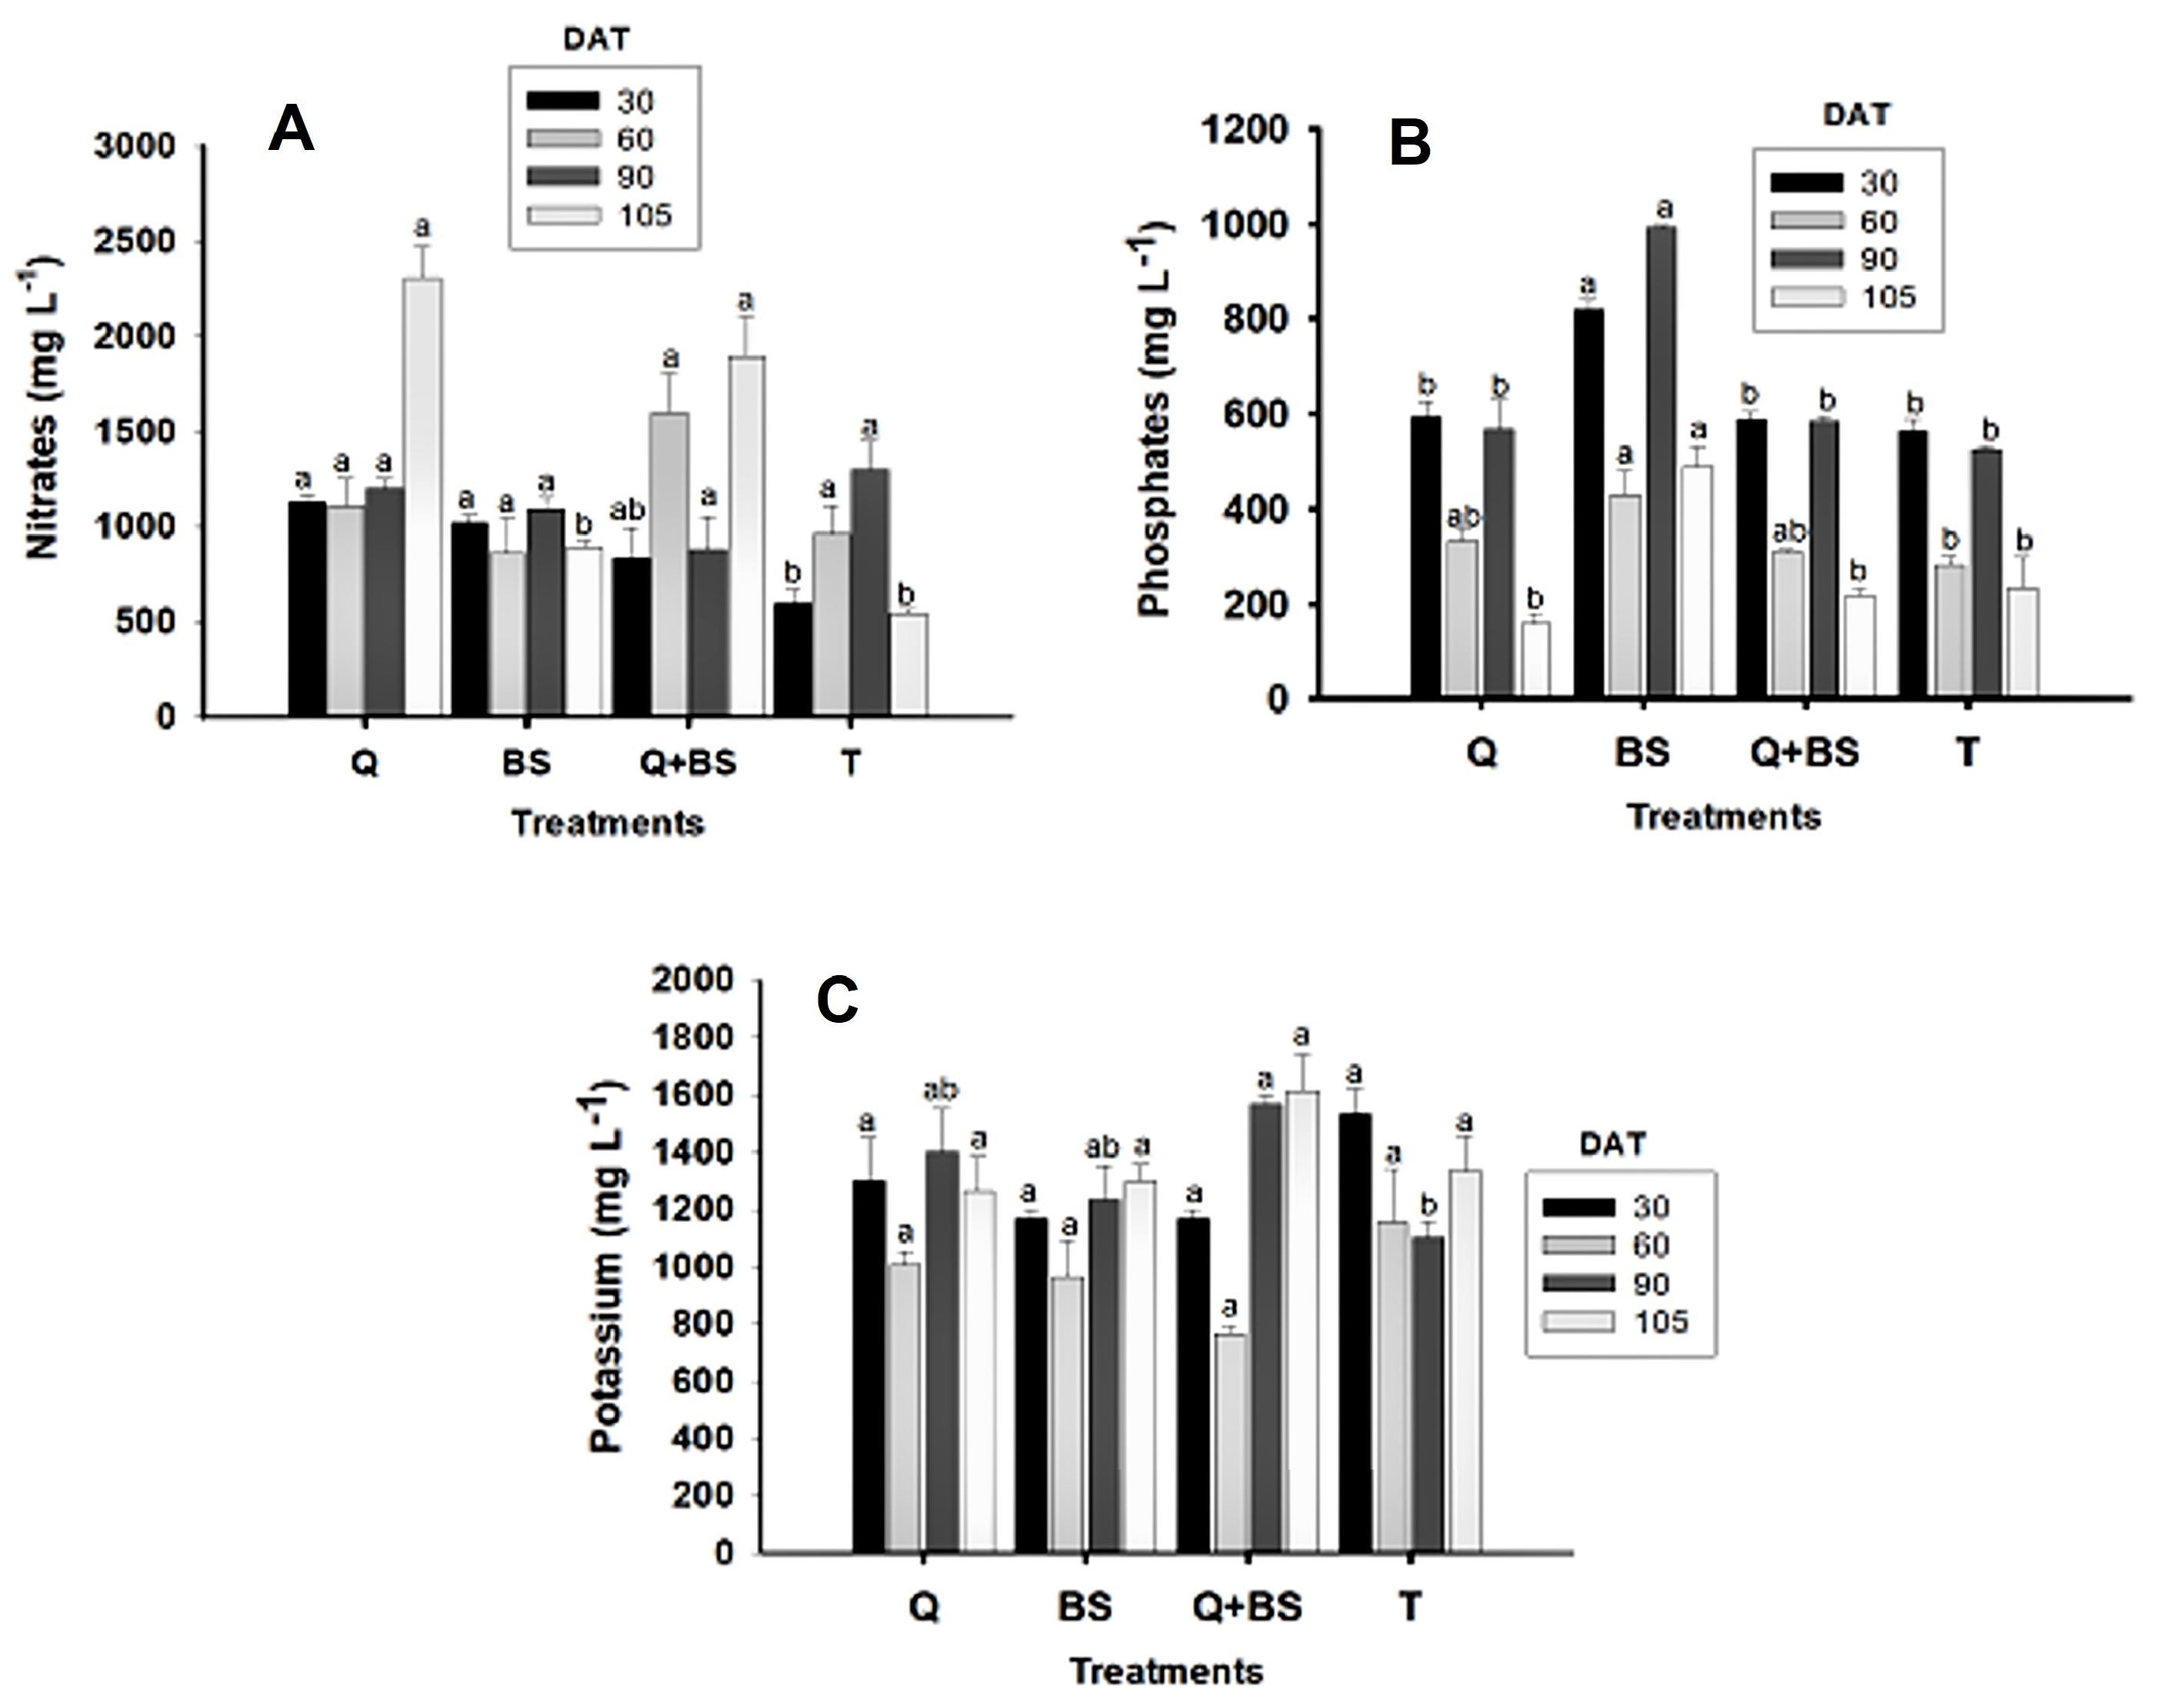
Figure 6: Nutritional variables: nitrate concentration in sap (mg L−1) (A), phosphorus in sap (mg L−1) (B), and potassium in sap (mg L−1) (C) in Chile Soledad (Capsicum annuum L.), evaluated at 30, 60, 90, and 105 days after transplanting (DAT). Each value represents the mean ± standard error (n = 20). Treatments: Q = UNPA chitosan, BS = Bacillus subtilis, Q + BS = UNPA chitosan + Bacillus subtilis, and T = Control. Columns sharing the same letter are not significantly different according to Tukey’s test (p < 0.05).
Table 4 shows the repeated-measures ANOVA for the growth, physiological, and nutritional pa-rameters of Capsicum annuum L. evaluated over time. Significant main effects (p < 0.05) of both treatment and sampling time were detected for all analyzed variables, whereas the treatment × time interaction was not significant for most parameters. The combined treatment Q + BS (UNPA chitosan + Bacillus subtilis) resulted in the highest mean values of plant height, stem diameter, chloro-phyll a and b contents, and sap electrical conductivity. These results indicate a synergistic effect between the bioelicitor and the rhizospheric bacterium, which together enhanced photosynthetic efficiency and nutrient uptake throughout plant development.
Table 4: Repeated-measures ANOVA for growth, physiological, and nutritional variables of Soledad chili pepper (Capsicum annuum L.) evaluated over time.
| Variable | Source of Variation | df | MS | F | p |
|---|---|---|---|---|---|
| Plant height (cm) | Treatment | 3 | 248.62 | 18.75 | <0.0001 |
| Time (DAS) | 6 | 1,138.43 | 85.6 | <0.0001 | |
| Treatment × Time | 18 | 24.71 | 1.85 | 0.084 | |
| Error | 532 | 13.31 | — | — | |
| Stem diameter (mm) | Treatment | 3 | 0.091 | 14.65 | <0.0001 |
| Time (DAS) | 6 | 0.185 | 29.74 | <0.0001 | |
| Treatment × Time | 18 | 0.008 | 1.29 | 0.26 | |
| Error | 532 | 0.006 | — | — | |
| Number of leaves | Treatment | 3 | 22.51 | 7.32 | 0.0001 |
| Time (DAS) | 6 | 152.18 | 49.5 | <0.0001 | |
| Treatment × Time | 18 | 3.42 | 1.11 | 0.35 | |
| Error | 532 | 3.07 | — | — | |
| Chlorophyll A (μg mL−1) | Treatment | 3 | 9.35 | 11.88 | <0.0001 |
| Time (DAT) | 3 | 38.45 | 49.75 | <0.0001 | |
| Treatment × Time | 9 | 1.18 | 1.53 | 0.14 | |
| Error | 228 | 0.77 | — | — | |
| Chlorophyll B (μg mL−1) | Treatment | 3 | 15.26 | 14.95 | <0.0001 |
| Time (DAT) | 3 | 102.43 | 100.37 | <0.0001 | |
| Treatment × Time | 9 | 1.43 | 1.41 | 0.18 | |
| Error | 228 | 1.01 | — | — | |
| Electrical conductivity (μS cm−1) | Treatment | 3 | 28,450.6 | 8.21 | <0.0001 |
| Time (DAT) | 3 | 15,870.2 | 4.57 | 0.004 | |
| Treatment × Time | 9 | 3451.7 | 0.99 | 0.45 | |
| Error | 228 | 3467.9 | — | — | |
| Sap pH | Treatment | 3 | 0.34 | 3.87 | 0.01 |
| Time (DAT) | 3 | 0.55 | 6.32 | 0.0004 | |
| Treatment × Time | 9 | 0.06 | 0.74 | 0.67 | |
| Error | 228 | 0.08 | — | — | |
| Nitrate (mg L−1) | Treatment | 3 | 420,000 | 21.43 | <0.0001 |
| Time (DAT) | 3 | 1,120,000 | 57.12 | <0.0001 | |
| Treatment × Time | 9 | 21,000 | 1.07 | 0.39 | |
| Error | 228 | 19,600 | — | — | |
| Phosphate (mg L−1) | Treatment | 3 | 260,000 | 18.88 | <0.0001 |
| Time (DAT) | 3 | 310,000 | 22.47 | <0.0001 | |
| Treatment × Time | 9 | 17,000 | 1.22 | 0.28 | |
| Error | 228 | 13,900 | — | — | |
| Potassium (mg L−1) | Treatment | 3 | 450,000 | 6.84 | 0.0002 |
| Time (DAT) | 3 | 280,000 | 4.25 | 0.006 | |
| Treatment × Time | 9 | 30,000 | 0.62 | 0.76 | |
| Error | 228 | 48,000 | — | — |
3.7 Number of Fruits and Yield per Plant.
The following presents the results obtained from the number of fruits per treatment for each cut made in the experiment. The first cut was made 69 days after transplanting (DAT), the second at 85 DAT, and the third and final cut at 106 DAT. The results are detailed in Table 5. In the first cut, the combination of Q + BS showed the highest number of fruits (22.0 ± 3.08 fruits), while the Q treatment presented the lowest number (16.0 ± 3.47). However, no significant differences were found between the treatments. In the second harvest, the highest number of fruits was recorded with the application of BS (49.80 ± 5.78 fruits), but no significant differences were observed between the Q and Q + BS treatments, although there were differences compared to the control (T), which had the lowest number of fruits. For the last harvest, the highest number of fruits was observed in the Q application (41.55 ± 4.11 fruits). Similarly, no significant differences were found between the Q + BS and BS treatments, but differences were noted compared to the control, which showed the lowest number of fruits per plant. The application of the biofertilizers did not show significant differences in the total weight of the fruit in cuts 1 and 3. In contrast, in cut 2, significant differences were observed between treatments compared to the control, with the Q application showing the highest fruit weight at 110.74 ± 11.07. These results are shown in Table 6.
Table 5: Number of fruits per plant in Chile Soledad (Capsicum annuum L.) under different treatments (mean ± standard error, n = 20), evaluated at three harvests: 69, 85, and 106 days after transplanting (DAT).
| Treatment | CUT 1 69 DAT | CUT 2 85 DAT | CUT 3 106 DAT |
|---|---|---|---|
| UNPA Chitosan | 16.0 ± 3.47a | 46.85 ± 4.94a | 41.55 ± 4.11a |
| Bacillus subtilis | 17.4 ± 1.81a | 49.80 ± 5.78a | 34.55 ± 3.36a |
| UNPA Chitosan + Bacillus subtilis | 22.0 ± 3.08a | 35.15 ± 2.39a | 35.75 ± 2.19a |
| Control | 19.35 ± 3.09a | 18.45 ± 2.34b | 19.95 ± 1.43b |
Table 6: Fruit yield (g per plant) of Chile Soledad (Capsicum annuum L.) under different treatments (mean ± standard error, n = 20).
| Treatment | CUT 1 69 DAT | CUT 2 85 DAT | CUT 3 106 DAT |
|---|---|---|---|
| UNPA Chitosan | 31.85 ± 8.02a | 110.74 ± 11.07a | 104.25 ± 8.36a |
| Bacillus subtilis | 34.05 ± 3.96a | 106.43 ± 11.40a | 60.90 ± 6.38a |
| UNPA Chitosan + Bacillus subtilis | 21.99 ± 3.08a | 79.67 ± 7.06a | 103.81 ± 42.67a |
| Control | 46.85 ± 7.04a | 34.54 ± 4.31b | 36.68 ± 2.63a |
The analysis of the effect of biofertilizers on the accumulated yield per plant from the three cuts performed is presented in Fig. 7. In the representation of the number of fruits by treatment (A), it is highlighted that the highest number of fruits was obtained with the application of Q (104.4 ± 6.02 fruits). However, no significant differences were found compared to the treatments with BS and Q + BS, which presented averages of (101.75 ± 7.56 and 91.89 ± 5.19 fruits), respectively.
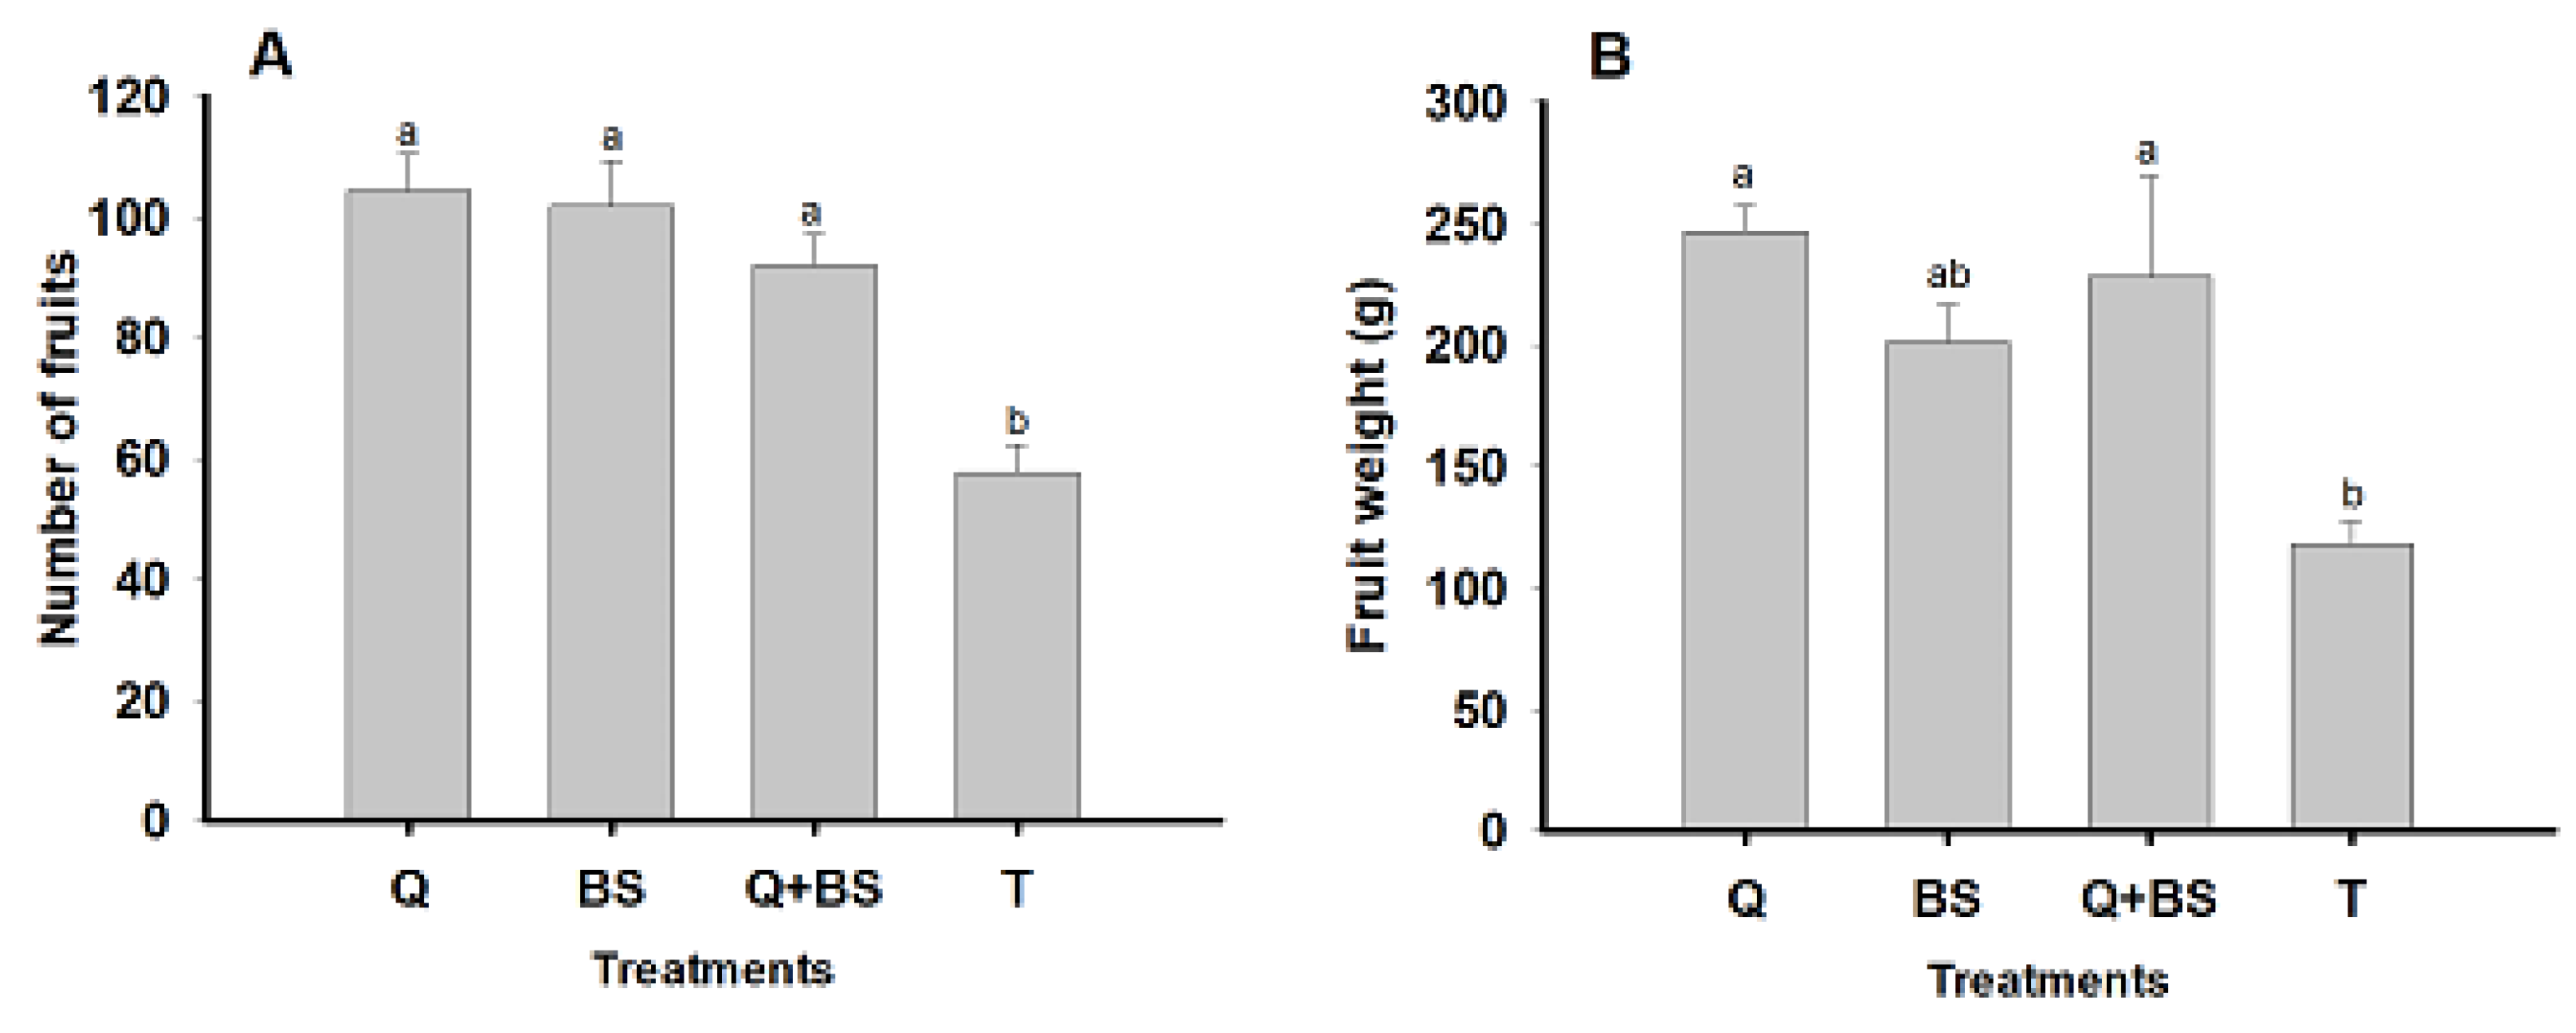
Figure 7: Effect of biofertilizer treatments on the number of fruits per plant (A) and fruit weight (g per plant) (B) in Chile Soledad (Capsicum annuum L.), evaluated under four treatments: Q = UNPA chitosan, BS = Bacillus subtilis, Q + BS = UNPA chitosan + Bacillus subtilis, and T = Control. Each value represents the mean ± standard error (n = 20). Columns sharing the same letter are not significantly different according to Tukey’s test (p < 0.05).
Significant differences were observed regarding the treatment T, which showed the lowest number of fruits (57.75 ± 4.65). As for the accumulated weight per plant in grams (B), the highest amount was evidenced with the application of Q (246.86 ± 10.66 g). However, no significant differences were found compared to the application with Q + BS (228.04 ± 41.76 g). In contrast, the application with BS yielded (201.37 ± 15.39 g) per plant, with no significant differences compared to the control, which showed the lowest fruit weight. In summary, the results show that the application of Q led to a higher number and weight of fruits per plant compared to the treatments with BS and Q + BS. Additionally, a significant difference in fruit yield was observed between the treatments and the control, highlighting the positive impact of the application of biofertilizers, particularly Q, on the yield of Soledad chile.
Next, Fig. 8 presents the data obtained on the morphology for fruit quality from the first harvest. Variables such as fruit length (cm) (A), fruit diameter (cm) (B), fruit weight (g) (C), pericarp thickness (cm) (D), and number of locules (E) in three different sizes (small, medium, and large) were analyzed. It was determined that the fruit length in all three sizes was greater when the combined treatment Q + BS was applied, with averages of (5.32 ± 0.1, 6.29 ± 0.2, and 7.72 ± 0.2 cm) for the small, medium, and large sizes, respectively.
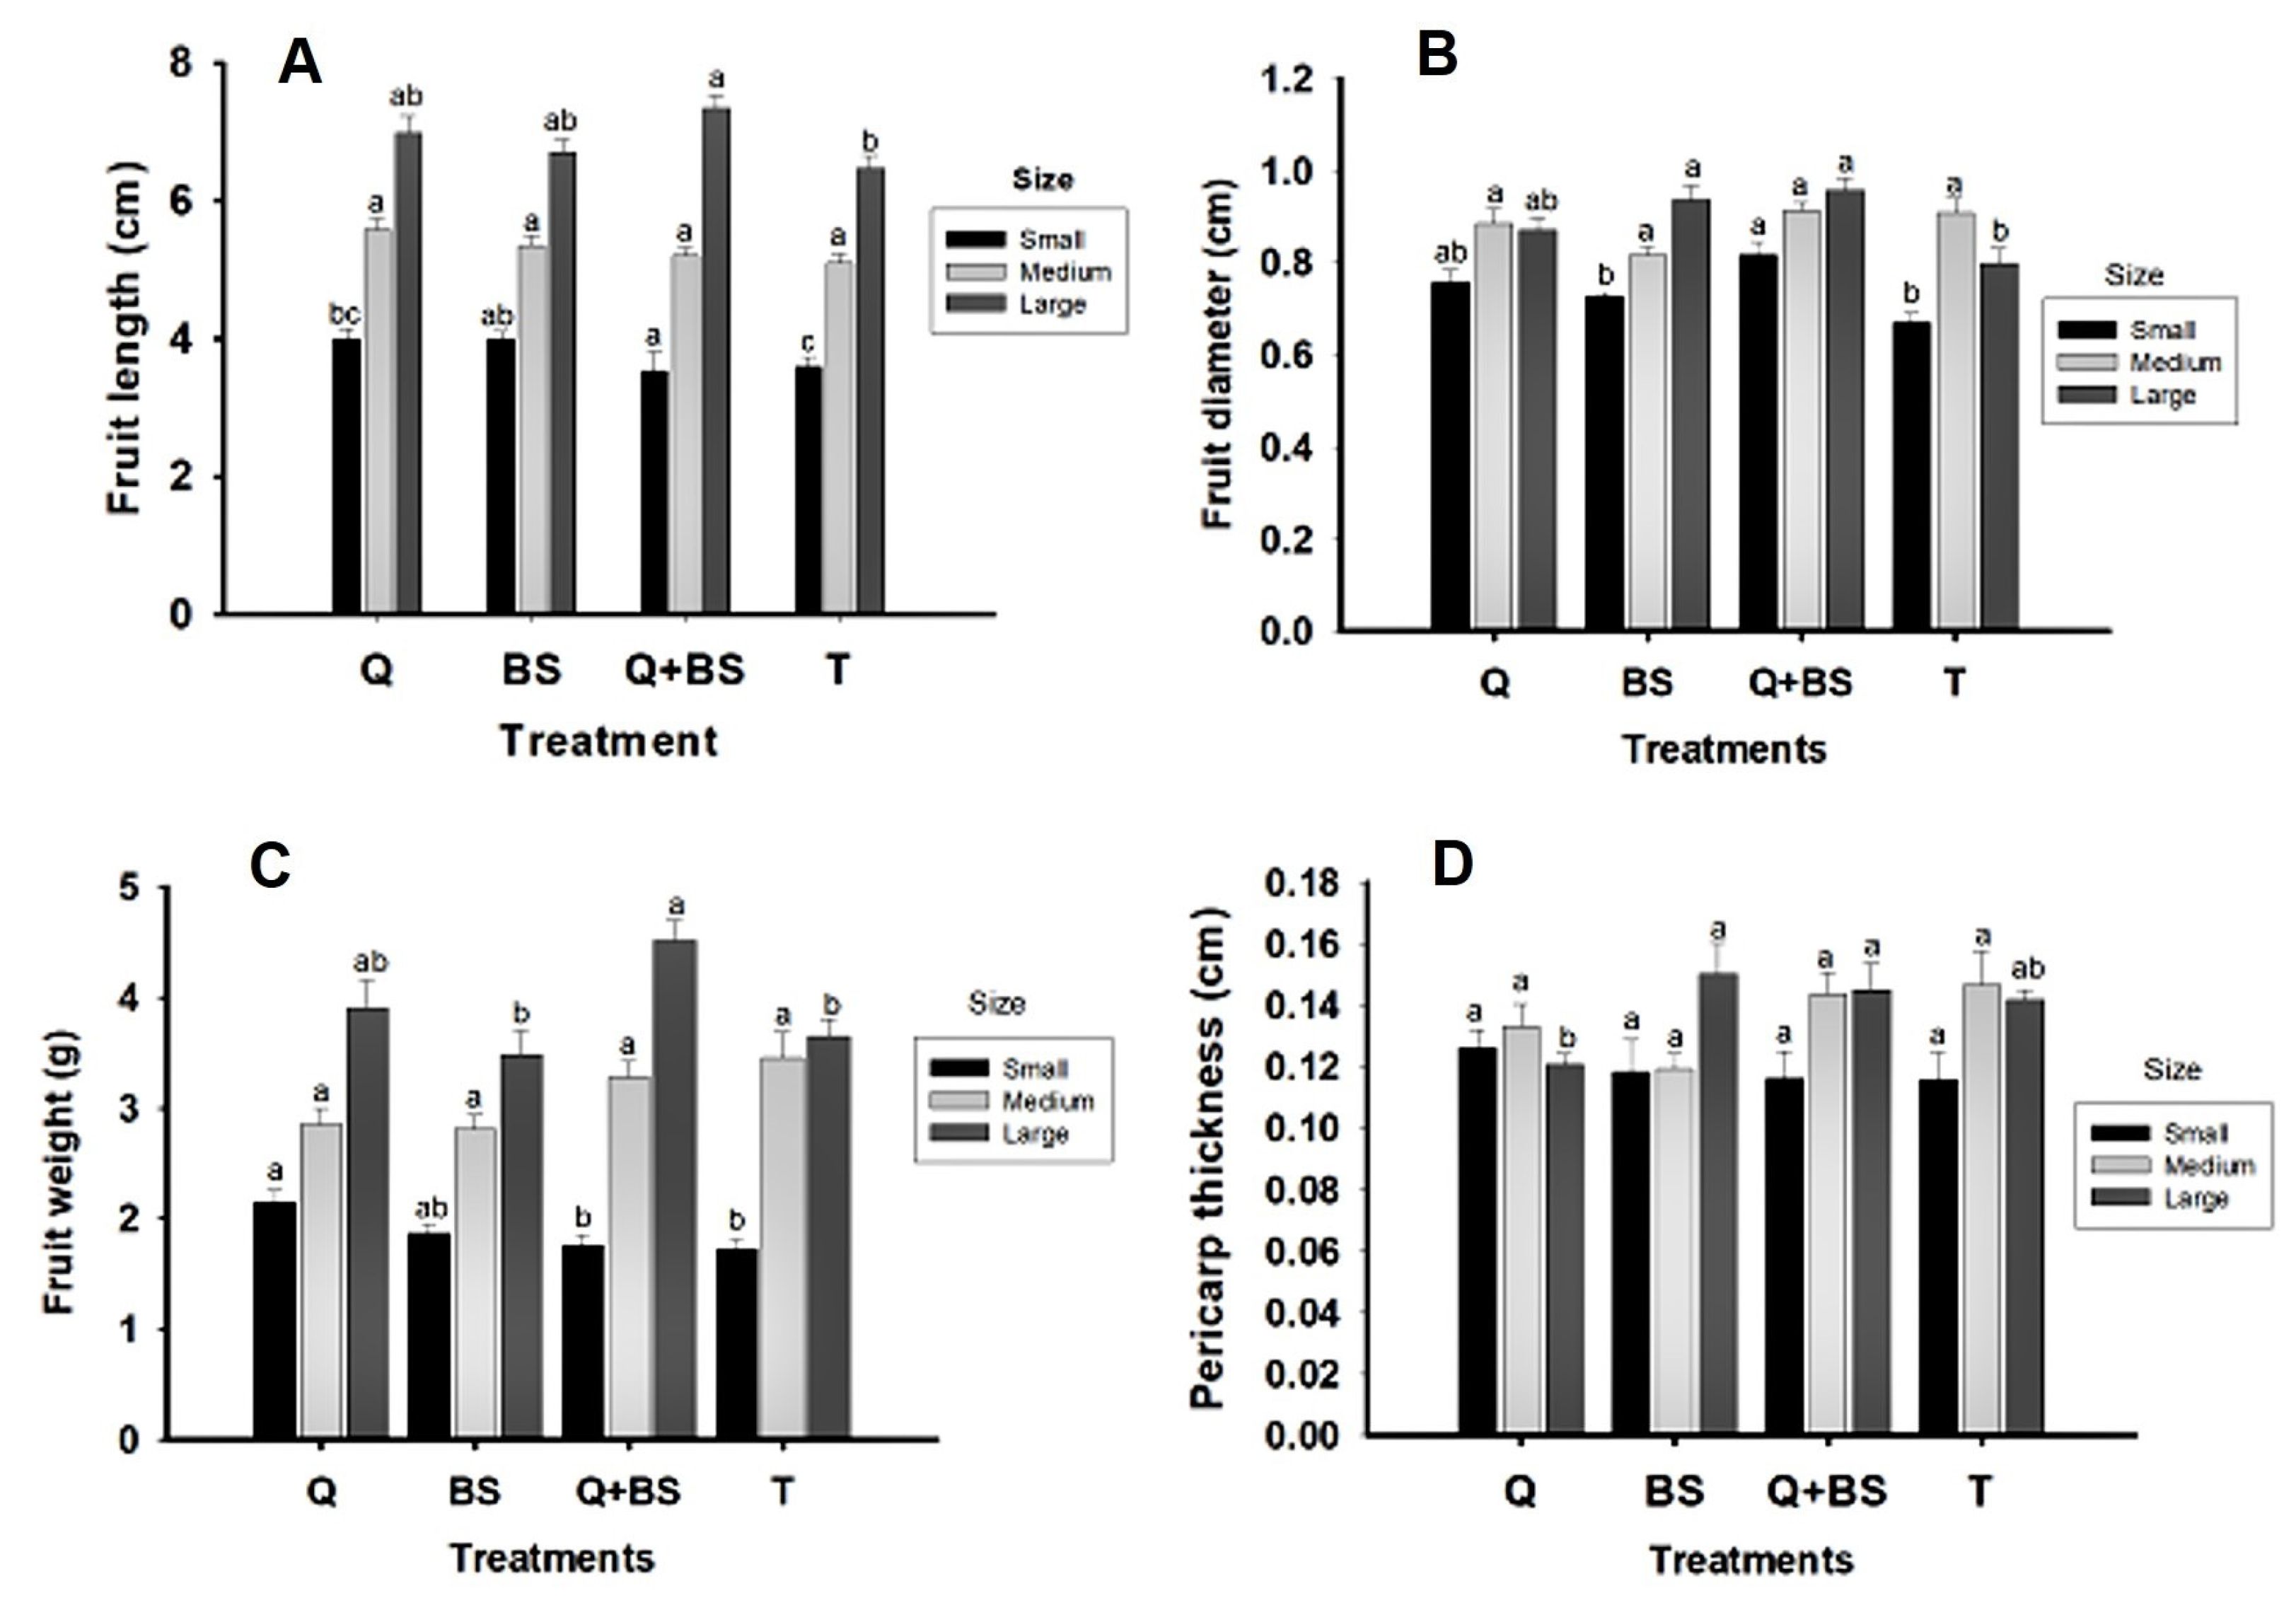
Figure 8: Morphological quality variables of fruits from the first harvest of Chile Soledad (Capsicum annuum L.): fruit length (A), fruit diameter (B), fruit weight (g) (C), and pericarp thickness (D), classified by size (small, medium, and large), under four treatments: Q = UNPA chitosan, BS = Bacillus subtilis, Q + BS = UNPA chitosan + Bacillus subtilis, and T = Control. Each value represents the mean ± standard error (n = 20). Columns sharing the same letter are not significantly different according to Tukey’s test (p < 0.05).
However, in the small size, there were no differences compared to the treatment with BS, and in the medium size, no significant differences were observed among the other treatments. Regarding fruit diameter, the largest diameter was shown in the application with Q + BS, with values of (8.17 ± 0.3, 8.36 ± 0.3, and 9.56 ± 0.3), respectively for small, medium, and large sizes. In terms of fruit weight, in the small size classification, the heaviest fruits were found in the application with Q, followed by BS (2.15 ± 0.1 and 1.87 ± 0.1 g), respectively, with no significant differences between both treatments. In the large size classification, the combination of Q + BS showed the greatest fruit weight, followed by the application with Q. Regarding pericarp thickness, in the small, medium, and large classifications, a greater thickness was observed with the combined treatment Q + BS; however, in the small size, no significant differences were found compared to the treatment with Q, but there were differences compared to the BS treatment and the control. In summary, the results indicate that the application of the combined treatment Q + BS showed significant improvements in various aspects of fruit morphology and quality, such as length, diameter, weight, and pericarp thickness, compared to the individual treatments and the control.
Fig. 9 presents the data obtained on the number of locules (E1) and the physicochemical quality variables in the fruits from the first harvest: degrees Brix (F1), percentage of citric acid (G1), and pH (H1). Regarding the number of locules, no significant differences were observed in the small and medium classifications, but significant differences were noted in the large category. The treatment with Q showed the highest number of locules, exceeding 5; however, it did not differ significantly from the treatments with BS and Q + BS, but did differ from the control treatment, which had an average of 4 locules.
In the physicochemical determinations of the fruit, it was observed that for the small size classification, the highest concentration of degrees Brix was found in the control (3.15), while Q and the combined treatment Q + BS showed lower concentrations (1.2 and 1.3, respectively), with no significant differences between both treatments. In the medium size, the highest concentration of degrees Brix was observed in the treatment with Q (3.8), showing significant differences compared to the other treatments, while BS and Q + BS had the lowest concentrations (1.9 and 2, respectively), with no significant differences between them. In the large classification, the highest concentration of degrees Brix was observed in Q and the control (2 and 2.3 ± 0.1, respectively), with no significant differences between them, but significant differences were observed compared to BS and the combined Q + BS.
Regarding the percentage of citric acid, in the small classification, treatment T showed the highest concentration (0.05%), with significant differences compared to the other treatments, while Q and Q + BS had the lowest concentration (0.01%), with no differences between them. For the medium size, the highest concentration was found in the combination Q + BS (0.04%), showing significant differences compared to the other treatments, but no differences between Q and BS (0.01 and 0.02%, respectively). In the large classification, the highest concentration of citric acid was observed with Q (0.049%), showing significant differences compared to the other treatments. When determining the pH, it was observed that in the small size classification, the treatment with Q presented a higher pH (5.9), with significant differences compared to the other treatments.
However, no differences were found among BS, Q + BS, and T. For the medium size, the highest pH was found in the treatments BS and Q (5.9), with no significant differences between them, but significant differences were noted compared to the other treatments, where Q + BS and T showed lower pH (5.7). In the large classification, the highest pH was presented in the combined treatment Q + BS (5.9); however, it did not differ significantly from the treatments with Q and BS (5.8), respectively, but it did differ from the T, which showed a pH of 5.6. The results indicate that the combined treatment Q + BS shows significant improvements in several physicochemical quality aspects compared to the individual treatments and the control, particularly highlighting the number of locules, degrees Brix concentration, percentage of citric acid, and pH, underscoring its effectiveness in improving fruit quality.
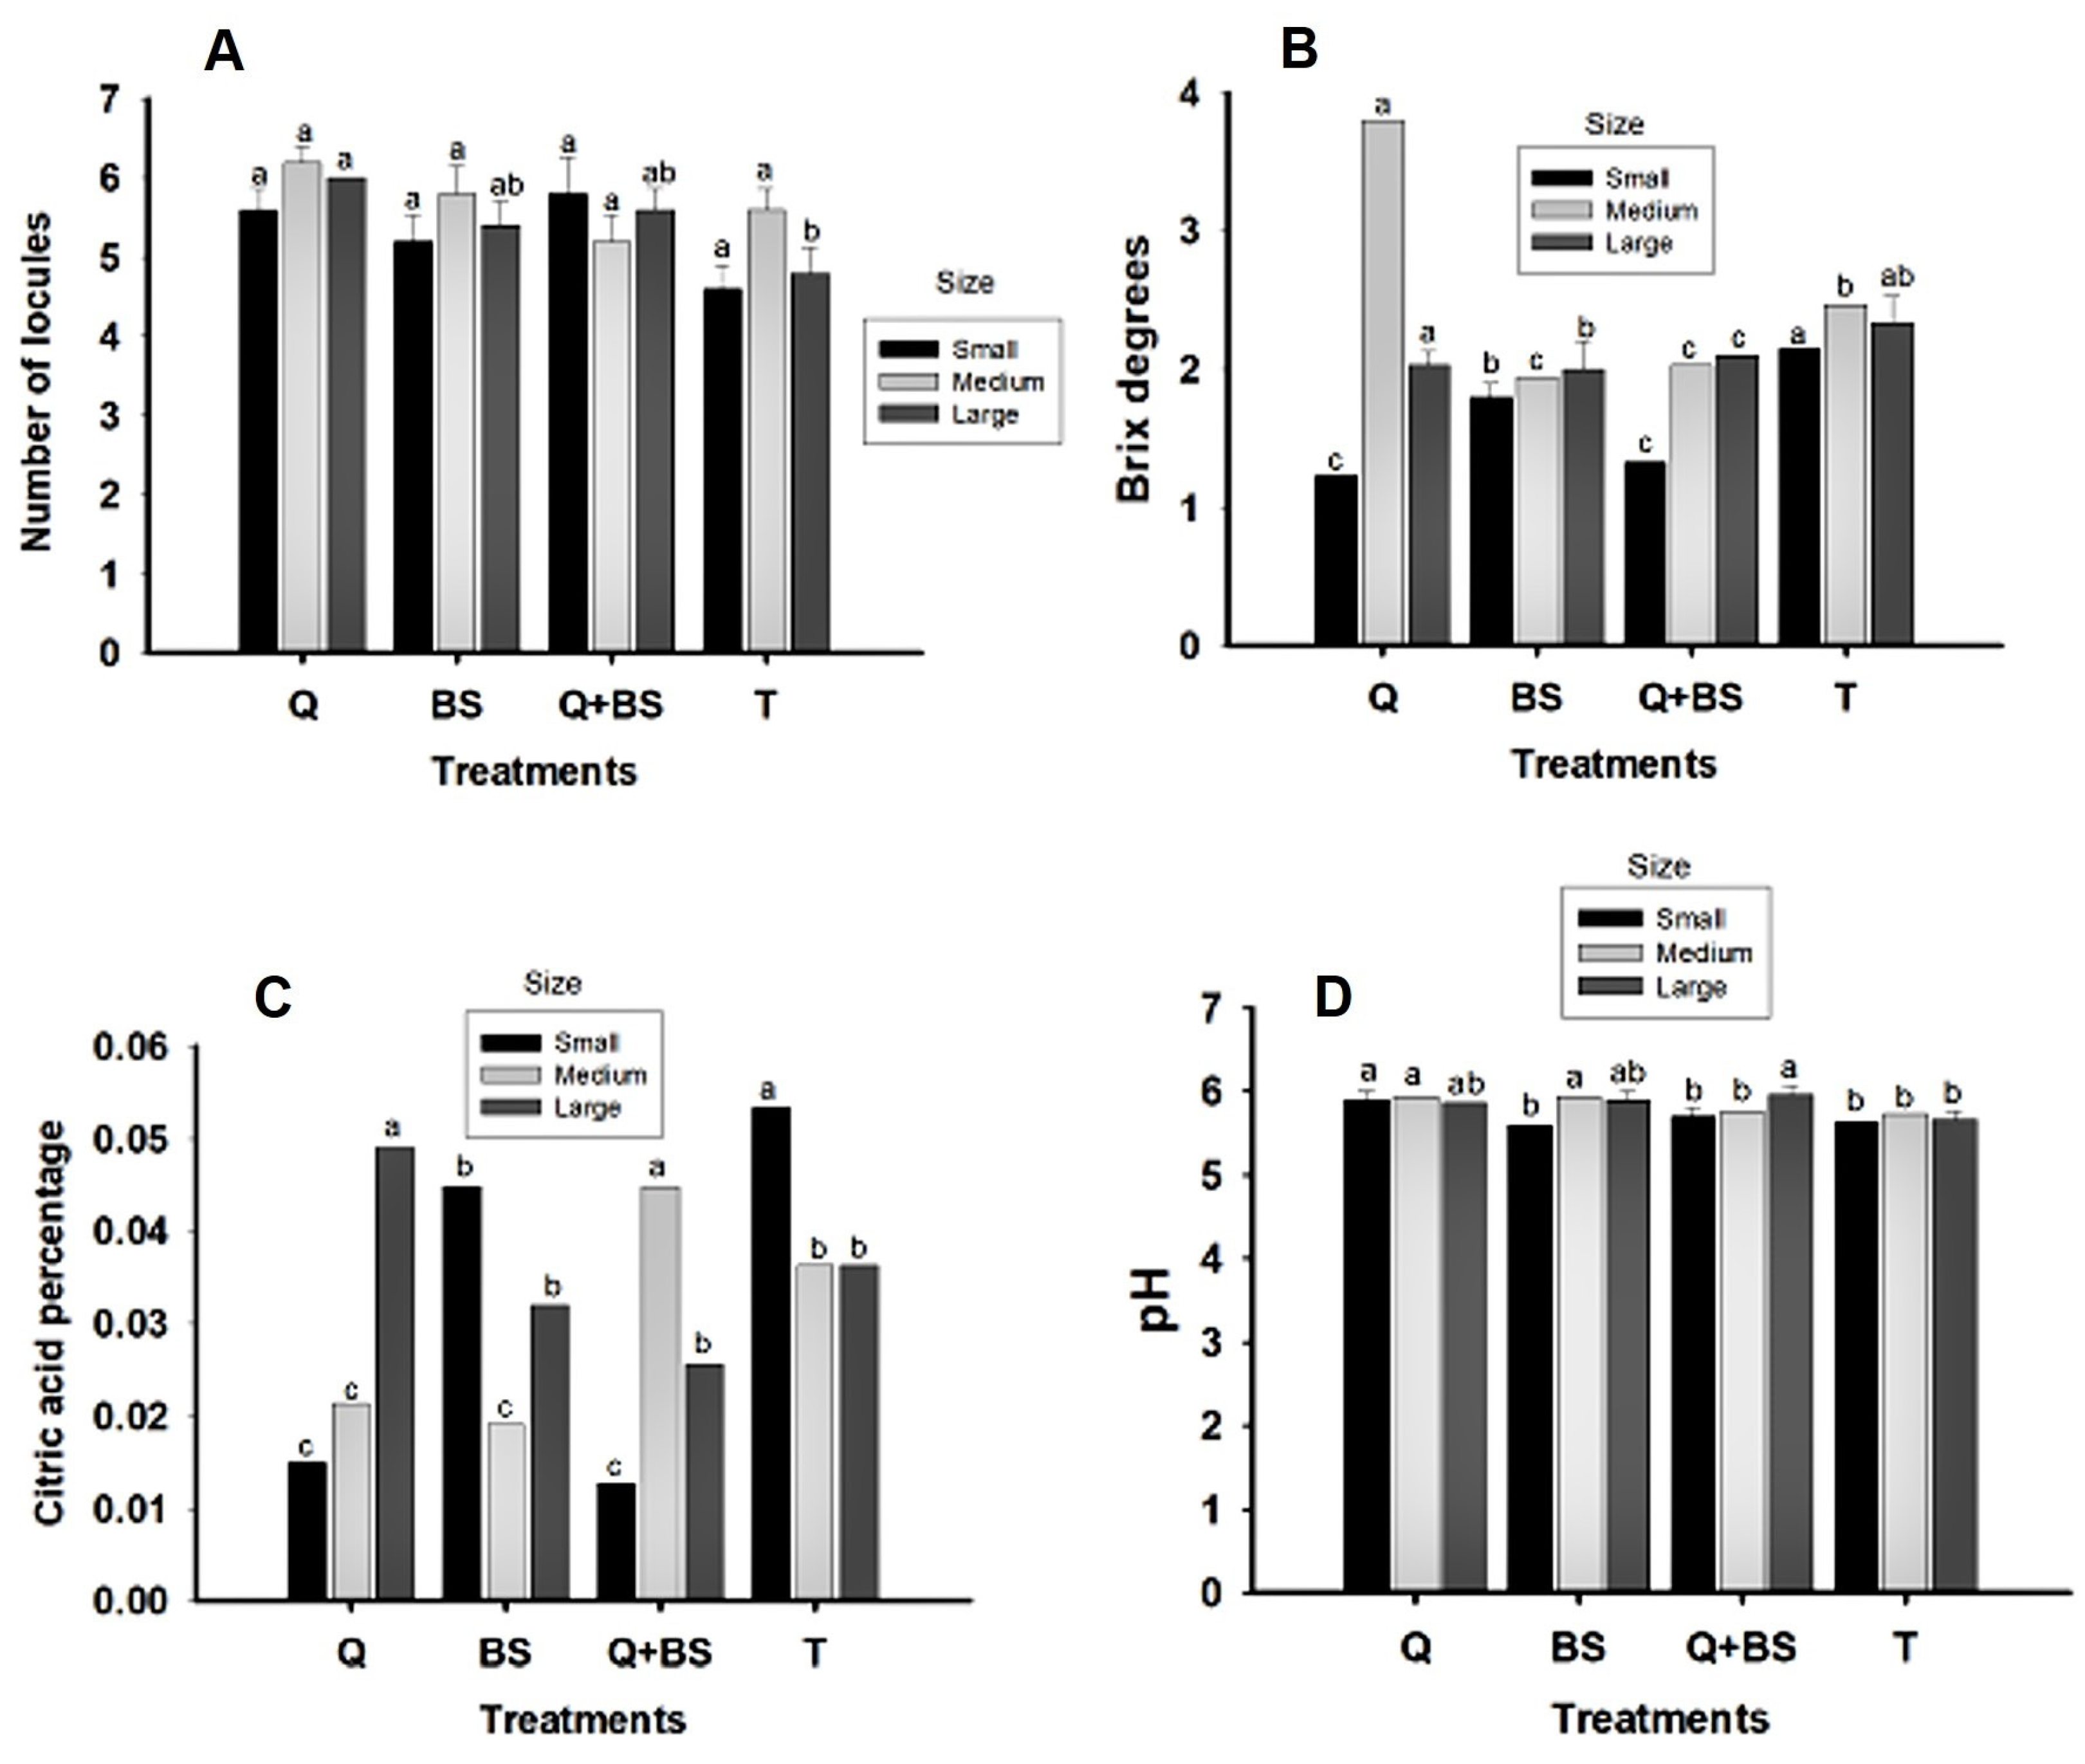
Figure 9: Physicochemical quality variables of fruits from the first harvest of Chile Soledad (Capsicum annuum L.): number of locules (A), soluble solids (°Brix) (B), citric acid content (%) (C), and pH (D), classified by size (small, medium, and large), under four treatments: Q = UNPA chitosan, BS = Bacillus subtilis, Q + BS = UNPA chitosan + Bacillus subtilis, and T = Control. Each value represents the mean ± standard error (n = 20). Columns sharing the same letter are not significantly different according to Tukey’s test (p < 0.05).
Fig. 10 presents morphological data on fruit quality from the second harvest. Variables analyzed include fruit length (cm) (A2), fruit diameter (cm) (B2), fruit weight (g) (C2), pericarp thickness (cm) (D2), and the number of locules (E) across three size classifications (small, medium, and large). For the fruit length variable, no differences were observed among treatments in the small and medium classifications. In the large classification, the combined treatment of Q + BS showed the greatest length (7.3 ± 0.2 cm), but no significant difference compared to the Q and BS treatments, which measured 6.9 and 6.7 ± 0.2 cm, respectively. However, both treatments differed from the control treatment (T), which had the shortest length (6.47 ± 0.2 cm).
Regarding fruit diameter, the highest diameter in the small classification was found in the Q treatment (0.802 ± 0.02 cm). There were no differences compared to the combined treatment Q + BS (0.692 ± 0.04 cm), but differences were noted between these and the BS and T treatments, although there were no significant differences between T and BS. In the medium size classification, no significant differences were found among the four treatments. Finally, in the large classification, the largest fruit diameter was in the combined treatment Q + BS (0.916 ± 0.03 cm), although it did not differ significantly from Q and BS treatments, but did differ from the control.
For fruit weight in the small classification, the BS treatment recorded the highest weight (2.02 ± 0.2 g), followed by the Q treatment (1.91 ± 0.1 g), with no significant differences between these treatments. In the medium classification, there were no significant differences among all treatments. In the large classification, the greatest fruit weight was noted in the Q + BS, Q, and BS treatments (4.11 ± 0.2, 4.02 ± 0.2, and 3.78 ± 0.1 g, respectively), showing no differences among these treatments but differing significantly from the control. Regarding pericarp thickness, no differences were found among treatments in the small and medium classifications. However, in the large classification, the BS treatment showed the greatest pericarp thickness, although it did not differ from the combined Q + BS and T treatments but did differ from the Q treatment.
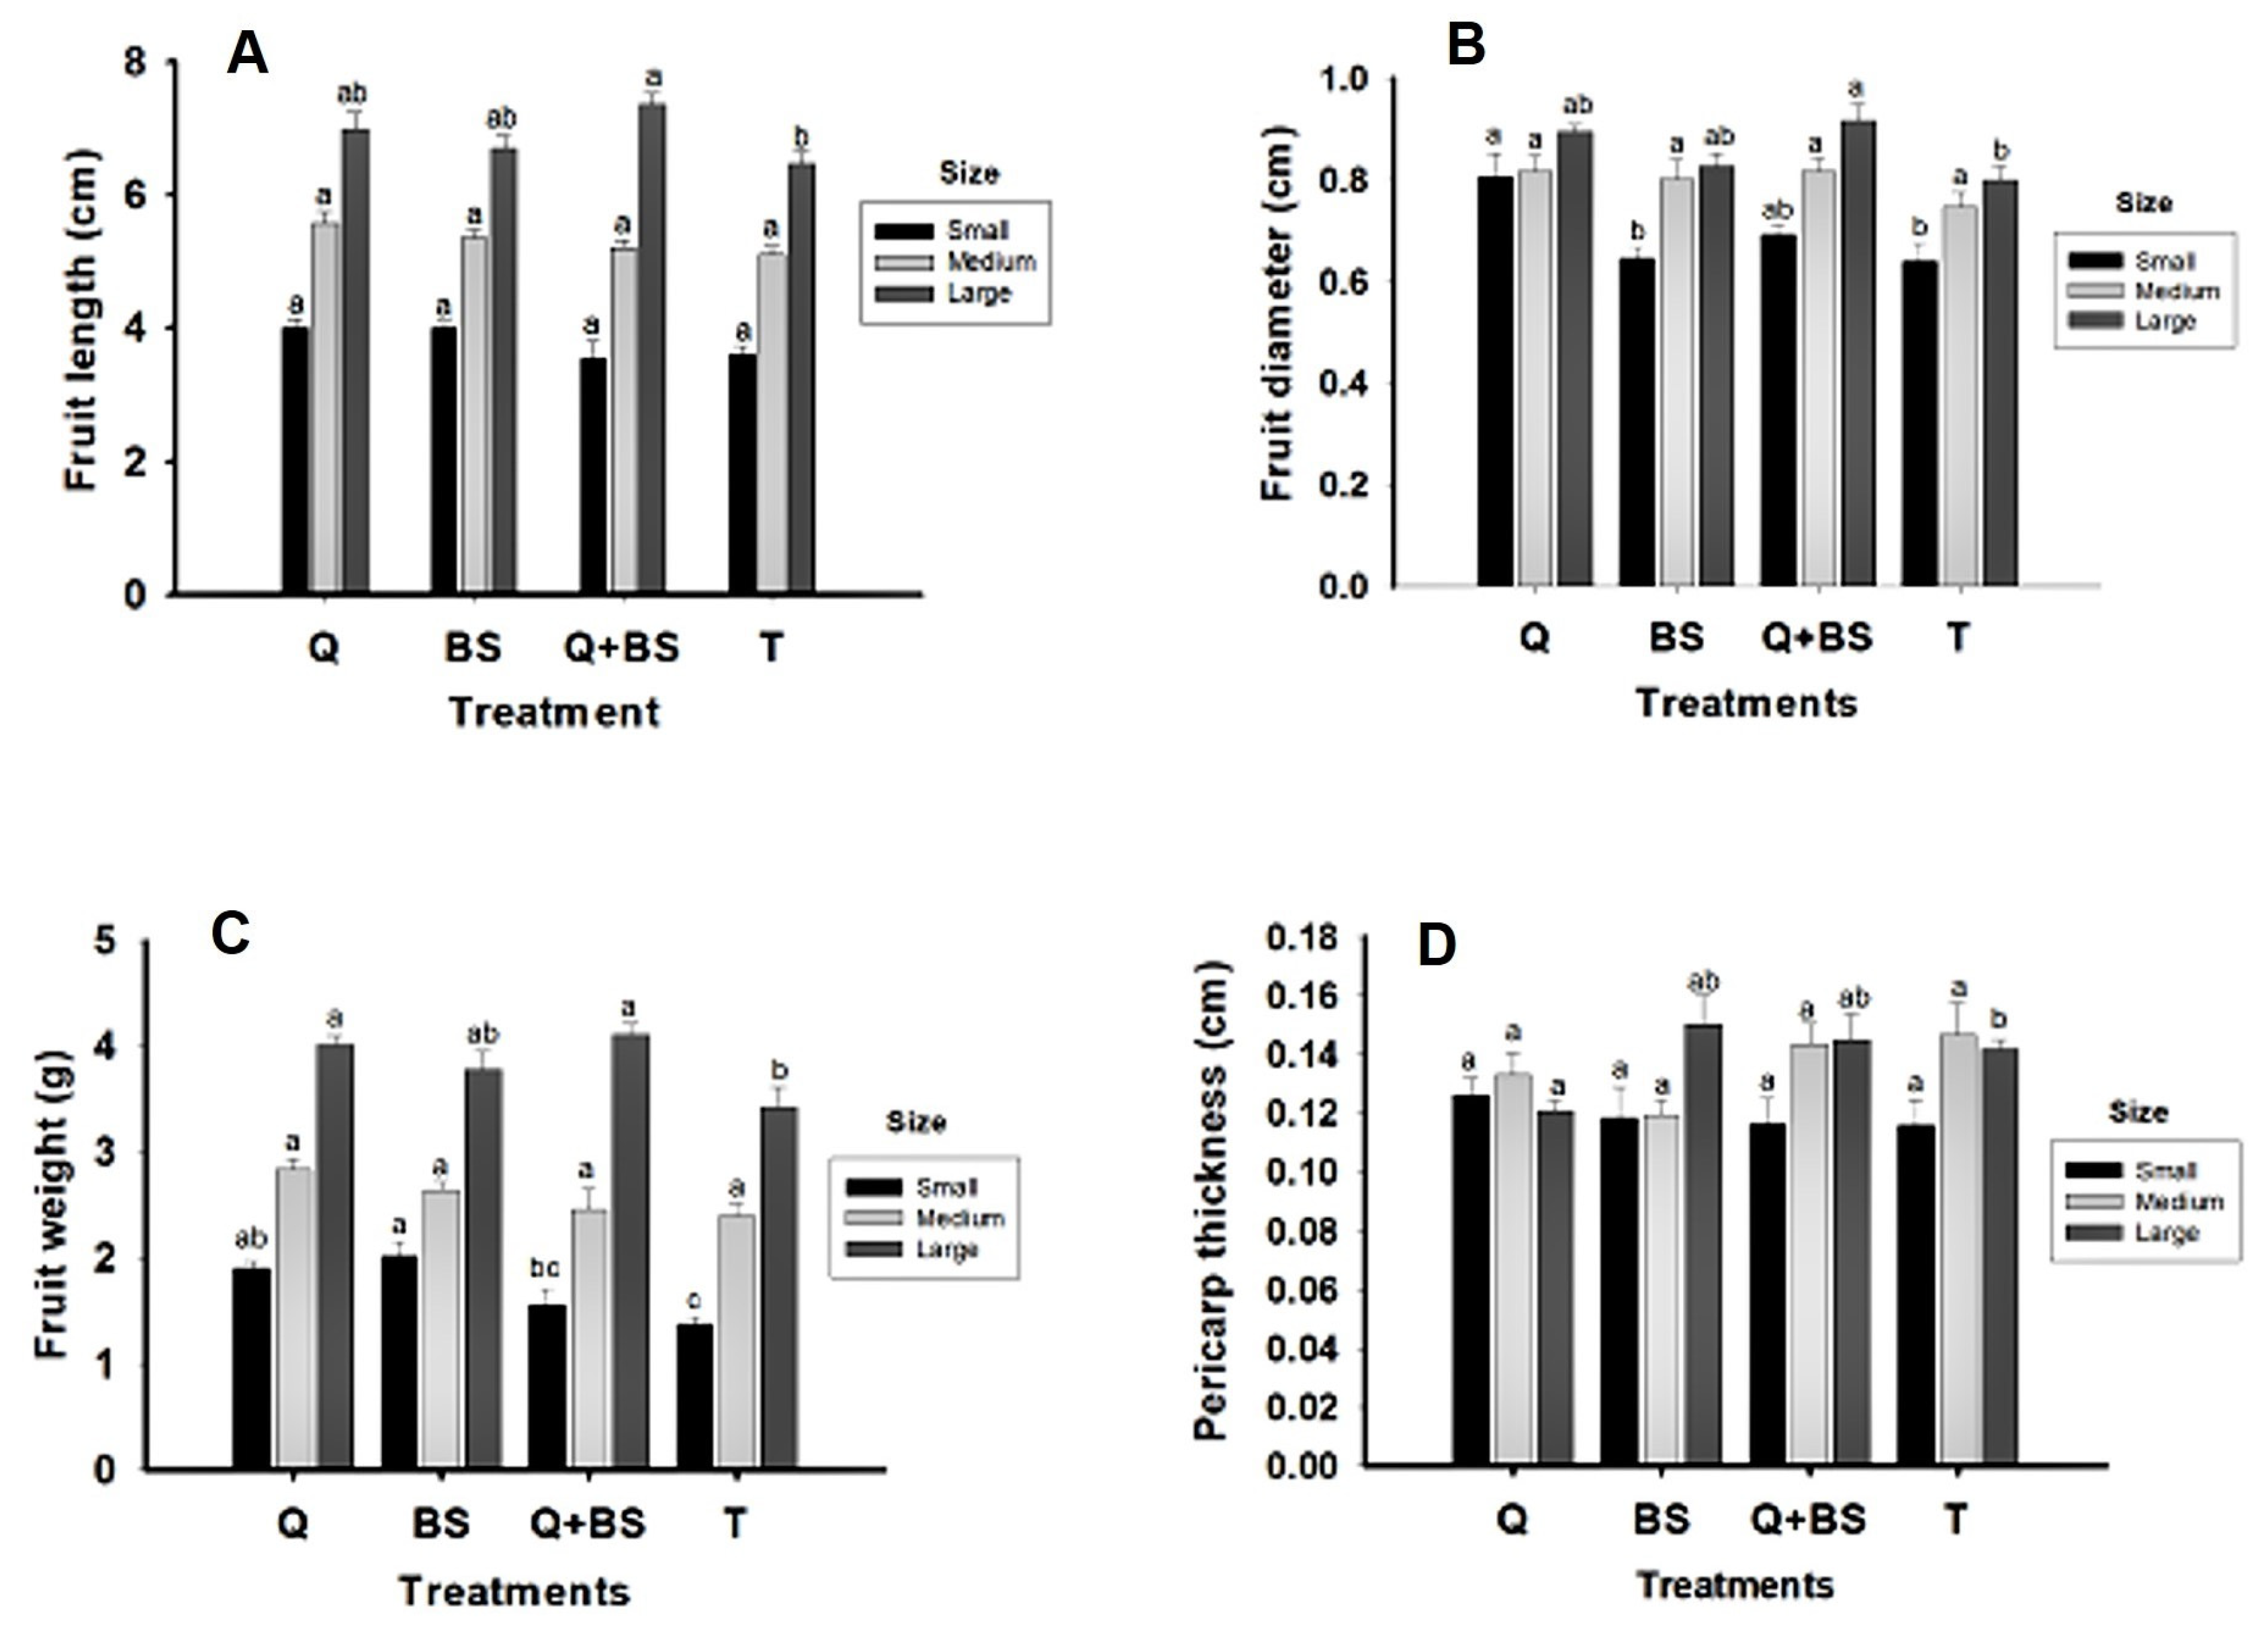
Figure 10: Morphological quality variables of fruits from the second harvest of Chile Soledad (Capsicum annuum L.): fruit length (A), fruit diameter (B), fruit weight (g) (C), and pericarp thickness (D), classified by size (small, medium, and large), under four treatments: Q = UNPA chitosan, BS = Bacillus subtilis, Q + BS = UNPA chitosan + Bacillus subtilis, and T = Control. Each value represents the mean ± standard error (n = 20). Columns sharing the same letter are not significantly different according to Tukey’s test (p < 0.05).
Fig. 11 presents data on the number of locules (E2) and physicochemical quality variables from the second harvest: Brix degrees (F2), citric acid percentage (G2), and pH (H2). In the small and medium classifications, no significant differences in the number of locules were found among treatments. However, in the large classification, the combined Q + BS treatment exhibited the highest number of locules, followed by BS and Q, with no significant differences among these treatments but differing from T, which had the fewest locules. The concentration of Brix degrees in the three classifications (small, medium, and large) was highest in the control treatment, showing concentrations of (3.43, 3.66, and 2.33, respectively), with significant differences in the small and medium sizes compared to other treatments. In the medium size classification, the lowest concentration was observed in the BS treatment (1.3), while the large classification showed no significant differences among treatments. Regarding citric acid concentration in the small size classification, the highest concentration was found in the Q treatment, causing differences compared to other treat-ments. However, BS and T showed no differences, while the combined Q + BS treatment had the lowest concentration (0.03%). In the medium classification, the highest citric acid concentration was found in the Q treatment (0.115%), differing from the other treatments, while the BS and T treatments did not show differences, both having concentrations of (0.44%). In the large classification, the control treatment had the highest citric acid concentration (0.05%), showing differences from the other treatments, but Q and the combination with Q + BS showed no significant differences (both at 0.040%), while the lowest concentration was in the BS treatment (0.032%).
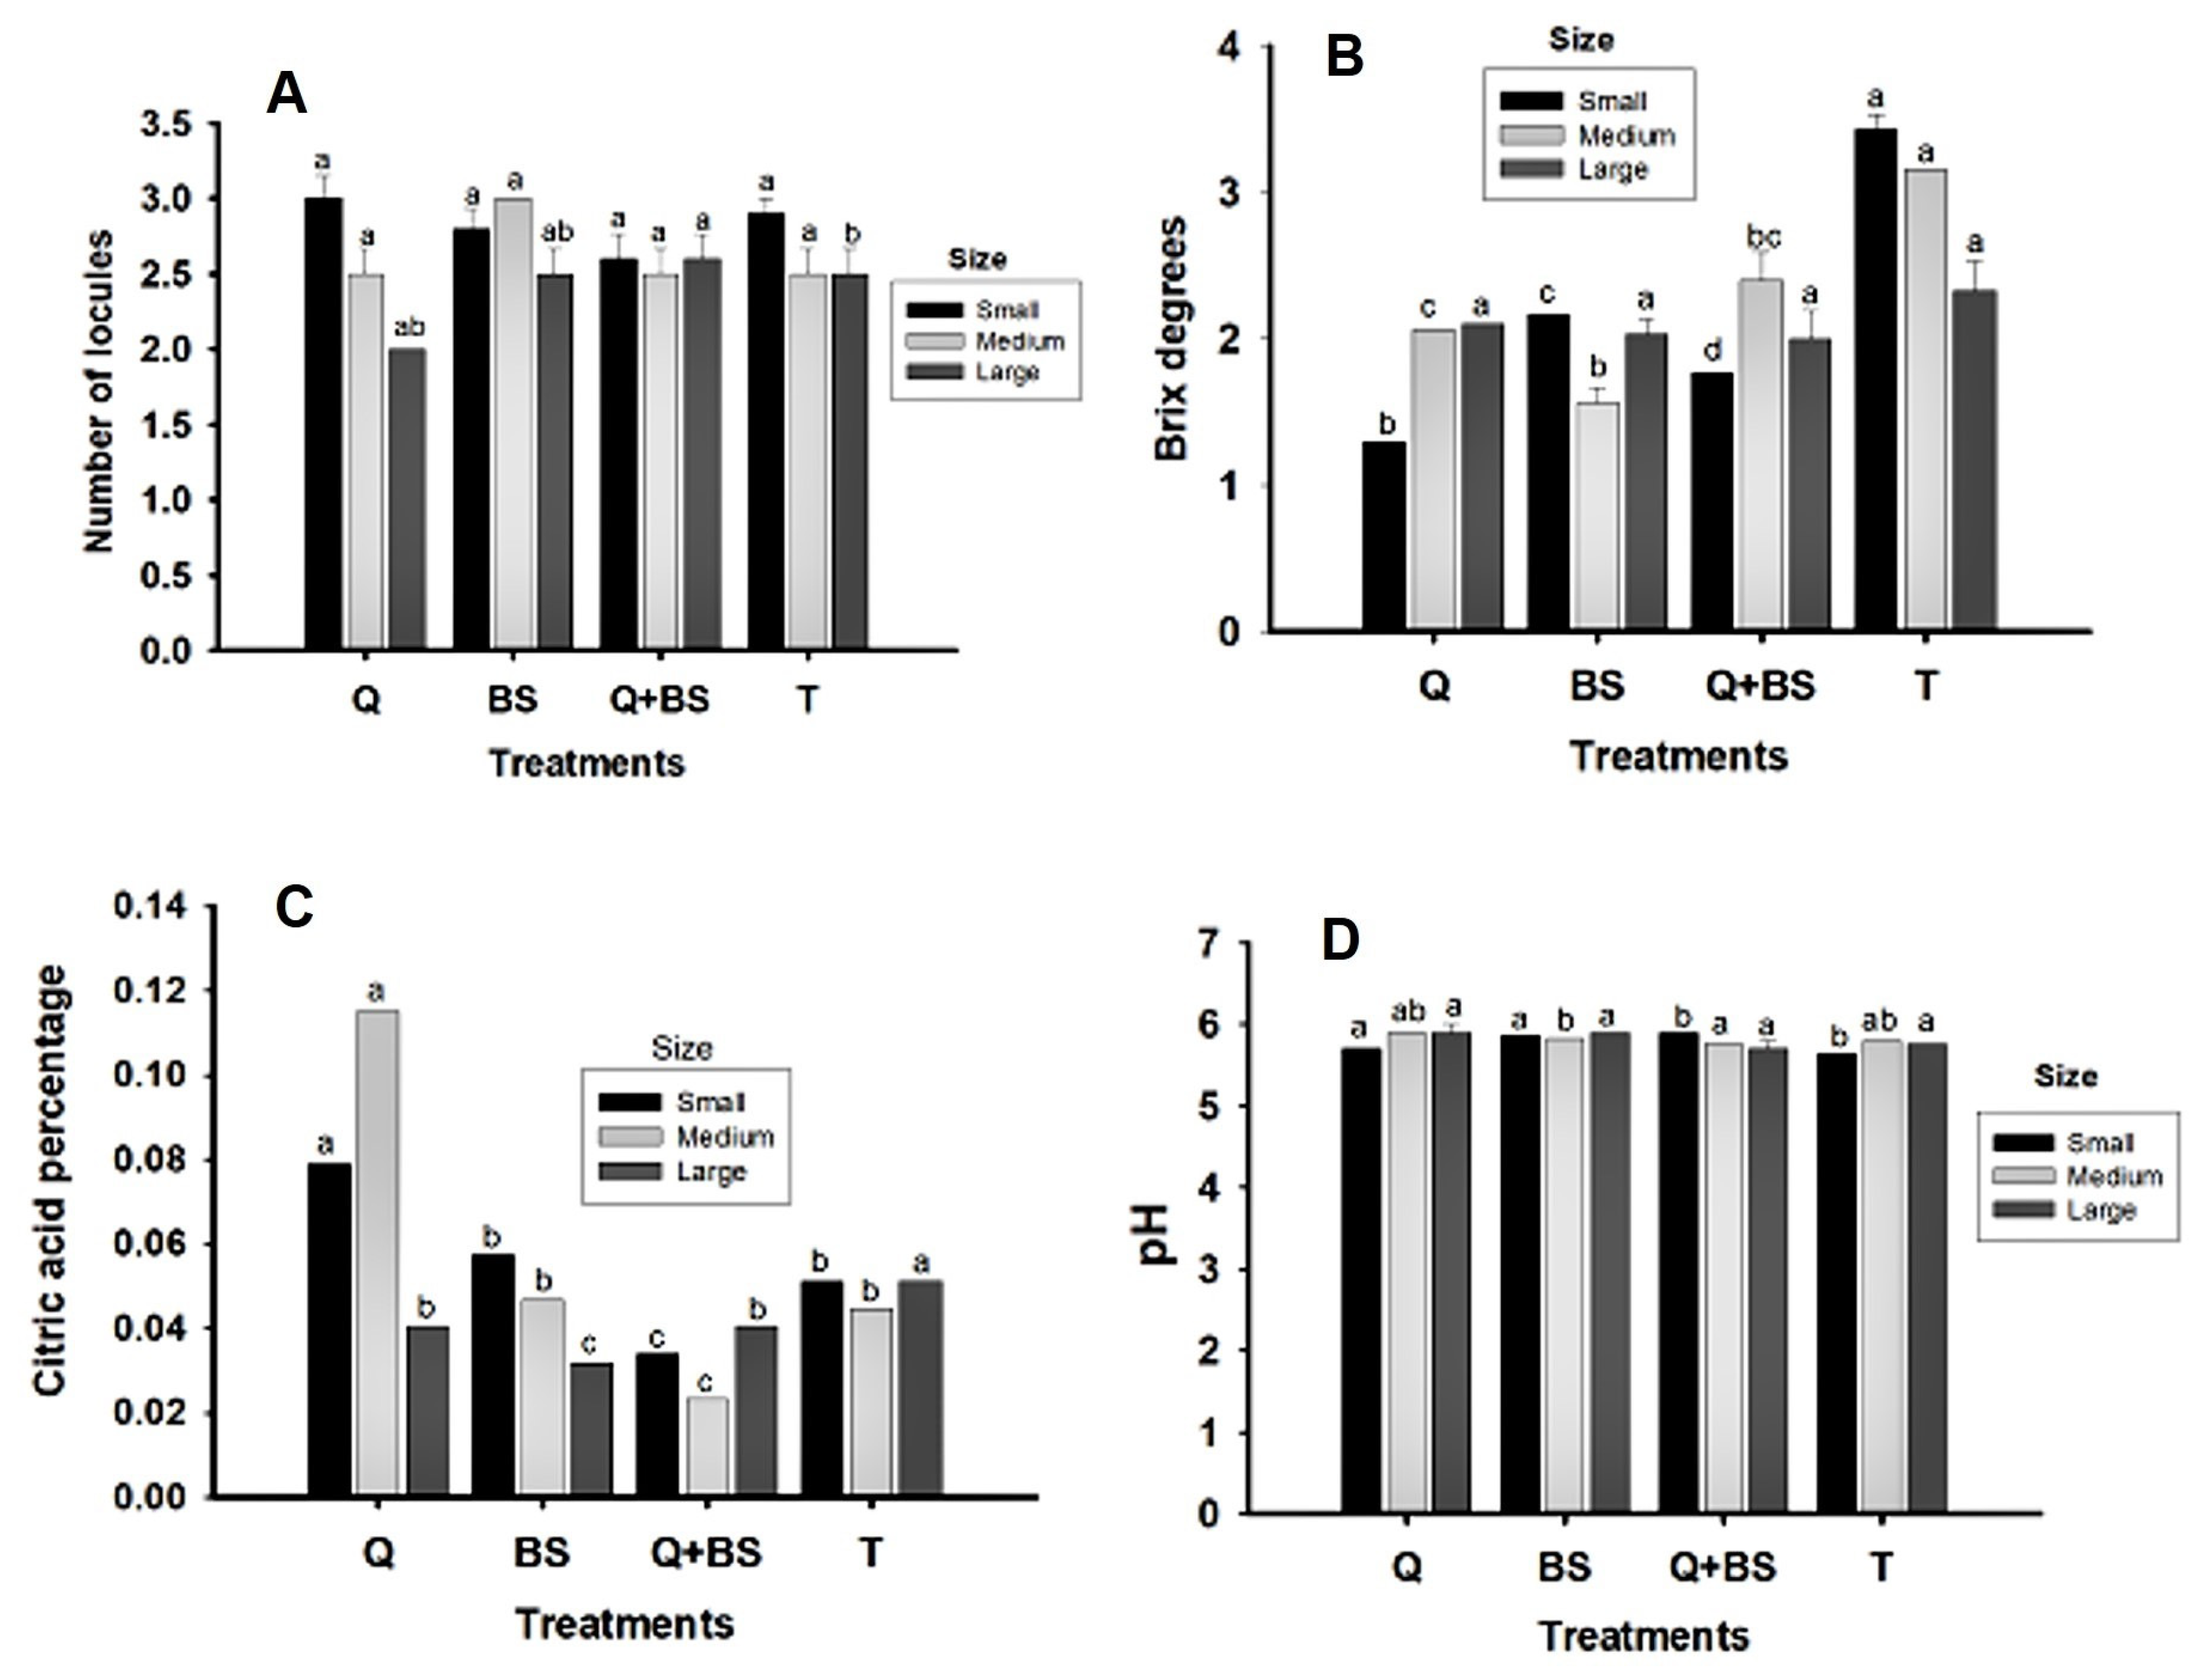
Figure 11: Physicochemical quality variables of fruits from the second harvest of Chile Soledad (Capsicum annuum L.): number of locules (A), soluble solids (°Brix) (B), citric acid content (%) (C), and pH (D), classified by size (small, medium, and large), under four treatments: Q = UNPA chitosan, BS = Bacillus subtilis, Q + BS = UNPA chitosan + Bacillus subtilis, and T = Control. Each value represents the mean ± standard error (n = 20). Columns sharing the same letter are not significantly different according to Tukey’s test (p < 0.05).
Finally, the pH concentration in the small classification was highest in the Q and BS treatments (5.8 and 5.9, respectively), with no significant differences between these treatments. Similarly, Q + BS and T treatments did not show significant differences, with pH values of (5.6 and 5.7, respectively). In the medium classification, the highest pH was found in the combined treatment (5.9), with no significant differences from T and Q treatments (both at 5.8). However, T and Q differed from the BS treatment, which had a pH of (5.7). In the large classification, no significant differences were found among treatments, with pH values ranging from (5.7 to 5.9).
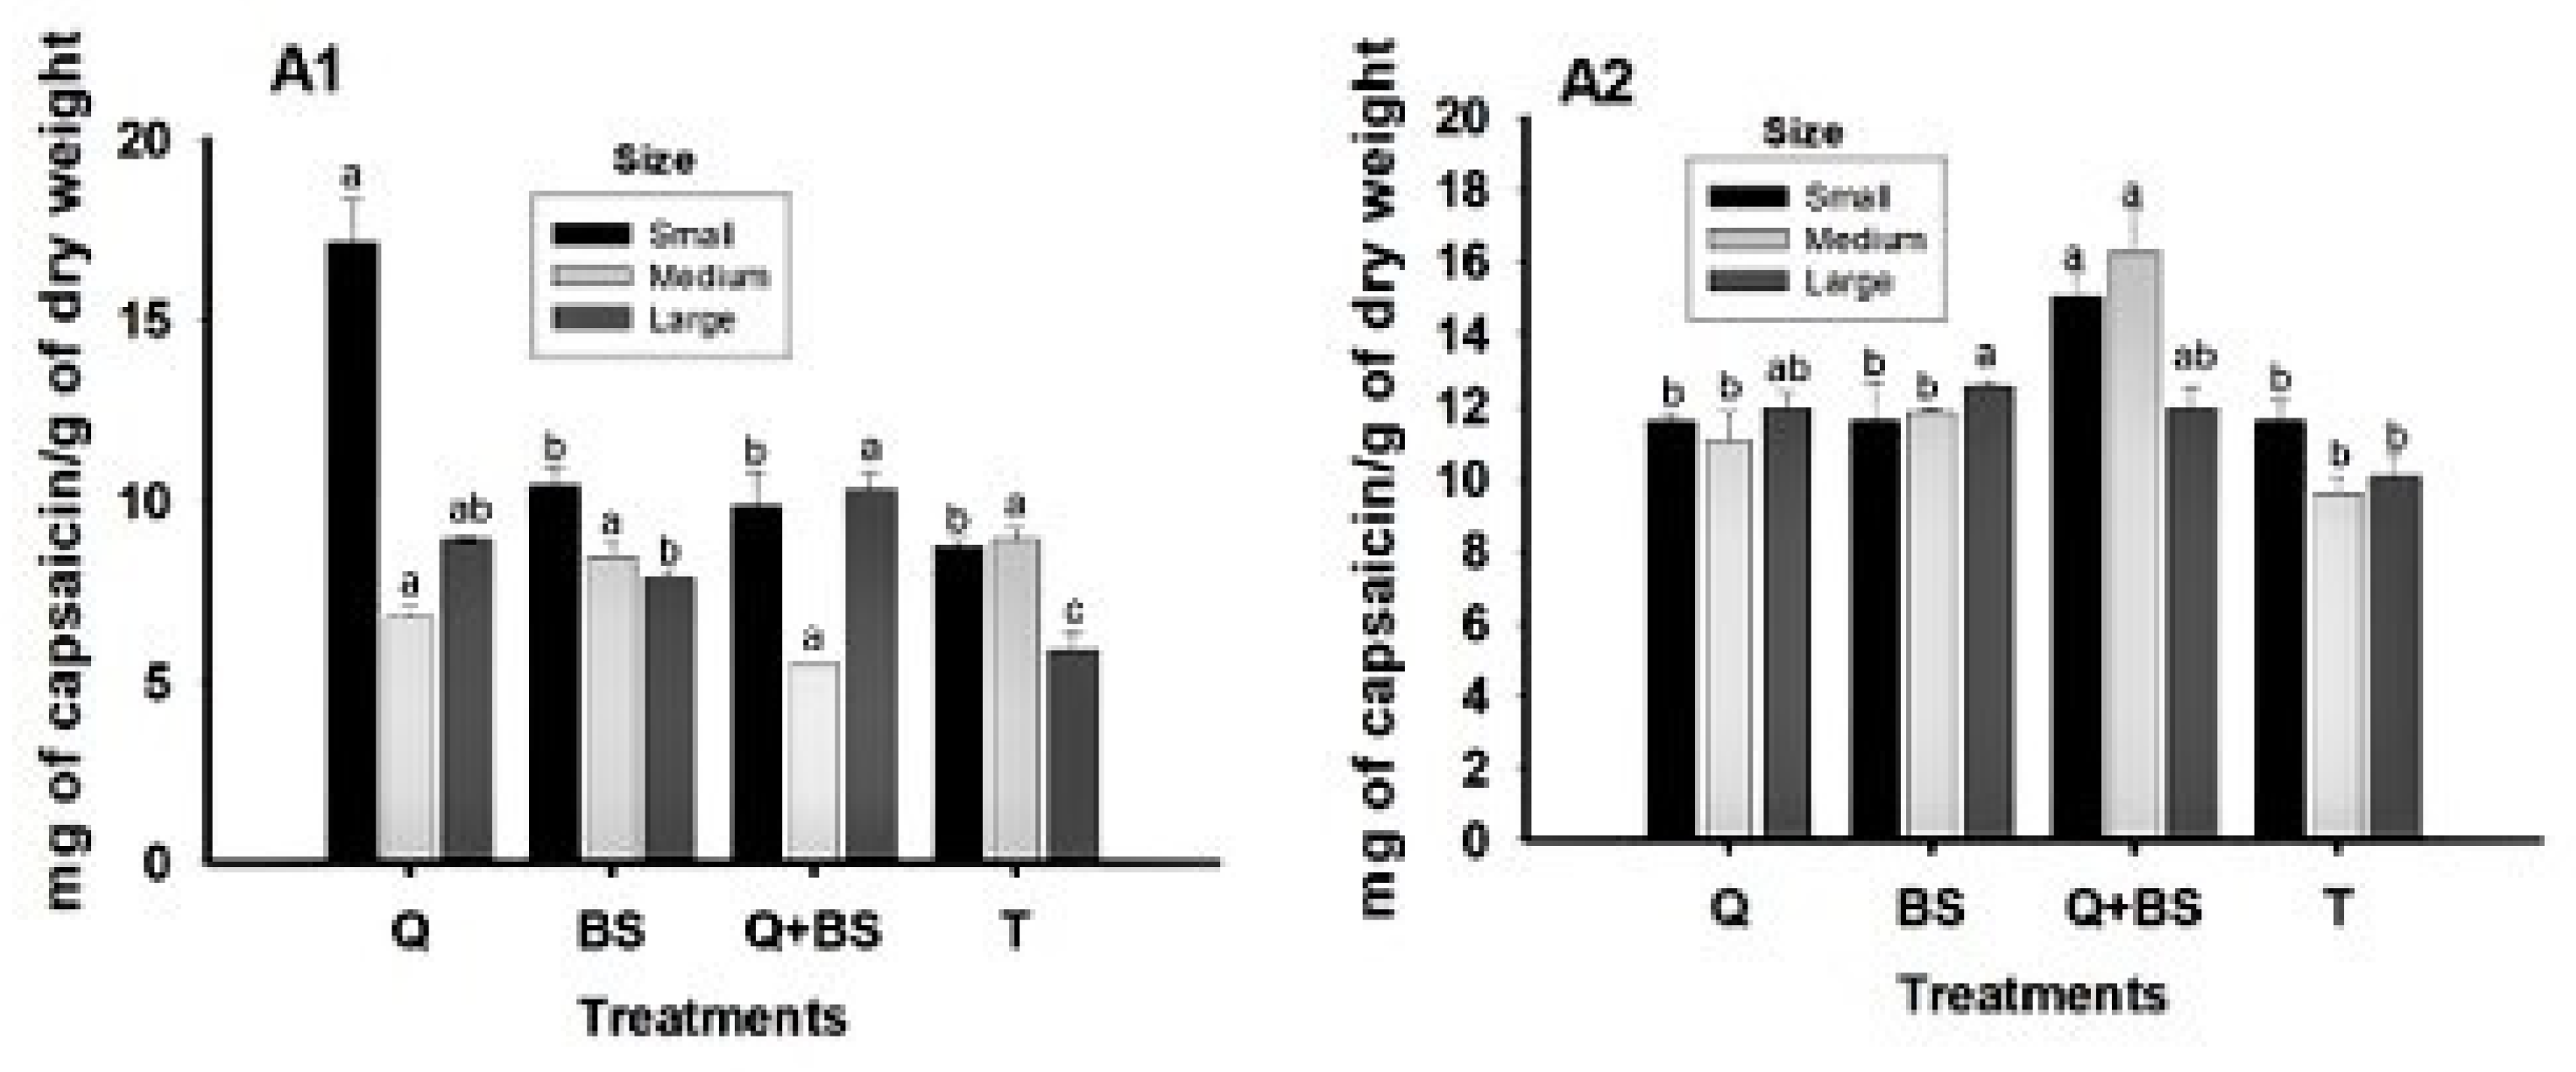
Figure 12: Effect of biofertilizer treatments on capsaicin content in Chile Soledad (Capsicum annuum L.) from the first harvest (A1) and second harvest (A2), classified by size (small, medium, and large), under four treatments: Q = UNPA chitosan, BS = Bacillus subtilis, Q + BS = UNPA chitosan + Bacillus subtilis, and T = Control. Each value represents the mean ± standard error (n = 20). Columns sharing the same letter are not significantly different according to Tukey’s test (p < 0.05).
The effects of the biofertilizer treatments on capsaicin content across fruit sizes and harvests are shown in Fig. 12. In Table 7, the two-way ANOVA revealed highly significant effects (p < 0.001) of treatment and fruit size on most morphological and physicochemical quality variables. The combined treatment Q + BS exhibited the highest values of fruit length, diameter, weight, pericarp thickness, and capsaicin content, indicating a positive interaction between both biological factors. The treatment × size interaction was significant only for capsaicin content (p = 0.017), suggesting that the response to the biofertilizers depends on the stage of fruit development.
Table 7: Two-way ANOVA for morphological and quality variables of Soledad chili (Capsicum annuum L.) fruits.
| Variable | Source of Variation | df | MS | F | p |
|---|---|---|---|---|---|
| Plant height (cm) | Treatment | 3 | 248.62 | 18.75 | <0.0001 |
| Time (DAS) | 6 | 1,138.43 | 85.6 | <0.0001 | |
| Treatment × Time | 18 | 24.71 | 1.85 | 0.084 | |
| Error | 532 | 13.31 | — | — | |
| Stem diameter (mm) | Treatment | 3 | 0.091 | 14.65 | <0.0001 |
| Time (DAS) | 6 | 0.185 | 29.74 | <0.0001 | |
| Treatment × Time | 18 | 0.008 | 1.29 | 0.26 | |
| Error | 532 | 0.006 | — | — | |
| Number of leaves | Treatment | 3 | 22.51 | 7.32 | 0.0001 |
| Time (DAS) | 6 | 152.18 | 49.5 | <0.0001 | |
| Treatment × Time | 18 | 3.42 | 1.11 | 0.35 | |
| Error | 532 | 3.07 | — | — | |
| Chlorophyll A (μg mL−1) | Treatment | 3 | 9.35 | 11.88 | <0.0001 |
| Time (DAT) | 3 | 38.45 | 49.75 | <0.0001 | |
| Treatment × Time | 9 | 1.18 | 1.53 | 0.14 | |
| Error | 228 | 0.77 | — | — | |
| Chlorophyll B (μg mL−1) | Treatment | 3 | 15.26 | 14.95 | <0.0001 |
| Time (DAT) | 3 | 102.43 | 100.37 | <0.0001 | |
| Treatment × Time | 9 | 1.43 | 1.41 | 0.18 | |
| Error | 228 | 1.01 | — | — | |
| Electrical conductivity (μS cm−1) | Treatment | 3 | 28,450.6 | 8.21 | <0.0001 |
| Time (DAT) | 3 | 15,870.2 | 4.57 | 0.004 | |
| Treatment × Time | 9 | 3451.7 | 0.99 | 0.45 | |
| Error | 228 | 3467.9 | — | — | |
| Sap pH | Treatment | 3 | 0.34 | 3.87 | 0.01 |
| Time (DAT) | 3 | 0.55 | 6.32 | 0.0004 | |
| Treatment × Time | 9 | 0.06 | 0.74 | 0.67 | |
| Error | 228 | 0.08 | — | — | |
| Nitrate (mg L−1) | Treatment | 3 | 420,000 | 21.43 | <0.0001 |
| Time (DAT) | 3 | 1,120,000 | 57.12 | <0.0001 | |
| Treatment × Time | 9 | 21,000 | 1.07 | 0.39 | |
| Error | 228 | 19,600 | — | — | |
| Phosphate (mg L−1) | Treatment | 3 | 260,000 | 18.88 | <0.0001 |
| Time (DAT) | 3 | 310,000 | 22.47 | <0.0001 | |
| Treatment × Time | 9 | 17,000 | 1.22 | 0.28 | |
| Error | 228 | 13,900 | — | — | |
| Potassium (mg L−1) | Treatment | 3 | 450,000 | 6.84 | 0.0002 |
| Time (DAT) | 3 | 280,000 | 4.25 | 0.006 | |
| Treatment × Time | 9 | 30,000 | 0.62 | 0.76 | |
| Error | 228 | 48,000 | — | — |
4.1 Characterization of Chitosan
A comparison of yields was made with various authors based on the results obtained in our procedure. As a result, a yield of 25.19% in UNPA chitosan was achieved, which was compared with the results obtained by [28,29,30], who achieved lower yields of 74%, 61%, and 53.75%, respectively. This was attributed to the increase in temperature during the deproteinization and demineralization process, as well as the higher concentration of the solvents used. On the other hand, Luo et al. [31] presented a yield of 14.5% because the extraction was performed using different solvents and concentrations. These differences can be explained by various factors, including sample processing, treatment type, solvent concentration, sample type, and origin. According to De Castro et al. [32], possible causes for obtaining a low yield in chitosan are that the treated sample contains a higher amount of proteins and fats, as the composition of chitosan from different sources (crustaceans, insects, and fungi) varies not only with the species in question but also with the characteristics used for chitosan extraction, which complicates the comparison among various authors.
Similarly, a comparison was made between commercial SIGMA chitosan and UNPA chitosan based on the percentage of minerals. The result was 2.71% for UNPA chitosan, which, when compared to the results obtained by Luo and Hernández-Cocoletzi et al. [31,33], who obtained chitosan from shrimp exoskeleton with 0.95% and 1.40% minerals, is superior. Conversely, when comparing our results with those presented by Martínez et al. [29], who evaluated chitosan from exoskeletons of estuarine and offshore shrimp, using the same methodology, which resulted in 14% and 24% final minerals; Torres et al. [34] evaluated chitosan from shrimp of different origins, finding 29% and 18% minerals. Additionally, Castro and Vidal found mineral values of 29.0% in chitosan from Emerita analoga exoskeletons [35]. The results obtained for each author differ because Martínez et al. [29] state that the physicochemical properties of chitosan depend on both the sources and the production conditions of the shrimp.
Regarding SIGMA chitosan, its percentage of minerals was 4.5%. Based on these results, it has been confirmed that UNPA chitosan presents superior quality compared to commercial SIGMA chitosan, according to the parameters established by Alvarenga [36]. These same authors mention that for high quality chitosan, the mineral percentage should be less than 1%, and a low ash content can be an essential factor for better solubility. Therefore, the percentage of ash is influenced by the presence of mineral impurities, such as calcium, CaCO3 salt content, or even by metal contaminants. This result is largely subject to the origin, properties, and extraction conditions [37].
In relation to the percentage of demineralization, values of 97.28% and 95.46% were obtained for UNPA and SIGMA chitosan, respectively. These values contrast with the 98% obtained by [38]. The percentage of protein obtained from the exoskeleton is identical to that reported by Suárez-Villa et al. [38], at 44.7%, and lower than that obtained by Cisneros-Pérez et al. [39], at 42.33%, and higher than that reported by Luna [40] at 36.2%. A final protein percentage of 7.43% was obtained for chitosan, which is higher than the 2.83% achieved by Álvarez et al. [41]. On the other hand, Castro and Vidal [35] achieved a protein percentage of 0.83%, although it exceeds that achieved by Martínez et al. [29] in highseas and estuarine shrimp chitosan, which were 34.67% and 37.16%, respectively. The 7.43% of protein in UNPA chitosan is very low compared to the protein content in the shrimp exoskeleton we obtained, which is 44.62%. This confirms that the deproteinization process was effective, as a significant number of proteins were eliminated.
According to the results obtained for the percentage of deproteinization, percentages of 83.34% and 80.01% were achieved for UNPA and SIGMA chitosan, respectively. Compared to the 87.5% deproteinization obtained by Pérez et al. [37], the values obtained were lower. On the other hand, Castro and Vidal [35] obtained a percentage exceeding 89%. Regarding the moisture percentage, values of 11.5% and 11.3% were obtained for UNPA and SIGMA chitosan, showing a contrast with the 14% obtained by Martínez et al. [29], presenting lower results. In contrast to the results obtained by Torres et al. [34] at 0.96% and Luo et al. [31] at 2.7%, higher results were evidenced, while Velasco and Ibitoye et al. [42,43] analyzed two exoskeleton samples, obtaining values below 6.6% and 6.5%. The value obtained from UNPA chitosan is estimated to be equivalent to that of commercial chitosan at 11%, according to the findings of Barra et al. [44].
With these results, it is confirmed what Martínez et al. [29] reported, indicating higher moisture in shrimp chitosan, evidencing a decrease in the molecular mass of the polymer, given that a greater amount of free hydrophilic groups, such as hydroxyls, amines, and aldehydes, at the end of the polymer chain increases the hygroscopicity of the polymers after deacetylation. These results explain the increase in water absorption capacity as humidity following dehydration. Additionally, it is noted that moisture content is one of the fundamental factors for evaluating chitosan. Molecular water is adsorbed onto the polymer chains, exerting a plasticizing effect on thermal stability and structure. Likewise, the moisture percentage is related to the removal of acetyl groups as a consequence of the thermo alkaline deacetylation of chitin, which generates free amino groups in the polymer chain. This site is sensitive to the formation of hydrogen bonds with the oxygen of free radical –OH [45].
Finally, the pH obtained in the shrimp exoskeleton was 8.8, while that of UNPA chitosan and SIGMA chitosan is 3.4, values higher than 4 and 4.5 in highseas and estuarine shrimp [34]. The pH of chitosan is a quality parameter, as it constitutes a component of its chemical characteristics. It should be noted that there have been no studies conducted to evaluate the level of depigmentation in chitosan using the Hunter Lab method, which prevents comparisons from being made. However, it is maintained that this depigmentation is associated with the oxidative effect of sodium hypochlorite, and that the color obtained from chitosan depends on its commercial value, as established by Romero-Serrano and Pereira [45]. The chitosan that exhibits the highest commercial value is beige, obtained from fungi, followed by white to grayish chitosan, obtained from squid and shrimp. This is related to our results for UNPA chitosan, which has a whitishgray color with color number #BEBAB4. The price of chitosan ranges between $700,000 and $800,000 pesos per ton, depending on its purity [46].
The levels of deacetylation, deproteinization, demineralization, moisture percentage, pH, and color are considered, along with the factors influencing its commercial value [47]. It is required to point out that particle size has an effect on the processes of deproteinization and demineralization [48,49,50]. Chitosan is widely recognized for its ability to induce defense responses, modulate plant growth, and enhance nutrient absorption due to its polyelectrolytic properties and its interaction with receptors on plant cell membranes.
4.2 Infrared Spectroscopy of Chitosan
For UNPA chitosan, the O-H and N-H groups were reported at bands of 3440 and 3280 cm−1, respectively, which fall within the range identified by Jeon et al. [51], who recognized these groups at bands of 3300 to 3500 cm−1. Similarly, these findings align with those obtained by González and Silva [28], at 3430 cm−1, while Martínez-Robinson et al. [52] reported a band at 3363 cm−1. The C-N group was found in the band located at 1380 cm−1 according to González and Silva [28], who also detected it at bands of 1581 cm−1. Furthermore, the amide III band was located in the range obtained by González and Silva [28] at 1376 cm−1.
The C=O bonds of amide I were found at bands of 1660 cm−1, which are higher than those reported by González and Silva [28] at 1646 cm−1. They mentioned that the most representative bands of chitosan correspond to the N-H stretching for amide I, which were found at bands of 3289 cm−1, while UNPA chitosan was found at bands of 3260 cm−1. In fact, the broad O-H stretching vibration band was located at 3440 cm−1, lower than the 3471 cm−1 reported by González and Silva [28]. Martínez-Robinson et al. [52] also showed strong typical bands at 1644 cm−1 (amide I, C=O group, stretching vibration). It was confirmed that the N-H stretching bands belonging to amide I were found at 3260 cm−1, while González and Silva [28] found them at 3289 cm−1, reaffirming that these are the most representative bands of chitosan.
Seedling height was greater in the Q + BS treatment, differing significantly from other treatments. Similarly, stem diameter was positively influenced by Q and Q + BS. These results are explained by the synergistic interaction between chitosan and Bacillus subtilis. Chitosan acts as a carbon and nitrogen source, enhancing bacterial growth and metabolic activity in the rhizosphere. In turn, the bacteria improve chitosan degradation and nutrient mobilization, creating a positive feedback that promotes plant development. Bolaños Dircio et al. [53] corroborates that these interactions improve crop growth and yield. Luna [40] showed that Bacillus subtilis increases micronutrient availability, such as iron, which is chelated by siderophores and assimilated by the plant.
The biostimulant effect shown in this study could be attributed to its chemical composition, consisting of linear polymers with structural units of 2-amino-2-deoxy-D-glucopyranose linked by 1,4 glycosidic bonds [54,55,56,57]. Once the plant comes into contact with this biopolymer, a cascade of signaling is triggered, stimulating defense mechanisms mediated by SAR, which, in turn, produces a significant increase in the roots, allowing for greater nutrient absorption, thereby strengthening and enhancing their vigor [58].
When comparing height with the results obtained by Izquierdo-Oviedo et al. [59], who reported a height of 3.99 cm after applying chitosan to the roots and foliage of Capsicum annuum L. (bell pepper) at a dose of 1 mg L−1 15 days posttransplant, our results were superior at 6.88 cm. These findings align with previous reports indicating that chitosan can enhance plant growth and physiological responses due to its antioxidant properties and biostimulant activity [60]. Similarly, a comparison was made with the results obtained by Martínez et al. [29], who evaluated Lombrihumus + Kuntan + Lidavital® (Lidavital®, Ciudad de México, México) at 35 days after planting, obtaining a height of 8.75 cm, while our results reached 10.82 cm. Furthermore, when comparing our results with those reported by Álvarez-Pinedo et al. [61], at 45 DAT, who evaluated the application of chitosan combined with ecomic in Capsicum annuum L. (bell pepper), it was found that their results showed significant differences compared to the control at 13.75 ± 0.24 cm; however, our results remained superior at 17.54 ± 0.46 cm.
Regarding stem diameter, it can be inferred that the most suitable treatment at 15 and 45 DDS was Q + BS. According to Bolaños Dircio et al. [53], who evaluated Bacillus licheniformis M2-7 in poblano pepper (Capsicum annuum L.) at 15 DDS, a diameter of 0.102 cm was presented, while our results were superior with Q + BS at 0.149 ± 0.004 cm. Additionally, a comparison was made with the results obtained by Martínez et al. [29], who applied Lombrihumus + Lidavital® foliarly, evaluating at 35 DDS, which showed a diameter of 0.285 cm, whereas our result was lower at 0.155 cm. Similarly, the results obtained resemble those shown by Lara-Capistrán et al. [13], who evaluated the application of Bacillus subtilis in sweet pepper (Capsicum annuum L.) and determined that it differed positively from the control.
Lastly, no significant differences in the number of leaves were observed among the treatments, consistent with the findings reported by other authors [62], who evaluated QuiToMax® (Cuban Institute of Chitin and Chitosan Derivatives, Cuba) at a concentration of 1 g L−1 on tomato seedlings of two varieties, ESEN and L-43, in which no significant differences were observed for this variable. On the other hand, Ref. [63] evaluated the effect of HMA-chitosan and HMA-bionutrient in foliar application at 35 days after emergence and showed a result exceeding 6 leaves compared to our results.
Overall, results have been reported indicating the potential of Bacillus, particularly CBRF12 and CBCC57, for the growth of habanero pepper seedlings [64], Other Bacillus spp. strains have reported increases in the growth of Capsicum annuum L. seedlings [65].
4.4 Growth After Transplanting
The results show an effect of the application of biofertilizers on plant growth involving height, leaf area, and number of shoots. Among the four treatments evaluated, Bacillus subtilis significantly promoted plant height at 60 DAT (120.19 cm) (p ≤ 0.05). Regarding the stem diameter variable, no differences were found among the treatments. The Capsicum annuum L. plants treated with Q, BS, and their combination experienced a significant increase in leaf area and number of shoots at different growth stages, confirming that the use of biofertilizers such as Bacillus subtilis is a viable alternative for plant growth, as it has the ability to produce low molecular weight organic acids that facilitate the release of soluble phosphorus from the soil. This macronutrient is utilized by plants for photosynthesis, energy, carbon source synthesis and degradation, enabling them to achieve greater growth.
Additionally, they can produce indole-3-acetic acid (IAA), a plant hormone that contributes to cell elongation and division, tissue differentiation, and responses to light and gravity [66]. Furthermore, they provide protection to plants against phytopathogens, positively influencing plant growth [67]. Ultimately, bacteria of the Bacillus genus have a high ability to adhere to and colonize plant roots, which can significantly impact their growth [67].
On the other hand, regarding the application of chitosan, various authors have attributed that chitosan stimulates chlorophyll production and photosynthesis in plants, leading to increased development [68]. Chitosan is also used as a biostimulant, not only to promote plant growth but also to induce tolerance to abiotic stress or resistance to pathogens. Among other functions, it stimulates the activity of enzymes essential for nitrogen metabolism and optimizes its transfer in the leaves, enhancing foliar function in growth and development [69]. Chitosan enhances photosynthesis, and its molecular activity varies among cells depending on their specific physiological and chemical characteristics, resulting in increased root development, flowering, and potential crop yield [70,71].
In relation to our research, it has been reported that the application of chitosan in peppers has improved vegetative growth in both height and stem diameter. Similarly, in tomato cultivation, it has been shown to increase growth and the number of flowers [72]. The findings of this study align with those obtained in our research, demonstrating that chitosan has advantages in the morphological characteristics of Capsicum annuum L. plants. Additionally, another study revealed that foliar application of chitosan increased vegetative growth and yield in cucumbers [73].
Furthermore, Gamboa-Angulo et al. [74] evaluated the application of Bacillus subtilis in Capsicum annuum L. at a concentration of 1 × 10¹² CFU mL−1, and their results were superior to those presented in our study. When comparing our results with those reported by Reyes-Pérez et al. [75], who examined the application of chitosan in tomato cultivation, it was found that applying doses of 150, 200, 250, and 300 mg L−1 had a significant impact on height, significantly increasing values (p ≤ 0.05) compared to the control.
Several authors have demonstrated growth stimulation and yield increases through the use of chitosan in various crops, including tobacco, beans, and maize [76,77]. It has been noted that microbial biofertilizers are a feasible option for integrating into production systems to reduce the use of chemical fertilizers, produce food without harming the environment, humans, or animals, and positively affect growth [74]. In the combination of chitosan and a bacterial consortium, which includes Bacillus subtilis, it has been reported that they are an alternative for grain sorghum production [78]. There is also reference to the use of Bacillus subtilis to evaluate the agronomic response of sweet peppers under greenhouse conditions, indicating it as an alternative for production [79].
4.5 Determination of Photosynthetic Pigments
According to the results obtained, the highest concentration of chlorophyll A was observed in plants treated with chitosan, while for chlorophyll B and A + B, the highest concentration was recorded with the combined Q + BS treatment. These results can be supported by studies showing that chitosan increases the diameter of chloroplasts in the orchid Dendrobium at concentrations of 10–50 ppm in leaves, as well as influencing chloroplast gene expression, potentially leading to higher chlorophyll concentrations [80]. Additionally, it has been confirmed that chitosan enhances photosynthesis (gas exchange and photochemical reactions) in maize crops [81,82]. This effect may be due to the action of chitosan molecules at physiological and molecular levels in leaves, such as enhancing defense mechanisms against reactive oxygen species (ROS) or acting on nuclear and chloroplast genes involved in the photosynthetic process [83].
Other studies indicate that establishing a response model to the effects of chitosan on photosynthetic pigments is complex, as the impact depends on the species and concentration [84]. Additionally, it has been demonstrated that Bacillus subtilis increases photosynthetic capacity, enhancing photosynthetic efficiency and chlorophyll content in Arabidopsis, attributed to an increase in the number of chloroplasts [85]. Similarly, Bacillus subtilis has been reported to delay leaf senescence, keeping leaves green for longer, which may explain the higher chlorophyll concentration in our treatments [86].
A comparison was made with studies that evaluated the application of biofertilizers, including Bacillus subtilis, in Capsicum annuum L. (bell pepper) cultivation, which demonstrated that the highest chlorophyll concentration was observed with Bacillus subtilis inoculation, similar to our results [86]. Likewise, other studies reported that inoculation with the LPM1 strain of Bacillus subtilis in VLK and SVN varieties of bell pepper resulted in higher chlorophyll content compared to the control [87]. Conversely, some studies found no significant differences in the application of Bacillus subtilis in Capsicum annuum L. plants [88].
Studies in white clover and maize crops have also shown an increase in chlorophyll content with the inoculation of Bacillus subtilis [89,90]. Among studies demonstrating increased chlorophyll content in various crops, the application of chitosan nanoparticles in triticale seedlings at a dose of 0.2 mg mL−1 resulted in the highest chlorophyll concentration [91]. Similarly, the application of chitosan oligomers in coffee plants at various concentrations showed that increasing the dose also increased chlorophyll A and B concentrations, with the most effective dose being 60 mg L−1 [92]. However, other studies reported that the application of chitosan oligosaccharides did not alter chlorophyll A and B concentrations in bean plants [93]. Likewise, the use of Quitomax® (Cuban Institute of Chitin and Chitosan Derivatives, Cuba) in bean plants at a dose of 500 mg L−1 showed no significant differences compared to the control [77].
4.6 Determination of Nutrients
For the variable electrical conductivity (EC) of the petiole sap, a difference was observed only in treatment T at 105 DAT, which exhibited the highest electrical conductivity. However, it is difficult to make various comparisons with other studies since there are no similar reports; nonetheless, the results may be attributed to the nutrients present in the substrate (vermicompost) being in a saturated or assimilable form, leading to greater absorption by the plants, as well as the content of humic acids in the vermicompost providing greater availability of magnesium (Mg), which interferes with protein transport, thereby improving electrical conductivity that indicates the concentration of dissolved salts [94].
In studies determining the quality and yield of bell pepper fruits (Capsicum annuum L.) in response to the conductivity of the nutrient solution, results showed that an electrical conductivity of 2.0 dS m−1 or higher increased bioactive compounds but decreased fruit yield and firmness [95]. In this research, it was found that at 90 DAT, the treatment with the highest electrical conductivity was T (600 μs cm−1), presenting significant differences compared to the other treatments.
It is also mentioned that electrical conductivity is a good indicator of the amount of fertilizer available to the plant. It has been reported that a greater exploration area for the roots provides adequate electrical conductivity and facilitates nutrient absorption [96]. It is important to note that this will depend on the edaphic conditions of the soil where the crop is established [97].
pH is an important factor that influences the growth of microorganisms. Some bacteria generally grow at low pH (3.0); the optimal pH range for bacteria is from 6.0 to 8.5, and only a few prefer pH 8.5 or higher [98]. This is consistent with the data obtained in the treatments of this research. It was generally observed that the concentration of N–NO3− in the cellular extract of the petiole (ECP) varied, with the maximum concentration presented in the application with chitosan at 1203 mg L−1. These results are higher than those reported in studies evaluating nutrient solutions [99], and superior compared to our control treatment, which averaged 500.
Additionally, it has been reported that the concentration of nitrates in tomato plants varies according to the amounts of nitrates added to the nutrient solution [100]. These variations are detected during the vegetative stages and at the beginning of flowering. It should be kept in mind that when fertilizers with different elements are applied, compatibility between them must be considered. Moreover, the ionic interactions between different ions in the soil must be taken into account. An increase in potassium in soils reduces the absorption of calcium and magnesium, excess calcium insolubilizes soil phosphates, and excess chloride reduces the absorption of NO3−. Conversely, an increase in nitrogen in soils improves potassium absorption [101].
4.7 Yield and Quality of Fruit
When analyzing the effect of chitosan on biochemical indicators of fruit quality in tomato cultivation, the concentration of Brix degrees depending on the chitosan dose was found to range from 5.25 to 3.35 [102]. In the present study, the highest value was 105 DAT in the treatment with Q, presenting values higher than (3 ± 0.03), so there are no studies to compare regarding the fruits of Chile Soledad with the application of chitosan and Bacillus subtilis, making comparisons with various authors difficult. In a study on peppers grown in greenhouses, biostimulated plants based on algae showed a higher number of commercial fruits, along with a higher leaf area index compared to the non biostimulated control [103]. This coincides with the results obtained from the application of Q, Q + BS, and T. A significant increase in growth and yield of the crop was reported, with no statistically significant differences between the treatments compared to the control (p ≤ 0.000).
Bacillus subtilis applied to the root and salicylic acid applied to the foliage of A. solani in tomato plants showed similar outcomes [104]. On the other hand, results from another investigation indicated that in the yield of sorghum and protein quality of the grain, the most efficient treatment (with p < 0.05) was with QUI 100% + microbial consortium using 50% regional fertilization [105], consistent with the results obtained.
In a study on strawberry cultivation, the application of chitosan resulted in a significant increase in yield regarding fruit weight, as well as early and total yield. This was accompanied by vegetative growth (plant length, number of leaves/plant, leaf area, root growth, fresh and dry weight) [105].
Furthermore, an analysis on the application of chitosan and a microbial consortium in sorghum showed that in treatments with chitosan, plant length increased as the concentration increased by 50% and 100%, reaching a maximum length of 22.4 cm. Regarding grain yield (kg ha−1), this occurred with 100% chitosan + BAC microbial consortium + 50% fertilization [106]. This indicates that the application of chitosan contributes to length and yield similar to what was obtained in our research.
Regarding fruit weight, it was determined that the application of Q resulted in a higher weight compared to the application of BS, which was somewhat similar to what was obtained in a study where chitosan was the second most important biostimulant for Capsicum annuum L., after humic acid, showing better results in fruit weight, as well as in the number of fruits per plant, fruit length, and fruit diameter [107].
Additionally, it has been found that chitosan exerts a stimulating effect on the following variables: plant height, clusters with fruits, fruits per plant, equatorial and polar diameter of the fruit, pericarp diameter, and fruit mass [108].
4.8 Limitations and Future Perspectives
Although the results of this study demonstrated positive effects of chitosan and Bacillus subtilis on the growth, yield, and fruit quality of Soledad chili (Capsicum annuum L.) under non-controlled greenhouse conditions, several limitations should be considered. First, the results may vary in interaction with the natural soil microbiota, which could influence treatment efficacy and nutrient availability. Second, the scalability of chitosan and B. subtilis application at a commercial level requires optimization in terms of application volume, frequency, and associated costs. Additionally, practical considerations for farmer adoption, such as compatibility with existing agricultural practices and input availability, have not yet been fully evaluated. As next steps, experiments at a larger commercial greenhouse scale are recommended to validate the effectiveness of the treatments under real production conditions. It is also necessary to investigate interactions with soil microbiota and their impact on growth, yield, and fruit quality. Finally, optimizing the dose, frequency, and application method of chitosan and B. subtilis will help establish practical and economically viable protocols for adoption by growers.
In conclusion, chitosan was successfully synthesized from shrimp exoskeletons with a purity greater than 80%, as confirmed by FTIR spectroscopy analyses. This pure chitosan proved effective in enhancing both the growth and yield of Chile Soledad plants. The combination of chitosan and Bacillus subtilis resulted in a significant increase in the morphological parameters of the seedlings, such as height, stem diameter, and number of leaves. Furthermore, in terms of fruit quality, the joint application of both treatments surpassed the individual treatments regarding physicochemical parameters, although no significant differences were detected in the morphological parameters. These findings suggest that the combination of chitosan and Bacillus subtilis can be an effective strategy for optimizing the growth and quality of Chile Soledad, highlighting the importance of chitosan purity and its synergy with Bacillus subtilis in crop improvement.
Acknowledgement:
Funding Statement: The authors received no specific funding for this study.
Author Contributions: The authors confirm contribution to the paper as follows: Conceptualization, Adolfo Amador Mendoza and Rosalba Guadalupe Gomez Raymundo; methodology, Adolfo Amador Mendoza; Investigation, Ana Rosa Ramírez Seañez, Hipolito Hernández Hernández, Rogelio Enrrique Palacios Torres, Nelda Xanath Martínez Galero, Miguel Ángel García Muñoz and Saribel Zilli Gutiérrez; data Analysis, Ana Rosa Ramírez Seañez and Rogelio Enrrique Palacios Torres; writing—original draft, Adolfo Amador Mendoza; writing—review & editing, all authors; supervision, Rosalba Guadalupe Gomez Raymundo; project administration, Adolfo Amador Mendoza; funding acquisition, Rosalba Guadalupe Gomez Raymundo. All authors reviewed the results and approved the final version of the manuscript.
Availability of Data and Materials: The data that support the findings of this study are available from the Corresponding Author, Adolfo Amador Mendoza, upon reasonable request.
Ethics Approval: Not applicable. This study did not involve human participants or animals.
Conflicts of Interest: The authors declare no conflicts of interest to report regarding the present study.
References
1. FAO . Cultivos y productos de ganadería [Internet]. Roma, Italia: Organización de las Naciones Unidas para la Alimentación y la Agricultura; 2021 [cited 2025 Sep 1]. Available from: https://www.fao.org/4/y5445e/y5445e2j.htm [Google Scholar]
2. Food and Agriculture Information Service (SIAP) . Statistical Yearbook of Agricultural Production [Internet]. 2020 [cited 2025 Sep 1]. Available from: https://nube.agricultura.gob.mx/cierre_agricola/ [Google Scholar]
3. Moreno RA . Características de la agricultura protegida y su entorno en México. Rev Mex Agroneg. 2011; 15( 29): 23– 36. (In Spain). [Google Scholar]
4. Silva-Garza MH , Gámez-González H , Zavala-García F , Cuevas-Hernández B , Rojas-Garcidueñas M . Efecto de cuatro fitorreguladores comerciales en el desarrollo y rendimiento del girasol. Cienc UANL. 2001; 4: 69– 75. (In Spain). [Google Scholar]
5. Jiménez NI , Guevara-González RG , Rico-García E . El ADN extracelular: un elicitor novedoso en la agricultura. Perspect Cienc Tecnol. 2024; 7( 12): 26– 39. (In Spain). [Google Scholar]
6. Kasi IK , Subramanyam K , Vysali P . A study on the management of biotic and abiotic threats in chilli crop cultivation. Pharma Innov J. 2021; 10( 12): 1741– 8. [Google Scholar]
7. Ullah N , Khan A , Younis T , Maqbool H , Iqbal M , Ali M , et al. Advances in nanocomposite-based fertilizers for sustainable agricultural practices. Proc Pak Acad Sci B Life Environ Sci. 2025; 62( 1): 1– 18. doi:10.53560/ppasb(62-1)1071. [Google Scholar] [CrossRef]
8. Das A , Ghosh S , Pramanik N . Chitosan biopolymer nanocomposites for agriculture applications. In: Biopolymeric Nanoparticles for Agricultural Applications. Cham, Switzerland: Springer; 2024. p. 209– 40. doi:10.1007/978-3-031-68834-8_8. [Google Scholar] [CrossRef]
9. AOAC . Official Methods of Analysis of AOAC. 18th ed. Gaithersburg, MD, USA: Association of Official Analytical Chemists; 2005. [Google Scholar]
10. AOAC . Official Methods of Analysis of the AOAC, Methods 932.06, 925.09, 985.29, 923.03. Arlington, VA, USA: Association of Official Analytical Chemists; 1990. [Google Scholar]
11. Porras-Barrientos LD , González-Hurtado MI , Ochoa-González OA , Sotelo-Díaz LI , Camelo-Méndez GA , Quintanilla-Carvajal MX . Colorimetric image analysis as a factor in assessing the quality of pork ham slices during storage. Rev Mex Ing Quim. 2015; 14: 243– 52. (In Spain). [Google Scholar]
12. Amador-Mendoza A , Huerta-Ochoa S , Herman-Lara E , Membrillo-Venegas L , Aguirre-Cruz A , Vivar-Vera MA , et al. Efecto de la purificación química, biológica y física en la recuperación de quitina de exoesqueletos de camarón (Penaeus sp.) y chapulín (Sphenarium purpurascens). Rev Mex Ing Quim. 2016; 15: 711– 25. (In Spain). [Google Scholar]
13. Lara-Capistrán L , Zulueta-Rodríguez R , Murillo-Amador B , Romero-Bastidas M , Rivas-García T , Hernández-Montiel LG . Respuesta agronómica del chile dulce (Capsicum annuum L.) a la aplicación de Bacillus subtilis y lombricomposta en invernadero. Terra Latinoam. 2020; 38: 693– 704. (In Spain). [Google Scholar]
14. Ramírez-Seañez AR , Alfonso-García JM , Hernández-Hernández H , Palacios-Torres RE , Ramírez-Meraz M , Borroel-García VJ . Fertilización potásica en líneas mejoradas y material criollo de chile soledad (Capsicum annuum L.) [Internet]. 2023 [cited 2025 Dec 8]. Available from: https://www.scielo.org.mx/pdf/era/v10nspe3/2007-901X-era-10-iii-e3884.pdf. (In Spain). [Google Scholar]
15. Castillo-Aguilar CD . Producción de Planta de Chile Habanero (Capsicum chinense Jacq.) [Internet]. 2015 [cited 2025 Sep 1]. Available from: https://revista-agroproductividad.org/index.php/agroproductividad/article/view/676. (In Spain). [Google Scholar]
16. Steiner AA . The universal nutrient solution. In: Proceedings of the 6th International Congress on Soilless Culture; 1984 Apr 29–May 5; Lunteren, The Netherlands. p. 633– 49. [Google Scholar]
17. Alemán-Pérez RD , Domínguez-Brito J , Rodríguez-Guerra S , Soria-Re S , Torres-Gutiérrez R , Vargas-Burgos JC , et al. Indicadores morfofisiológicos y productivos del pimiento sembrado en invernadero y a campo abierto en las condiciones de la Amazonía ecuatoriana. Cent Agrícola. 2018; 45: 14– 23. (In Spain). [Google Scholar]
18. Tucuch-Haas CJ , Alcántar-González G , Ordaz-Chaparro VM , Santizo-Rincón JA , Larqué-Saavedra A . Production and quality of habanero pepper (Capsicum chinense Jacq.) with different NH4+/NO3− ratios and size of substrate particles. Terra Latinoam. 2012; 30: 9– 15. (In Spain). [Google Scholar]
19. Swart ED , Groenwold R , Kanne HJ , Stam P , Marcelis LFM , Voorrips RE . Estimación no destructiva del área foliar para plantas de diferentes edades y accesiones de Capsicum annuum L. J Hortic Sci Biotechnol. 2004; 34: 764– 70. (In Spain). [Google Scholar]
20. Cruz-Crespo E , Can-Chulim A , Bugarín-Montoya R , Pineda-Pineda J , Flores-Canales R , Juárez-López P , et al. Concentración nutrimental foliar y crecimiento de chile serrano en función de la solución nutritiva y el sustrato. Rev Fitotec Mex. 2014; 37: 289– 95. (In Spain). [Google Scholar]
21. Porra RJ . La accidentada historia del desarrollo y uso de ecuaciones simultáneas para la determinación precisa de las clorofilas a y b. Investig Fotosíntesis. 2002; 73: 149– 56. (In Spain). doi:10.1023/A:1020470224740. [Google Scholar] [CrossRef]
22. Álvarez-Herrera JG , Vélez JE , Jaime-Guerrero M . Characterization of cape gooseberry (Physalis peruviana L.) fruits from plants irrigated with different regimens and calcium doses. Rev Colomb Cienc Hortic. 2022; 16: e13269. (In Spain). doi:10.17584/rcch.2022v16i1.13269. [Google Scholar] [CrossRef]
23. Roacho-Cortés E , Castellanos-Ramos JZ , Etchevers-Barra JD . Field diagnostic techniques to determine nitrogen in maize. Terra Latinoam. 2021; 39: 1– 12. (In Spain). doi:10.28940/terra.v39i0.820. [Google Scholar] [CrossRef]
24. NMX-FF-025-2015. Productos alimenticios no industrializados para uso humano. Fruta fresca—Chile (Capsicum spp.) especificaciones. México: Secretaría de Economía; 2015 [cited 2025 Sep 1]. Available from: https://www.dof.gob.mx/nota_detalle_popup.php?codigo=5379404&utm_source=chatgpt.com. (In Spain). [Google Scholar]
25. Valadez-Sánchez YM , Olivares-Sáenz E , Vázquez-Alvarado RE , Esparza-Rivera JR , Preciado-Rangel P , Valdez-Cepeda RD , et al. Calidad y concentración de capsaicinoides en genotipos de chile Serrano (Capsicum annuum L.) producidos bajo fertilización orgánica. Phyton. 2016; 85: 21– 6. (In Spain). doi:10.32604/phyton.2016.85.021. [Google Scholar] [CrossRef]
26. Maurya VK , Gothandam KM , Ranjan V , Shakya A , Pareek S . Effect of drying methods (microwave vacuum, freeze, hot air and sun drying) on physical, chemical and nutritional attributes of five pepper (Capsicum annuum var. annuum) cultivars. J Sci Food Agric. 2018; 98( 9): 3492– 500. doi:10.1002/jsfa.8868. [Google Scholar] [CrossRef]
27. González-Zamora A , Sierra-Campos E , Pérez-Morales R , Vázquez-Vázquez C , Gallegos-Robles MA , López-Martínez JD , et al. Measurement of capsaicinoids in chiltepin hot pepper: a comparison study between spectrophotometric method and high performance liquid chromatography analysis. J Chem. 2015; 2015: 709150. doi:10.1155/2015/709150. [Google Scholar] [CrossRef]
28. González M , Silva J . Síntesis de nanopartículas de magnetita recubiertas de quitosano para la adsorción de cromo hexavalente. Perfiles. 2023; 1: 78– 89. (In Spain). [Google Scholar]
29. Martínez AG , Díaz GC , Ramírez RL . Estudio comparativo de obtención, caracterización y actividad antioxidante de quitosano a partir de exoesqueletos de camarón estero y camarón de altamar. Investig Y Desarro En Cienc Y Tecnol De Aliment. 2019; 4: 1002– 13. (In Spain). [Google Scholar]
30. Castillo IEP , Narváez GEC , Morillo DJL , Márquez ACL , Cantillo LCM , Bonilla ALV , et al. Influencia de tratamientos químicos sobre el rendimiento y calidad del quitosano de exoesqueletos de cangrejos. Rev Fac Agron. 2020; 37: 100– 6. (In Spain). [Google Scholar]
31. Luo Q , Wang Y , Han Q , Ji L , Zhang H , Fei Z , et al. Comparison of the physicochemical, rheological, and morphologic properties of chitosan from four insects. Carbohydr Polym. 2019; 209: 266– 75. doi:10.1016/j.carbpol.2019.01.030. [Google Scholar] [CrossRef]
32. De Castro RJS , Ohara A , dos Santos Aguilar JG , Domingues MAF . Nutritional, functional and biological properties of insect proteins: processes for obtaining, consumption and future challenges. Trends Food Sci Technol. 2018; 76: 82– 9. doi:10.1016/j.tifs.2018.04.006. [Google Scholar] [CrossRef]
33. Hernández-Cocoletzi H , Águila-Almanza E , Flores-Agustín O , Viveros-Nava EL , Ramos-Cassellis E . Obtención y caracterización de quitosano a partir de exoesqueletos de camarón. Superf Vacío. 2009; 22: 57– 60. (In Spain). [Google Scholar]
34. Torres SO , Torres OB , Peña EP . Obtención de quitosano a partir de residuos pesqueros y su valoración potenciométrica. Braz J Sci. 2023; 2( 2): 32– 8. (In Spain). doi:10.14295/bjs.v2i2.240. [Google Scholar] [CrossRef]
35. Castro MN , Vidal CC . Obtención y caracterización de quitina y quitosano del Emerita analoga a escala piloto. Tzhoecoen. 2015; 7( 2): 182– 97. (In Spain). [Google Scholar]
36. Alvarenga ES . Characterization and properties of chitosan. In: Biotechnology of biopolymers. London, UK: IntechOpen; 2011. p. 91– 108. doi:10.5772/17020. [Google Scholar] [CrossRef]
37. Pérez WA , Marín JA , López JN , Burgos MA , Ríos LA . Desarrollo de un proceso piloto eco-amigable para la producción de quitosano a partir de desechos de conchas de camarón. Environ Process. 2022; 9( 3): 55. doi:10.1007/s40710-022-00605-8. [Google Scholar] [CrossRef]
38. Suárez-Villa AJ , Cuenca-Nevárez GJ , Macias-Chila RR , Falcones-Molina EL . Caracterización de la Harina de exoesqueleto de camarón (Litopenaeus sp). MQRInvestigar. 2023; 7( 2): 1408– 32. (In Spain). doi:10.56048/mqr20225.7.2.2023.1408-1432. [Google Scholar] [CrossRef]
39. Cisneros-Pérez I , Curbelo-Hernández C , Andrade-Díaz C , Giler-Molina JM . Evaluación de la extracción enzimática de quitina a partir del exoesqueleto de camarón. Cent Azúcar. 2019; 46( 1): 51– 63. (In Spain). [Google Scholar]
40. Luna M . Obtención de quitosano a partir de quitina para su empleo en conservación de frutillas y moras [ master’s thesis]. Quito, Ecuador: Universidad Central del Ecuador; 2012. (In Spain). [Google Scholar]
41. Álvarez J , Castro ON , Gómez OT . Adsorción de azul de metileno con biopolímeros (quitosano calcáreo y quitosano) obtenidos de las cabezas de langostinos a nivel piloto. Rev Iberoam Polímeros. 2019; 20( 3): 90– 104. (In Spain). [Google Scholar]
42. Velasco JD . Producción de quitosano a partir de desechos de camarón generados del procesamiento industrial. Investig Y Desarro En Cienc Y Tecnol De Aliment. 2019; 4: 897– 901. (In Spain). [Google Scholar]
43. Ibitoye EB , Lokman IH , Hezmee MM , Goh YM , Zuki AZ , Jimoh AA . Extraction and physicochemical characterization of chitin and chitosan isolated from house cricket. Biomed Mater. 2018; 13( 2): 025009. doi:10.1088/1748-605x/aa9dde. [Google Scholar] [CrossRef]
44. Barra A , Romero A , Beltramino J . Obtención de quitosano [Internet]. 2012 [cited 2025 Sep 1]. Available from: https://www.produccion-animal.com.ar/produccion_peces/piscicultura/173-Quitosano.pdf. (In Spain). [Google Scholar]
45. Romero-Serrano A , Pereira J . Estado del arte: quitosano, un biomaterial versátil. Estado del arte desde su obtención a sus múltiples aplicaciones. Rev Ing UC. 2020; 27( 2): 118– 35. (In Spain). [Google Scholar]
46. Colina MA . Evaluación de los procesos para la obtención química de quitina y quitosano a partir de desechos de cangrejos. Escala piloto e industrial. Rev Iberoam Polímeros. 2014; 14: 1– 15. (In Spain). [Google Scholar]
47. Kurita K . Chitin and chitosan: functional biopolymers from marine crustaceans. Mar Biotechnol. 2006; 8( 3): 203– 26. doi:10.1007/s10126-005-0097-5. [Google Scholar] [CrossRef]
48. Rinaudo M . Chitin and chitosan: properties and applications. Prog Polym Sci. 2006; 31( 7): 603– 32. doi:10.1016/j.progpolymsci.2006.06.001. [Google Scholar] [CrossRef]
49. Jayakumar R , Prabaharan M , Sudheesh Kumar PT , Nair SV , Tamura H . Biomaterials based on chitin and chitosan in wound dressing applications. Biotechnol Adv. 2011; 29( 3): 322– 37. doi:10.1016/j.biotechadv.2011.01.005. [Google Scholar] [CrossRef]
50. Sreelakshmi P , Gladis R , Rani B , Shajan VR , Aparna B , Swaroop R . Chitosan and its derivatives for agriculture applications: a review. Int J Plant Soil Sci. 2024; 36( 10): 577– 89. doi:10.9734/ijpss/2024/v36i105108. [Google Scholar] [CrossRef]
51. Jeon YJ , Park PJ , Kim SK . Antimicrobial effect of chitooligosaccharides produced by bioreactor. Carbohydr Polym. 2001; 44( 1): 71– 6. doi:10.1016/S0144-8617(00)00200-9. [Google Scholar] [CrossRef]
52. Martínez-Robinson K , Martínez-Inzunza A , Rochín-Wong S , Rodriguez-Cordova RJ , Vasquez-Garcia SR , Fernández-Quiroz D . Physicochemical study of chitin and chitosan obtained from the exoskeleton of California brown shrimp (Farfantepenaeus californiensis). Biotecnia. 2022; 24( 2): 28– 35. doi:10.18633/biotecnia.v24i2.1616. [Google Scholar] [CrossRef]
53. Bolaños Dircio A , Jiménez JT , Rodríguez Barrera MÁ , Hernández Flores G , Toledo Hernández E , Palemón Alberto F , et al. Bacillus licheniformis M2-7 improves growth, development and yield of Capsicum annuum L. Agrociencia. 2021; 55( 3): 227– 42. (In Spain). doi:10.47163/agrociencia.v55i3.2415. [Google Scholar] [CrossRef]
54. Wang S , Li B , Wang W , Zhang X . Preparation and characterization of chitosan nanoparticles for drug delivery. Int J Biol Macromol. 2010; 46: 105– 12. [Google Scholar]
55. Sugimoto M , Morimoto M , Sashiwa H , Saimoto H , Shigemasa Y . Preparation and characterization of water-soluble chitin and chitosan derivatives. Carbohydrate Polymers. 1998; 36( 1): 49– 59. doi:10.1016/S0144-8617(97)00235-X. [Google Scholar] [CrossRef]
56. Pillai CKS , Paul W , Sharma CP . Chitin and chitosan polymers: chemistry, solubility and fiber formation. Prog Polym Sci. 2009; 34( 7): 641– 78. doi:10.1016/j.progpolymsci.2009.04.001. [Google Scholar] [CrossRef]
57. Qin C , Li H , Xiao Q , Liu Y , Zhu J , Du Y . Water-soluble chitosan: preparation, characterization and antimicrobial activity. Carbohydr Polym. 2006; 63: 367– 74. doi:10.1016/j.carbpol.2005.09.023. [Google Scholar] [CrossRef]
58. Ardelean IV , Popa MI , Hudiță A , Zănoagă M , Dinescu S , Costache M , et al. Chitosan-based bioactive materials for tissue engineering applications: a review. Bioact Mater. 2020; 5( 4): 709– 41. doi:10.1016/j.bioactmat.2020.01.012. [Google Scholar] [CrossRef]
59. Izquierdo-Oviedo H , Calaña-Janeiro VM , Lluvia de Abril A , Rodríguez-Hernández M , Rodríguez-Llanes Y , Guillama-Alonso R , et al. Utilización de bioestimulador del crecimiento QuitoMax® en la aclimatización de plántulas de pimiento. Cultiv Trop. 2022; 43: 5. (In Spain). doi:10.14483/25423704.1656. [Google Scholar] [CrossRef]
60. Muthu M , Gopal J , Chun S , Devadoss AJP , Hasan N , Sivanesan I . Crustacean waste-derived chitosan: antioxidant properties and future perspective. Antioxidants. 2021; 10( 2): 228. doi:10.3390/antiox10020228. [Google Scholar] [CrossRef]
61. Álvarez-Pinedo A , Calderón-Puig AA , Fundora-Sánchez LR , Rodríguez-Fajardo A . Manejo de bioproductos en el cultivo del pimiento (Capsicum annuum L.) en condiciones de organopónico. Agroecosistemas. 2018; 6: 121– 7. (In Spain). [Google Scholar]
62. García-Ochoa F , Santos VE , Casas JA , Gómez E . Xanthan gum: production, recovery, and properties. Biotechnol Adv. 2000; 18( 7): 549– 79. doi:10.1016/S0734-9750(00)00050-1. [Google Scholar] [CrossRef]
63. Badawy MEI , Rabea EI . A biopolymer chitosan and its derivatives as promising antimicrobial agents against plant pathogens and their applications in crop protection. Int J Carbohydr Chem. 2011; 2011( 1): 460381. doi:10.1155/2011/460381. [Google Scholar] [CrossRef]
64. Bautista-Baños S , Hernández-Lauzardo AN , Velázquez-del Valle MG , Hernández-López M , Ait Barka E , Bosquez-Molina E , et al. Chitosan as a potential natural compound to control pre and postharvest diseases of horticultural commodities. Crop Prot. 2006; 25( 2): 108– 18. doi:10.1016/j.cropro.2005.03.010. [Google Scholar] [CrossRef]
65. El Hadrami A , Adam LR , El Hadrami I , Daayf F . Chitosan in plant protection. Mar Drugs. 2010; 8( 4): 968– 87. doi:10.3390/md8040968. [Google Scholar] [CrossRef]
66. Xing K , Zhu X , Peng X , Qin S . Chitosan antimicrobial and eliciting properties for pest control in agriculture: a review. Agron Sustain Dev. 2015; 35( 2): 569– 88. doi:10.1007/s13593-014-0252-3. [Google Scholar] [CrossRef]
67. Katiyar D , Hemantaranjan A , Singh B . Chitosan as a promising natural compound to enhance potential physiological responses in plant: a review. Indian J Plant Physiol. 2015; 20( 1): 1– 9. doi:10.1007/s40502-015-0139-6. [Google Scholar] [CrossRef]
68. Malerba M , Cerana R . Chitosan effects on plant systems. Int J Mol Sci. 2016; 17( 7): 996. doi:10.3390/ijms17070996. [Google Scholar] [CrossRef]
69. Sharif R , Mujtaba M , Ur Rahman M , Shalmani A , Ahmad H , Anwar T , et al. The multifunctional role of chitosan in horticultural crops: a review. Molecules. 2018; 23( 4): 872. doi:10.3390/molecules23040872. [Google Scholar] [CrossRef]
70. Verlee A , Mincke S , Stevens CV . Recent developments in antibacterial and antifungal chitosan and its derivatives. Carbohydr Polym. 2017; 164: 268– 83. doi:10.1016/j.carbpol.2017.02.001. [Google Scholar] [CrossRef]
71. Nacional IP , Bautista-Baños S , Ventura-Aguilar RI , Nacional IP , Correa-Pacheco Z , Nacional IP , et al. Chitosan: a versatile antimicrobial polysaccharide for fruit and vegetables in postharvest—a review. Rchsh. 2017; 23( 2): 103– 21. doi:10.5154/r.rchsh.2016.11.030. [Google Scholar] [CrossRef]
72. Jiménez-Gómez CP , Cecilia JA . Chitosan: a natural biopolymer with a wide and varied range of applications. Molecules. 2020; 25( 17): 3981. doi:10.3390/molecules25173981. [Google Scholar] [CrossRef]
73. Tan SC , Tan TK , Wong SM , Khor E . The chitosan yield of zygomycetes at their optimum harvesting time. Carbohydr Polym. 1996; 30( 4): 239– 42. doi:10.1016/S0144-8617(96)00052-5. [Google Scholar] [CrossRef]
74. Gamboa-Angulo JJ , Ruíz-Sánchez E , Alvarado-López CJ , Gutiérrez-Miceli F , Ruíz-Valdiviezo VM , Medina-Dzul KB . Efecto de biofertilizantes microbianos en Las características agronómicas de la planta y calidad del fruto del Chile xcat’ik (Capsicum annuum L.). Terra. 2020; 38( 4): 817– 26. (In Spain). doi:10.28940/terra.v38i4.716. [Google Scholar] [CrossRef]
75. Reyes-Pérez J , Enríquez-Acosta EA , Ramírez-Arrebato MÁ , Zúñiga Valenzuela E , Lara-Capistrán L , Hernández-Montiel LG . Efecto del quitosano sobre variables del crecimiento, rendimiento y contenido nutricional del tomate. Remexca. 2020; 11( 3): 457– 65. (In Spain). doi:10.29312/remexca.v11i3.2392. [Google Scholar] [CrossRef]
76. Calvo P , Remuñán-López C , Vila-Jato JL , Alonso MJ . Novel hydrophilic chitosan-polyethylene oxide nanoparticles as protein carriers. J Appl Polym Sci. 1997; 63( 1): 125– 32. doi:10.1002/(SICI)1097-4628(19970103)63:1125::AID-APP13>3.0.CO;2-4. [Google Scholar] [CrossRef]
77. Fernández M , Buzón P , Ramos JL , Del Campo R . Obtención de quitosano a partir de hongos. Rev Iberoam Micol. 2010; 27( 2): 74– 80. (In Spain). doi:10.1016/j.riam.2010.01.007. [Google Scholar] [CrossRef]
78. Kim KW , Thomas RL . Antioxidative activity of chitosans with varying molecular weights. Food Chem. 2007; 101( 1): 308– 13. doi:10.1016/j.foodchem.2006.01.038. [Google Scholar] [CrossRef]
79. Shahidi F , Arachchi JKV , Jeon YJ . Food applications of chitin and chitosans. Trends Food Sci Technol. 1999; 10( 2): 37– 51. doi:10.1016/S0924-2244(99)00017-5. [Google Scholar] [CrossRef]
80. Je JY , Kim SK . Chitosan derivatives killed bacteria by disrupting the outer and inner membrane. J Agric Food Chem. 2006; 54( 18): 6629– 33. doi:10.1021/jf061310p. [Google Scholar] [CrossRef]
81. Jeon YJ , Shahidi F , Kim SK . Preparation of chitin and chitosan oligomers and their applications in physiological functional foods. Food Rev Int. 2000; 16( 2): 159– 76. doi:10.1081/FRI-100100286. [Google Scholar] [CrossRef]
82. Kadir A , Setu A , Sharmin S , Hossain MA , Tahjib-Ul-Arif M , Bhuiyan MJH , et al. Chitosan enhances drought tolerance in maize (Zea mays L.) by promoting growth and chlorophyll content while reducing hydrogen peroxide levels. Fundam Appl Agric. 2024; 9( 2): 195– 203. doi:10.5455/faa.216212 [Google Scholar] [CrossRef]
83. Austin PR , Brine CJ , Castle JE , Zikakis JP . Chitin: new facets of research. Science. 1981; 212( 4496): 749– 53. doi:10.1126/science.7221561. [Google Scholar] [CrossRef]
84. Ravi Kumar MNV . A review of chitin and chitosan applications. React Funct Polym. 2000; 46( 1): 1– 27. doi:10.1016/S1381-5148(00)00038-9. [Google Scholar] [CrossRef]
85. Tharanathan RN , Kittur FS . Chitin—the undisputed biomolecule of great potential. Crit Rev Food Sci Nutr. 2003; 43( 1): 61– 87. doi:10.1080/10408690390826455. [Google Scholar] [CrossRef]
86. Rabea EI , Badawy ME , Stevens CV , Smagghe G , Steurbaut W . Chitosan as antimicrobial agent: applications and mode of action. Biomacromolecules. 2003; 4( 6): 1457– 65. doi:10.1021/bm034130m. [Google Scholar] [CrossRef]
87. Aranaz I , Mengibar M , Harris R , Panos I , Miralles B , Acosta N , et al. Functional characterization of chitin and chitosan. Curr Chem Biol. 2009; 3( 2): 203– 30. doi:10.2174/2212796810903020203. [Google Scholar] [CrossRef]
88. Islam S , Bhuiyan MAR , Islam MN . Chitin and chitosan: structure, properties and applications in biomedical engineering. J Polym Environ. 2017; 25: 854– 66. doi:10.1007/s10924-016-0865-5. [Google Scholar] [CrossRef]
89. Kean T , Thanou M . Biodegradation, biodistribution and toxicity of chitosan. Adv Drug Deliv Rev. 2010; 62( 1): 3– 11. doi:10.1016/j.addr.2009.09.004. [Google Scholar] [CrossRef]
90. Dash M , Chiellini F , Ottenbrite RM , Chiellini E . Chitosan—a versatile semi-synthetic polymer in biomedical applications. Prog Polym Sci. 2011; 36( 8): 981– 1014. doi:10.1016/j.progpolymsci.2011.02.001. [Google Scholar] [CrossRef]
91. Kartik R , Muthusamy S , Shelly K , Surendiran M . Chemical modifications of chitin and chitosan fibers and filaments: a review. Macromol Chem Phys. 2025; 224( 5): e202400422. doi:10.1002/macp.202400422. [Google Scholar] [CrossRef]
92. Hamed I , Özogul F , Regenstein JM . Industrial applications of crustacean by-products (chitin, chitosan, and chitooligosaccharides): a review. Trends Food Sci Technol. 2016; 48: 40– 50. doi:10.1016/j.tifs.2015.11.007. [Google Scholar] [CrossRef]
93. Patrulea V , Ostafe V , Borchard G , Jordan O . Chitosan as a starting material for wound healing applications. Eur J Pharm Biopharm. 2015; 97: 417– 26. doi:10.1016/j.ejpb.2015.08.004. [Google Scholar] [CrossRef]
94. Jayakumar R , Prabaharan M , Nair SV , Tamura H . Novel chitin and chitosan nanofibers in biomedical applications. Biotechnol Adv. 2010; 28( 1): 142– 50. doi:10.1016/j.biotechadv.2009.11.001. [Google Scholar] [CrossRef]
95. Ramadan M , El-Saber M , Adelhamid AE , El-Sayed A . Effect of nano-chitosan encapsulated spermine on growth, productivity and bioactive compounds of Capsicum annuum L. under salinity stress. Egypt J Chem. 2022; 65( 8): 197– 207. doi:10.21608/ejchem.2021.105793.4870. [Google Scholar] [CrossRef]
96. Younes I , Rinaudo M . Chitin and chitosan preparation from marine sources. Structure, properties and applications. Mar Drugs. 2015; 13( 3): 1133– 74. doi:10.3390/md13031133. [Google Scholar] [CrossRef]
97. Rajoka MSR , Zhao L , Mehwish HM , Wu Y , Mahmood S , Arfat Y , et al. Chitosan and its derivatives: synthesis, biotechnological applications, and future challenges. Appl Microbiol Biotechnol. 2019; 103: 1557– 71. doi:10.1007/s00253-018-9550-z. [Google Scholar] [CrossRef]
98. Muzzarelli RAA . Chitins and chitosans for the repair of wounded skin, nerve, cartilage and bone. Carbohydr Polym. 2009; 76( 2): 167– 82. doi:10.1016/j.carbpol.2008.11.002. [Google Scholar] [CrossRef]
99. Chi C , Bun N , Ho W , Yee C . Chitosan: an update on potential biomedical and pharmaceutical applications. Mar Drugs. 2015; 13( 8): 5156– 86. doi:10.3390/md13085156. [Google Scholar] [CrossRef]
100. Divya K , Jisha MS . Chitosan nanoparticles preparation and applications. Environ Chem Lett. 2018; 16( 1): 101– 12. doi:10.1007/s10311-017-0670-y. [Google Scholar] [CrossRef]
101. Shukla SK , Mishra AK , Arotiba OA , Mamba BB . Chitosan-based nanomaterials: a state-of-the-art review. Int J Biol Macromol. 2013; 59: 46– 58. doi:10.1016/j.ijbiomac.2013.04.043. [Google Scholar] [CrossRef]
102. Dutta PK , Dutta J , Tripathi VS . Chitin and chitosan: chemistry, properties and applications. J Sci Ind Res. 2004; 63( 1): 20– 31. [Google Scholar]
103. Ali A , Ahmed S . A review on chitosan and its nanocomposites in drug delivery. Int J Biol Macromol. 2018; 109: 273– 86. doi:10.1016/j.ijbiomac.2017.12.078. [Google Scholar] [CrossRef]
104. Luo Y , Wang Q . Recent development of chitosan-based polyelectrolyte complexes with natural polysaccharides for drug delivery. Int J Biol Macromol. 2014; 64: 353– 67. doi:10.1016/j.ijbiomac.2013.12.017. [Google Scholar] [CrossRef]
105. Yuan Y , Chesnutt BM , Haggard WO , Bumgardner JD . Deacetylation of chitosan: material characterization and in vitro evaluation via albumin adsorption and pre-osteoblastic cell cultures. Materials. 2011; 4( 8): 1399– 416. doi:10.3390/ma4081399. [Google Scholar] [CrossRef]
106. Holguin-Peña RJ , Vargas-López JM , López-Ahumada GA , Rodríguez-Félix F , Borbón-Morales CG , Rueda-Puente EO . Efecto de quitosano y consorcio simbiótico benéfico en el rendimiento de sorgo en la zona indígena “Mayos” en Sonora. Terra. 2020; 38( 3): 705– 14. (In Spain). doi:10.28940/terra.v38i2.669. [Google Scholar] [CrossRef]
107. Bautista-Baños S , Hernández-López M , Bosquez-Molina E , Wilson CL . Effects of chitosan and plant extracts on growth of Colletotrichum gloeosporioides, anthracnose levels and quality of Papaya fruit. Crop Prot. 2003; 22( 9): 1087– 92. doi:10.1016/S0261-2194(03)00117-0. [Google Scholar] [CrossRef]
108. Bautista-Baños S , Hernández-Lauzardo AN , Bosquez-Molina E , Wilson CL . Chitosan as a potential alternative to control postharvest decay in fruits and vegetables. Rev Mex Fitopatol. 2006; 24( 1): 97– 105. (In Spain). [Google Scholar]
Cite This Article
 Copyright © 2026 The Author(s). Published by Tech Science Press.
This work is licensed under a Creative Commons Attribution 4.0 International License , which permits unrestricted use, distribution, and reproduction in any medium, provided the original work is properly cited.
 Downloads
 Citation Tools