
 Submit a Paper
 Propose a Special lssue
 Open Access
ARTICLE

Integrative Analysis of Genetic-Ecological Factors Shaping Epimedium Chemical Diversity
1 Key Laboratory of Beijing for Identification and Safety Evaluation of Chinese Medicine, Institute of Chinese Materia Medica, China Academy of Chinese Medical Sciences, Beijing, 100700, China
2 Jilin Aodong Medicinal Seed Technology Co., Ltd., Yanbian, 000623, China
3 Henan Key Laboratory of Zhang Zhongjing Formulae and Herbs for Immunoregulation, Nanyang Institute of Technology, Nanyang, 473000, China
* Corresponding Author: Linlin Dong. Email:
Phyton-International Journal of Experimental Botany 2026, 95(1), 9 https://doi.org/10.32604/phyton.2025.074419
Received 10 October 2025; Accepted 08 December 2025; Issue published 30 January 2026
 View Full Text
 Download PDF
Abstract
Epimedium is commonly used to treat bone injury and kidney disease, with prenylated flavonol glycosides (PFGs) as its active ingredients. It has attracted much attention due to prominent healthcare and therapeutic effects, but faces problems of adulteration with closely related species and confusion about geographical origins. In this study, multiple technical approaches were employed to identify its genetic characteristics and metabolic differences. Based on DNA barcoding, 20 batches of samples were analyzed. The genetic distances of matK, ITS and psbA-trnH within species were all smaller than those between species, and psbA-trnH along with ITS + psbA-trnH proved most effective in distinguishing botanical sources. With Inter-simple sequence repeat (ISSR) technology, 12 highly polymorphic and reproducible primers were selected from 21, and 189 alleles were detected. Epimedium sagittatum showed distinct genetic diversity. Samples with similar genetic distance and geographical location also tended to cluster together. Eight index components were analyzed, and their contents showed significant differences. The total content ranged from 0.50% to 7.09%, and icariin and epimedin C were identified as potential biomarkers. Integrative analysis revealed that the differences in index components were jointly driven by genetic diversity and ecological factors. Additionally, “mean temperature of driest quarter”, “precipitation seasonality”, and “temperature annual range” were identified as key environmental factors. This study provides a reliable experimental basis for the authenticity and quality evaluation of Epimedium.Keywords
Supplementary Material
Supplementary Material FileEpimedium, commonly known as “Horny Goat Weed” is not only a natural aphrodisiac but also a popular horticultural plant in Europe. Its leaves have been utilized in traditional Chinese medicine (TCM) and health supplements. In traditional medicine, it is used to tonify the kidney, enhance yang energy, and strengthen bones. Modern pharmacological studies have further demonstrated its antitumor [1] and immunomodulatory activities [2]. Icaritin soft capsules were approved by the National Medical Products Administration of China in 2022 for treating hepatocellular carcinoma. With the growth of the global health industry, Epimedium holds great promise for pharmaceutical and functional food applications. The demand for Epimedium is gradually increasing, but obtaining high-quality Epimedium remains challenging, primarily due to its botanical characteristics. Specifically, there are over 60 species in the genus Epimedium, and some of them have few differences in traits among species, making visual identification challenging [3].
Four species of the Epimedium genus have been included in the Pharmacopoeia of the People’s Republic of China (PRC Pharmacopoeia) as traditional Chinese medicinal materials for the use of Epimedium, namely Epimedium brevicornu, E. sagittatum, E. pubescens, and E. koreanum [4]. Epimedium contains metabolic components such as flavonoids, alkaloids, polysaccharides, and lignins. Among these, prenylated flavonol glycosides (PFGs), characterized by prenyl group structures, are considered active components of Epimedium [5], including icariin, icaritin, and baohuoside I. Epimedium plants from different species and habitats exhibit variations in the types and contents of their components, which affect their clinical efficacy and commercial value. Therefore, establishing effective strategies to identify plant origins, analyze genetic and chemical profiles, and guarantee herb quality is essential.
Accurate identification of medicinal plant origins is critical for ensuring herbal quality and efficacy. DNA barcoding technology can provide stable and reliable species identification by analyzing the specific DNA fragment sequences of plants [6]. The internal transcribed spacer (ITS) region, with high interspecific variation and intraspecific conservation, is widely used for species discrimination. By analyzing the ITS sequence, it is possible to accurately distinguish the counterfeit products that pass off as TCMs, such as the genus Panax [7] and the genus Dendrobium [8]. The chloroplast matK gene exhibits a high evolutionary rate, yielding substantial sequence divergence among closely related species. In contrast, the psbA-trnH intergenic spacer accumulates many nucleotide variations, which can effectively discriminate between plant species with similar morphologies. For example, the psbA-trnH sequence can accurately identify specific species of the genus Syringa with highly similar appearances [9]. Given that Epimedium has a multi-source phenomenon, DNA barcoding is indispensable for resolving taxonomic uncertainties and ensuring therapeutic consistency in its index components.
The magnitude of genetic diversity indicators of a species is positively correlated with its ability to adapt to the environment [10]. Inter-simple sequence repeat (ISSR) technology, a molecular labeling method based on polymerase chain reaction (PCR), uses simple sequence repeat (SSR) as primers to amplify specific genomic regions [11]. ISSR has demonstrated excellent results in genetic diversity analysis when studying samples of different varieties and geographical origins, such as in a study on faba bean [12]. Therefore, ISSR markers can be utilized to screen and evaluate germplasm resources with unique genetic diversity, providing a foundation for breeding and improvement of new varieties of Epimedium.
Index components refer to specific chemical components in Chinese medicinal materials, TCM preparations, foods, health products, and other substances, serving as indicators of quality, characteristics, or efficacy. Different plant species or varieties synthesize and accumulate distinct index components. For example, Panax ginseng and P. quinquefolius (Araliaceae) differ in the types and proportions of ginsenosides they produce, despite belonging to the same genus [13]. Additionally, the growth environment can also influence TCM index components. However, limited research has investigated how species identity and growth environments shape variations in the index components of Epimedium, particularly the key environmental variables influencing the characteristics of these index components.
Association analyses between active ingredients and genetic characteristics or the environment have been reported in other species. Pearson correlation analysis indicated that the metabolites of Gastrodia elata were influenced by dominant ecological factors, such as moisture influencing phenolic glycoside content [14]. Chemical and phylogenetic analyses suggested that the metabolite differences of Leonurus japonicus from different origins were jointly influenced by genetic differences and environmental factors [15]. However, there are no definite reports on how genetics and the environment of Epimedium affect its quality at present. Therefore, our research focused on the current challenges of Epimedium research by performing multi-faceted identification and evaluation of collected Epimedium samples, including plant origin authentication via DNA barcoding, genetic diversity analysis using ISSR markers, and fingerprinting combined with index component quantification based on high-performance liquid chromatography (HPLC). Importantly, the impacts of genetic diversity and environmental factors on the multi-index components of Epimedium were analyzed. This study enables reliable and objective quality assessment of Epimedium materials, and provides data-driven insights for screening high-quality germplasm and optimizing breeding materials and cultivation environments.
2.1 Sample and Environmental Factor Collection
Twenty batches of Epimedium samples were collected from the major production areas in China based on accessibility. All samples were numbered (S1 to S20), and the plant name, growth type, and geographic information of the samples were recorded in Table 1. Fresh samples were shade-dried indoors until the leaves reached brittleness. Samples were ground into powder, sieved through a 40-mesh sieve, and stored at 25°C.
Environmental factors include geographical factors (longitude, latitude, altitude) and ecological factors. The ecological factors were sourced from the Worldclim (https://worldclim.org/), CliMond (https://climond.org/), and the geographic information system for global medicinal plants (GMPGIS) database, including twenty-one ecological factors that affect growth characteristics. Ecological factor data were extracted from GMPGIS based on the selected Epimedium sampling locations.
Table 1: Information on Epimedium samples.
| Serial Number | Type | Plant Name | Place of Origin | Longitude (E) | Latitude (N) | Altitude (m) |
|---|---|---|---|---|---|---|
| S1 | Wild | E. koreanum | Yanbian, Jilin | 128.9735 | 43.0957 | 736 |
| S2 | Cultivated | E. koreanum | Yanbian, Jilin | 128.9659 | 43.0872 | 502 |
| S3 | Wild | E. koreanum | Dunhua, Jilin | 126.2063 | 41.3640 | 1039 |
| S4 | Cultivated | E. koreanum | Baishan, Jilin | 126.7701 | 41.9580 | 943 |
| S5 | Wild | Unknown | Shangluo, Shaanxi | 110.0698 | 33.6902 | 1511 |
| S6 | Cultivated | E. sagittatum | Shangluo, Shaanxi | 110.3665 | 33.8294 | 1541 |
| S7 | Wild | E. pubescens | Shangluo, Shaanxi | 110.4038 | 34.2696 | 1475 |
| S8 | Cultivated | Unknown | Hanzhong, Shaanxi | 106.0135 | 33.4118 | 1263 |
| S9 | Cultivated | E. sagittatum | Shennongjia, Hubei | 110.6590 | 31.8290 | 870 |
| S10 | Cultivated | E. sagittatum | Shennongjia, Hubei | 110.4708 | 31.7732 | 773 |
| S11 | Cultivated | E. sagittatum | Shennongjia, Hubei | 110.5835 | 31.6838 | 1116 |
| S12 | Cultivated | E. sagittatum | Shennongjia, Hubei | 110.8681 | 31.6683 | 1522 |
| S13 | Cultivated | E. brevicornu | Lanzhou, Gansu | 103.9260 | 35.8946 | 2321 |
| S14 | Cultivated | E. brevicornu | Lanzhou, Gansu | 104.0224 | 36.2252 | 1774 |
| S15 | Cultivated | E. brevicornu | Linxia, Gansu | 103.1238 | 35.5418 | 2171 |
| S16 | Cultivated | E. sagittatum | Yichang, Hubei | 111.3103 | 30.2758 | 483 |
| S17 | Cultivated | E. sagittatum | Yichang, Hubei | 111.3118 | 30.2760 | 472 |
| S18 | Cultivated | E. sagittatum | Bijie, Guizhou | 105.2905 | 27.1756 | 1590 |
| S19 | Cultivated | E. sagittatum | Bijie, Guizhou | 105.3127 | 27.1740 | 1647 |
| S20 | Cultivated | E. wushanense | Dazhou, Sichuan | 108.0511 | 32.0888 | 981 |
Plant DNA Kit D3485 was purchased from Omega Bio-Tek (Guangzhou, China). The primers used for PCR were derived from the literature [16,17,18,19] and were synthesized by Shenggong Bioengineering Co., Ltd. (Shanghai, China) (Table S1). KOD OneTM PCR Master Mix was purchased from Toyo Textile Biotechnology Co., Ltd. (Shanghai, China). TS-GelRed nucleic acid dye solution was acquired from Tsingke Biotechnology Co., Ltd. (Beijing, China). Agarose and 50× TAE buffer were purchased from Shenggong Bioengineering Co., Ltd. (Shanghai, China) and Solarbio Science & Technology Co., Ltd. (Beijing, China), respectively. DL2000 Plus DNA Marker was purchased from Novizan Biotechnology Co., Ltd. (Nanjing, China). Reference standards, including epimedin A1, epimedin A, epimedin B, epimedin C, icariin, icariside I, baohuoside I, and anhydroicaritin, were all purchased from Yuanye Biotechnology Co., Ltd. (Shanghai, China). Liquid chromatography-grade methanol and acetonitrile were purchased from Thermo Fisher Scientific (Waltham, MA, USA). Ultrapure water was purchased from Wahaha Group Co., Ltd. (Hangzhou, China).
A NanoDrop 2000 spectrophotometer was purchased from Thermo Fisher Scientific (Waltham, MA, USA) for nucleic acid quantification. A T100 Thermal Cycler was purchased from Bio-Rad Laboratories, Inc. (Hercules, CA, USA) for PCR amplification. The nucleic acid electrophoresis system was purchased from Bio-Rad Laboratories, Inc. (Hercules, CA, USA). A Gel imaging analysis system was acquired from Junyi Dongfang Electrophoresis Equipment Co., Ltd. (Beijing, China). A high-throughput tissue grinder was purchased from Yuming Instrument Co., Ltd. (Shanghai, China) for sample preparation. An ultrasonic cleaner was purchased from Kunshan Ultrasonic Instrument Co., Ltd. (Suzhou, China). A high-performance liquid chromatograph equipped with a C18 chromatographic column (4.6 mm × 250 mm, 5 μm) was purchased from Agilent Technologies (Palo Alto, CA, USA) for component analysis.
2.3 DNA Extraction, PCR Amplification, and Agarose Gel Electrophoresis
Total DNA was extracted from twenty Epimedium samples, and their mass and concentration were assayed. Each DNA sample was diluted to approximately 40 ng·μL−1 and stored at −20°C.
Sequence alignment and pre-experiments were conducted on the commonly used barcodes of Epimedium, and rbcL was excluded. Three DNA barcoding regions, namely matK, ITS, and psbA-trnH, were selected for species identification. The sequences were synthesized to amplify the DNA barcodes of Epimedium samples. For genetic diversity analysis, ISSR primers were derived from 100 universal primers published by the University of British Columbia (UBC) in Canada, with twenty-one primers selected from prior studies to amplify polymorphic loci in Epimedium.
In the DNA barcoding identification experiment, the reaction system had a total volume of 25.0 μL, including 1.0 μL of DNA template (40 ng·μL−1), 1.0 μL each of 10 μmol/L forward and reverse primers, 12.5 μL of 2× Taq PCR Master Mix, and 9.5 μL of ddH2O. The total volume of the PCR amplification reaction system for the genetic diversity experiment was 25.0 μL, including 1.0 μL of 40 μL−1 DNA template, 1.5 μL of 10 μmol·L−1 primers, 10.0 μL of 2× TaqPCR Master Mix, and 12.5 μL of ddH2O. PCR amplification synthesized the corresponding target gene fragments, and the amplification products were stored at 4°C for future use.
The amplification products were detected by agarose gel electrophoresis using D2500 II DNA marker as the standard molecular weight and photographed on the ultraviolet gel imaging system.
2.4 DNA Sequencing and Sequence Alignment
DNA barcode fragments with correct amplification bands were sent to Shenggong Bioengineering Co., Ltd. for sequencing. High-quality sequencing results were processed using ContigExpress software. This involved stitching the sequences, removing primer regions and low-quality segments, and ultimately obtaining the complete DNA barcode sequence information. Each sample sequence was then subjected to a BLAST search using the NCBI BLAST tool. This was done to identify the best-matching Epimedium species based on the alignment results.
2.5 Quantification of Multi-Index Components
All reference standards were dissolved in methanol to prepare stock solutions. These were further diluted to generate standard solutions of varying concentrations, from which linear calibration curves were constructed by plotting peak area (y) against concentration (x) (Table S2). For sample preparation, a precise amount of powdered Epimedium material was weighed and extracted with methanol via ultrasonic treatment (300 W, 40 kHz) for 40 min. The extract was centrifuged at 10,000× g for 10 min, and the supernatant was filtered through a 0.22 μm microporous membrane to obtain a test solution (0.05 g·mL−1). Each sample was analyzed in triplicate (biological replicates), with results reported as mean ± standard deviation (SD). The chromatographic conditions were queried from the literature [20] and some modifications were made. The flow rate was 1.0 mL·min−1, the column temperature was 30°C, the injection volume was 5 μL, the detection wavelength was 270 nm, and the mobile phase was composed of water (A) and acetonitrile (B) under gradient elution: 0–30 min, 76%–74% A; 30–31 min, 74%–55% A; 31–45 min, 55%–53% A; 45–70 min, 53%–5% A.
The individual and combined sequences of the three DNA barcodes were analyzed. Sequence alignment was performed using the ClustalW algorithm implemented in MEGA X. After alignment, redundant fragments were trimmed to prepare the sequences for subsequent analysis. Genetic distances for each barcode were calculated, including total genetic distance across all sequences, average between-group distances, and average within-group distances. Neighbor-Joining (N-J) phylogenetic trees were constructed, with bootstrap sampling performed for 1000 replicates to assess branch support. Aligned sequences were subjected to k-mer counting using the Biostrings package in R (version 4.3.1) for principal component analysis (PCA).
Genetic diversity analysis was conducted using ISSR markers. Based on the results of the amplification electrophoresis patterns, for each primer at a specific migration position, the presence of a band was scored as “1”, and the absence as “0”. By statistically analyzing the amplification bands of each sample, a binary matrix database consisting of “0” and “1” was constructed. Genetic diversity parameters were calculated using POPGENE (version 1.32). These parameters included the number of observed alleles, the number of effective alleles, Nei’s genetic diversity index, Shannon’s information index, genetic similarity coefficient, and genetic distance. Subsequently, cluster analysis and kinship analysis of Epimedium were performed using NTSYSpc (version 2.10) following the Unweighted Pair Groups Method with Average (UPGMA). Additionally, genetic structure analysis was conducted on all samples using STRUCTURE (version 2.3.4).
The metabolite chromatograms of the twenty samples were imported into the Similarity Evaluation System of Traditional Chinese Medicine Chromatographic Fingerprint (version 2012) for analysis. A time window of 0.4 was set to generate the control chromatogram (R). Common peak data and similarity evaluation results were then obtained. PCA analysis, nonmetric multidimensional scaling (NMDS) analysis, and Orthogonal Partial Least Squares—Discriminant Analysis (OPLS-DA) were performed on the common peak data. The OPLS-DA analysis was carried out using the ropls package in R (version 4.3.1). Metabolites with Variable Importance in Projection (VIP) > 1 were identified as differential metabolites and visualized using the ggplot2 package.
Given the high correlation among certain ecological factors, which may lead to collinearity and affect the accuracy of the results, the obtained climate and soil factors were clustered using the Hmisc package in R (version 4.1.0) based on the Spearman correlation coefficient. Among the ecological factors with a correlation coefficient greater than 0.7, only one representative value was retained for multivariate correlation analysis.
Visualization of all detection and analysis data was carried out using ChiPlot (https://www.chiplot.online/). Histograms, binary figures, clustering heat maps, correlation heat maps, violin plots, PCA plots, NMDS analysis plots, Redundancy Analysis (RDA) plots, and interactive Mantel test correlation heat maps were generated.
3.1 DNA Barcoding Technology Effectively Identified the Plant Sources of Epimedium
Genus Epimedium is difficult to distinguish morphologically, necessitating molecular approaches for accurate identification [21]. DNA barcoding is a simple and precise choice to identify the actual plant sources of Epimedium. In this study, three DNA barcodes (matK, ITS, and psbA-trnH) were evaluated for their ability to distinguish 20 Epimedium samples.
The psbA-trnH barcode exhibited the highest discriminatory power, correctly assigning 14 samples to species such as E. brevicornu (S5, S13–S15) and E. sagittatum (S6, S9–S12, S16, S18), while matK resolved only E. koreanum (S1–S4) and ITS identified E. dewuense (S8) and E. jinchengshanense (S20) (Table 2). The psbA-trnH barcode has outstanding results in the differentiation of Epimedium, as its higher mutation rates in spacer regions generate more variable sites (Fig. S1). Upon analyzing the differences among the three DNA barcodes, a total of 57 variable sites were identified. Specifically, matK had eleven variable sites, ITS had twelve, and psbA-trnH had thirty-four variable sites. Owing to the presence of numerous variant sites, such as sites 150 and 151 of matK, these three DNA barcodes can effectively differentiate E. koreanum (S1–S4) from other Epimedium species (Fig. S1). Notably, samples S17 and S20 were initially mislabeled as E. sagittatum and E. wushanense but were correctly identified as E. stellulatum and E. jinchengshanense via psbA-trnH and ITS, respectively. Among the 20 samples, 17 were identified as belonging to the Epimedium species recorded in PRC Pharmacopoeia [4]. This result directly supports the practical value of our barcode system for the identification of Epimedium in the pharmacopoeia, as the incorporation of non-pharmacopoeia species often leads to a reduction in clinical efficacy. DNA barcoding has also shown equally good effects in authenticating the genuineness or detecting adulteration in other cash crops. Adulterants in Myristica fragrans mace [22], Bunium persicum [23], and black gram flour [24] can be identified using the psbA-trnH marker, due to its high amplification and sequencing success rates and the presence of polymorphic sites. Such discrepancies highlight the limitations of traditional morphological taxonomy in resolving closely related species, emphasizing the value of DNA barcoding for TCM authentication [25]. Our results demonstrated a higher discriminatory power of the psbA-trnH barcode and the combination of psbA-trnH and ITS for Epimedium species, which is consistent with previous studies on the identification of Epimedium using similar DNA barcode methods [26].
Table 2: Species origin identification results of Epimedium samples.
| Sample | Selected DNA Barcodes | Best Matched Species | Max Score | Per. Ident | Gene Accession |
|---|---|---|---|---|---|
| S1 | matK | E. koreanum | 1463 | 98.47% | KM207675.1 |
| S2 | matK | E. koreanum | 1561 | 100% | KM207675.1 |
| S3 | matK | E. koreanum | 1545 | 99.88% | KM207675.1 |
| S4 | matK | E. koreanum | 1546 | 100% | KM207675.1 |
| S5 | psbA-trnH | E. brevicornu | 1002 | 99.46% | MN714008.1 |
| S6 | psbA-trnH | E. sagittatum | 973 | 100.00% | MN027267.1 |
| S7 | psbA-trnH | E. pubescens | 977 | 99.82% | MN939633.1 |
| S8 | ITS | E. dewuense | 1190 | 99.11% | MG837288.1 |
| S9 | psbA-trnH | E. sagittatum | 987 | 100.00% | MN027267.1 |
| S10 | psbA-trnH | E. sagittatum | 987 | 100.00% | MN027267.1 |
| S11 | psbA-trnH | E. sagittatum | 987 | 100.00% | MN027267.1 |
| S12 | psbA-trnH | E. sagittatum | 971 | 100.00% | MN027267.1 |
| S13 | psbA-trnH | E. brevicornu | 926 | 99.61% | MN714008.1 |
| S14 | psbA-trnH | E. brevicornu | 942 | 98.53% | MN714008.1 |
| S15 | psbA-trnH | E. brevicornu | 915 | 99.21% | MN714008.1 |
| S16 | psbA-trnH | E. sagittatum | 924 | 98.48% | MN027267.1 |
| S17 | psbA-trnH | E. stellulatum | 944 | 99.61% | NC_065478.1 |
| S18 | psbA-trnH | E. sagittatum | 952 | 98.53% | MN027267.1 |
| S19 | psbA-trnH | E. sagittatum | 989 | 100.00% | MN027267.1 |
| S20 | ITS | E. jinchengshanense | 1204 | 100.00% | MG837295.1 |
An ideal DNA barcode should have an intraspecific genetic distance (intra-GD) smaller than an interspecific genetic distance (inter-GD) [27]. Otherwise, the barcode is not effective for species identification. We used MEGA software to analyze the intra-GD and inter-GD of three barcodes and found that their intra-GDs were all smaller than the corresponding inter-GDs. Among them, compared with matK (0.003/0.0007) and ITS (0.0086/0.0003), the inter-GD/intra-GD ratio of psbA-trnH (0.0196/0.0025) is larger, which represents the species identification ability of this DNA barcode. Then, we analyzed the intraspecific and interspecific genetic distances of other barcodes combined with psbA-trnH and found that the combination of barcodes could achieve good identification effects. We found that the inter-GD/intra-GD ratio of matK + ITS + psbA-trnH (0.0091/0.001) was not outstanding, while the ratio of ITS + psbA-trnH (0.0135/0.0017) was the highest. This is similar to the DNA barcoding results of orchidaceae plants, that is, individual barcoding yields better results in intraspecific and interspecific genetic distance analysis compared to combined barcoding [28]. Therefore, psbA-trnH and ITS + psbA-trnH had the most prominent identification effect as DNA barcodes because their inter-GD was much larger than the intra-GD, with psbA-trnH showing the largest inter-GD/intra-GD ratio (Fig. 1A).
To compare the identification effects of the three DNA barcodes used separately and in combination, we cut and spliced the obtained sequences and constructed phylogenetic trees, respectively (Fig. 1B,C and Fig. S2). All the clustering trees could separate E. koreanum. matK and ITS could only separate some Epimedium, while E. sagittatum could not be separated. However, the other four barcode combinations, namely psbA-trnH, ITS + psbA-trnH, matK + psbA-trnH, and matK + ITS + psbA-trnH, could all distinguish different sources of Epimedium, with only minor differences in clustering. Most of the key branches in the two phylogenetic trees, psbA-trnH and ITS + psbA-trnH, have 99% or 100% bootstrap values, supporting effective species identification and differentiation of Epimedium plants.
Subsequently, we selected the two barcodes with the largest difference between intra-GD and inter-GD for further analysis, namely psbA-trnH and ITS + psbA-trnH. Phylogenetic trees constructed from psbA-trnH and the ITS + psbA-trnH combination clearly separated all samples, although subtle clustering differences emerged between single and combined barcodes. For example, E. stellulatum clustered with E. sagittatum in the psbA-trnH tree but grouped with E. pubescens in the combined analysis. PCA of k-mer counts further validated barcode efficacy. The PCA of psbA-trnH showed that PC1 explained 43.51% of the total variance in the dataset, while PC2 explained 14.88% (Fig. 1D). The PCA of ITS + psbA-trnH showed that PC1 explained 43.09% of the total variance in the dataset, while PC2 explained 15.53% (Fig. 1E). The unique clustering of E. koreanum likely reflects its geographical isolation within the Epimedium population [29]. These research results collectively indicate that the combination of psbA-trnH and ITS as DNA barcodes provides a simple and accurate method for the identification of medicinal Epimedium. Similar results were also reported in the identification studies of the genus Dalbergia [30] and the Apiaceae family [31], but psbA-trnH is the core barcode for Epimedium. Future research expanding to rare Epimedium species will further refine the universality of these barcodes in biodiversity conservation and pharmaceutical resource management [32].
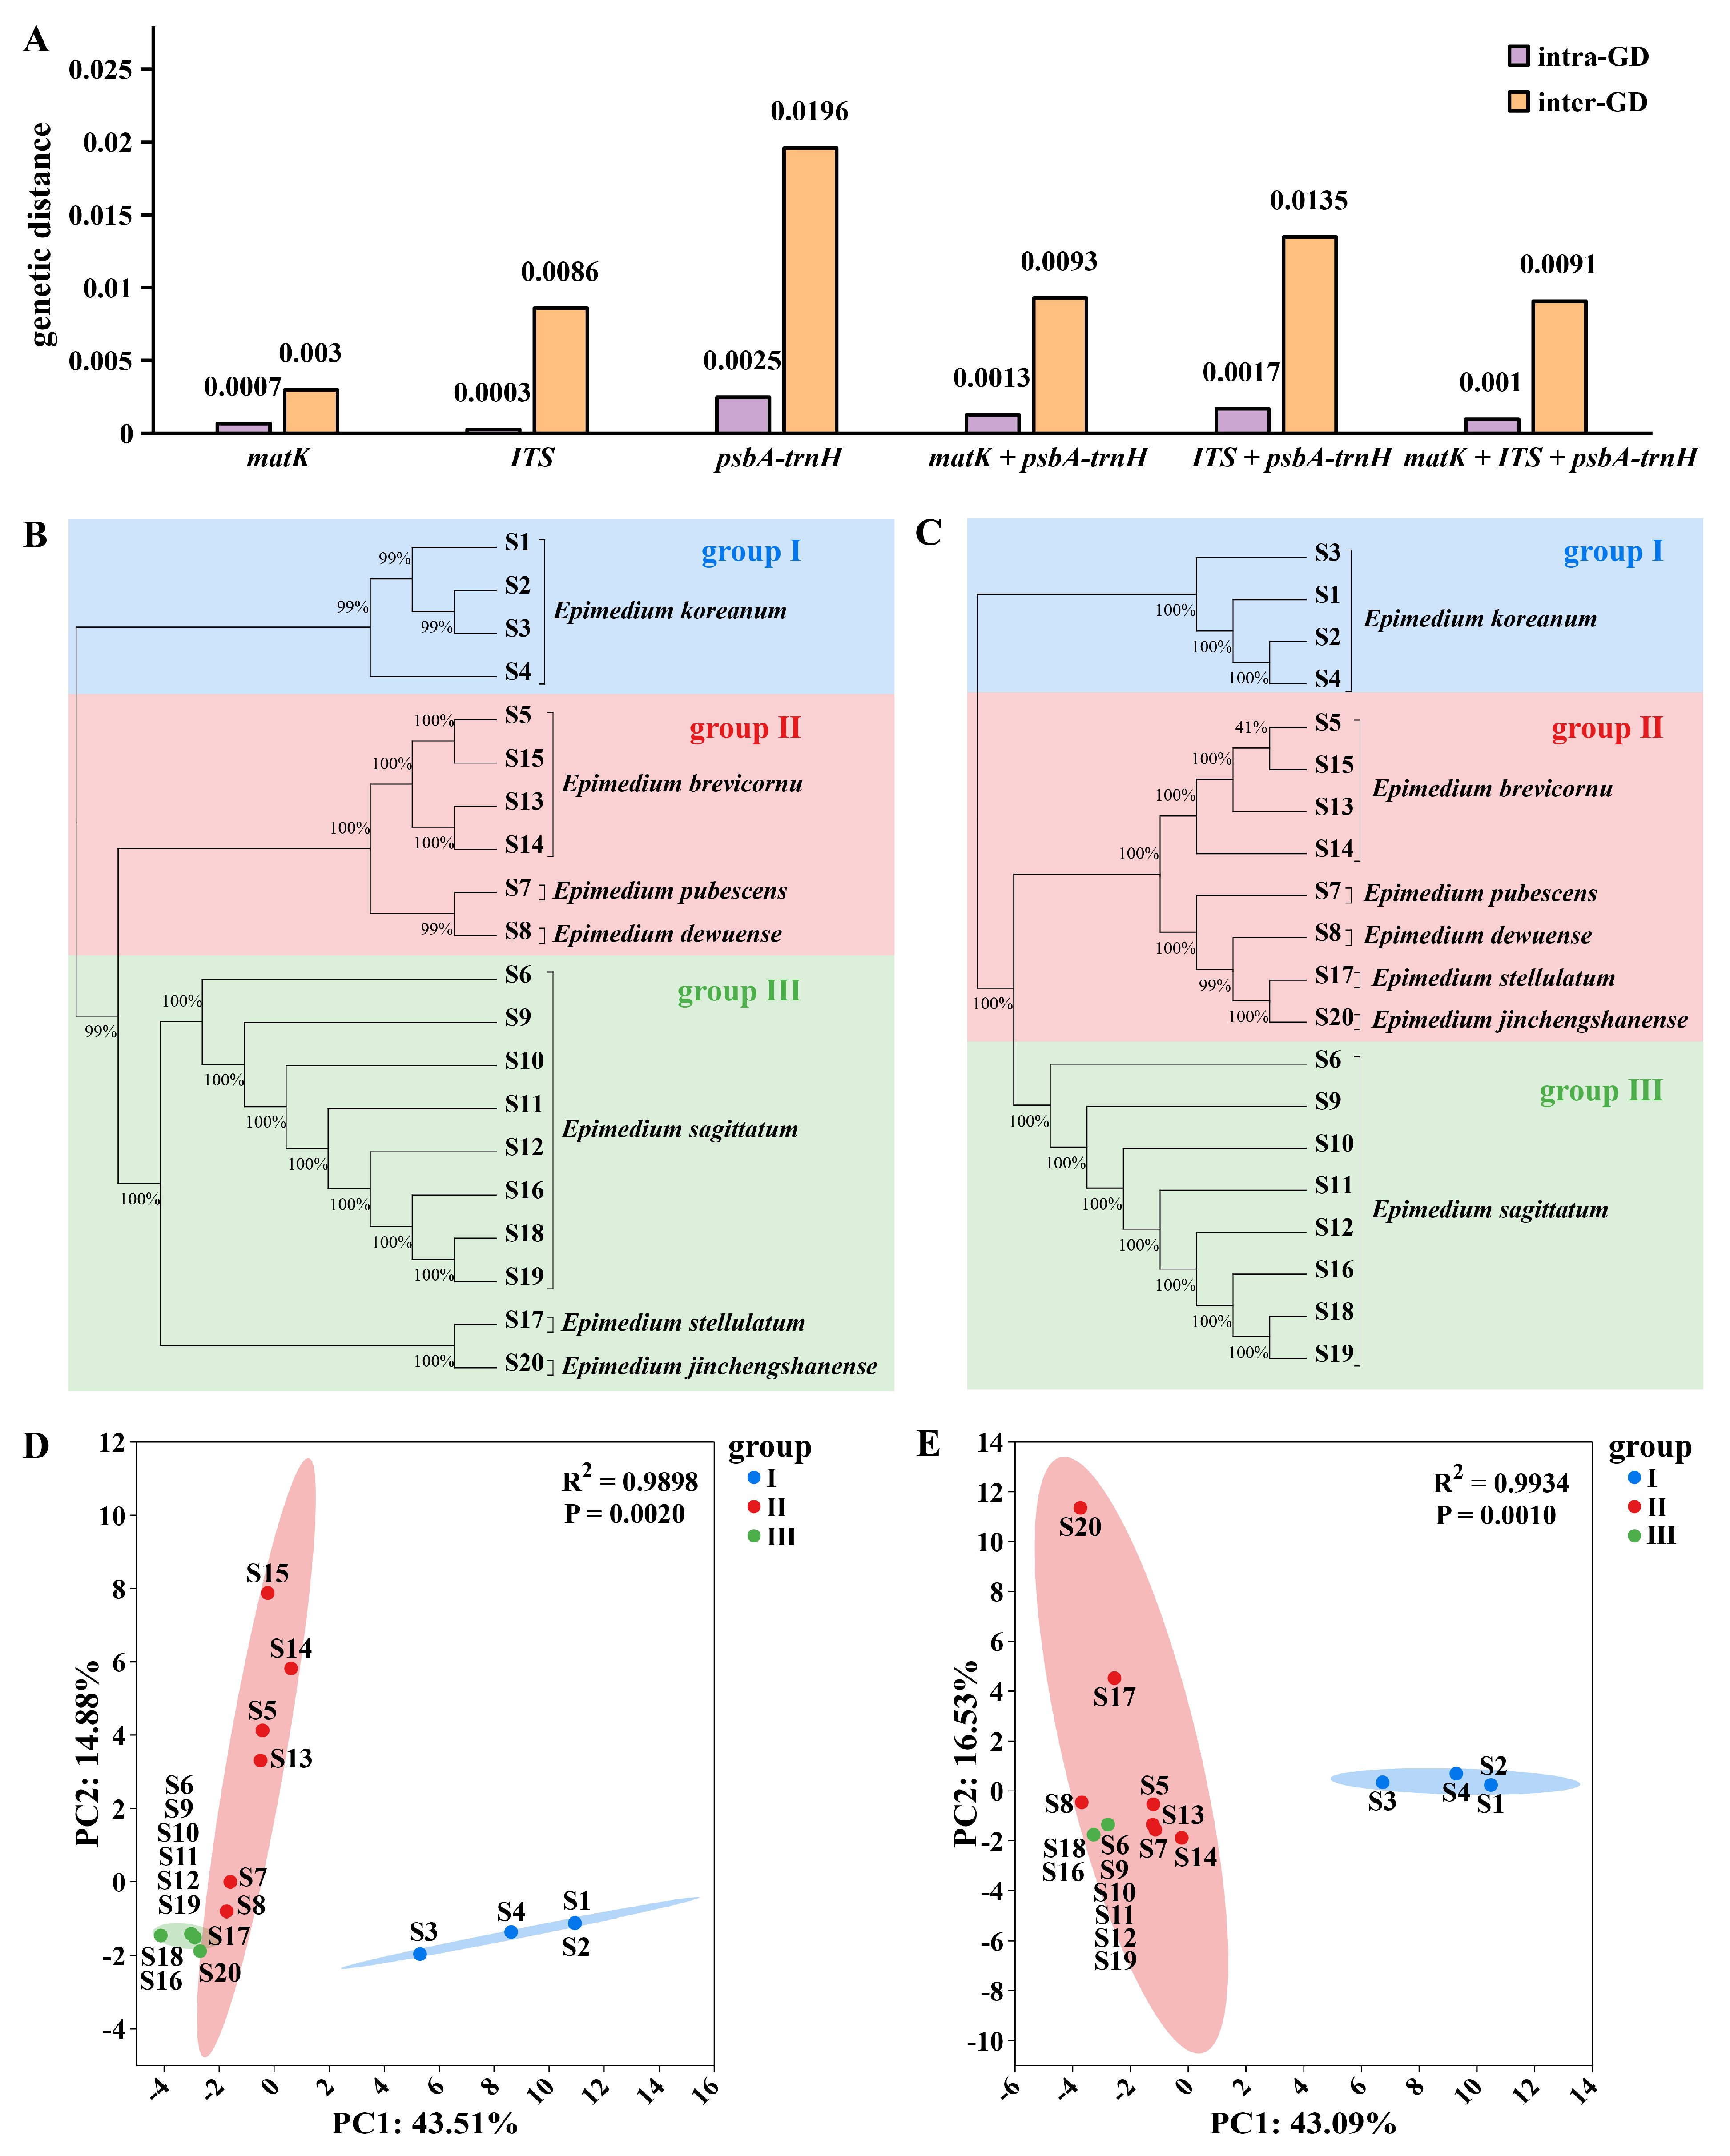
Figure 1: DNA barcodes analysis of Epimedium. An intraspecific and interspecific genetic distance bar graph (A) was plotted when the three barcodes matK, psbA-trnH and ITS were used respectively and in combination. The x-axis represents different barcode combinations, and the y-axis represents the genetic distance values. Phylogenetic analysis (B) and principal component analysis (D) were conducted on the difference information of the psbA-trnH barcode sequence. And hylogenetic analysis (C) and principal component analysis (E) were conducted on the different information of the ITS + psbA-trnH barcode sequence. Abbreviation: intra-GD: intraspecific genetic distance; inter-GD: interspecific genetic distance.
3.2 ISSR Technology Generated Genetic Profiles of Epimedium
The polymorphism, repeatability, and stability of twenty-one ISSR molecular markers were meticulously screened and comprehensively evaluated. Nine primers that exhibited poor amplification efficiency or failed to produce amplification products were excluded from further analysis. Ultimately, twelve primers with excellent polymorphism, distinct bands, and high repeatability were selected as core primers for in-depth genetic analysis (Fig. S3). The presence or absence of bands at each locus in every sample was represented by “1” and “0”, respectively. The resulting binary graph provided a visual representation of the data differences (Fig. 2A), facilitating a clear understanding of the genetic profiles among the samples.
After genotyping all samples, the ISSR markers yielded 189 bands, with an average of 15.75 effective bands per primer and a polymorphic band percentage of 100%. The average number of observed alleles per primer was 31.50. The effective number of alleles varied from 17.71 to 31.54, with an average of 25.47. Nei’s gene diversity index ranged from 0.34 to 0.64, with an average of 0.52, while Shannon’s information index spanned from 0.51 to 0.95, with an average of 0.77 (Table S3). These high values for polymorphism-related indices indicate a rich genetic diversity within the Epimedium samples examined, which is crucial for understanding the genetic structure, evolutionary potential, and species diversity of this genus [33].
Genetic distance and genetic identity between samples were calculated based on Nei’s index, providing insights into their genetic relationships [34]. The results revealed that Nei’s genetic identity ranged from 0.48 to 0.87, with an average of 0.62, while Nei’s genetic distance varied from 0.14 to 0.74, with an average of 0.48 (Table S4). Notably, samples S1 and S3, both belonging to E. koreanum, exhibited the smallest genetic distance and the largest genetic identity, suggesting a close genetic relationship within this species. Conversely, samples S10 (E. sagittatum) and S15 (E. brevicornu) had the largest genetic distance and the smallest genetic identity, highlighting the genetic divergence between different Epimedium species. This divergence aligns with the known taxonomic differences and can be used as molecular evidence for species identification [21]. Similar patterns have been reported in other plant genera, where genetic distance metrics have successfully differentiated closely related species and provided valuable information for taxonomic studies [35].
To better visualize the genetic relationships among Epimedium samples, a UPGMA phylogenetic tree was constructed using NTSYSpc software, and a correlation test was carried out. The correlation test result, with r = 0.83 and p = 0.002, indicated a good fit of the UPGMA clustering result (Fig. S4A). When the similarity level was set at 0.58, the UPGMA phylogenetic tree grouped the samples into two major clusters. The first cluster included E. koreanum, E. brevicornu, E. pubescens, E. dewuense, and E. jinchengshanense, while the second cluster consisted of E. sagittatum and E. stellulatum (Fig. 2B). When the similarity is 0.7, wild-type Epimedium S1, S3, S5, and S7 were clustered in a separate small branch, and their genetic diversity loci are fewer than those of other samples. This suggests that these wild-type samples may have limited gene exchange with other samples, possibly due to geographical isolation or specific ecological adaptations, resulting in reduced genetic variation [29]. When the similarity is 0.7, the three samples S13, S14, and S15 of E. brevicornu from Gansu formed a small cluster but did not cluster with S5 (also E. brevicornu), indicating that gene exchange within the same species can be influenced by environmental factors [36]. In the second cluster, when the similarity was 0.65, sample S17 of E. stellulatum and sample S16 of E. sagittatum, both originating from Hubei with a relatively close geographical proximity, were clustered together, further supporting the role of geography in shaping genetic relationships [37]. We found that clustering trees separated distantly related species at a similarity of 0.58 and aggregated geographically close samples at a similarity of 0.70. However, E. koreanum (S1–S4) individuals did not cluster into a single clade. This may be attributed to the high complexity of the genus Epimedium, which makes it difficult to define clear species or geographic boundaries.
PCA analysis was conducted on the ISSR data, and the samples were classified into two groups according to the previous UPGMA clustering results. The analysis showed that PC1 accounted for 17.2% of the total variance in the dataset, while PC2 accounted for 9.57%, visually illustrating the degree of relatedness among the samples (Fig. 2C). Subsequently, STRUCTURE software was employed for population structure analysis, and the optimal result was obtained when K = 4 (Fig. S4B). The samples were partitioned into four gene pools, and a Q-Q plot was generated (Fig. 2D). Gene pool 1 accounted for 0.215, gene pool 2 accounted for 0.208, gene pool 3 accounted for 0.317, and gene pool 4 accounted for 0.260. The average distances (expected heterozygosity) between samples in clusters 1 to 4 were 0.413, 0.371, 0.220, and 0.316, respectively (Table S5). Population structure analysis can infer the ancestral origins of individuals within each sample [38], and the results were largely consistent with the population structure diagram.
To create a genetic fingerprint map of Epimedium samples and identify a single primer for sample differentiation, primers 808, 811, 842, and 864 were found to exhibit distinct fingerprints. Primer 808 had the fewest loci. Therefore, the 13-locus information of primer 808 was utilized to generate fingerprints of the samples on the QR code generation website (https://cli.im/) (Fig. S5). This genetic fingerprinting approach can serve as a valuable tool for rapid and accurate sample identification, which is of great significance for quality control in the utilization of Epimedium resources [39]. Similar fingerprinting techniques have been successfully applied in other medicinal plant species to ensure the authenticity and quality of herbal products [14].
The ISSR analysis in this study provided a genetic profile of Epimedium and demonstrated the effectiveness of ISSR technology in investigating the genetic diversity and population structure of Epimedium. The findings also highlighted the influence of geographical factors on genetic relationships within and between species. Future studies could further explore the genetic basis of specific traits in Epimedium and investigate the potential for genetic improvement and conservation of this vital plant genus [40]. For example, by conducting genome-wide association studies (GWAS) on Epimedium, we can identify the specific genes associated with traits such as high-yield [41] and disease resistance [42], which would provide a theoretical basis for genetic breeding programs.
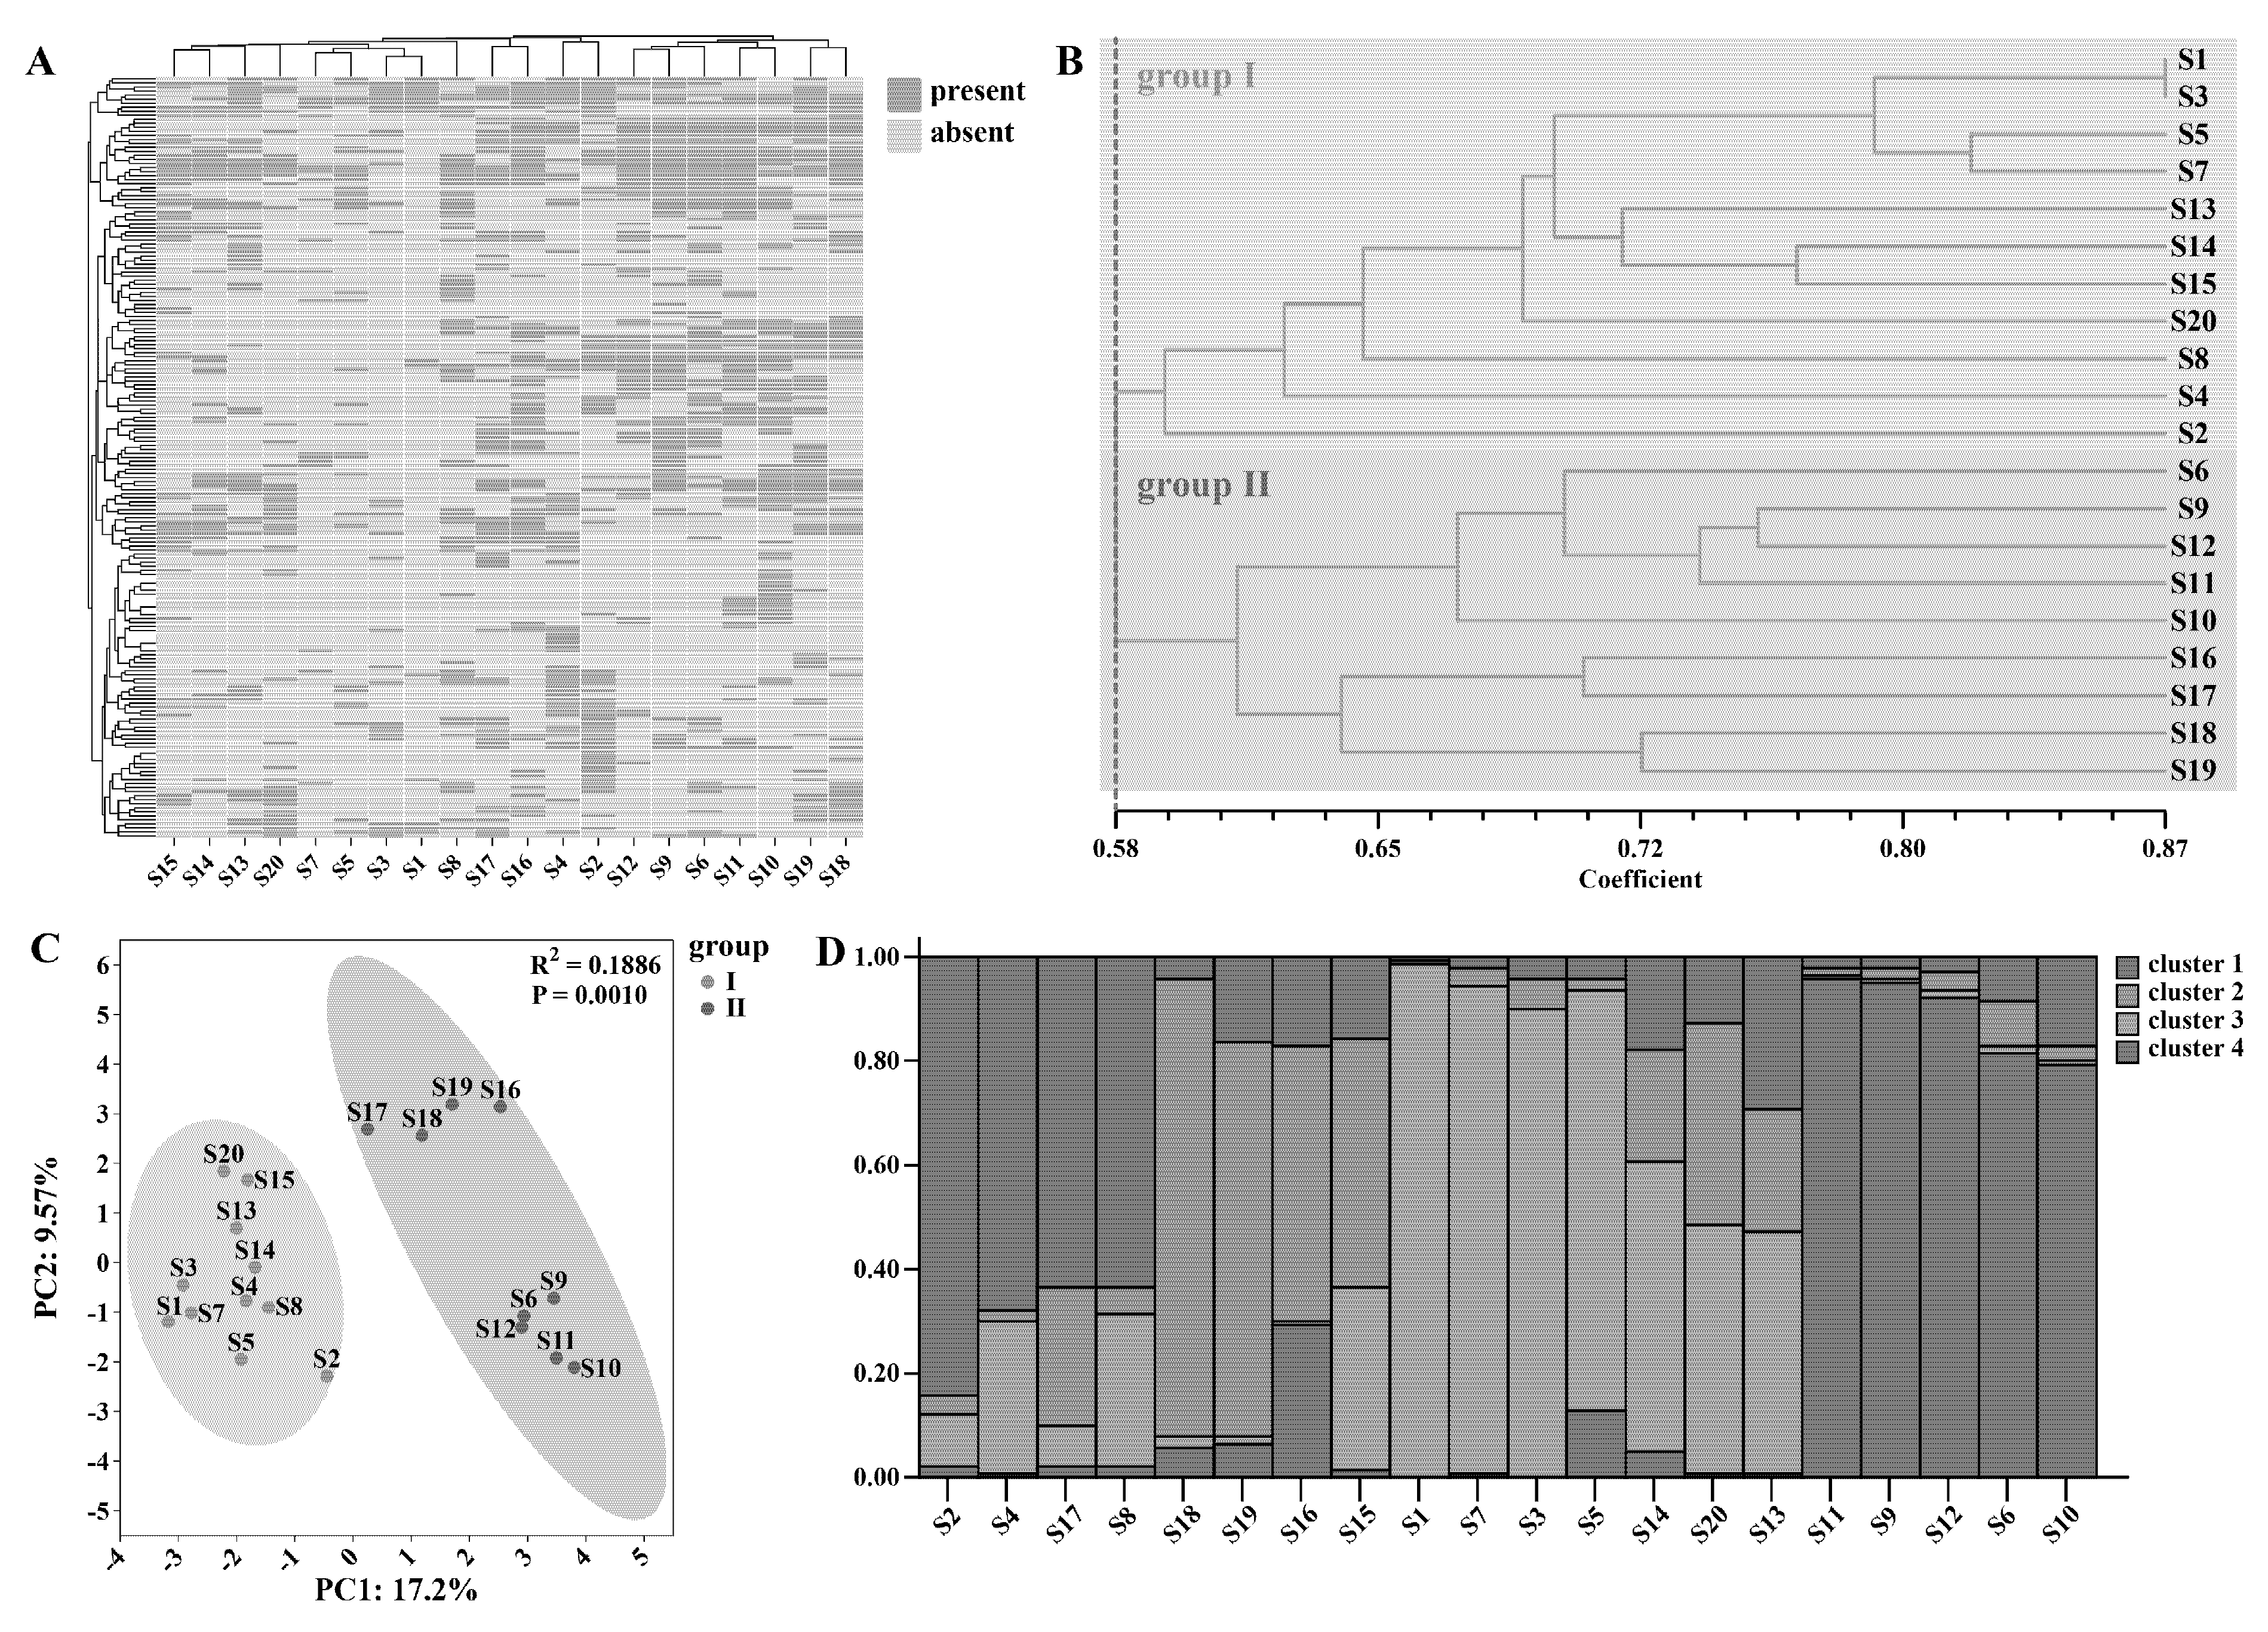
Figure 2: Genetic diversity analysis of Epimedium. All sample loci of Epimedium were plotted as binary plots (A), and cluster analysis based on the UPGMA method was conducted (B), principal component analysis (C), and population structure analysis (D).
3.3 The Multi-Index Composition Exhibited Differences among Different Species of Epimedium
The chromatograms of Epimedium samples were imported into the similarity evaluation system of traditional Chinese medicine fingerprint. With sample S11 designated as the reference chromatogram and a time window set at 0.4, the reference chromatogram (R) was generated (Fig. 3A). A total of 79 peaks were detected across the samples, of which 16 were common peaks. The fingerprint chromatograms of different samples manifested distinct variations, reflecting notable differences in their metabolic components and contents [43]. The similarities between the samples and the reference chromatogram ranged from 0.256 to 0.994, averaging 0.7908, indicating a substantial degree of variation among the samples. Sample S18 showed the highest similarity to the reference chromatogram, while S4 had the lowest. The proportion of non-common peaks in each sample varied from 3.60% to 42.04%, with an average of 12.81%. S4 exhibited the highest proportion of non-common peaks, and S18 had the lowest (Table S6).
Chemometric analysis was performed on the 16 common peaks. Through hierarchical clustering, the samples were grouped. At a distance of 0.8, they were classified into two groups. The first group comprised E. brevicornu, E. koreanum, E. pubescens, and E. dewuense (Fig. 3B). Within this group, S7 and S8 formed a separate small branch; all E. koreanum and E. brevicornu samples clustered together, respectively. The second group included E. sagittatum, E. stellulatum, and E. jinchengshanense. At a distance of 0.3, S17 and S20 were separated, and all E. sagittatum samples formed a distinct small branch. This clustering pattern is similar to the genetic relationships revealed by ISSR analysis of Epimedium.
Subsequently, PCA analysis based on this two-group division revealed that the samples in the two groups could be largely segregated. PC1 accounted for 42.06% and PC2 for 15.81% of the total variance, with significant content differences between the groups (R2 = 0.7064, p = 0.0010) (Fig. 3C). This indicates that the metabolic compositions of the two groups are distinctly different, likely due to species-specific genetic traits and ecological adaptations [44].
Non-Metric Multidimensional Scaling (NMDS) analysis was then carried out. The Stress value of 0.0948 < 0.1 suggested a good model fit. The greater the distance between samples, the more pronounced the content difference. Moreover, the samples in the first group were relatively dispersed, indicating internal variations, while those in the second group were more concentrated, implying a more homogeneous metabolic composition within this group (Fig. 3D). The dispersion and concentration patterns observed in NMDS analysis further support the findings from PCA and hierarchical clustering.
OPLS-DA was employed to screen out the main differential metabolites (Fig. 3E,F). By comparing the retention times of the chromatographic peaks with the reference solution, T37 was identified as epimedin B, T38 as epimedin C, and T40 as icariin (Fig. 3F). These differential metabolites serve as potential biomarkers for differentiating Epimedium samples and hold significance for species identification [45] and quality assessment [46].
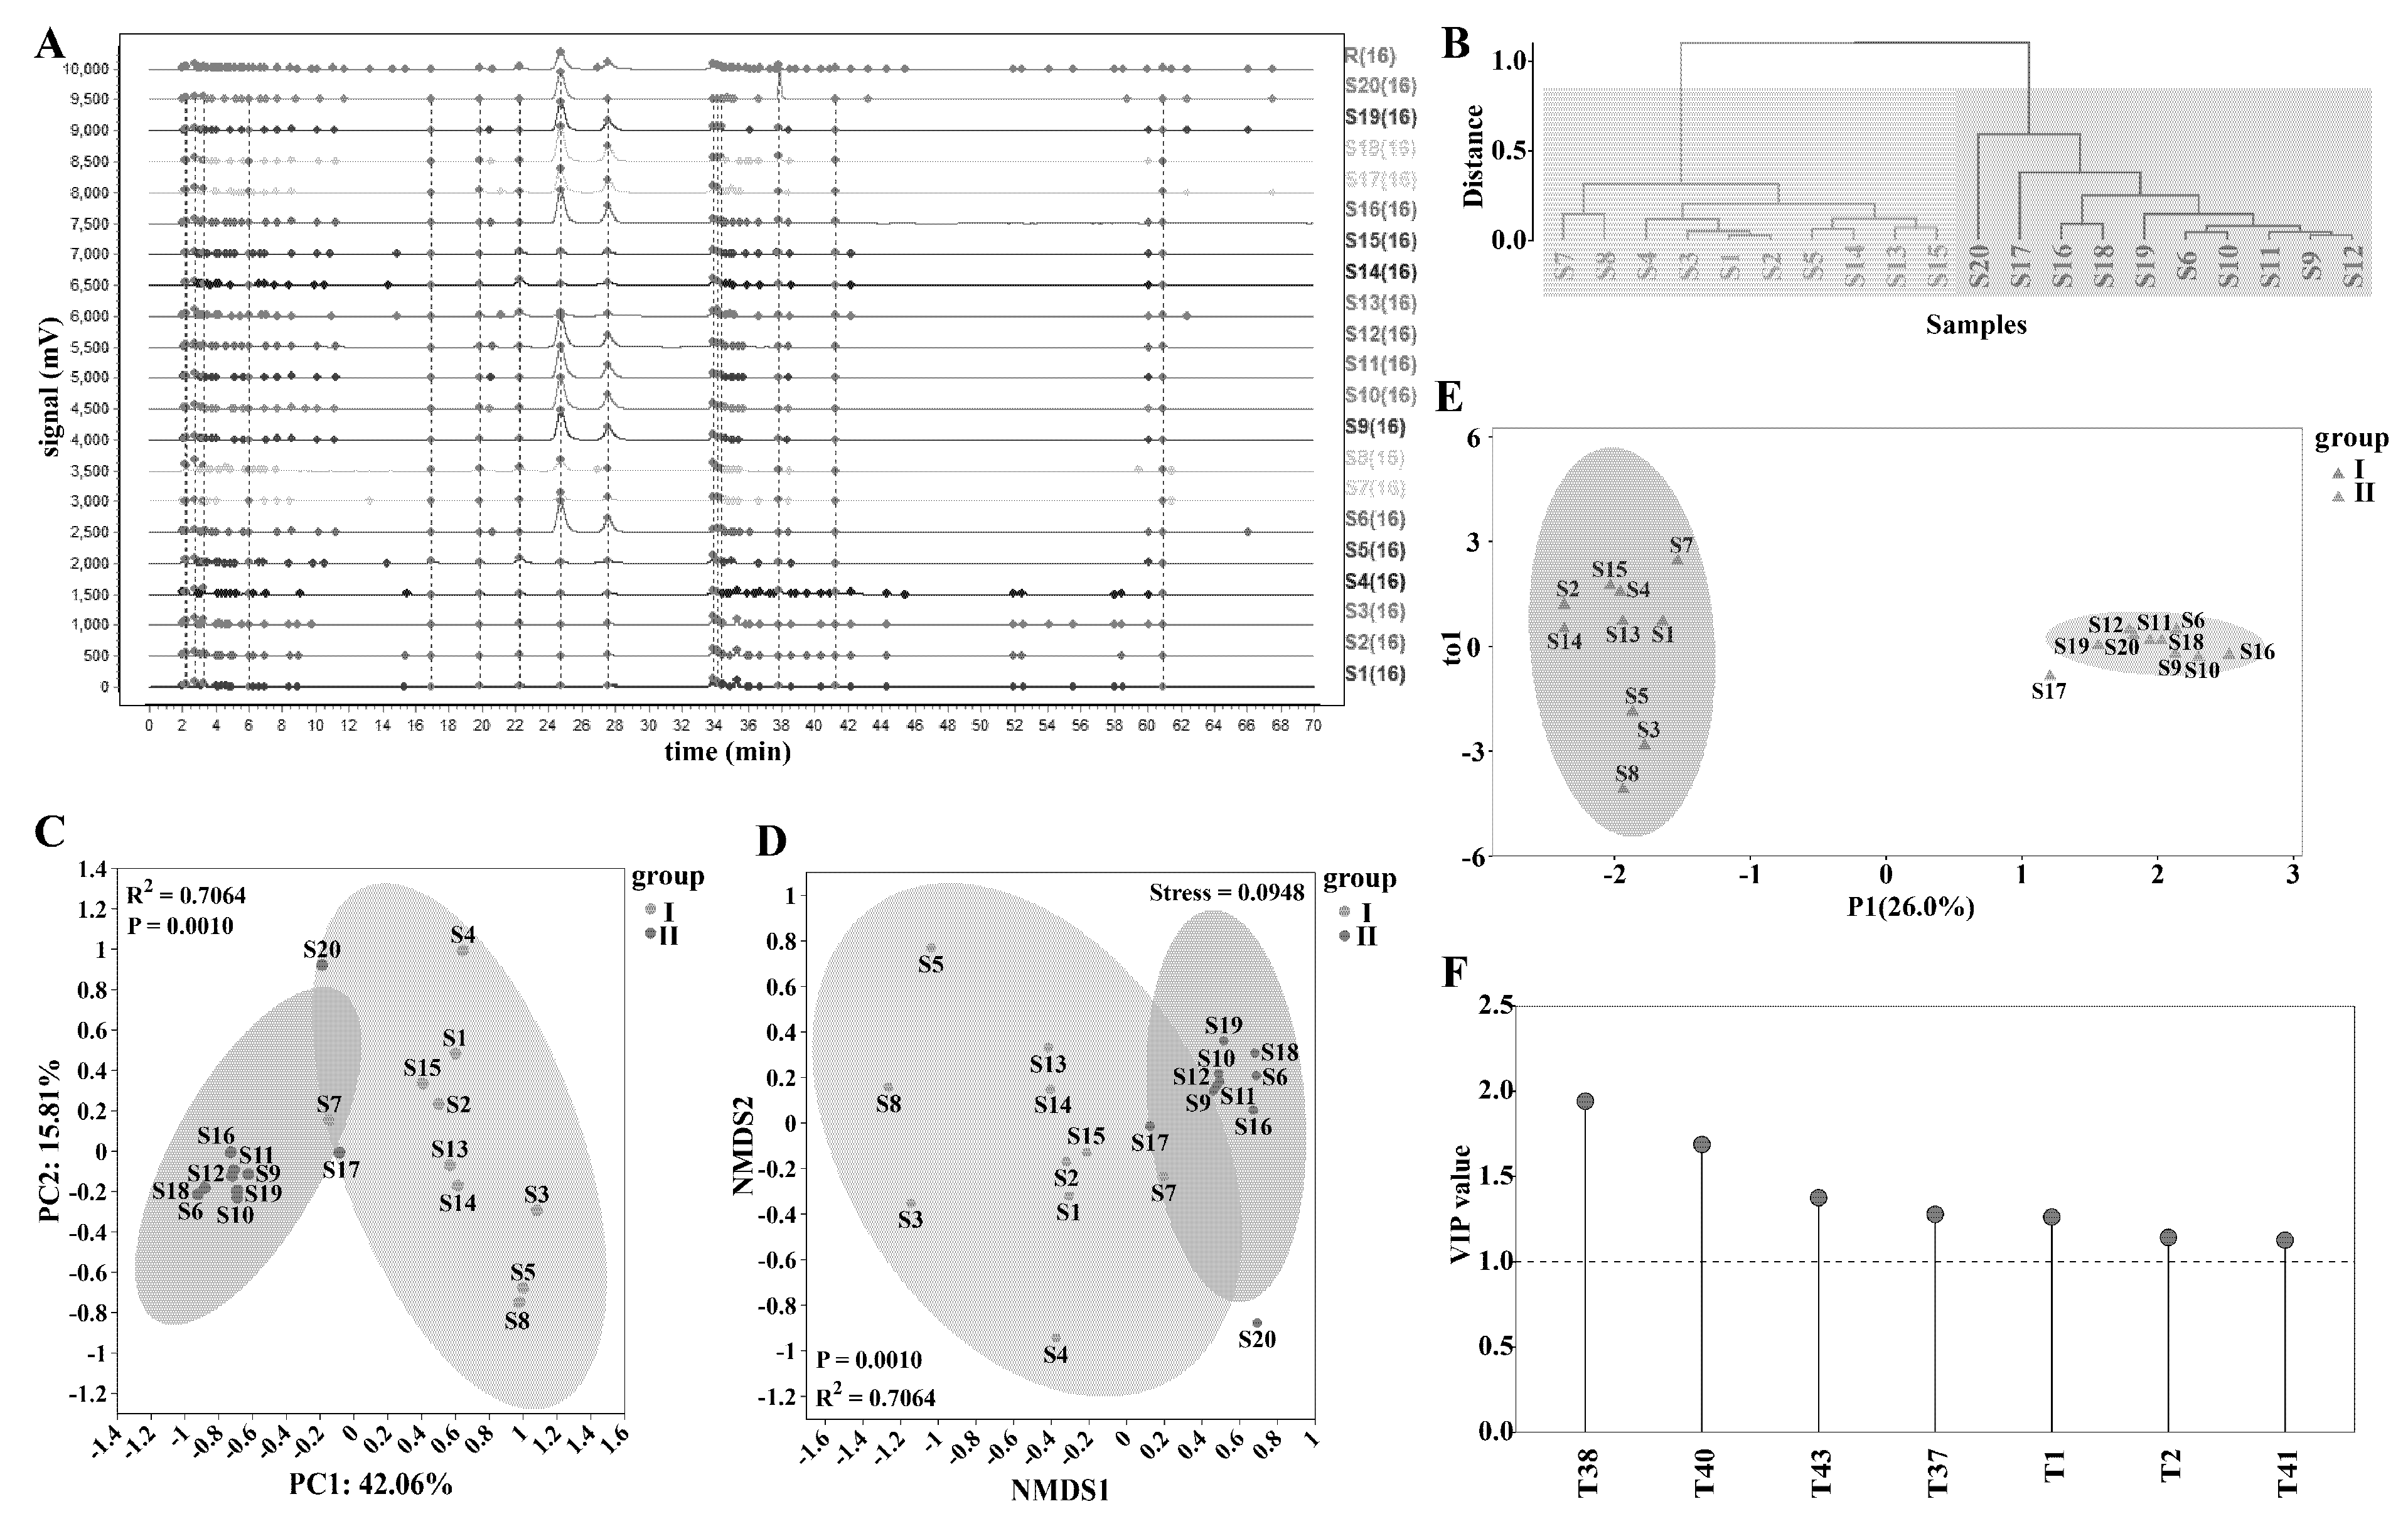
Figure 3: Analysis of fingerprint chromatograms to identify differential metabolites of Epimedium. The chemical fingerprint chromatograms of Epimedium samples were plotted (A), and cluster analysis (B), PCA analysis (C), NMDS analysis (D), and OPLS-DA analysis (E) were conducted, obtaining the main differential metabolites with VIP > 1 (F).
Content determination based on eight index components was conducted to compare the content differences among different Epimedium samples. The stacked bar chart (Fig. 4A) and violin plots (Fig. 4B,C) visually illustrated the content of each component and its dispersion degree among the samples. Overall, epimedin C and icariin had relatively high content levels, whereas epimedin A1, epimedin A, epimedin B, icariside I, baohuoside I, and anhydroicaritin had generally low contents. Epimedin C showed the most significant variation among samples, while icariside I had the least variation. These results are consistent with previous studies on the chemical variability of Epimedium species, where different metabolites respond differently to genetic and environmental factors [47].
After normalizing the Epimedium content data, a clustering heatmap was created to show the relative weight of each component in the samples. The content ratio of epimedin C and icariin in E. sagittatum was the highest (Fig. 4D). Correlation analysis of the index components revealed strong positive correlations between epimedin A1 and epimedin B (r = 0.65, p < 0.01), epimedin B and icariside I (CI) (r = 0.48, p < 0.05), and strong negative correlations between epimedin C and epimedin B (r = −0.61, p < 0.01) (Fig. 4E). These correlations imply potential synergistic or competitive relationships in the biosynthesis process [48,49].
The content of individual index components in 20 batches of Epimedium samples was presented as a bar chart (Fig. 4F–M), showing the content of each component among different samples. Regarding the total component content, samples S1–S4 (E. koreanum) had relatively low levels with a balanced proportion of components. This detailed analysis of component content provides a comprehensive understanding of the chemical composition of Epimedium. Linking chemical profiles to variations in species, geographical origin, and processing methods is essential for evaluating the quality and potential therapeutic effects of Epimedium products [50]. Future research could focus on exploring the genetic and environmental determinants of metabolite variation [51] and developing more precise quality control methods (e.g., electrochemical analysis) for Epimedium products [52].
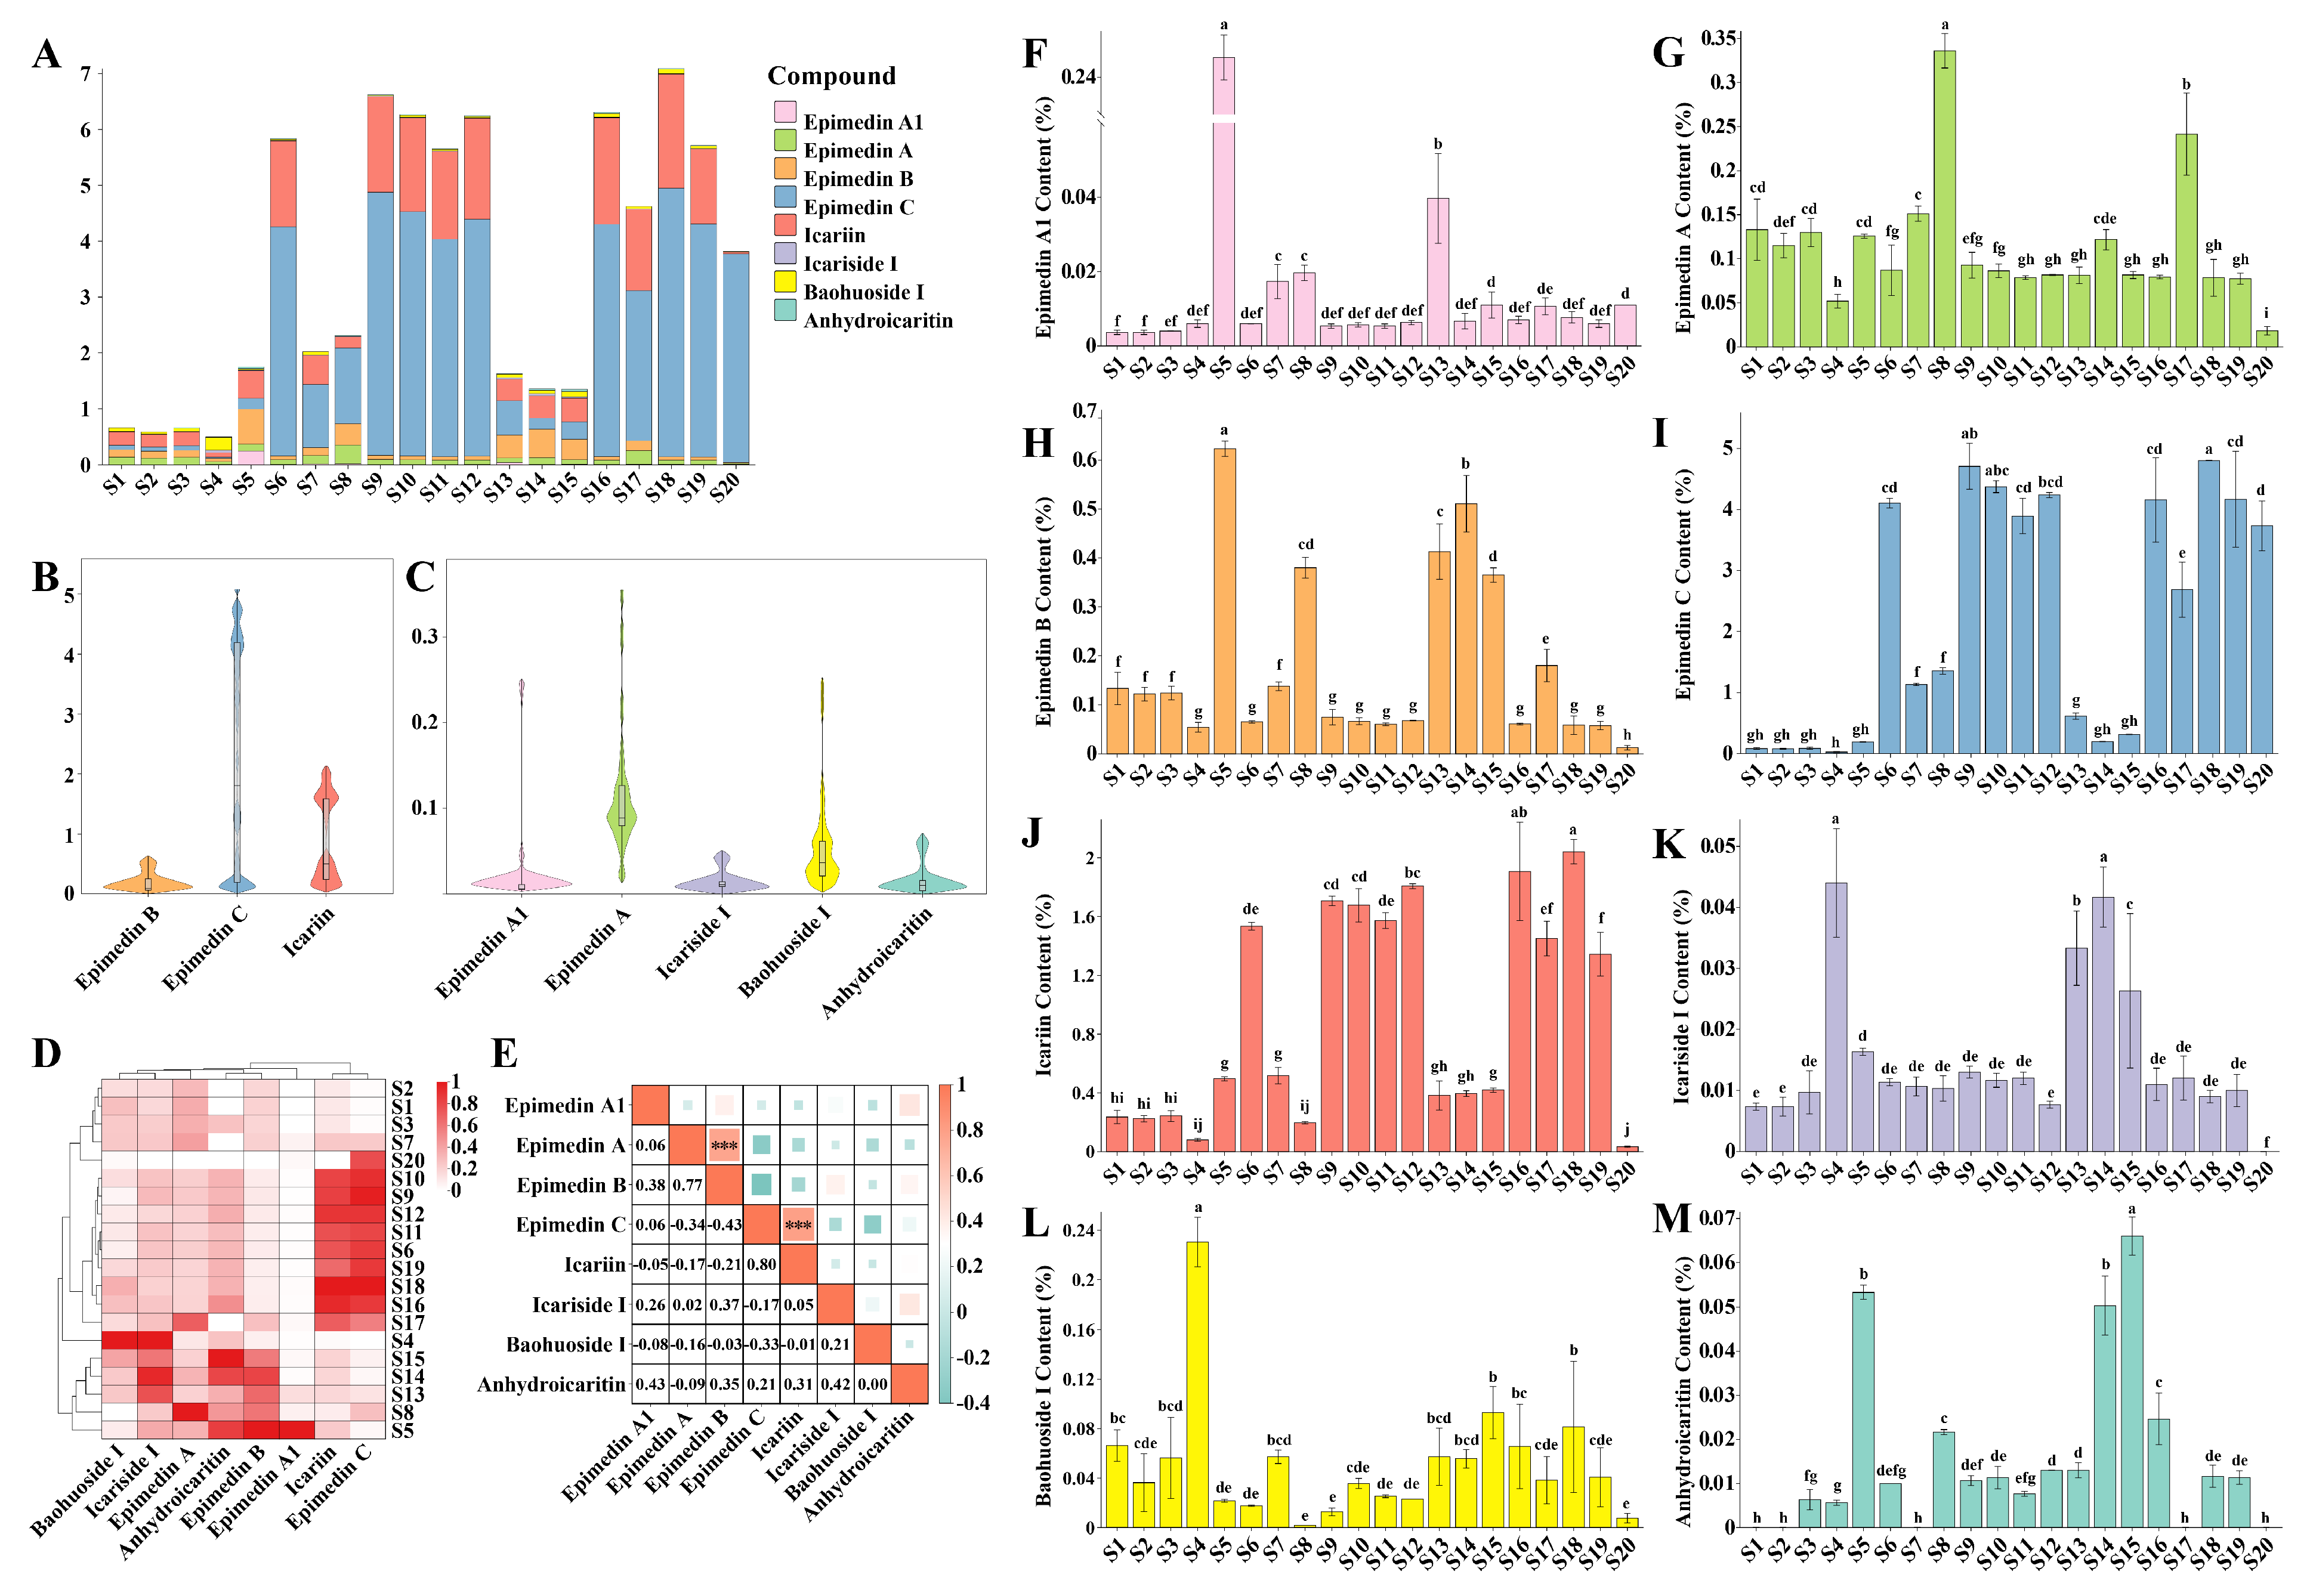
Figure 4: Content determination of multi-index components in Epimedium. A stacked bar chart (A) was drawn to show the contents of eight index components in 20 batches of Epimedium samples. The violin plots (B,C), clustering heat maps (D) and correlation analysis heat maps (E) of these components were generated. The bar charts of the contents of each component correspond to epimedin A1 (F), epimedin A (G), epimedin B (H), epimedin C (I), icariin (J), icariside I (K), baohuoside I (L), and anhydroicaritin (M), respectively. Different lowercase letters above the bars (F–M) indicate significant differences in component contents among samples (p < 0.05), whereas values with the same letter are not significantly different.
3.4 Genetic Diversity and Ecological Factors Jointly Drove Variations in Epimedium Components
One of the key elements of Daodi medicinal materials is “Daodi”, that is, the suitability of the environment [53]. In order to study the environmental factors of quality formation, ecological factors were retrieved from ArcGIS and combined with three geographical factors (longitude, latitude, and altitude). A heatmap was then created to explore the diverse environmental conditions of each sample (Fig. S6). The results revealed that geographically proximate samples, like S18 and S19, often had similar ecological environments. However, there were exceptions: S10 and S12 from Hubei had similar ecological environments but did not cluster with S9 and S11 from Hubei. This finding emphasizes the importance of considering geographical and ecological factors in the cultivation of Epimedium [54]. Previous studies on other plant species have also shown that ecological factors are crucial for metabolite accumulation [55], which is consistent with our observations in Epimedium.
Subsequently, a structural equation model diagram was constructed based on the Mantel test to illustrate the relationships among ecological factors, geographical location, ISSR genetic diversity, and multi-index component content (Fig. 5A). The results indicated that ecological factors had a positive correlation with geographical location (r = 0.29, p = 0.02) and a strong positive correlation with ISSR genetic diversity (r = 0.51, p = 0.001). The content differences of multi-index components of Epimedium were significantly positively correlated with both ecological factors (r = 0.56, p < 0.001) and ISSR genetic diversity (r = 0.47, p = 0.001). Overall, these results suggest a complex interplay among these variables. Ecological factors are influenced by geographical location and have a significant impact on genetic diversity, which is in line with the view of the interaction between genes and the environment in ecological populations. Ecological factors are affected by geographical location and will have an important impact on genetic diversity, which is in line with ecological population theory [56]. Moreover, ecological factors and genetic diversity jointly contribute to variations in the component content of Epimedium. In the research of Cannabis sativa, climatic and geographical factors co-drive its phenotypic diversity, and the research on genetic diversity needs to be supplemented [57].
To validate the association between individual components and genetic diversity as well as ecological factors, an interactive Mantel test correlation analysis was carried out (Fig. 5B). The findings showed that multi-index components were significantly associated with both ISSR genetic diversity and ecological factors. Specifically, epimedin A exhibited a significant positive correlation with genetic diversity (r = 0.20, p = 0.049). Icariside I (r = 0.38, p = 0.002) and baohuoside I (r = 0.18, p = 0.048) both had strong positive correlations with ecological factors. Notably, epimedin C demonstrated strong positive correlations with both genetic diversity (r = 0.47, p = 0.001) and ecological factors (r = 0.50, p = 0.001). Similarly, icariin had strong positive correlations with genetic diversity (r = 0.57, p = 0.001) and ecological factors (r = 0.37, p = 0.001). These results imply that different components of Epimedium are influenced by genetic and ecological factors to varying degree or example, epimedin A appears to be primarily influenced by genetic diversity, while icariside I and baohuoside I are more strongly affected by ecological factors. In contrast, epimedin C and icariin are driven by both genetic diversity and ecological factors, suggesting that their biosynthesis and accumulation are regulated by a combination of genetic and environmental cues [50,54].
To further explore the impact of environmental factors on the differences in the chemical components of Epimedium, a RDA was performed. The Spearman correlation coefficient was employed to address the collinearity among ecological factors. For ecological factors with a correlation coefficient greater than 0.7, only one factor was selected as a variable (Fig. 5C). In total, seven ecological factors were screened out. These screened ecological factors were used as environmental variables for the RDA. The results of the RDA showed significant differences in these environmental variables between the two groups of samples (R2 = 0.7064, p = 0.0010), with RDA1 explaining 32.21% and RDA2 explaining 10.39% of the variation. This clearly indicated that the two groups of samples were distinctly separated in the environmental variable space, and the environmental variables had a substantial impact on the distribution of the two groups of samples. Among the environmental factors, “mean temperature of driest quarter” (TDQ), “precipitation seasonality” (PS), and “temperature annual range” (TAR) were identified as key factors influencing the chemical component content of Epimedium (Fig. 5D). Specifically, E. sagittatum, which has a relatively high content of flavonol glycosides, is positively regulated by TDQ and negatively regulated by PS and TAR. In contrast, E. koreanum and E. pubescens are mainly positively regulated by PS and TAR. To further analyze the specific metabolites affected by ecological factors, we conducted a correlation analysis (Fig. S7). Ecological environment mainly affects three components, namely epimedin B, epimedin C and icariin, which are precisely the differential metabolites identified in our previous OPLS-DA analysis. The “precipitation of the wettest quarter” (r = −0.66, p = 0.001) and “precipitation of the coldest quarter” (PCQ) (r = −0.50, p = 0.03) showed a significant negative correlation with epimedin B, while PCQ exhibited a strong positive correlation with icariin (r = 0.77, p < 0.001) and epimedin C (r = 0.66, p = 0.001). This suggests that attention should be paid to the balance between humidity and active components during cultivation. Additionally, TDQ was significantly positively correlated with icariin (r = 0.55, p = 0.01) and epimedin C (r = 0.77, p < 0.001), indicating that a certain degree of temperature increase can promote the accumulation of these two components in Epimedium. These findings suggest that specific climatic conditions play a crucial role in shaping the chemical composition of Epimedium, potentially affecting the biosynthesis and accumulation of various metabolites. Similar results have been reported in studies on other medicinal plants, where precipitation and temperature-related factors influence the production of bioactive compounds [58]. In ecological studies on Crocus sativus, it has also been demonstrated that environmental variables can regulate the nutritional status and biochemical accumulation patterns of the plant [59].
The identified associations between specific components and genetic or ecological factors provide valuable insights into the underlying mechanisms governing the biosynthesis of these components. By understanding how genetic diversity and ecological factors influence the chemical composition, it becomes possible to select superior genetic resources that are more likely to produce desired bioactive components. Moreover, identifying the key ecological factors that impact the content of these components allows for the determination of suitable environments for cultivating Epimedium. This can significantly enhance the quality and yield of Epimedium products, ensuring a more reliable source of raw materials for TCM and other applications.
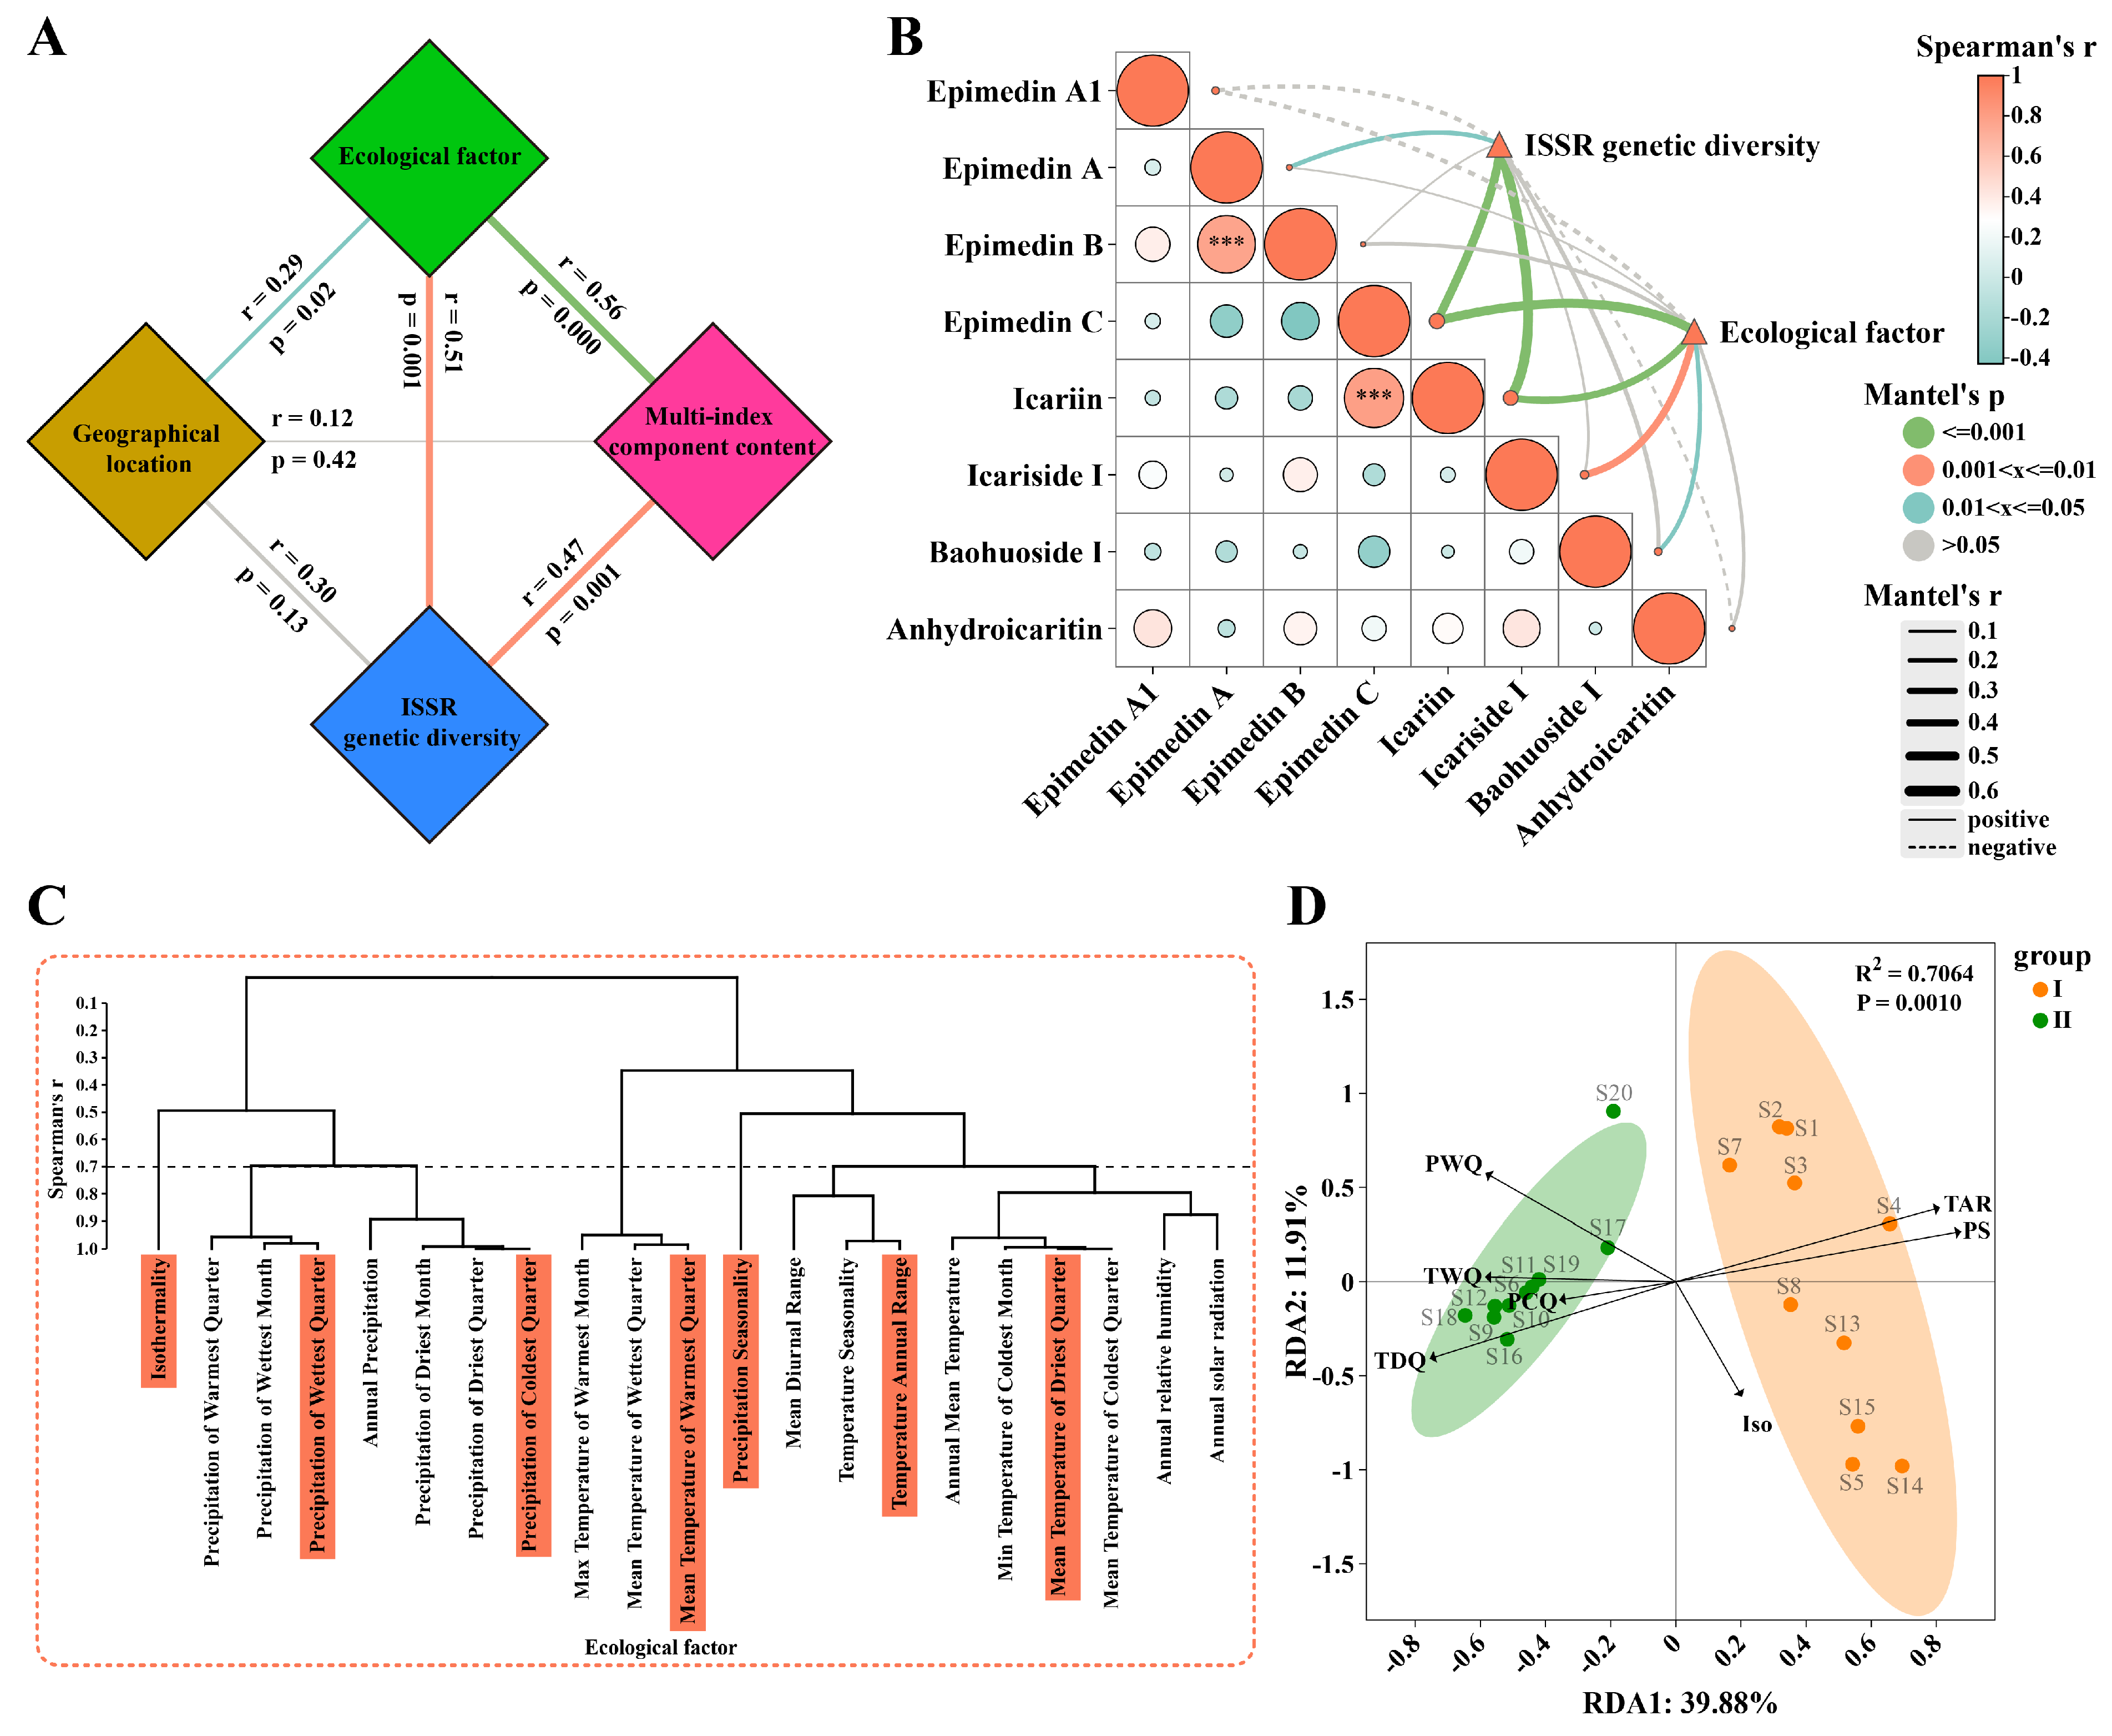
Figure 5: Genetic diversity and ecological factors jointly affect the component differences of Epimedium. The Mantel test was used to correlate ecological factors, geographical factors, ISSR genetic diversity and multi-index component contents (A), and the interactive mantel test correlation analysis of ISSR genetic diversity and ecological factors with all index components was conducted (B). Screening of representative ecological factors based on the Spearman coefficient (C). Redundancy analysis was performed on seven representative environmental factors as variables for Epimedium (D). Abbreviation: Iso: isothermality; PWQ: precipitation of wettest quarter; PCQ: precipitation of coldest quarter; TWQ: mean temperature of warmest quarter; PS: precipitation seasonality; TAR: temperature annual range; TDQ: mean temperature of driest quarter.
Both psbA-trnH and ITS + psbA-trnH DNA barcodes demonstrated remarkable effectiveness in identifying the plant sources of various Epimedium species, predominantly encompassing E. koreanum, E. sagittatum, and E. brevicornu. Among them, the psbA-trnH barcode exhibited the most superior identification performance for E. sagittatum, owing to the presence of a substantial number of differentiating sites, which enabled precise species discrimination.
The application of ISSR markers successfully classified the samples into two major clusters. This not only revealed significant differences in genetic diversity between E. sagittatum and other Epimedium species but also underscored the richness of species diversity and regional genetic diversity within the genus. Based on population structure analysis, the genetic structure of Epimedium is it is reasonably hypothesized that derived from four distinct gene pools, providing valuable insights into the evolutionary history and genetic relationships among different Epimedium populations.
Furthermore, notable variations were observed in the content of the index components across different Epimedium samples. Among these components, icariin, epimedin B, and epimedin C emerged as the primary differential metabolites, playing crucial roles in distinguishing between various Epimedium species. The findings of this study clearly indicated that the content differences of multi-index components in Epimedium were jointly driven by genetic diversity and ecological factors. The key factors identified were “mean temperature of driest quarter”, “precipitation seasonality”, and “temperature annual range”.
In summary, this study offers robust data support for the selection of high-quality planting materials and the establishment of suitable ecological environments during the breeding process of Epimedium. By understanding the complex interplay between genetic and ecological factors, it becomes possible to optimize cultivation practices, enhance the quality and yield of Epimedium products, and ensure the sustainable utilization of this valuable medicinal plant resource. These results have important implications for both the scientific research and practical application of Epimedium in the field of TCM.
Acknowledgement:
Funding Statement: This research was supported by Beijing Nova Program (20240484546), the Fundamental Research Funds for the Central Public Welfare Research Institutes (No. ZZ13-YQ-049, ZXKT22001), and Shaanxi Province Key R&D Program Projects (2024SF-ZDCYL-03-10).
Author Contributions: Validation, Ruikang Ma, Yufei Cheng and Liping Shi; formal analysis, Ziying Huang; investigation, Anning Li, Xiaolin Lin and Yu Zhang; data curation, Ziying Huang; writing—original draft preparation, Ziying Huang; writing—review and editing, Ziying Huang and Linlin Dong; supervision, Mengzhi Li; project administration, Mengzhi Li and Linlin Dong; funding acquisition, Linlin Dong. All authors reviewed the results and approved the final version of the manuscript.
Availability of Data and Materials: The data that support the findings of this study are openly available in Mendeley Data at https://data.mendeley.com/preview/g7bmzh4f75?a=4a1e5bb4-3830-4e10-a668-039ebb0925a8 (accessed on 01 October 2025).
Ethics Approval: Not applicable.
Conflicts of Interest: The authors declare no conflicts of interest to report regarding the present study.
Supplementary Materials: The supplementary material is available online at https://www.techscience.com/doi/10.32604/phyton.2025.074419/s1.
References
1. Wang B , Wang Q , Yuan R , Yang S , Lu M , Yuan F , et al. Prenylated chromones and flavonoids isolated from the roots of Flemingia macrophylla and their anti-lung cancer activity. Chin Med. 2023; 18( 1): 153. doi:10.1186/s13020-023-00860-3. [Google Scholar] [CrossRef]
2. Bi Z , Zhang W , Yan X . Anti-inflammatory and immunoregulatory effects of icariin and icaritin. Biomed Pharmacother. 2022; 151: 113180. doi:10.1016/j.biopha.2022.113180. [Google Scholar] [CrossRef]
3. Zhang Y , Li J , Wang Y , Liang Q . Taxonomy of Epimedium (Berberidaceae) with special reference to Chinese species. Chin Herb Med. 2022; 14( 1): 20– 35. doi:10.1016/j.chmed.2021.12.001. [Google Scholar] [CrossRef]
4. Chinese Pharmacopoeia Commission . Pharmacopoeia of People’s Republic of China. Beijing, China: China Medical Science Press; 2020. [Google Scholar]
5. Wang Z , Wang D , Yang D , Zhen W , Zhang J , Peng S . The effect of icariin on bone metabolism and its potential clinical application. Osteoporos Int. 2018; 29( 3): 535– 44. doi:10.1007/s00198-017-4255-1. [Google Scholar] [CrossRef]
6. Zhao J , Yang W , Cai H , Cao G , Li Z . Current progress and future trends of genomics-based techniques for food adulteration identification. Foods. 2025; 14( 7): 1116. doi:10.3390/foods14071116. [Google Scholar] [CrossRef]
7. Cai S , Liao X , Xi Y , Chu Y , Liu S , Su H , et al. Screening and application of DNA markers for novel quality consistency evaluation in Panax ginseng. Int J Mol Sci. 2025; 26( 6): 2701. doi:10.3390/ijms26062701. [Google Scholar] [CrossRef]
8. Feng S , Jiang Y , Wang S , Jiang M , Chen Z , Ying Q , et al. Molecular identification of Dendrobium Species (Orchidaceae) based on the DNA barcode ITS2 region and its application for phylogenetic study. Int J Mol Sci. 2015; 16( 9): 21975– 88. doi:10.3390/ijms160921975. [Google Scholar] [CrossRef]
9. Zhang M , Zhai X , He L , Wang Z , Cao H , Wang P , et al. Morphological description and DNA barcoding research of nine Syringa species. Front Genet. 2025; 16: 1544062. doi:10.3389/fgene.2025.1544062. [Google Scholar] [CrossRef]
10. Li A , Ma M , Li H , He S , Wang S . Genetic diversity and population differentiation of a Chinese endangered plant Ammopiptanthus nanus (M. pop.) Cheng f. Genes. 2023; 14( 5): 1020. doi:10.3390/genes14051020. [Google Scholar] [CrossRef]
11. Amiteye S . Basic concepts and methodologies of DNA marker systems in plant molecular breeding. Heliyon. 2021; 7( 10): e08093. doi:10.1016/j.heliyon.2021.e08093. [Google Scholar] [CrossRef]
12. Wang HF , Zong XX , Guan JP , Yang T , Sun XL , Ma Y , et al. Genetic diversity and relationship of global faba bean (Vicia faba L.) germplasm revealed by ISSR markers. Theor Appl Genet. 2012; 124( 5): 789– 97. doi:10.1007/s00122-011-1750-1. [Google Scholar] [CrossRef]
13. Xu X , Jiang M , Li X , Wang Y , Liu M , Wang H , et al. Three-dimensional characteristic chromatogram by online comprehensive two-dimensional liquid chromatography: application to the identification and differentiation of ginseng from herbal medicines to various Chinese patent medicines. J Chromatogr A. 2023; 1700: 464042. doi:10.1016/j.chroma.2023.464042. [Google Scholar] [CrossRef]
14. Zhang Z , Li X , Zhang Y , Yin N , Wu G , Wei G , et al. Ecological factors impacting genetic characteristics and metabolite accumulations of Gastrodia elata. Chin Herb Med. 2024; 17( 3): 562– 74. doi:10.1016/j.chmed.2024.09.002. [Google Scholar] [CrossRef]
15. Han Y , Wen J , Chen C , Zhou L , Zhang T , Feng W , et al. Relevance of genetic and active ingredient content differences in Leonurus japonicus Houtt from different origins. Genet Resour Crop Evol. 2024; 71( 2): 801– 10. doi:10.1007/s10722-023-01660-2. [Google Scholar] [CrossRef]
16. Cuénoud P , Savolainen V , Chatrou LW , Powell M , Grayer RJ , Chase MW . Molecular phylogenetics of Caryophyllales based on nuclear 18S rDNA and plastid rbcL, atpB, and matK DNA sequences. Am J Bot. 2002; 89( 1): 132– 44. doi:10.3732/ajb.89.1.132. [Google Scholar] [CrossRef]
17. Sun Y , Fung KP , Leung PC , Shaw PC . A phylogenetic analysis of Epimedium (Berberidaceae) based on nuclear ribosomal DNA sequences. Mol Phylogenet Evol. 2005; 35( 1): 287– 91. doi:10.1016/j.ympev.2004.12.014. [Google Scholar] [CrossRef]
18. Kress WJ , Erickson DL . A two-locus global DNA barcode for land plants: the coding rbcL gene complements the non-coding trnH-psbA spacer region. PLoS One. 2007; 2( 6): e508. doi:10.1371/journal.pone.0000508. [Google Scholar] [CrossRef]
19. Liu X , Fu CZ , Gao M , Zhi HC , Yang XB , Guo BL . Genetic relationship and population genetic diversity of Epimedium pubescens and its related species based on ISSR and non-glandular hair characteristic. China J Chin Mater Med. 2017; 42( 16): 3090– 7. (In Chinese). doi:10.19540/j.cnki.cjcmm.20170714.008. [Google Scholar] [CrossRef]
20. Chen Y , Xia H , Zhong X . In Vitro evaluation of the anti-pancreatic cancer activity of Epimedium herb. Front Pharmacol. 2024; 15: 1389221. doi:10.3389/fphar.2024.1389221. [Google Scholar] [CrossRef]
21. Guo M , Pang X , Xu Y , Jiang W , Liao B , Yu J , et al. Plastid genome data provide new insights into the phylogeny and evolution of the genus Epimedium. J Adv Res. 2021; 36: 175– 85. doi:10.1016/j.jare.2021.06.020. [Google Scholar] [CrossRef]
22. Swetha VP , Parvathy VA , Sheeja TE , Sasikumar B . Authentication of Myristica fragrans Houtt. using DNA barcoding. Food Control. 2017; 73: 1010– 5. doi:10.1016/j.foodcont.2016.10.004. [Google Scholar] [CrossRef]
23. Bansal S , Thakur S , Mangal M , Mangal AK , Gupta RK . DNA barcoding for specific and sensitive detection of Cuminum cyminum adulteration in Bunium persicum. Phytomedicine. 2018; 50: 178– 83. doi:10.1016/j.phymed.2018.04.023. [Google Scholar] [CrossRef]
24. Amane D , Ananthanarayan L . Detection of adulteration in black gram-based food products using DNA barcoding. Food Control. 2019; 104: 193– 200. doi:10.1016/j.foodcont.2019.04.041. [Google Scholar] [CrossRef]
25. Zhu S , Liu Q , Qiu S , Dai J , Gao X . DNA barcoding: an efficient technology to authenticate plant species of traditional Chinese medicine and recent advances. Chin Med. 2022; 17( 1): 112. doi:10.1186/s13020-022-00655-y. [Google Scholar] [CrossRef]
26. Guo M , Xu Y , Ren L , He S , Pang AX . A systematic study on DNA barcoding of medicinally important genus Epimedium L. (Berberidaceae). Genes. 2018; 9( 12): 637. doi:10.3390/genes9120637. [Google Scholar] [CrossRef]
27. Kress WJ , Wurdack KJ , Zimmer EA , Weigt LA , Janzen DH . Use of DNA barcodes to identify flowering plants. Proc Natl Acad Sci U S A. 2005; 102( 23): 8369– 74. doi:10.1073/pnas.0503123102. [Google Scholar] [CrossRef]
28. Raskoti BB , Ale R . DNA barcoding of medicinal orchids in Asia. Sci Rep. 2021; 11: 23651. doi:10.1038/s41598-021-03025-0. [Google Scholar] [CrossRef]
29. Worsham MLD , Julius EP , Nice CC , Diaz PH , Huffman DG . Geographic isolation facilitates the evolution of reproductive isolation and morphological divergence. Ecol Evol. 2017; 7( 23): 10278– 88. doi:10.1002/ece3.3474. [Google Scholar] [CrossRef]
30. Wang W , Chen B , Ma R , Qiao M , Fu Y . The DNA barcode identification of Dalbergia odorifera T. Chen and Dalbergia tonkinensis Prain. BMC Plant Biol. 2023; 23( 1): 546. doi:10.1186/s12870-023-04513-3. [Google Scholar] [CrossRef]
31. Jiang Z , Zhang M , Kong L , Bao Y , Ren W , Li H , et al. Identification of Apiaceae using ITS, ITS2 and psba-trnH barcodes. Mol Biol Rep. 2023; 50( 1): 245– 53. doi:10.1007/s11033-022-07909-w. [Google Scholar] [CrossRef]
32. Liu H , Hu H , Zhang S , Jin J , Liang X , Huang B , et al. The complete chloroplast genome of the rare species Epimedium tianmenshanensis and comparative analysis with related species. Physiol Mol Biol Plants. 2020; 26( 10): 2075– 83. doi:10.1007/s12298-020-00882-3. [Google Scholar] [CrossRef]
33. Xie L , Yang Y , Li Y , Chen S , Feng Y , Wang N , et al. A meta-analysis indicates positive correlation between genetic diversity and species diversity. Biology. 2021; 10( 11): 1089. doi:10.3390/biology10111089. [Google Scholar] [CrossRef]
34. Akhtar N , Ahmad Hafiz I , Hayat MQ , Potter D , Abbasi NA , Habib U , et al. ISSR-based genetic diversity assessment of genus Jasminum L. (Oleaceae) from Pakistan. Plants. 2021; 10( 7): 1270. doi:10.3390/plants10071270. [Google Scholar] [CrossRef]
35. Lin P , Yan ZF , Kook M , Li CT , Yi TH . Genetic and chemical diversity of edible mushroom Pleurotus species. BioMed Res Int. 2022; 2022: 6068185. doi:10.1155/2022/6068185. [Google Scholar] [CrossRef]
36. López-Goldar X , Agrawal AA . Ecological interactions, environmental gradients, and gene flow in local adaptation. Trends Plant Sci. 2021; 26( 8): 796– 809. doi:10.1016/j.tplants.2021.03.006. [Google Scholar] [CrossRef]
37. Liu M , Sun W , Li C , Yu G , Li J , Wang Y , et al. A multilayered cross-species analysis of GRAS transcription factors uncovered their functional networks in plant adaptation to the environment. J Adv Res. 2020; 29: 191– 205. doi:10.1016/j.jare.2020.10.004. [Google Scholar] [CrossRef]
38. An K , Zhou C , Tong B , Liu D , Shan X , Zhang X , et al. Population genetic differentiation and structure of rare plant Anemone shikokiana based on genotyping-by-sequencing (GBS). BMC Plant Biol. 2024; 24( 1): 995. doi:10.1186/s12870-024-05705-1. [Google Scholar] [CrossRef]
39. Yan J , Zheng B , Wang S , Xu W , Qian M , Ma X , et al. Genetic diversity and fingerprinting of 231 mango germplasm using genome SSR markers. Int J Mol Sci. 2024; 25( 24): 13625. doi:10.3390/ijms252413625. [Google Scholar] [CrossRef]
40. Kumar R , Das SP , Choudhury BU , Kumar A , Prakash NR , Verma R , et al. Advances in genomic tools for plant breeding: harnessing DNA molecular markers, genomic selection, and genome editing. Biol Res. 2024; 57( 1): 80. doi:10.1186/s40659-024-00562-6. [Google Scholar] [CrossRef]
41. Luo Y , Zhang M , Liu Y , Liu J , Li W , Chen G , et al. Genetic variation in YIGE1 contributes to ear length and grain yield in maize. New Phytol. 2022; 234( 2): 513– 26. doi:10.1111/nph.17882. [Google Scholar] [CrossRef]
42. Singh P , St Clair JB , Lind BM , Cronn R , Wilhelmi NP , Feau N , et al. Genetic architecture of disease resistance and tolerance in Douglas-fir trees. New Phytol. 2024; 243( 2): 705– 19. doi:10.1111/nph.19797. [Google Scholar] [CrossRef]
43. Luo Y , Yang H , Tao G . Systematic review on fingerprinting development to determine adulteration of Chinese herbal medicines. Phytomedicine. 2024; 129: 155667. doi:10.1016/j.phymed.2024.155667. [Google Scholar] [CrossRef]
44. Zhang C , Jiang Y , Liu C , Shi L , Li J , Zeng Y , et al. Identification of medicinal compounds of fagopyri dibotryis rhizome from different origins and its varieties using UPLC-MS/MS-based metabolomics. Metabolites. 2022; 12( 9): 790. doi:10.3390/metabo12090790. [Google Scholar] [CrossRef]
45. Zhou L , Ma Y , Yao J , Zhang M , Fu H , Yang J , et al. Discrimination of Chrysanthemum varieties using lipidomics based on UHPLC-HR-AM/MS/MS. J Sci Food Agric. 2023; 103( 2): 837– 45. doi:10.1002/jsfa.12195. [Google Scholar] [CrossRef]
46. Lu YA , Liu SJ , Hou SY , Ge YY , Xia BH , Xie MX . Metabolomics distinguishes different grades of Scrophularia ningpoensis hemsl: towards a biomarker discovery and quality evaluation. Heliyon. 2024; 10( 7): e28458. doi:10.1016/j.heliyon.2024.e28458. [Google Scholar] [CrossRef]
47. Li B , Lima MRM , Nie Y , Xu L , Liu X , Yuan H , et al. HPLC-DAD fingerprints combined with multivariate analysis of epimedii folium from major producing areas in eastern Asia: effect of geographical origin and species. Front Pharmacol. 2021; 12: 761551. doi:10.3389/fphar.2021.761551. [Google Scholar] [CrossRef]
48. Yao Y , Gu J , Luo Y , Zhang Y , Wang Y , Pang Y , et al. A novel 3-O-rhamnoside: 2″-O-xylosyltransferase responsible for terminal modification of prenylflavonol glycosides in Epimedium pubescens Maxim. Int J Mol Sci. 2022; 23( 24): 16050. doi:10.3390/ijms232416050. [Google Scholar] [CrossRef]
49. Yang X , Chen J , Huang W , Zhang Y , Yan X , Zhou Z , et al. Synthesis of icariin in tobacco leaf by overexpression of a glucosyltransferase gene from Epimedium sagittatum. Ind Crops Prod. 2020; 156: 112841. doi:10.1016/j.indcrop.2020.112841. [Google Scholar] [CrossRef]
50. Zhang H , Wang H , Wei J , Chen X , Sun M , Ouyang H , et al. Comparison of the active compositions between raw and processed Epimedium from different species. Molecules. 2018; 23( 7): 1656. doi:10.3390/molecules23071656. [Google Scholar] [CrossRef]
51. Skogerson K , Harrigan GG , Reynolds TL , Halls SC , Ruebelt M , Iandolino A , et al. Impact of genetics and environment on the metabolite composition of maize grain. J Agric Food Chem. 2010; 58( 6): 3600– 10. doi:10.1021/jf903705y. [Google Scholar] [CrossRef]
52. Gong D , Li X , Liu X , Sun G , Guo P . Electrochemical-based quantitative fingerprint evaluation strategy combined with multi-markers assay by monolinear method for quality control of herbal medicine. Phytomedicine. 2022; 104: 154274. doi:10.1016/j.phymed.2022.154274. [Google Scholar] [CrossRef]
53. Liu X , Zhang Y , Wu M , Ma Z , Huang Z , Tian F , et al. The scientific elucidation of daodi medicinal materials. Chin Med. 2020; 15( 1): 86. doi:10.1186/s13020-020-00367-1. [Google Scholar] [CrossRef]
54. Liang Q , Wei G , Chen J , Wang Y , Huang H . Variation of medicinal components in a unique geographical accession of horny goat weed Epimedium sagittatum Maxim. (Berberidaceae). Molecules. 2012; 17( 11): 13345– 56. doi:10.3390/molecules171113345. [Google Scholar] [CrossRef]
55. Yang D , Liu X , Xu X , Niu T , Ma X , Fu G , et al. Effect of soil and community factors on the yield and medicinal quality of Artemisia argyi growth at different altitudes of the Funiu mountain. Front Plant Sci. 2024; 15: 1430758. doi:10.3389/fpls.2024.1430758. [Google Scholar] [CrossRef]
56. Hoffmann AA , Sgrò CM , Lawler SH . Ecological population genetics the interface between genes and the environment. Annu Rev Genet. 1995; 29: 349– 70. doi:10.1146/annurev.ge.29.120195.002025. [Google Scholar] [CrossRef]
57. Younas M , Qureshi R , van Velzen R , Mashwani ZUR , Saqib Z , Ali A , et al. Geo-climatic factors co-drive the phenotypic diversity of wild hemp (Cannabis sativa L.) in the Potohar Plateau and Lesser Himalayas. BMC Plant Biol. 2024; 24( 1): 1031. doi:10.1186/s12870-024-05730-0. [Google Scholar] [CrossRef]
58. Liu L , Zuo ZT , Xu FR , Wang YZ . Study on quality response to environmental factors and geographical traceability of wild Gentiana rigescens Franch. Front Plant Sci. 2020; 11: 1128. doi:10.3389/fpls.2020.01128. [Google Scholar] [CrossRef]
59. Ben El Caid M , Lachheb M , Lagram K , Wang X , Serghini MA . Ecotypic variation and environmental influence on saffron (Crocus sativus L.) vegetative growth: a multivariate performance analysis. J Appl Res Med Aromat Plants. 2024; 43: 100601. doi:10.1016/j.jarmap.2024.100601. [Google Scholar] [CrossRef]
Cite This Article
 Copyright © 2026 The Author(s). Published by Tech Science Press.
This work is licensed under a Creative Commons Attribution 4.0 International License , which permits unrestricted use, distribution, and reproduction in any medium, provided the original work is properly cited.
 Downloads
 Citation Tools