
 Submit a Paper
 Propose a Special lssue
 Open Access
ARTICLE

Morpho-Anatomical and Biochemical Defense Responses of Pigeon Pea Varieties to Phytophthora Blight
1 N. V. Patel College of Pure and Applied Sciences, CVM University, V.V. Nagar, Anand, 388120, Gujarat, India
2 Food and Nutrition Science Department, Agricultural Science and Food, King Faisal University, Al-Ahsa, 31982, Saudi Arabia
3 Biological and Geological Sciences Department, Faculty of Education, Ain Shams University, Cairo, 11341, Egypt
4 Department of Arid Land Agriculture, College of Agricultural and Food Sciences, King Faisal University, Al-Ahsa, 31982, Saudi Arabia
* Corresponding Authors: Heba I. Mohamed. Email: ; Abdelrahman R. Ahmed. Email:
(This article belongs to the Special Issue: Fungal and Bacterial Disease Management in Agricultural Crops Through Biological Control, Disease Resistance, and Transcriptomics Approaches)
Phyton-International Journal of Experimental Botany 2026, 95(1), 18 https://doi.org/10.32604/phyton.2026.074570
Received 14 October 2025; Accepted 22 December 2025; Issue published 30 January 2026
 View Full Text
 Download PDF
Abstract
Phytophthora blight is a devastating disease of pigeon pea (Cajanus cajan) that severely impacts plant growth and productivity. This study investigates the morphological, anatomical, and biochemical responses of a susceptible variety (ICPL 11260) and a resistant variety (IPAC-02) following infection by Phytophthora. Morphological analyses showed that infection caused a drastic reduction in root length, shoot length, leaf number, fresh weight, and dry weight in the susceptible ICPL 11260 variety, with reductions ranging from 0.5- to 2-fold compared to non-infected controls. Anatomical observations revealed pronounced cellular damage and mycelial invasion in infected ICPL 11260 plants by 30 days after infection, whereas infected IPAC-02 plants exhibited no fungal colonization. Biochemical analyses further demonstrated that the resistant IPAC-02 variety accumulated higher levels of total soluble sugars, proteins, phenols, and flavonoids, along with increased activities of defense-related enzymes (chitinase and β-1,3-glucanase), compared with the susceptible ICPL 11260. Under P. cajani stress, IPAC-02 maintained significantly elevated osmolyte concentrations (total sugars 153.7 mg g−1 FW; proteins 25.4 mg g−1 FW), secondary metabolites (phenols 51.7 mg g−1 FW; flavonoids 33.1 mg g−1 FW), and PR-enzyme activities (chitinase 11.4 U mg−1 protein; β-1,3-glucanase 9.1 U mg−1 protein). These responses support a lignification-mediated defense mechanism in IPAC-02 and highlight its potential value for breeding Phytophthora-resistant pigeon pea cultivars.Keywords
Pigeon pea (Cajanus cajan L.) is a multipurpose perennial legume widely cultivated across tropical and subtropical regions. It is a major source of plant-based protein, dietary fiber, essential vitamins, and beneficial phytochemicals for millions of people, particularly in vegetarian and low-income populations [1]. Beyond its nutritional value, pigeon pea cultivation plays a crucial role in supporting the livelihoods of subsistence farmers in South Asia, East Africa, and parts of South America [2]. The crop is also used in various value-added products, including flour, noodles, biscuits, and bread [3]. Globally, approximately 4.49 million tons of pigeon peas are produced annually, with India accounting for nearly 63% of total production and 72% of the global cultivation area [4].
Despite its importance, pigeon pea productivity remains low due to biotic stresses, particularly fungal and oomycete pathogens such as dry root rot, Fusarium wilt, sterility mosaic disease, powdery mildew, and Phytophthora blight [5,6]. Among these, Phytophthora blight, caused by Phytophthora cajani, is one of the most destructive diseases, capable of causing severe plant mortality and significant yield losses [7]. The pathogen, predominantly soil- and water-borne, infects pigeon pea at any growth stage and induces symptoms such as stem blight, stem canker, leaf blight, and root rot [8]. Disease outbreaks are particularly common under conditions of prolonged humidity, warm temperatures, and excessive rainfall, making it a recurring threat in major pigeon pea-growing regions [7,8,9,10]. The response of a genotype to biotic stress is largely determined by its physiological and biochemical attributes, which play a crucial role in conferring either resistance or susceptibility. Plants are equipped with a wide range of defense mechanisms that restrict the growth and development of pathogenic organisms. Key biomolecules associated with disease resistance include polyphenol oxidase (PPO), phenylalanine ammonia lyase (PAL), peroxidase (POD), phenolic compounds, soluble carbohydrates, and ascorbic acid. Investigating the biochemical basis of resistance enhances our understanding of host–pathogen interactions and provides valuable insights for improved disease management strategies [11].
Plants respond to pathogen invasion through a complex and multilayered defense system involving morphological, anatomical, and biochemical mechanisms. Structural defenses, such as cell wall thickening, lignification, and modifications in xylem and phloem tissues, act as early barriers that restrict pathogen penetration and colonization [12]. At the biochemical level, pathogen attack triggers the accumulation of reactive oxygen species, osmolytes, secondary metabolites (phenols, flavonoids), and pathogenesis-related (PR) proteins, including chitinases and β-1,3-glucanases, which collectively contribute to induced resistance [12,13]. The magnitude of these responses varies among genotypes and is often associated with the degree of disease resistance they exhibit [6,9,13].
Although several studies have examined individual biochemical or physiological responses to Phytophthora blight, an integrated understanding of how morphological damage, anatomical alterations, and biochemical defense activation collectively determine resistance in pigeon pea remains limited. A comprehensive comparative analysis of resistant and susceptible genotypes is essential for elucidating defense pathways and identifying traits that contribute to durable resistance. Therefore, the present study investigates the morpho-anatomical and biochemical defense responses of a resistant pigeon pea variety (IPAC-02) and a susceptible variety (ICPL 11260) following infection with Phytophthora cajani. By assessing growth parameters, tissue-level anatomical changes, osmolyte accumulation, secondary metabolite production, and PR-enzyme activities across different days post-infection, this study provides a holistic understanding of the defense mechanisms governing varietal resistance. The findings contribute valuable insights for breeding programs aimed at developing Phytophthora-resistant pigeon pea cultivars.
2.1 Plant Materials and Fungal Pathogens
Seeds of the pigeon pea varieties, including the Phytophthora blight–susceptible ICPL 11260 and the Phytophthora blight–resistant IPAC-02, along with the P. cajani isolate, were obtained from the Indian Pulse Research Centre, Kanpur, Uttar Pradesh.
2.2 Zoospore Production and Culture Conditions
Zoospore production was carried out by culturing P. cajani on V8 juice agar medium under controlled laboratory conditions. Actively growing mycelial discs were transferred to sterile distilled water and incubated under continuous light at 24–26°C to stimulate sporangial formation. Subsequent chilling at 4–8°C for 30–60 min, followed by incubation at room temperature, induced zoospore release. The resulting zoospore suspension was filtered to remove mycelial debris and adjusted to the required concentration using a hemocytometer for further experimental use. Zoospore viability was checked before inoculation by spreading an aliquot onto 1.5% water agar and assessing germination after 2–3 h; only suspensions with >90% germinating zoospores were used.
Earthen pots with a diameter of 10.5 inches and a depth of 10 inches, filled with sandy loam soil, were used for the experiment. Pigeon pea seeds (ICPL 11260 and IPAC-02) were surface-sterilized with 0.1% mercuric chloride for 2 min, followed by thorough washing with sterile distilled water, and then planted in the pots at a rate of three seeds per pot. The experiment was conducted using a completely randomized design (CRD) consisting of 100 pots in total. Two pigeon pea (C. cajan) varieties were evaluated, each represented by 50 pots. For each variety, two treatments (inoculated and non-inoculated control) were applied, with 25 pots per treatment. Each pot contained uniform, healthy seedlings and was considered an experimental unit, as all plants within a pot were subjected to the same treatment and maintained under identical growth conditions. Five-day-old seedlings were inoculated with 10 mL per seedling of a zoospore suspension containing 1.5 × 10⁵ zoospores/mL, while control plants received sterile distilled water.
All pot experiments were conducted in a controlled growth chamber. The temperature was maintained at 25 ± 2°C during the light period and 20 ± 2°C during the dark period, with a relative humidity of 60–70%. A 16/8 h light/dark photoperiod was provided, and photosynthetically active radiation at canopy height was maintained at 250–300 μmol m−2 s−1 using cool white fluorescent lamps. Pots were randomly rearranged every 3–4 days to minimize positional effects within the chamber.
2.5 Soil Collection and Characterization
The experiment was conducted using surface soil (0–15 cm) collected from the experimental farm. The soil was air-dried, gently crushed, and passed through a 2 mm sieve before use. Soil texture was determined using the hydrometer method and confirmed as sandy loam. Soil pH and EC were measured in a 1:2.5 (w/v) soil-to-water suspension using a digital pH and conductivity meter, and organic matter content was determined using the Walkley–Black method. The main physico-chemical properties of the soil used in the pot experiment are presented in Table 1. To maintain the natural microbial community relevant for disease development, the soil was used in a non-sterilized form after sieving and homogenization.
Table 1: Physico-chemical properties of the soil used in the pot experiment.
| Parameter | Value | Method |
|---|---|---|
| Texture | Sandy loam | Hydrometer method |
| Sand (%) | 62.4 | |
| Silt (%) | 23.5 | |
| Clay (%) | 14.1 | |
| pH (1:2.5 soil:water) | 7.2 | Digital pH meter |
| Electrical conductivity (EC) | 0.72 dS m−1 | Conductivity meter (1:2.5 soil:water) |
| Organic matter (%) | 0.65 | Walkley–Black method |
| Available N (kg ha−1) | 145 | Kjeldahl |
| Available P (kg ha−1) | 18.2 | Olsen (NaHCO3 extraction) |
| Available K (kg ha−1) | 165 | Flame photometer |
2.6 Data Collection and Morphological Parameters
The entire experiment was replicated three times under identical environmental conditions. Data on morphological traits were collected at five-day intervals initially, and then at ten-day intervals, starting from the 5th day after inoculation and continuing for 35 days. Shoot length was measured using a ruler from the collar region to the tip, and root length was similarly measured from the collar region to the tip of the primary root. The number of leaves was counted manually. Whole plants were carefully uprooted and weighed using an electronic balance to record fresh weight. The uprooted plants were then dried in an oven for 24 h and weighed again to determine their dry weight.
2.7 Disease Assessment and Symptom Scoring
Disease development following P. cajani inoculation was evaluated using a visual 0–5 disease severity scale using the formula:
Disease index = Total grade × 100/No. of sheaths observed × maximum grade.
Disease ratings were conducted at 7, 14, 21, 28, and 35 days post-inoculation (dpi) across all genotypes and treatments. Mean disease severity values were computed per pot and used as biological replicates for statistical analysis.
2.8 Pathogen Re-Isolation and Molecular Confirmation
To fulfill Koch’s postulates P. cajani was re-isolated from symptomatic root and stem tissues collected at 21 and 35 dpi. Tissue segments were surface-sterilized (70% ethanol followed by 1% sodium hypochlorite for 1 min each), rinsed in sterile water and plated on selective V8 agar amended with antibiotics. Emerging colonies were identified based on colony morphology, sporangial characteristics, and growth patterns consistent with original inoculum cultures.
The 15-day-old Phytophthora blight–susceptible (ICPL 11260) and resistant (IPAC 02) pigeon pea varieties were inoculated with 10 mL of a 10−5 zoospore/mL suspension of P. cajani for anatomical studies. Leaves, stems, and roots from both control and infected plants of each variety were examined. Three observation time points—pre-infection, 15 days after infection, and 30 days after infection—were used, and sections were prepared using the freehand method. All sections were observed under a light microscope equipped with a digital camera.
The 15-day-old phytophthora blight susceptible (ICPL 11260) and resistant (IPAC 02) plant varieties were inoculated with 10 mL of a 105 zoospore/mL suspension of P. cajani for biochemical analysis. Fresh leaf samples of both control and infected plants are used as samples for various biochemical analyses. Samples were taken at six different time points: pre-infection and the 10th, 15th, 20th, 25th, 30th, and 35th days after infection (DAI) for assessing total sugar, total protein, total phenol, total flavonoid, β-glucanase, and chitinase activity concerning fungal infection.
2.11 Determination of Total Soluble Sugar
The phenol-sulphuric acid method, with minor changes, was used to assess the total soluble sugars in the pigeon pea leaves [14]. One gram of pigeon pea leaf tissue was homogenized in 80% ethanol. The material was refluxed for 15 min at 70°C in a water bath and then centrifuged for 10 min at 6000× g. Two further extractions of the pellet using 80% ethanol were performed, and the supernatants were combined. To estimate the total soluble sugar, a sample of the supernatant was used. Each treatment sample received 0.1 mL of supernatant, 0.9 mL of distilled water, 80 μL of 80% phenol, and 1 mL of concentrated H2SO4 in the reaction mixture, which was then thoroughly shaken. At 490 nm, the absorbance was measured using a 1 mg/mL glucose solution as the reference. The amount of soluble sugar in total was stated as mg/g FW.
2.12 Determination of Total Protein
The technique outlined by Lowry et al. [15] was used to estimate total protein. Cold 0.1 M phosphate buffer at pH 7.2 was used to homogenize one gram of pigeon pea leaf tissue. The leaf extract was centrifuged at 10,000× g for 4°C, and the supernatant was taken as a sample to measure the amount of protein. The reaction mixture comprised 5 mL of alkaline copper sulfate solution, 0.9 mL of distilled water, 0.5 mL of Folin-Ciocalteau reagent, and 0.1 mL of supernatant. It was then incubated at room temperature in the dark for 30 min before the absorbance at 660 nm was measured. As a reference, 0.2 mg/mL of bovine serum albumin was used. The total protein content was computed and expressed as mg/g FW.
2.13 Determination of Total Phenol
Khatiwora et al. [16] developed a method to determine the total phenol content of pigeon pea seedlings. In a mortar and pestle, one gram of pigeon pea leaves was homogenized with 10 mL of 80% ethanol. After centrifuging the homogenate for 15 min at 10,000× g, the supernatant was left to evaporate in a water bath. After that, a predetermined amount of hot, distilled water was used to dissolve the residue. 1 mL of an aliquot was added to each test tube, followed by 0.5 mL of Folin-Ciocalteau reagent and, 3 min later, 2 mL of 20% sodium carbonate solution. The mixture’s ultimate volume is 5 mL in each tube after adding distilled water. At 660 nm, the absorbance was measured. To plot the standard curve, a concentration of 0.1 mg/mL of catechol was used as the standard. The unit of measurement for total phenol content was mg catechol/g fresh weight of material.
2.14 Determination of Total Flavonoid
The El-Haci et al. [17] method was used to determine the total flavonoid content of the tissue from pigeon pea leaves. One gram of pigeon pea leaves was homogenized with 10 mL of methanol. The reaction mixture consists of 0.2 mL of supernatant with 2 mL of distilled water, 0.3 mL of 5% NaNO2, and 0.3 mL of 10% aluminum chloride (AlCl3). It is then allowed to sit at room temperature for 6 min before 2 mL of a 1M NaOH solution is added. Once the mixture was well combined, it was left to stand for an additional 15 min. The mixture was then tested for absorbance at 510 nm with a standard consisting of 0.5 mg/mL of quercetin solution. The overall flavonoid content was expressed as mg quercetin/g fresh weight.
2.15 Determination of β-Glucanase
One gram of leaves was extracted using a pre-chilled mortar and pestle with 1% (w/v) soluble polyvinylpyrolidone (PVP), 0.2% (w/v) sodium sulfate, and 10% sodium chloride in 10 mL of 100 mM sodium acetate buffer, pH 4.8. After 15 min at 10,000 rpm, the homogenate was centrifuged [18]. The laminarin-dinitro salicylic acid technique was used to assess the beta-glucanase enzyme activity. For 10 min, the assay mixture, which included 62.5 μL of 4% laminarin and 62.5 μL of plant extract, was incubated at 40°C. The reaction was stopped by adding 375 μL of the dinitrosalicylic acid reagent, which was then boiled for 5 min in a boiling water bath. 0.5 mL of the dark brown solution was diluted with distilled water using 4.5 mL. The absorbance was determined at 500 nm using a UV–Vis spectrophotometer (PerkinElmer Lambda 365).
Reducing sugars released were quantified against a standard curve prepared with glucose (0–200 μg mL−1; R2 ≥ 0.99), and results were expressed as μmol glucose equivalents released. One unit (1 U) of β-1,3-glucanase activity was defined as the amount of enzyme that released 1 μmol of glucose equivalents per minute under the assay conditions, and activity was normalized to protein content and expressed as U mg−1 protein. Preliminary assays were conducted to ensure that product formation was linear with respect to incubation time (15–45 min) and protein concentration in the extract, and final reactions were run within this linear range.
2.16 Determination of Chitinase
The extraction was prepared the same as the beta-glucanase assay. The Boller and Mauch [19] method was used to measure the chitinase enzyme activity. The reaction mixture consists of 0.2 mL of the enzyme, 0.2 mL of 10 mM sodium acetate buffer, and 0.2 mL of 0.05% chitin (Sigma) (dissolved in boiling water). The reaction mixture was then incubated at 50°C for 1 h. After centrifuging the assay mixture for 2 min at 2000 rpm, p-dimethylaminobenzaldehyde (DMAB) method was used to evaluate the production of the sugar N-acetylglucosamine [20]. Chitinase enzyme activity was measured in U mg−1 protein.
Released N-acetyl-D-glucosamine (NAG) was quantified using a standard curve of NAG (0–200 μg mL−1; R2 ≥ 0.99), and activity was expressed as μmol NAG equivalents released. One unit (1 U) of chitinase activity was defined as the amount of enzyme that released 1 μmol of NAG equivalents per minute under the assay conditions, and values were normalized to protein content and reported as U mg−1 protein. As with β-1,3-glucanase, preliminary tests confirmed that product formation was linear over the chosen incubation period and protein concentration range, and all final measurements were performed within this linear range.
2.17 Protein Source for Enzyme Normalization and Standard Curves
The protein concentration used to normalize PR-enzyme activities was measured from the same crude extract that was used for enzyme assays. The standards, concentration ranges, and linearity (R2) for all biochemical assays are as follows:
Soluble sugars: glucose standard (e.g., 0–100 μg mL−1, R2 ≥ 0.99)
Total proteins: BSA standard (e.g., 0–200 μg mL−1, R2 ≥ 0.99)
Total phenols: catechol standard (e.g., 0–200 μg mL−1, R2 ≥ 0.99)
Total flavonoids: quercetin standard (e.g., 0–100 μg mL−1, R2 ≥ 0.99)
Extraction blanks (reagent controls without tissue extract) were included for each assay and subtracted from sample absorbance. Each biological replicate was measured with three technical replicates, and mean values were used for analysis.
Statistical analysis was performed using SPSS software. Data were expressed as mean ± standard deviation. Initially, a one-way ANOVA was applied with three replicates per treatment, followed by Duncan’s multiple range test to compare means, and differences were considered significant at p ≤ 0.05.
3.1 Effect of Infection of P. cajani on Morphological Parameters of Pigeon Pea Varieties
A study of morphological parameters in pigeon pea varieties infected with P. cajani revealed significant differences between infected and non-infected plants, as well as between susceptible and resistant varieties. As shown in Table 2, the root and shoot lengths of the susceptible variety ICPL 11260 were markedly affected by the pathogen. Across all time points, infected ICPL 11260 consistently exhibited the shortest roots and shoots lengths and the lowest number of leaves compared to non-infected ICPL 11260 and both infected and non-infected IPAC-02. In contrast, IPAC-02 maintained greater root and shoot lengths under both infected and non-infected conditions at most point, suggesting a variety-specific resilience to phytophthora blight. The pattern of leaf development mirrored that of root and shoot growth, with infected ICPL 11260 showing the fewest leaves throughout the experimental period, while non-infected IPAC-02 reached a maximum of 25 leaves on the 45th day and generally maintained the highest leaf numbers across most time points.
The data in Table 2 indicate that infected ICPL 11260 consistently exhibited the lowest fresh weight, approximately half that of non-infected ICPL 11260, from the onset of infection throughout the experiment, reflecting a more progressive impact of P. cajani on this susceptible variety compared to infected IPAC-02. Both non-infected varieties showed steady and continuous growth during the experimental period. Notably, infected IPAC-02 displayed a significant increase in dry weight (0.82 g) on the 20th day compared to non-infected IPAC-02 and both ICPL 11260 treatments. This continuous increase in dry weight in infected IPAC-02 suggests the activation of defense mechanisms that protect it against pathogen invasion. In contrast, infected ICPL 11260 consistently recorded the lowest dry weight, approximately 1.5–2 times lower than both non-infected ICPL 11260 and IPAC-02, as well as infected IPAC-02, throughout the experimental period.
The higher dry weight observed in infected IPAC-02 may be attributed to the formation of secondary structures, lignification of cell walls, and synthesis of defense-related metabolites. In contrast, the higher fresh weight in non-infected IPAC-02 reflects efficient water uptake, which may be compromised in infected plants. Fungal invasion likely triggers defense responses that alter normal plant physiological activity to protect against pathogen attack. Both non-infected ICPL 11260 and IPAC-02 maintained continuous and steady growth throughout the experimental period. Overall, the data indicates that P. cajani infection caused a significant decline in all growth traits, particularly in the susceptible ICPL 11260 variety.
Table 2: Effect of P. cajani infestation on roots, shoot lengths, and number of leaves of pigeon pea varieties.
| Pigeon Pea Varieties | Treatment | Days after Infection (DAI) | |||||
|---|---|---|---|---|---|---|---|
| Root Length (cm) | |||||||
| 10 | 15 | 20 | 25 | 30 | 35 | ||
| ICPL 11260 | Non-Infected | 3.88 ± 0.06c | 4.93 ± 0.07c | 5.71 ± 0.08c | 7.14 ± 0.11a | 7.76 ± 0.12b | 9.29 ± 0.15c |
| Infected | 3.37 ± 0.22d | 4.42 ± 0.22d | 5.16 ± 0.26d | 6.41 ± 0.58c | 6.82 ± 0.46c | 7.13 ± 0.25d | |
| IPAC-02 | Non-Infected | 4.50 ± 0.25a | 5.63 ± 0.28a | 6.46 ± 0.58a | 7.17 ± 0.16a | 8.53 ± 0.14a | 10.2 ± 0.22a |
| Infected | 4.11 ± 0.1b | 5.12 ± 0.13b | 6.26 ± 0.10b | 6.74 ± 0.52b | 7.87 ± 0.60b | 9.53 ± 0.43b | |
| Shoot length (cm) | |||||||
| ICPL 11260 | Non-Infected | 18.74 ± 0.4b | 21.3 ± 0.20b | 22.87 ± 0.2b | 25.69 ± 0.1b | 32.00 ± 0.4b | 41.61 ± 0.3ab |
| Infected | 14.00 ± 0.6d | 16.2 ± 0.18c | 18.05 ± 0.2c | 19.61 ± 0.3d | 20.24 ± 0.2c | 21.46 ± 0.2c | |
| IPAC-02 | Non-Infected | 19.89 ± 0.1a | 21.9 ± 0.08a | 23.39 ± 0.3a | 26.64 ± 0.1a | 32.92 ± 0.1a | 42.33 ± 0.4a |
| Infected | 18.34 ± 0.4c | 21.3 ± 0.32b | 22.61 ± 0.2b | 25.10 ± 0.1c | 31.35 ± 0.4b | 40.96 ± 0.5b | |
| Number of leaves | |||||||
| ICPL 11260 | Non-Infected | 5.33 ± 0.6b | 8.00 ± 1.0b | 10.67 ± 0.6b | 14.33 ± 0.6b | 17.00 ± 1.0c | 23.67 ± 0.6b |
| Infected | 3.33 ± 0.6d | 5.67 ± 0.6d | 8.33 ± 0.6c | 8.67 ± 1.2c | 11.33 ± 1.2d | 13.00 ± 1.0d | |
| IPAC-02 | Non-Infected | 7.00 ± 1.0a | 9.33 ± 1.2a | 13.0 ± 1.0a | 18.33 ± 0.6a | 22.33 ± 0.6a | 25.67 ± 0.6a |
| Infected | 4.33 ± 0.6c | 7.00 ± 1.0c | 10.67 ± 0.6b | 14.33 ± 0.6b | 19.00 ± 1.0b | 22.67 ± 1.2c | |
| Fresh weight (g) | |||||||
| ICPL 11260 | Non-Infected | 0.50 ± 0.05b | 1.06 ± 0.06b | 2.20 ± 0.08a | 3.45 ± 0.12a | 4.09 ± 0.08b | 5.12 ± 0.08a |
| Infected | 0.39 ± 0.04d | 0.54 ± 0.08d | 1.14 ± 0.07b | 1.42 ± 0.06c | 2.15 ± 0.12d | 2.74 ± 0.18c | |
| IPAC-02 | Non-Infected | 0.62 ± 0.04a | 1.14 ± 0.06a | 2.27 ± 0.09a | 3.56 ± 0.10a | 4.30 ± 0.17a | 5.26 ± 0.10a |
| Infected | 0.47 ± 0.04c | 0.68 ± 0.09c | 1.19 ± 0.09b | 2.57 ± 0.12b | 3.13 ± 0.08c | 3.82 ± 0.13b | |
| Dry weight (g) | |||||||
| ICPL 11260 | Non-Infected | 0.17 ± 0.02b | 0.21 ± 0.02a | 0.67 ± 0.05b | 0.95 ± 0.02a | 0.90 ± 0.05b | 1.13 ± 0.03b |
| Infected | 0.11 ± 0.04c | 0.15 ± 0.05c | 0.44 ± 0.02c | 0.39 ± 0.04c | 0.48 ± 0.04d | 0.71 ± 0.04d | |
| IPAC-02 | Non-Infected | 0.35 ± 0.21a | 0.22 ± 0.05a | 0.82 ± 0.03a | 0.95 ± 0.03a | 1.01 ± 0.04a | 1.25 ± 0.02a |
| Infected | 0.17 ± 0.03b | 0.19 ± 0.05b | 0.61 ± 0.04b | 0.71 ± 0.04b | 0.80 ± 0.02c | 1.03 ± 0.02c | |
3.2 Two Way Anova of Morphological Analysis
Assumptions of ANOVA were evaluated prior to analysis. Normality of residuals and homogeneity of variances were assessed using the Shapiro–Wilk and Levene’s tests, respectively. For morphological parameters, these tests indicated deviations from normality and homoscedasticity (p < 0.05). However, given the balanced experimental design with equal replication across treatments and time points, ANOVA is considered robust to moderate violations of these assumptions and was therefore applied”.
Morphological traits were significantly influenced by variety, treatment, and days after infection (DAI). For root length, three-way ANOVA revealed significant main effects of variety (F1,48 = 103.73, p < 0.001, ηp2 = 0.684), treatment (F1,48 = 67.43, p < 0.001, ηp2 = 0.584), and DAI (F5,48 = 382.62, p < 0.001, ηp2 = 0.976), with a significant variety × treatment interaction (F1,48 = 11.74, p = 0.001, ηp2 = 0.196). Interactions involving DAI were also significant (variety × DAI: F5,48 = 6.54, p < 0.001; treatment × DAI: F5,48 = 5.62, p < 0.001), whereas the three-way interaction was not significant (F5,48 = 2.40, p = 0.051). The residual mean square error (MSE) for root length was 0.108.
Shoot length showed strong main effects of variety (F1,48 = 728.71, p < 0.001, ηp2 = 0.938), treatment (F1,48 = 871.89, p < 0.001, ηp2 = 0.948), and DAI (F5,48 = 1201.49, p < 0.001, ηp2 = 0.992). All interaction terms were significant, including variety × treatment (F1,48 = 573.89, p < 0.001), variety × DAI (F5,48 = 61.68, p < 0.001), treatment × DAI (F5,48 = 68.92, p < 0.001), and the three-way interaction (F5,48 = 53.66, p < 0.001). The MSE for shoot length was 0.483.
For number of leaves, significant effects were observed for variety (F1,48 = 248.53, p < 0.001, ηp2 = 0.838), treatment (F1,48 = 272.00, p < 0.001, ηp2 = 0.850), and DAI (F5,48 = 478.48, p < 0.001, ηp2 = 0.980). Significant interaction effects were detected for variety × treatment (F1,48 = 19.06, p < 0.001), variety × DAI (F5,48 = 17.99, p < 0.001), treatment × DAI (F5,48 = 12.02, p < 0.001), and the three-way interaction (F5,48 = 7.06, p < 0.001). The MSE for number of leaves was 0.944.
Fresh weight was significantly affected by variety (F1,48 = 70.81, p < 0.001, ηp2 = 0.596), treatment (F1,48 = 789.61, p < 0.001, ηp2 = 0.943), and DAI (F5,48 = 986.02, p < 0.001, ηp2 = 0.990). All interaction effects were significant, including the three-way interaction (F5,48 = 6.08, p < 0.001). The MSE for fresh weight was 0.027.
Dry weight also showed significant main effects of variety (F1,48 = 156.70, p < 0.001, ηp2 = 0.766), treatment (F1,48 = 125.90, p < 0.001, ηp2 = 0.724), and DAI (F5,48 = 183.90, p < 0.001, ηp2 = 0.950). Significant interaction effects were observed for variety × treatment (F1,48 = 34.74, p < 0.001), variety × DAI (F5,48 = 5.47, p < 0.001), treatment × DAI (F5,48 = 7.04, p < 0.001), and variety × treatment × DAI (F5,48 = 7.67, p < 0.001). The MSE for dry weight was 0.008.
3.3 Effect of Infection of P. cajani on Anatomical Responses of Pigeon Pea Varieties
Roots: Transverse sections of non-infected ICPL 11260 and IPAC-02 roots on the 15th day after infection exhibited 2–4 layers of cork, several layers of cortex, a layer of endodermis, a few patches of pericyclic fibers, and centrally located xylem and xylem parenchyma, with phloem situated just above the xylem. By the 30th day, non-infected roots developed secondary structures, including a cambium ring, secondary xylem, and xylem vessels. In infected ICPL 11260, mycelial growth was evident at both 15 and 30 days after infection. On the 15th day, epidermal cells were extensively damaged, and the cortex was disorganized, with xylem and phloem vessels attacked. By the 30th day, roots showed widespread mycelial invasion. In contrast, infected IPAC-02 roots remained free from pathogen invasion, displaying well-organized secondary xylem and phloem vessels, with dark purple staining due to lignification of the cell walls (Fig. 1).
Stems: In transverse sections of non-infected ICPL 11260 and IPAC-02 stems, a layered epidermis was observed, followed by a cortical zone, irregular patches of pericyclic fibers, and an open bicollateral vascular bundle. The xylem was radially arranged and occupied the majority of the section, with phloem located just above it, and the centrally located pith gradually rupturing as the plant matured. In infected ICPL 11260 stems, by the 15th day, the pathogen had attacked the cortical region and phloem, progressing toward the pith. By the 30th day, the entire stem was invaded, disrupting the epidermis and cortex, with phloem and xylem vessels covered in mycelia. In contrast, infected IPAC-02 stems showed no pathogen invasion, maintained well-organized cell structures, developed secondary xylem and phloem vessels, and exhibited extensive lignification of cell walls (Fig. 1).
Leaflets: Transverse sections of non-infected ICPL 11260 and IPAC-02 leaflets through the midrib exhibited a single-layered upper and lower epidermis, often interrupted by trichomes, with collenchyma beneath the epidermis on both sides. The centrally located open bicollateral vascular bundle, consisting of xylem and phloem, was supported by ground tissue and surrounded by a pericyclic fiber ring. In infected ICPL 11260, 15 days after infection, the mesophyll was affected and tissues darkened, although the epidermis remained largely intact. By 30 days, the entire leaf was invaded, with disruption of the epidermis and phloem and xylem vessels covered with mycelia. Infected IPAC-02 showed no signs of pathogen invasion at any stage; instead, cell structures remained well-organized, secondary phloem and xylem vessels were formed, and extensive lignification of cell walls was observed (Fig. 1).
Overall, these anatomical observations indicate that ICPL 11260 is highly susceptible to P. cajani, exhibiting extensive structural damage across roots, stems, and leaves, whereas IPAC-02 demonstrates structural resilience likely associated with defense responses such as lignification and maintenance of organized vascular tissues.
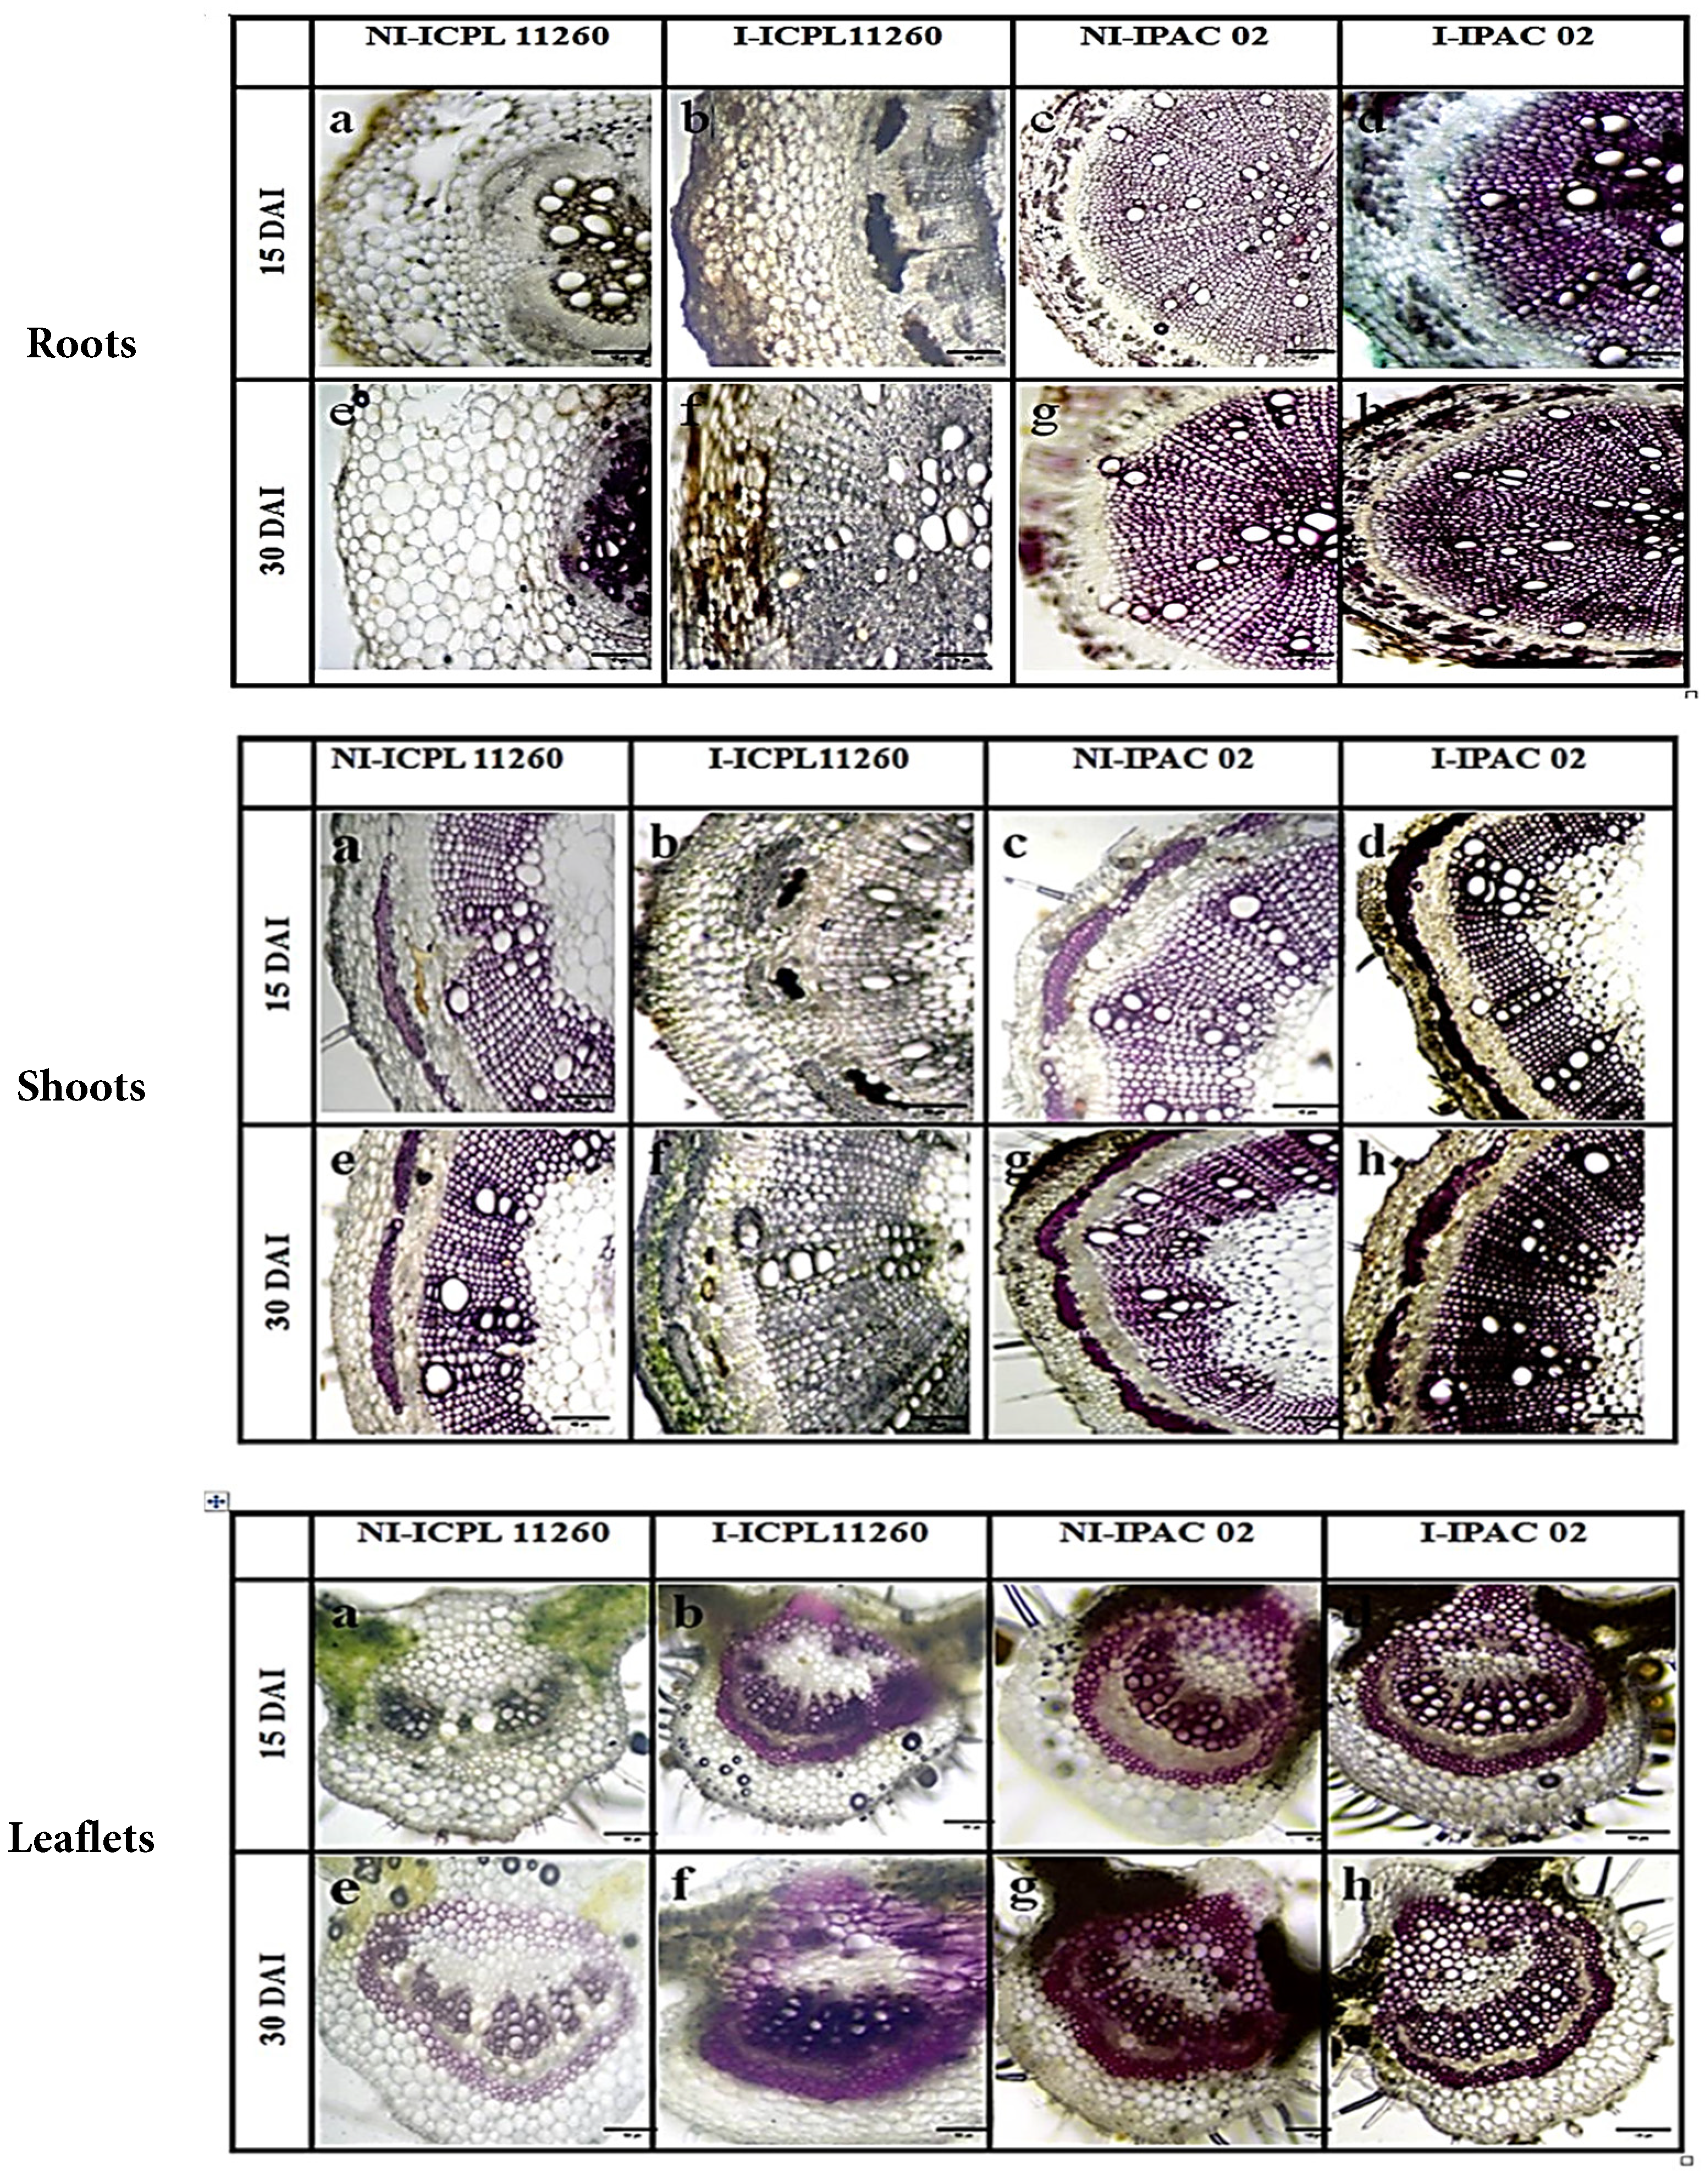
Figure 1: Transverse section of both infected and non-infected pigeon pea plant roots, shoots, and leaflets on the 15th and 30th days after infection (DAI), 10× and 100 μm scale bar. (a—non-infected ICPL 11260 at 15th DAI, b—infected ICPL 11260 at 15th DAI, c—non-infected IPAC-02 at 15th DAI, d—infected IPAC-02 at 15th DAI, e—non-infected ICPL 11260 at 30th DAI, f—infected ICPL 11260 at 15th DAI, g—non-infected IPAC-02 at 30th DAI, h—infected IPAC-02 at 30th DAI).
3.4.1 Effect of Infection of P. cajani on Osmolytes of Pigeon Pea Varieties
The data in Table 3 show that osmolyte levels (total soluble proteins and total soluble sugars) increased significantly with increasing days after infection by P. cajani in both pigeon pea varieties. The most pronounced increases in both parameters were observed at 35 days after infection in both non-infected and infected plants compared with pre-infection values. The resistant variety (IPAC-02) exhibited higher levels of total soluble proteins and sugars in infected plants than the susceptible variety (ICPL 11260). In ICPL 11260, infection caused a significant decrease in total soluble proteins and sugars compared with the non-infected control. Conversely, in IPAC-02, infection resulted in a significant increase in both parameters compared with the corresponding non-infected plants. Among all treatments, infected IPAC-02 at 35 days after infection recorded the highest total soluble sugars (153.73 mg/g FW) and total soluble proteins (25.43 mg/g FW), whereas infected ICPL 11260 at the same time exhibited the lowest levels of total soluble sugars (75.41 mg/g FW) and total soluble proteins (22.70 mg/g FW).
Table 3: Effect of P. cajani infestation on osmolytes and secondary metabolites content of pigeon pea varieties.
| Pigeon Pea Varieties | Treatment | Days after Infection (DAI) | ||||||
|---|---|---|---|---|---|---|---|---|
| Total Soluble Protein (mg/g FW) | ||||||||
| Pre-Infection | 10 | 15 | 20 | 25 | 30 | 35 | ||
| ICPL11260 | Non-Infected | 14.38 ± 0.3b | 15.06 ± 0.1c | 15.86 ± 0.1b | 16.34 ± 0.2c | 18.59 ± 0.1c | 22.9 ± 0.2a | 25.85 ± 0.2a |
| Infected | 10.05 ± 0.2d | 11.36 ± 0.1d | 13.77 ± 0.1c | 14.58 ± 0.2d | 18.43 ± 0.1d | 19.7 ± 0.3d | 22.70 ± 0.2d | |
| IPAC-02 | Non-Infected | 16.01 ± 0.3b | 17.00 ± 0.2b | 17.86 ± 0. 1b | 19.52 ± 0.2b | 19.07 ± 0.1b | 20.0 ± 0.3c | 22.97 ± 0.2c |
| Infected | 19.52 ± 0.4a | 20.39 ± 0.2a | 22.39 ± 0.1a | 25.02 ± 0.2a | 19.36 ± 0.1a | 22.4 ± 0.5b | 25.43 ± 0.2b | |
| Total soluble sugars (mg/g FW) | ||||||||
| ICPL11260 | Non-Infected | 45.66 ± 0.5c | 48.84 ± 0.3b | 50.11 ± 0.4b | 77.69 ± 0.6b | 84.48 ± 0.5b | 93.0 ± 0.8b | 95.97 ± 0.5b |
| Infected | 45.59 ± 0.5c | 48.49 ± 0.3b | 47.64 ± 0.4b | 73.31 ± 0.8b | 59.59 ± 0.4c | 72.4 ± 0.9c | 75.41 ± 0.6c | |
| IPAC-02 | Non-Infected | 48.77 ± 0.6a | 49.55 ± 0.4b | 51.24 ± 0.5b | 58.74 ± 0.4c | 81.58 ± 0.7b | 89.4 ± 1.0b | 92.41 ± 0.8b |
| Infected | 48.34 ± 0.6b | 73.61 ± 0.5a | 138.23 ± 0.8a | 127.27 ± 0.9a | 149.6 ± 1.0a | 150.7 ± 1.2a | 153.73 ± 0.9a | |
| Total phenols (mg catechol/g FW) | ||||||||
| ICPL 11260 | Non-Infected | 27.48 ± 0.1c | 33.89 ± 0.3b | 37.39 ± 0.1b | 39.36 ± 0.2b | 39.59 ± 0.2b | 39.95 ± 0.2b | 42.95 ± 0.4b |
| Infected | 28.73 ± 0.1b | 33.04 ± 0.2c | 28.73 ± 0.1c | 39.05 ± 0.3b | 35.19 ± 0. 2c | 31.23 ± 0.2d | 34.23 ± 0.5d | |
| IPAC-02 | Non-Infected | 29.35 ± 0.1a | 32.48 ± 0.3d | 36.08 ± 0.2b | 34.20 ± 0.3c | 38.33 ± 0.4b | 37.17 ± 0.3c | 40.17 ± 0.3c |
| Infected | 29.35 ± 0.1a | 51.56 ± 0.2a | 45.46 ± 0.2a | 54.53 ± 0.4a | 52.84 ± 0.4a | 48.74 ± 0.3a | 51.74 ± 0.5a | |
| Total flavonoids (mg quercetin/g FW) | ||||||||
| ICPL 11260 | Non-Infected | 5.00 ± 0.01d | 5.60 ± 0.01d | 7.12 ± 0.02c | 7.71 ± 0.01d | 11.93 ± 0.2d | 13.85 ± 0.2bc | 16.85 ± 0.05bc |
| Infected | 6.76 ± 0.01c | 5.98 ± 0.02c | 5.95 ± 0.01d | 9.69 ± 0.01c | 12.52 ± 0.2c | 14.90 ± 0.2b | 17.90 ± 0.05b | |
| IPAC-02 | Non-Infected | 8.63 ± 0.01b | 6.21 ± 0.02b | 8.23 ± 0.02b | 14.68 ± 0.02b | 15.25 ± 0.2b | 12.93 ± 0.5c | 15.93 ± 0.04c |
| Infected | 10.71 ± 0.01a | 6.66 ± 0.02a | 11.56 ± 0.03a | 18.69 ± 0.03a | 26.13 ± 0.4a | 30.10 ± 0.8a | 33.10 ± 0.03a | |
3.4.2 Effect of Infection of P. cajani on Secondary Metabolites of Pigeon Pea Varieties
The results shown in Table 3 demonstrate that the levels of secondary metabolites (total phenols and total flavonoids) increased significantly with the number of days following P. cajani infection in both pigeon pea varieties. Compared with pre-infection values, the most pronounced increases in total phenols and total flavonoids were observed after 35 days of infection in both infected and non-infected plants. In both the susceptible variety (ICPL 11260) and the resistant variety (IPAC-02), infected plants exhibited significantly higher levels of total phenols and total flavonoids than their respective non-infected controls. At 35 days after infection, infected IPAC-02 recorded the highest total phenol content (51.74 mg/g FW) and total flavonoid content (33.11 mg/g FW), whereas infected ICPL 11260 showed the lowest levels of total phenols (34.23 mg/g FW) and total flavonoids (15.93 mg/g FW).
The higher accumulation of phenolic compounds in the resistant variety is consistent with the anatomical observations in the present study, which showed enhanced lignification in the roots, stems, and leaves of IPAC-02. Since phenols serve as precursors for lignin biosynthesis, their elevated levels likely contribute to the reinforcement of secondary cell wall structures surrounding infection sites. Moreover, phenolic compounds act as key signaling molecules that activate multiple defense-related pathways, including systemic acquired resistance (SAR), thereby enhancing overall resistance to P. cajani.
3.4.3 Effect of Infection of P. cajani on Pathogenesis-Related Proteins of Pigeon Pea Varieties
The data presented in Table 4 show that the levels of pathogenesis-related proteins—β-1,3-glucanases and chitinases—rose significantly with increasing days after P. cajani infection in both pigeon pea varieties. The most pronounced increases in both enzymes were observed 35 days after infection when compared with the pre-infection baseline. Across all sampling intervals, the resistant variety (IPAC-02) accumulated markedly higher amounts of β-1,3-glucanases and chitinases in infected plants than the susceptible variety (ICPL 11260). In ICPL 11260, enzyme activities in infected tissues decreased significantly relative to non-infected controls, indicating a suppressed or ineffective defense response. In contrast, infected IPAC-02 plants exhibited significant increases in both enzymes compared to their non-infected counterparts, reflecting a strong activation of defense pathways.
Quantitatively, infected IPAC-02 plants at 35 days after infection recorded the highest chitinase (11.43 U mg−1 protein) and β-1,3-glucanase (9.09 U mg−1 protein) activities. Conversely, infected ICPL 11260 plants at the same time point showed the lowest activities of both defense-related enzymes, with chitinase at 4.56 U mg−1 protein and substantially reduced β-1,3-glucanase levels. These findings highlight the more robust enzymatic defense machinery in the resistant genotype, contributing to its enhanced tolerance against P. cajani.
Table 4: Effect of P. cajani infestation on pathogenesis-related proteins (β-1,3-Glucanases and chitinases) of pigeon pea varieties.
| Pigeon Pea Varieties | Treatment | Days after Infection (DAI) | ||||||
|---|---|---|---|---|---|---|---|---|
| β-1,3-Glucanases (U. mg−1 Protein) | ||||||||
| Pre-Infection | 10 | 15 | 20 | 25 | 30 | 35 | ||
| ICPL 11260 | Non-Infected | 1.35 ± 0.01c | 2.17 ± 0.02b | 2.55 ± 0.02b | 2.78 ± 0.01b | 3.33 ± 0.02c | 3.41 ± 0.01c | 6.41 ± 0.04c |
| Infected | 1.29 ± 0.01d | 1.51 ± 0.02c | 1.07 ± 0.02c | 1.40 ± 0.01c | 1.70 ± 0.02d | 1.90 ± 0.01d | 4.90 ± 0.05d | |
| IPAC-02 | Non-Infected | 1.44 ± 0.01a | 2.06 ± 0.02b | 2.48 ± 0.02b | 3.14 ± 0.01b | 3.97 ± 0.03b | 3.90 ± 0.01b | 6.90 ± 0.05b |
| Infected | 1.40 ± 0.01b | 3.77 ± 0.02a | 5.56 ± 0.02a | 8.83 ± 0.02a | 7.23 ± 0.04a | 6.09 ± 0.02a | 9.09 ± 0.05a | |
| Chitinases (U. mg−1 protein) | ||||||||
| ICPL 11260 | Non-Infected | 3.51 ± 0.01b | 3.77 ± 0.02c | 4.00 ± 0.02c | 4.33 ± 0.01b | 4.71 ± 0.03b | 4.99 ± 0.02b | 7.99 ± 0.06b |
| Infected | 3.52 ± 0.01b | 3.24 ± 0.02d | 2.60 ± 0.03d | 1.22 ± 0.01c | 2.01 ± 0.03c | 1.56 ± 0.02c | 4.56 ± 0.06c | |
| IPAC-02 | Non-Infected | 3.37 ± 0.01c | 4.05 ± 0.03b | 4.41 ± 0.03b | 4.25 ± 0.02b | 4.81 ± 0.04b | 4.71 ± 0.03b | 7.71 ± 0.04b |
| Infected | 3.98 ± 0.01a | 7.19 ± 0.03a | 8.04 ± 0.04a | 8.64 ± 0.04a | 8.89 ± 0.01a | 8.43 ± 0.05a | 11.43 ± 0.05a | |
3.5 Two Way Anova of Biochemical Analysis
Normality of residuals was assessed using the Shapiro–Wilk test and Q–Q plots. Homogeneity of variances was verified using Levene’s test, which was satisfied for total soluble protein, sugars, phenols, and flavonoids (p > 0.05), while β-glucanase and chitinase showed heteroscedasticity (p < 0.05). Given the balanced experimental design, ANOVA was considered robust and was applied to all variables.
Factorial ANOVA revealed significant main effects on all defense-related biochemical parameters examined. Total soluble protein (F6,56 = 98.99, p < 0.001, ηp2 = 0.914), total soluble sugars (F6,56 = 7430.14, p < 0.001, ηp2 = 0.999), phenolic content (F6,56 = 178.62, p < 0.001, ηp2 = 0.950), and flavonoid content (F6,56 = 457.47, p < 0.001, ηp2 = 0.980) exhibited pronounced time-dependent responses, indicating strong modulation of primary and secondary metabolites during disease progression. Defense-related enzyme activities were significantly influenced by genotype and treatment; chitinase activity differed markedly between pigeon pea varieties (F1,56 = 198.46, p < 0.001, ηp2 = 0.780), demonstrating a strong genotype-dependent defense response, whereas β-glucanase activity was significantly affected by infection treatment (F1,56 = 203.92, p < 0.001, ηp2 = 0.785), reflecting pathogen-induced enzyme activation.
Factorial ANOVA revealed significant main effects on all defense-related biochemical parameters examined. Total soluble protein, sugars, phenols, and flavonoids exhibited pronounced time-dependent responses (p < 0.001), with large effect sizes (ηp2 ≥ 0.91). Defense-related enzyme activities were significantly influenced by genotype and treatment, with chitinase showing a strong varietal effect and β-glucanase responding significantly to infection treatment (p < 0.001).
Mean values are presented with Data were analyzed using factorial analysis of variance (ANOVA) to evaluate the effects of variety, treatment, and days after infection (DAI) on morphological and biochemical parameters. Prior to analysis, assumptions of ANOVA were assessed by examining the normality of residuals using the Shapiro–Wilk test and homogeneity of variances using Levene’s test. While some morphological and enzyme-related parameters showed deviations from normality and homoscedasticity (p < 0.05), the balanced experimental design with equal replication across treatments and time points ensured robustness of ANOVA. Effect sizes were expressed as partial eta squared (ηp2). Mean separation was performed using Tukey’s HSD test at p ≤ 0.05. Standard errors correspond to 95% confidence intervals.
Pigeon pea is one of the most important legume crops grown in subtropical and tropical regions, yet its productivity is severely constrained by a range of biotic stressors. Ensuring a sustainable food supply for an expanding global population requires mitigating the significant yield losses caused by these stresses. Among them, Phytophthora blight is recognized as one of the most destructive diseases affecting pigeon pea cultivation [21]. The present morphological analyses demonstrated that infection with Phytophthora drechsleri f. sp. cajani caused substantial reductions in key growth parameters—including root length, shoot length, number of leaves, fresh weight, and dry weight—across both pigeon pea varieties. In the susceptible genotype ICPL 11260, pathogen infection resulted in a drastic (0.5- to 2-fold) decline in all growth traits compared with non-infected controls, suggesting that the pathogen was able to establish and proliferate effectively within host tissues.
The higher dry weight observed in infected plants may be attributed to the formation of secondary structural components, increased lignification, and the synthesis of various defense-related metabolites. Conversely, the greater fresh weight recorded in non-infected IPAC-02 may reflect its superior water uptake capacity, which appears compromised in infected plants. Fungal invasion is known to disrupt normal physiological processes, as plants redirect metabolic activity towards defense, often at the expense of growth. Nevertheless, both non-infected ICPL 11260 and IPAC-02 exhibited steady, continuous growth throughout the experimental period. Overall, the results clearly indicate that Phytophthora infection leads to a marked decline in all measured growth traits.
These findings align with earlier reports. Ansari et al. [22] documented similar reductions in stem length, root length, and leaf number in tomato plants infected with Fusarium, highlighting the broader impact of fungal pathogens on vegetative development. Likewise, Yadav and Jha [21] observed significant decreases in growth parameters of pigeon pea varieties artificially inoculated with Phytophthora zoospore suspensions under favorable disease conditions. Their study reported pronounced reductions in growth traits in infected varieties—particularly Shrawani and ICPL 11260—after 30 days of infection. Minor variations in leaf number observed at 20 days post-infection in ICPL 11260 and IPAC-02 were attributed to the relatively slower progression of the pathogen toward leaf tissues. They further noted that varieties such as Shweta and ICPL 11260 exhibited partial defense responses capable of slowing pathogen advancement.
Yadav and Jha [21] emphasized that pathogen infection often reduces plant growth and reproductive capacity because maintaining defense responses is metabolically expensive. Moreover, many fungal pathogens withdraw nutrients directly from host tissues and produce non-enzymatic toxins that alter host physiology, reducing resource availability and ultimately suppressing growth in susceptible varieties.
The transverse sections of roots, stems, and leaves of healthy plants exhibited normal anatomical organization with intact epidermal layers, well-differentiated cortical tissues, and clearly defined vascular elements. In contrast, infected ICPL 11260 plants showed extensive cellular damage and tissue disruption resulting from fungal invasion. Mycelial growth was evident in the epidermal and cortical regions, accompanied by degradation and collapse of secondary structures such as phloem and xylem vessels. These disruptions became more pronounced by 30 days after infection, when mycelia had progressed from the epidermis into the vascular tissues and eventually toward the pith, ultimately leading to complete plant mortality.
Infected IPAC-02 plants, however, maintained well-organized cellular architecture, and no pathogen penetration or mycelial proliferation was observed at any stage. Prominent lignification of cell walls was detected throughout the tissues, indicating a strong and early activation of defense responses in the resistant variety. The enhanced lignification observed in roots, stems, and leaves of IPAC-02 aligns with the elevated phenolic content measured in this genotype. Phenols serve as precursors for lignin biosynthesis and act as key signaling molecules that activate multiple defense-related genes and pathways, including systemic acquired resistance (SAR). Their incorporation into secondary cell walls strengthens the tissues surrounding infection sites, effectively reducing pathogen spread. These findings are supported by earlier studies, which identify cell wall fortification through lignification as a primary determinant of host resistance [23]. Following initial pathogen penetration, resistant plants typically undergo rapid biochemical and anatomical modifications—such as lignin deposition—that reinforce the cell wall and restrict the activity of fungal enzymes [24].
Both varieties showed increased total soluble proteins and sugars following infection, but the magnitude of increase was significantly higher in IPAC-02. Osmolytes play critical roles in maintaining cellular homeostasis, stabilizing proteins, regulating osmotic balance, and supporting metabolic activity under stress. The sharp decline in protein and sugar levels in infected ICPL 11260 suggests impaired metabolic capacity, likely due to pathogen-induced cellular damage. In contrast, IPAC-02 displayed enhanced osmolyte accumulation, which may have supported its ability to maintain turgor pressure, cell wall strengthening, and active defense responses during pathogen invasion [25].
Both total phenols and flavonoids increased significantly after infection, with the highest concentrations observed at 35 days. Phenolic compounds are directly linked to lignin biosynthesis and contribute to the reinforcement of secondary walls around infection sites. The resistant variety exhibited substantially higher phenol and flavonoid levels than the susceptible variety, a pattern consistent with strong induced systemic resistance. Phenolics also function as antimicrobial agents and signaling molecules that activate defense pathways such as SAR. The strong correlation between phenol accumulation and enhanced lignification observed in IPAC-02 supports earlier findings by Zhou et al. [26] and Rathod et al. [24].
IPAC-02 showed pronounced increases in β-1,3-glucanase and chitinase activity, while ICPL 11260 showed a significant decline. PR proteins contribute to host resistance by degrading fungal cell wall components, releasing elicitor molecules, and triggering additional defense pathways. The higher PR protein activity in IPAC-02 suggests an efficient recognition of fungal infection and a rapid activation of defense cascades. Similar declines in glucanase activity in susceptible hosts have been reported in avocados infected with Phytophthora cinnamomi [27]. Likewise, pigeon pea plants infected with Fusarium wilt displayed reduced phenol, β-glucanase, and chitinase activities in susceptible lines compared to resistant lines [28].
The induction of pathogenesis-related (PR) proteins during the early stages of pathogen infections is a key plant defense mechanism against invasion. When pathogens invade, the plant enzyme beta-1,3-glucanase is activated. This enzyme catalyzes the hydrolysis of the pathogen’s hyphal cell wall, leading to the release of beta-1,3-glucan oligosaccharides. These oligosaccharides act as elicitors and microbe-associated molecular patterns, which trigger the activation of signaling cascades [29,30]. This process ultimately results in the production of antimicrobial compounds, such as phytoalexins, which contribute to a range of local and systemic defense responses, helping to prevent the progression of the pathogen within the plant [21]. Chitinases are part of the glycosyl hydrolase family, which catalyze the hydrolysis of chitin glycosidic bonds. These enzymes were among the first proteins recognized for their significant role in innate immunity. They catalyze the breakdown of chitin, a component of fungal cell walls, which, upon hydrolysis, acts as a biological elicitor. This process sends signals to cell membrane receptors, triggering defense mechanisms. Additionally, the peroxidase (POD) enzyme plays a crucial role in either activating these defense mechanisms or alleviating the negative effects of oxidative stress during a pathogen attack [21].
The increased activity of beta-glucanase and chitinase in the resistant plants is due to the signaling response by the MAPK cascade during pathogen attack, which activates PR genes, resulting in the synthesis of the chitinases/β-1, 3-glucanases that cause systemic acquired resistance [31]. Total phenol contents increase in resistant varieties because, during the infection, the plant undergoes various alterations in its cellular structure and morphological level, which are ultimately induced by the response of overregulation of several phenolic compounds [32,33]. According to Hassan et al. [34], basal resistance, which is brought on by an infection’s assault, can help to explain the increase in the total phenol and flavonoid contents after infection in the resistant plants. Resistant plant cells get strengthened against pathogen attacks by collecting compounds such as flavonoids and phenolic acids when they recognize the microbe-associated molecular patterns (MAMPs) as a part of early and rapid activation of the defense mechanism, which results in the formation of chemical and physical barriers against pathogen progression [35].
The combined morphological, anatomical, and biochemical results clearly demonstrate that Phytophthora blight imposes severe constraints on the physiological processes and overall growth of pigeon pea, with far greater impact on the susceptible variety ICPL 11260 than on the resistant variety IPAC-02. By the thirty-first day post-infection, ICPL 11260 exhibited marked reductions in fresh and dry biomass, shoot and root length, and leaf number, accompanied by extensive cellular disintegration in root, stem, and leaf tissues. These structural disruptions indicate successful pathogen establishment and systemic spread within susceptible tissues. In contrast, the resistant variety IPAC-02 maintained normal tissue organization and displayed significantly stronger biochemical defense responses, including elevated levels of total soluble proteins, sugars, phenols, and flavonoids, as well as enhanced activity of defense-related enzymes such as chitinase and β-1,3-glucanase. The substantial increase in PR-protein activity in IPAC-02 reflects a more efficient activation of defense signaling pathways, likely contributing to a more robust systemic acquired resistance (SAR) response. Enhanced phenolic content and pronounced lignification further underscore the activation of structural defense mechanisms that restrict pathogen penetration and limit the spread of mycelia within vascular tissues. Collectively, these responses demonstrate the ability of IPAC-02 to mount a coordinated biochemical and anatomical defense that confers strong resistance to P. cajani. Importantly, this study presents the first integrated assessment combining morphological, anatomical, and biochemical traits to differentiate susceptible and resistant pigeon pea genotypes under P. cajani infection. The quantitative association between lignification, secondary metabolite accumulation, and PR-protein activation provides a set of reliable biological markers for identifying resistant genotypes. These findings offer valuable insights for breeding programs aimed at developing Phytophthora-resistant pigeon pea cultivars and contribute to efforts toward sustainable legume production under biotic stress.
Acknowledgement:
Funding Statement: This research work was supported and funded by the Deanship of Scientific Research, Vice Presidency for Graduate Studies and Scientific Research, King Faisal University, Saudi Arabia, grant number (KFU252909).
Author Contributions: The authors confirm contribution to the paper as follows: Conceptualization, Kirti A. Yadav, Yachana Jha, Abdelrahman R. Ahmed, Heba I. Mohamed, Haiam O. Elkatry, Ahmed Mahmoud Ismail; methodology, Kirti A. Yadav, Yachana Jha; validation, Kirti A. Yadav, Yachana Jha, Abdelrahman R. Ahmed, Heba I. Mohamed, Haiam O. Elkatry, Ahmed Mahmoud Ismail; investigation, Kirti A. Yadav, Yachana Jha; data curation, Kirti A. Yadav, Yachana Jha; writing—original draft preparation, Kirti A. Yadav, Yachana Jha, Abdelrahman R. Ahmed, Heba I. Mohamed, Haiam O. Elkatry, Ahmed Mahmoud Ismail; visualization, Kirti A. Yadav, Yachana Jha, Abdelrahman R. Ahmed, Heba I. Mohamed, Haiam O. Elkatry, Ahmed Mahmoud Ismail; writing—review and editing, Kirti A. Yadav, Yachana Jha, Abdelrahman R. Ahmed, Heba I. Mohamed, Haiam O. Elkatry, Ahmed Mahmoud Ismail; visualization, Kirti A. Yadav, Yachana Jha, Abdelrahman R. Ahmed, Heba I. Mohamed, Haiam O. Elkatry, Ahmed Mahmoud Ismail; project administration, Kirti A. Yadav, Yachana Jha, Abdelrahman R. Ahmed, Heba I. Mohamed, Haiam O. Elkatry, Ahmed Mahmoud Ismail; funding acquisition, Kirti A. Yadav, Yachana Jha, Abdelrahman R. Ahmed, Heba I. Mohamed, Haiam O. Elkatry, Ahmed Mahmoud Ismail. All authors reviewed the results and approved the final version of the manuscript.
Availability of Data and Materials: Not applicable.
Ethics Approval: Not applicable.
Conflicts of Interest: The authors declare no conflicts of interest to report regarding the present study.
Abbreviations
| DAI | days after infection |
| DMAB | p-dimethylaminobenzaldehyde |
| MAMPs | microbe-associated molecular patterns |
| MAPK | mitogen-activated protein kinase |
| POD | peroxidase |
| PPO | polyphenol oxidase |
| PAL | phenylalanine ammonia lyase |
| PR | pathogenesis-related proteins |
| SAR | systemic acquired resistance |
References
1. Jha Y , Mohamed HI . Endophytic Pseudomonas pseudoalcaligenes and arbuscular mycorrhizal fungi mediated anti-autophagy and induction of catalase and antioxidant enzymes in pigeon pea against fungal pathogen. J Plant Pathol. 2024; 106( 1): 225– 40. doi:10.1007/s42161-023-01553-4. [Google Scholar] [CrossRef]
2. Sharma M , Ghosh R , Telangre R , Rathore A , Saifulla M , Mahalinga DM , et al. Environmental influences on pigeonpea-Fusarium udum interactions and stability of genotypes to Fusarium wilt. Front Plant Sci. 2016; 7: 253. doi:10.3389/fpls.2016.00253. [Google Scholar] [CrossRef]
3. Fatokimi EO , Tanimonure VA . Analysis of the current situation and future outlooks for pigeon pea (Cajanus cajan) production in Oyo State, Nigeria: a Markov Chain model approach. J Agric Food Res. 2021; 6: 100218. doi:10.1016/j.jafr.2021.100218. [Google Scholar] [CrossRef]
4. Jha Y , Yadav KA , Mohamed HI . Plant growth-promoting bacteria and exogenous phytohormones alleviate the adverse effects of drought stress in pigeon pea plants. Plant Soil. 2024; 505( 1): 163– 83. doi:10.1007/s11104-023-06155-8. [Google Scholar] [CrossRef]
5. Dave A , Ingle S . Streptomyces sp. S-9 promotes plant growth and confers resistance in Pigeon pea (Cajanus cajan) against Fusarium wilt. 3 Biotech. 2021; 11( 11): 459. doi:10.1007/s13205-021-02989-0. [Google Scholar] [CrossRef]
6. Kumar S , Khare UK . Integrated management of diseases in pigeonpea for ensuring food security under changing climate in India. In: Integrated pest management in diverse cropping systems. Waretown, NJ, USA: Apple Academic Press; 2023. p. 293– 304. doi:10.1201/9781003304524-11. [Google Scholar] [CrossRef]
7. Pande S , Sharma M , Naga Mangla U , Ghosh R , Sundaresan G . Phytophthora blight of Pigeonpea [Cajanus cajan (L.) Millsp.]: an updating review of biology, pathogenicity and disease management. Crop Prot. 2011; 30( 8): 951– 7. doi:10.1016/j.cropro.2011.03.031. [Google Scholar] [CrossRef]
8. Sharma M , Ghosh R , Tarafdar A , Telangre R . An efficient method for zoospore production, infection and real-time quantification of Phytophthora cajani causing Phytophthora blight disease in pigeonpea under elevated atmospheric CO2. BMC Plant Biol. 2015; 15: 90. doi:10.1186/s12870-015-0470-0. [Google Scholar] [CrossRef]
9. Sharma M , Gaviyappanavar R , Tarafdar A . Evaluation of fungicides and fungicide application methods to manage Phytophthora blight of pigeonpea. Agriculture. 2023; 13( 3): 633. doi:10.3390/agriculture13030633. [Google Scholar] [CrossRef]
10. Jadesha G , Sharma M , Reddy N . Unravelling role of edaphic stress on development of Phytophthora blight (Phytophthora cajani) in pigeonpea. Int J Curr Microbiol App Sci. 2019; 8( 12): 1336– 45. doi:10.20546/ijcmas.2019.812.162. [Google Scholar] [CrossRef]
11. Rizal S , Saha P , Mondal P , Mondol MSA , Datta J , Ahmadi T , et al. Physio-Biochemical changes in lentil genotypes under biotic stress induced by Stemphylium botryosum Wallr. BMC Plant Biol. 2025; 25( 1): 514. doi:10.1186/s12870-025-06508-8. [Google Scholar] [CrossRef]
12. Barros J , Serk H , Granlund I , Pesquet E . The cell biology of lignification in higher plants. Ann Bot. 2015; 115( 7): 1053– 74. doi:10.1093/aob/mcv046. [Google Scholar] [CrossRef]
13. Abd El-Rahman SS , Mohamed HI . Application of benzothiadiazole and Trichoderma harzianum to control faba bean chocolate spot disease and their effect on some physiological and biochemical traits. Acta Physiol Plant. 2014; 36( 2): 343– 54. doi:10.1007/s11738-013-1416-5. [Google Scholar] [CrossRef]
14. Fernando HRP , Srilaong V , Pongprasert N , Boonyaritthongchai P , Jitareerat P . Changes in antioxidant properties and chemical composition during ripening in banana variety ‘Hom Thong’ (Aaa group) and ‘Khai’ (Aa group). Inter Food Res J. 2014; 21( 2): 749– 54. [Google Scholar]
15. Lowry OH , Rosebrough NJ , Farr AL , Randall RJ . Protein measurement with the Folin phenol reagent. J Biol Chem. 1951; 193: 265– 75. doi:10.1016/S0021-9258(19)52451-6. [Google Scholar] [CrossRef]
16. Khatiwora E , Adsul VB , Kulkarni MM , Deshpande NR , Kashalkar RV . Spectroscopic determination of total phenol and flavonoid contents of Ipomoea carnea. Inter J Chem Tech Res. 2010; 2( 3): 1698– 701. [Google Scholar]
17. El-Haci IA , Bekkara FA , Mazari W , Hassani F , Didi MA . Screening of biological activities of Polygonum maritimum L. from Algerian coast. Asian Pacific J Trop Biomed. 2013; 3( 8): 611– 6. doi:10.1016/S2221-1691(13)60124-0. [Google Scholar] [CrossRef]
18. Pan SQ , Ye XS , Kuć J . Association of β-1, 3-glucanase activity and isoform pattern with systemic resistance to blue mould in tobacco induced by stem injection with Peronospora tabacina or leaf inoculation with tobacco mosaic virus. Physiol Mol Plant Pathol. 1991; 39( 1): 25– 39. doi:10.1016/0885-5765(91)90029-H. [Google Scholar] [CrossRef]
19. Boller T , Mauch F . Colorimetric assay for chitinase. Methods Enzymol. 1988; 161: 430– 5. doi:10.1016/0076-6879(88)61052-4. [Google Scholar] [CrossRef]
20. Reissig JL , Strominger JL , Leloir LF . A modified colorimetric method for the estimation of N-acetylamino sugars. J Biol Chem. 1955; 217( 2): 959– 66. doi:10.1016/S0021-9258(18)65959-9. [Google Scholar] [CrossRef]
21. Yadav KA , Jha Y . Comparative study of induction of pathogenesis related proteins in pigeon pea varieties against Phytophthora drechsleri f. sp. cajani infection. Microb Biosyst. 2025; 10( 3): 59– 66. doi:10.21608/mb.2025.311869.1146. [Google Scholar] [CrossRef]
22. Ansari WA , Krishna R , Kashyap SP , Al-Anazi KM , Abul Farah M , Jaiswal DK , et al. Relevance of plant growth-promoting bacteria in reducing the severity of tomato wilt caused by Fusarium oxysporum f. sp. lycopersici by altering metabolites and related genes. Front Microbiol. 2025; 15: 1534761. doi:10.3389/fmicb.2024.1534761. [Google Scholar] [CrossRef]
23. Quiroz-Figueroa FR , Cruz-Mendívil A , Ibarra-Laclette E , García-Pérez LM , Gomez-Peraza RL , Hanako-Rosas G , et al. Cell wall-related genes and lignin accumulation contribute to the root resistance in different maize (Zea mays L.) genotypes to Fusarium verticillioides (Sacc.) Nirenberg infection. Front Plant Sci. 2023; 14: 1195794. doi:10.3389/fpls.2023.1195794. [Google Scholar] [CrossRef]
24. Rathod PJ , Vakharia DN , Vala AG . Histo-pathological study in chickpea (Cicer arietinum L) plant parts infected with Fusarium oxysporum f.sp ciceri. Int J Curr Microbiol App Sci. 2020; 9( 6): 1894– 905. doi:10.20546/ijcmas.2020.906.235. [Google Scholar] [CrossRef]
25. Buanafina MM , Morris P . The impact of cell wall feruloylation on plant growth, responses to environmental stress, plant pathogens and cell wall degradability. Agronomy. 2022; 12( 8): 1847. doi:10.3390/agronomy12081847. [Google Scholar] [CrossRef]
26. Zhou A , Zhou H , Peng R , Liu D , Wu J , Deng J , et al. Melatonin-induced Bacillus tequilensis enhanced the disease resistance of Camellia oleifera against anthracnose by modulating cell wall and phenylpropanoid metabolism. Front Plant Sci. 2025; 16: 1593369. doi:10.3389/fpls.2025.1593369. [Google Scholar] [CrossRef]
27. van den Berg N , Christie JB , Aveling TAS , Engelbrecht J . Callose and β-1,3-glucanase inhibit Phytophthora cinnamomi in a resistant avocado rootstock. Plant Pathol. 2018; 67( 5): 1150– 60. doi:10.1111/ppa.12819. [Google Scholar] [CrossRef]
28. Shinde SB , Naik RM , Mohite SG , Dalvi US , Chimote VP , Kute NS . Biochemical and molecular evaluation of pigeonpea against Fusarium wilt. Indian Phytopathol. 2022; 75( 1): 37– 45. doi:10.1007/s42360-021-00449-6. [Google Scholar] [CrossRef]
29. Zribi I , Ghorbel M , Brini F . Pathogenesis related proteins (PRs): From cellular mechanisms to plant defense. Curr Protein Pept Sci. 2021; 22( 5): 396– 412. doi:10.2174/1389203721999201231212736. [Google Scholar] [CrossRef]
30. Sun G , Xiao Y , Yin H , Yu K , Wang Y , Wang Y . Oligosaccharide elicitors in plant immunity: Molecular mechanisms and disease resistance strategies. Plant Commun. 2025; 6( 12): 101469. doi:10.1016/j.xplc.2025.101469. [Google Scholar] [CrossRef]
31. Nafisa , Shoaib A , Iqbal J , Khan KA . Evaluation of phenotypic, physiological and biochemical attributes connected with resistance in tomato against Alternaria solani. Acta Physiol Plant. 2020; 42( 5): 88. doi:10.1007/s11738-020-03076-2. [Google Scholar] [CrossRef]
32. Mikulic-Petkovsek M , Schmitzer V , Stampar F , Veberic R , Koron D . Changes in phenolic content induced by infection with Didymella applanata and Leptosphaeria coniothyrium, the causal agents of raspberry spur and cane blight. Plant Pathol. 2014; 63( 1): 185– 92. doi:10.1111/ppa.12081. [Google Scholar] [CrossRef]
33. Mohapatra C , Chand R , Navathe S , Sharma S . Histo-chemical and biochemical analysis reveals association of Er1 mediated powdery mildew resistance and redox balance in pea. Plant Physiol Biochem. 2016; 106: 54– 63. doi:10.1016/j.plaphy.2016.04.035. [Google Scholar] [CrossRef]
34. Hassan O , Chang T , Hossain A . Changes in the secondary compounds of persimmon leaves as a defense against circular leaf spot caused by Plurivorosphaerella nawae. PLoS One. 2020; 15( 3): e0230286. doi:10.1371/journal.pone.0230286. [Google Scholar] [CrossRef]
35. Garcés-Fiallos FR , de Quadros FM , Ferreira C , de Borba MC , Bouzon ZL , Barcelos-Oliveira JL , et al. Changes in xylem morphology and activity of defense-related enzymes are associated with bean resistance during Fusarium oxysporum colonization. Protoplasma. 2022; 259( 3): 717– 29. doi:10.1007/s00709-021-01691-5. [Google Scholar] [CrossRef]
Cite This Article
 Copyright © 2026 The Author(s). Published by Tech Science Press.
This work is licensed under a Creative Commons Attribution 4.0 International License , which permits unrestricted use, distribution, and reproduction in any medium, provided the original work is properly cited.
 Downloads
 Citation Tools