
 Submit a Paper
 Propose a Special lssue
 Open Access
ARTICLE

YOLO-SPDNet: Multi-Scale Sequence and Attention-Based Tomato Leaf Disease Detection Model
1 College of Computer and Information Engineering, Tianjin Agricultural University, Tianjin, 300392, China
2 College of Engineering and Technology, Tianjin Agricultural University, Tianjin, 300392, China
* Corresponding Authors: Hang Zhang. Email: ; Tonghai Liu. Email:
(This article belongs to the Special Issue: Plant Protection and Pest Management)
Phyton-International Journal of Experimental Botany 2026, 95(1), 17 https://doi.org/10.32604/phyton.2025.075541
Received 03 November 2025; Accepted 18 December 2025; Issue published 30 January 2026
 View Full Text
 Download PDF
Abstract
Tomato is a major economic crop worldwide, and diseases on tomato leaves can significantly reduce both yield and quality. Traditional manual inspection is inefficient and highly subjective, making it difficult to meet the requirements of early disease identification in complex natural environments. To address this issue, this study proposes an improved YOLO11-based model, YOLO-SPDNet (Scale Sequence Fusion, Position-Channel Attention, and Dual Enhancement Network). The model integrates the SEAM (Self-Ensembling Attention Mechanism) semantic enhancement module, the MLCA (Mixed Local Channel Attention) lightweight attention mechanism, and the SPA (Scale-Position-Detail Awareness) module composed of SSFF (Scale Sequence Feature Fusion), TFE (Triple Feature Encoding), and CPAM (Channel and Position Attention Mechanism). These enhancements strengthen fine-grained lesion detection while maintaining model lightweightness. Experimental results show that YOLO-SPDNet achieves an accuracy of 91.8%, a recall of 86.5%, and an mAP@0.5 of 90.6% on the test set, with a computational complexity of 12.5 GFLOPs. Furthermore, the model reaches a real-time inference speed of 987 FPS, making it suitable for deployment on mobile agricultural terminals and online monitoring systems. Comparative analysis and ablation studies further validate the reliability and practical applicability of the proposed model in complex natural scenes.Keywords
Tomato, as an important global economic crop, occupies a pivotal position in modern agriculture in terms of both cultivation area and production value. However, tomato leaves are susceptible to various pathogens and viruses, such as late blight, leaf mold, and Tomato Yellow Leaf Curl Virus, leading to significant yield reduction and quality deterioration. Global crop losses due to pests and diseases can reach 10–25% of total production [1]. Traditional manual inspection methods commonly used for disease detection, however, have limitations including high labor costs, reliance on experience, slow detection speed, and susceptibility to environmental interference. With the rapid development of computer vision and deep learning technologies, convolutional neural networks (CNNs) and single-stage object detection frameworks (such as the YOLO series) have achieved significant breakthroughs in plant disease recognition. Many studies report classification accuracies exceeding 95% on controlled datasets (e.g., Plant Village) [2], and the use of lightweight networks and attention mechanisms has further promoted practical deployment, achieving recognition rates over 98% on mobile platforms. Nevertheless, in complex field environments—such as occlusions, variable lighting, and small lesion targets—the generalization ability of these methods remains limited. Real-world datasets often contain overlapping leaves, low contrast, and localized lesions, which lead to reduced detection accuracy and increased misclassification rates [1].
Meanwhile, early-stage identification of tomato leaf diseases is particularly important. Early blight, Groundnut Bud Necrosis Virus, and powdery mildew are common tomato leaf diseases, and with the continuous expansion of tomato cultivation, disease management faces increasingly severe challenges. Among them, Early Blight is one of the common foliar fungal diseases, characterized mainly by concentric ring-shaped leaf spots and chlorosis-induced defoliation. It is especially prevalent in warm and humid environments, causing severe lower leaf drop and significantly reducing yield, with losses reaching 35–78% [3]. Tomato Groundnut Bud Necrosis Virus, transmitted by thrips, often induces plant dwarfing, tip necrosis, ring-shaped leaf spots, and chlorotic necrotic lesions upon infection, sometimes leading to the death of the entire plant. Additionally, Powdery Mildew forms white powdery mycelia on the lower leaf surface under high humidity, reducing photosynthetic capacity; although not lethal, it can decrease yield by approximately 40% [3]. These three diseases often coexist within the same field, with symptoms that are similar and easily confused—for example, lesion morphology closely resembles that of Early Blight—thereby increasing the risk of misdiagnosis during manual inspection. Traditional disease monitoring, relying on human observation, is limited by experience and environmental factors, highlighting the urgent need for automated and intelligent identification methods for early diagnosis and intervention.
In recent years, international researchers have extensively focused on the application of deep learning technologies in the identification of diseases in tomato leaves, rice, and other crops, with the integration of multiple advanced models (such as CNNs, Transformers, and hybrid models) emerging as a key direction for improving recognition accuracy [4]. Zhang et al. [5] proposed a lightweight YOLO-CRD architecture, achieving an average precision of 90.2% and an accuracy of 90.4% on a self-built rice disease dataset collected from fields. Trinh et al. [6], using YOLOv8n as the baseline, replaced the original BoxLoss with an α-EIoU combined loss, achieving an average precision of 89.9% on a self-built dataset of 3175 rice leaf images in Vietnamese fields, improving roughly 19% and 7% over YOLOv7 and YOLOv5, respectively. Rahman et al. [7], using YOLO11 as the baseline, introduced zero-shot strategies and adaptive anchor re-weighted loss, achieving mAP50 of 0.699 and F1 score of 0.76 on a Bangladeshi apple leaf dataset of 3600 images, representing improvements of approximately 8% and 5% over YOLOv5 and YOLOv8, respectively, while supporting real-time edge deployment. Lin et al. [8] proposed the YOLO_SE architecture, achieving an average precision of 88.42% and accuracy of 92.0% on a self-built integrated tomato disease and pest dataset. Ahmad et al. [9] systematically compared the transfer performance of VGG-16/19, ResNet, and Inception V3 on both laboratory and field tomato leaf datasets; after fine-tuning, Inception V3 achieved the highest accuracy of 99.6% on the lab dataset and 93.7% on the field dataset. Huang et al. [10] proposed the lightweight FC-SNDPN architecture, achieving an average recognition accuracy of 97.59% and a training accuracy of 99.83% on a self-built complex-field southern tomato leaf disease dataset. Wang et al. [11] proposed an improved YOLOv6 lightweight architecture based on CBAM attention and BiRepGFPN multi-scale fusion, achieving an average precision of 93.8% and accuracy of 92.9% on a self-built natural-scene tomato leaf disease dataset. Cardellicchio et al. [12] proposed a YOLOv11-based tomato phenotyping detection method that incorporates incremental learning and domain adaptation. On their self-constructed tomato phenotyping dataset, the approach improved mAP@0.5 by approximately 1.36% and F1 score by about 1.1%, while reducing inference latency by around 19 ms. Mansoor et al. [13] conducted a comprehensive review of deep learning–based recognition methods for apple leaf Alternaria disease from 2010 to 2024. Their study systematically analyzed advances in image processing, machine learning, and deep learning for plant disease identification, and summarized the strengths and limitations of different datasets, feature extraction approaches, and lightweight network architectures. This review provides valuable guidance for the design and optimization of agricultural disease detection models. Tang et al. [14], using YOLOX-S as the baseline, proposed the PLPNet method: employing Perception Adaptive Convolution (PAC) to capture multi-scale lesion features, Location Reinforced Attention Module (LRAM) to suppress soil background interference, and Spatial-Distance Feature Aggregation Network (SD-PFAN) to enhance distinctions between similar lesions; this approach achieved an average precision of 94.5% on a self-built dataset of 13,597 tomato leaf im-ages. Islam et al. [15], based on 984 images of Bangladeshi rice leaves, implemented automated detection using deep CNN models, analyzing four architectures including VGG-19, Inception-ResNet-V2, ResNet-101, and exception; among them, Inception-ResNet-V2 achieved the best recognition performance with 92.68% test ac-curacy for brown spot, blast, bacterial streak, black panicle, and healthy leaves, providing a feasible low-cost solution for automated rice leaf disease detection. Sujatha et al. [16], on a dataset of 609 citrus leaf images, compared traditional machine learning methods (RF, SGD, SVM) with deep learning approaches (Inception-v3, VGG-16/19), with VGG-16 achieving the highest classification accuracy of 89.5%, significantly outperforming traditional methods. Mukhopadhyay et al. [17] proposed a lightweight pipeline combining NSGA-II clustering, PCA dimensionality reduction, and multi-class SVM, achieving an average recognition accuracy of 83% on 312 smartphone images of early lesions, enabling online differentiation of five major diseases in black tea. Ricky et al. [18] proposed a CNN-based lightweight disease recognition method, achieving an average precision and accuracy of 92.37% on a self-built tomato leaf disease dataset.
Domestic scholars have achieved significant results in applying deep learning technologies to crop leaf disease identification, continuously innovating model architectures to improve detection accuracy and practical performance. Zhang [19] proposed a lightweight ResNet50 model combining transfer learning with CSS hybrid attention, achieving an accuracy of 97.31% on a public tomato leaf disease dataset, improving the original model by 1.88%. Song et al. [20] proposed a light-weight YOLOv8n-TA-GDC architecture, achieving mAP0.5 of 91.5% on a self-built tomato leaf disease dataset, with mAP0.5 for Tomato Mosaic Virus recognition reaching 99.5%, improving the original model’s mAP0.5 by 3.0 percentage points, reducing inference time by 31.6%, and decreasing parameters by 13.3%, with a model size of only 5.18 MB.
In practical tomato cultivation scenarios, deep learning–based leaf disease recognition has made notable progress; however, several challenges remain. First, complex and variable backgrounds (such as soil, weeds, and occlusions) interfere with feature extraction of disease regions. Second, at the early stages of infection, lesions are small and exhibit weak visual characteristics, resulting in limited detection accuracy. Third, phenotypic similarities among different diseases make differentiation difficult. Fourth, high computational cost hinders real-world deployment. To address these issues, this study proposes an improved model, YOLO-SPDNet, based on YOLO11. By integrating multi-scale sequence modeling and attention mechanisms, the model enhances the localization and classification of tomato diseases in natural environments. The main improvements are as follows:
- (1)Introducing the SEAM module to strengthen semantic representation under complex backgrounds and occlusion conditions. By incorporating multi-scale receptive fields and depthwise separable convolutions, SEAM effectively compensates for the insufficient response of conventional feature layers to local occlusions and low-contrast regions.
- (2)Employing the lightweight MLCA module to improve fine-grained perception of local textures and small lesions. By fusing local pooling and global contextual information, the module enhances feature weighting across key regions in both the channel and spatial dimensions.
- (3)Constructing the SPA module to achieve deep fusion of cross-scale semantic and spatial localization information. Through the joint modeling of SSFF, TFE, and CPAM, the model reinforces its discriminative ability for lesions of different scales.
- (4)Achieving a balance between light-weight design and accuracy. The model maintains controllable parameter size and GFLOPs, ensuring accuracy improvements without significantly increasing computational overhead.
Tomato is the primary subject of this study, cultivated in greenhouses and sourced from Tianmin Fruits and Vegetables Cooperative in Tianjin, which owns two tomato brands: “Tianmin” and “Xiao Que Deng Zhi”. The preliminary study focused on healthy leaves and three types of diseases: early blight, Groundnut Bud Necrosis Virus, and leaf mold. The main research concentrated on the germination and seedling stages of tomato growth. Experiments were conducted from September to October 2024 at Tianmin Fruits and Vegetables Cooperative in Tianjin. Images were collected within the tomato greenhouses, with the collection areas shown in Fig. 1. The primary data collected included healthy leaves and leaves affected by early blight, Groundnut Bud Necrosis Virus, and leaf mold. Images were captured using smartphones at a resolution of 3648 × 2736 pixels. Under the guidance of authoritative experts, the images were annotated using the Labelimg tool. A total of 1670 images were organized, including 440 images of early blight, 390 images of Groundnut Bud Necrosis Virus, 440 images of leaf mold, and 400 images of healthy leaves. Compared with healthy leaves, diseased leaves exhibited yellowing and lesions, which form the basis for distinguishing between healthy and diseased leaves. Most of the diseased leaf images were collected at the early stages of disease development to help farmers implement preventive treatments as early as possible. Representative images are shown in Fig. 2.
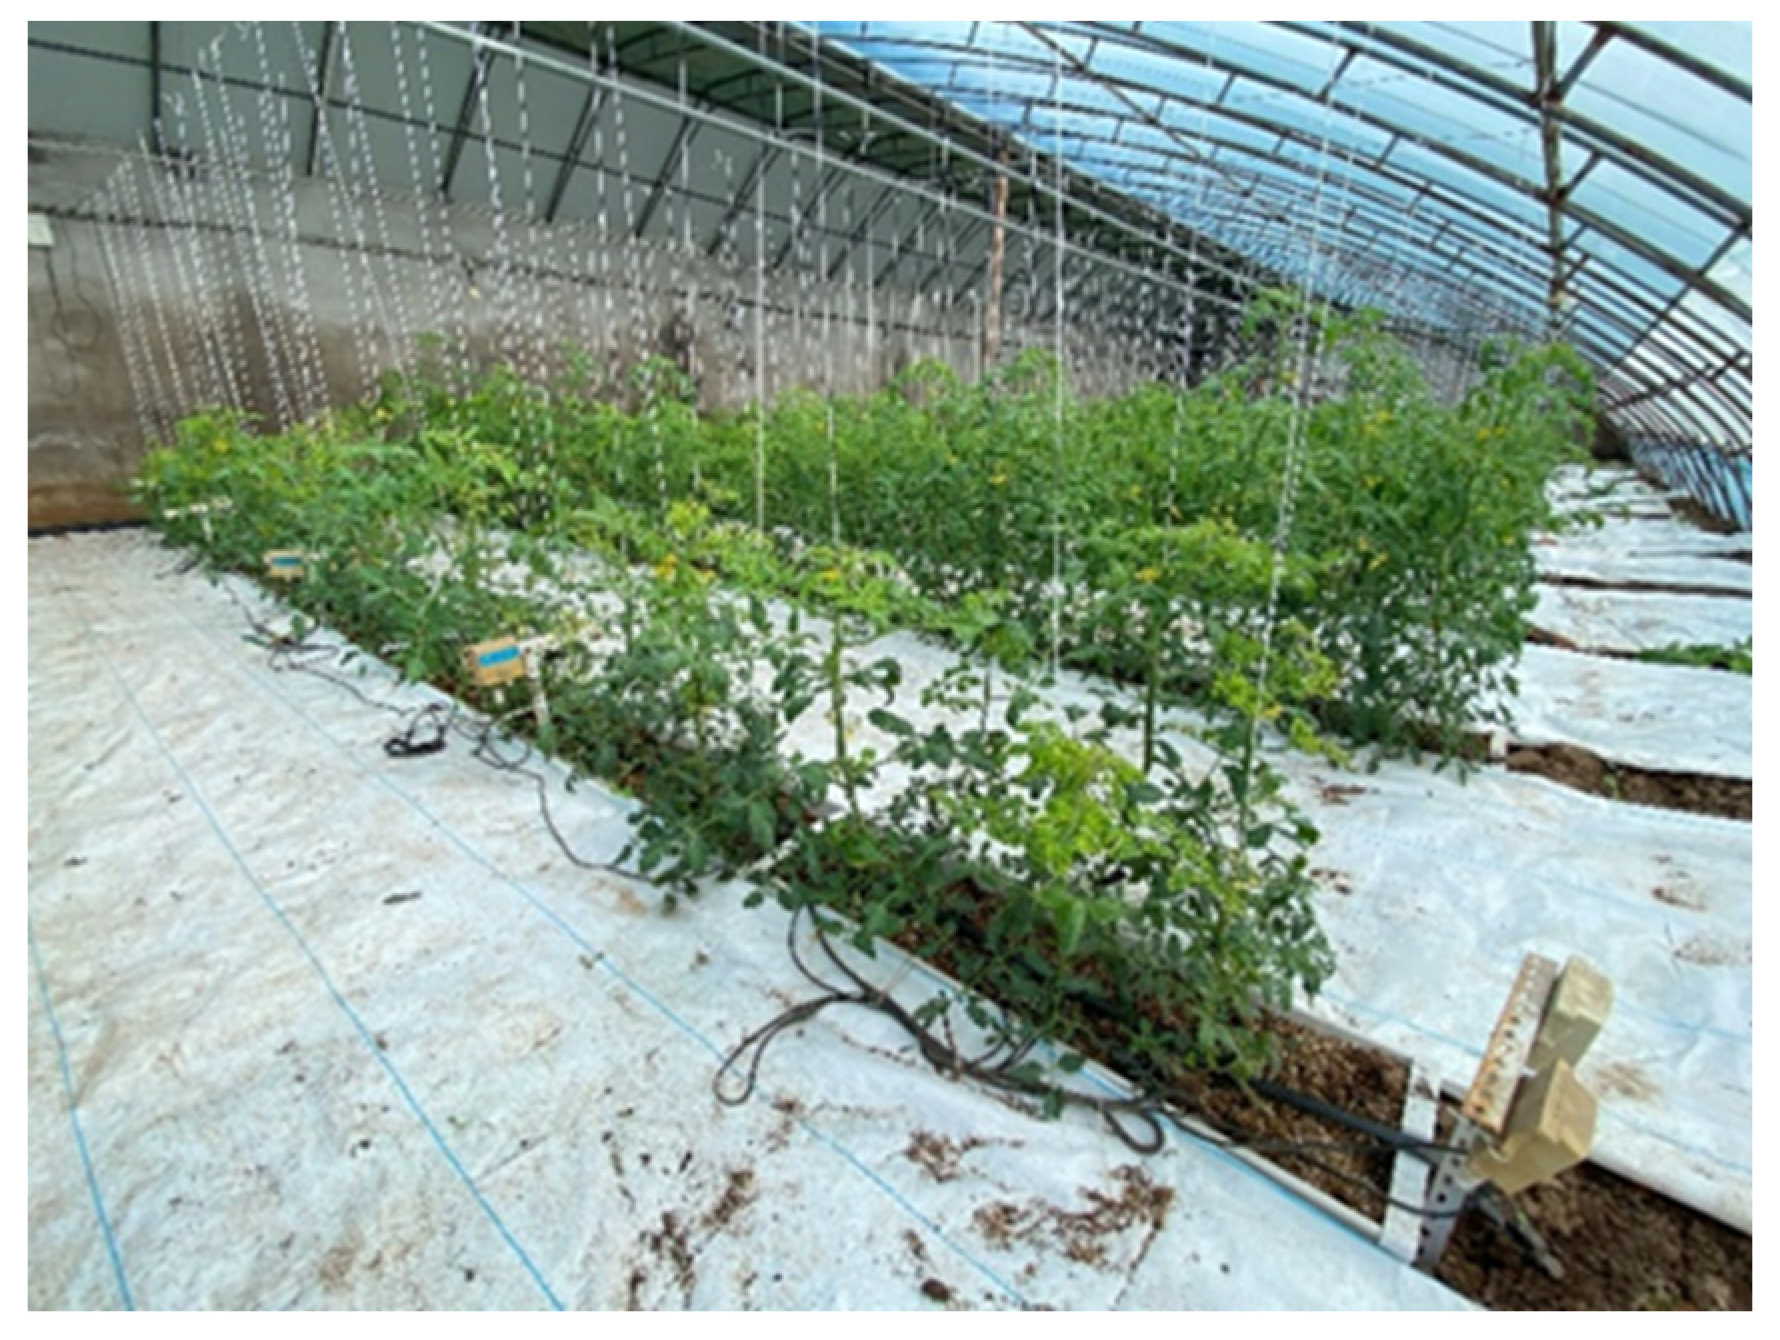
Figure 1: Greenhouse scene.
If the caption has more than one line, the text should be justify aligned on both ends. For one example, see Fig. 2 below.
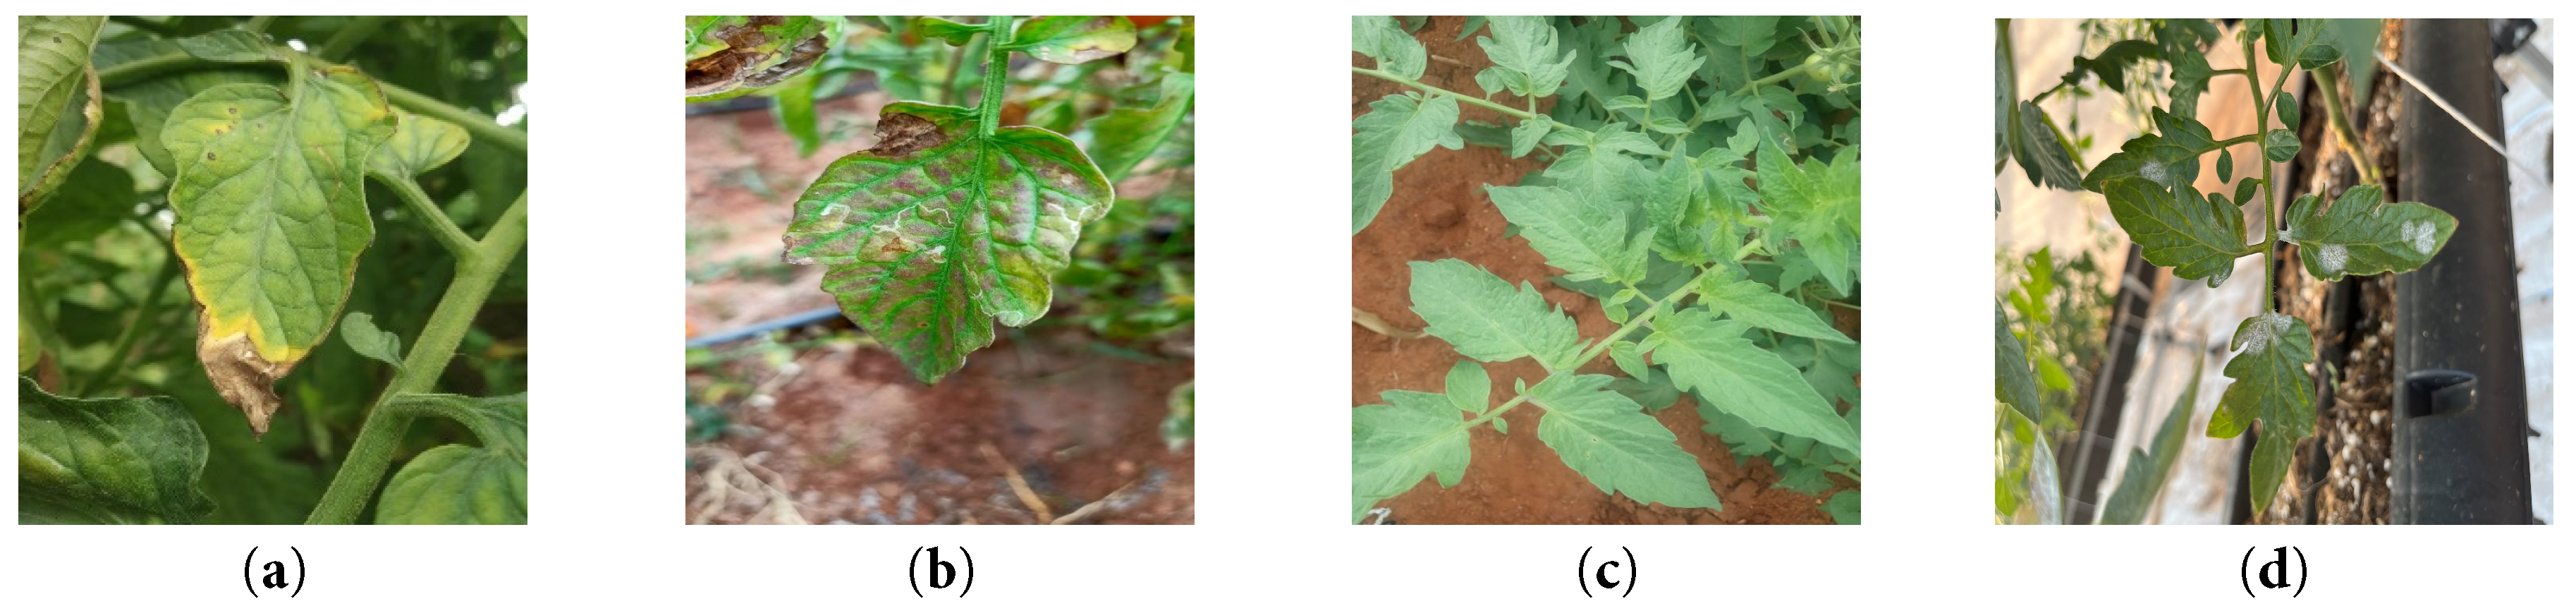
Figure 2: Examples of tomato leaf conditions: (a) Early blight, (b) Groundnut bud necrosis virus, (c) Healthy leaf, (d) Leaf mold.
To enhance training sample diversity, alleviate model overfitting, and improve generalization, the original dataset was subjected to a comprehensive preprocessing and augmentation pipeline. All images were first standardized through resizing, color space normalization, and removal of redundant background regions, ensuring uniform model inputs. During augmentation, a series of transformations—including brightness adjustment, horizontal and vertical flipping, random cropping, translation, and rotation—were applied synchronously to images and corresponding annotations. The dataset was subsequently expanded to five times its original size through randomized sampling. These procedures effectively simulate variations in imaging conditions, perspectives, and illumination, thereby enriching the feature distribution and enhancing the robustness of the model. The dataset was divided into training (train), validation (val), and testing (test) sets in a ratio of 8:1:1. The numbers of samples in the training, validation, and testing sets were 6680, 835, and 835, respectively, totaling 8350 images. The dataset division is shown in Table 1.
Table 1: Dataset split.
| Class | Train | Val | Test | Sum |
|---|---|---|---|---|
| Early blight (eb) | 1760 | 220 | 220 | 2200 |
| Groundnut Bud Necrosis Virus (gbnv) | 1560 | 195 | 195 | 1950 |
| Healthy leaf (hl) | 1600 | 200 | 200 | 2000 |
| Leaf mold (lm) | 1760 | 220 | 220 | 2200 |
| Sum | 6680 | 835 | 835 | 8350 |
The overall structure of the YOLO algorithm consists of four components: the input layer, backbone network, neck structure, and prediction layer. This architecture is integrated into the YOLO network to accurately extract bounding box features of target regions within images. In tomato disease identification tasks, YOLO first divides the input tomato disease image into N × N grid cells. If the center of a diseased region falls within a grid cell, that cell is responsible for detecting the disease target. Each grid cell predicts several bounding boxes along with their corresponding confidence scores. If a grid cell does not contain a disease target, its confidence score should be 0. Each bounding box prediction includes five parameters: x, y, w, h, and confidence, where (x, y) represents the center of the bounding box relative to the grid cell, and w and h represent the predicted width and height of the box, respectively. In addition, the network outputs class probabilities for each grid cell [21], which are used to determine the type of disease. When a grid cell overlaps with a true target region, the object probability Pr(object) is set to 1; otherwise, it is 0. Through this structure, the YOLO model can rapidly locate and accurately classify disease regions on tomato leaves. The structure of YOLO11 is shown in Fig. 3.
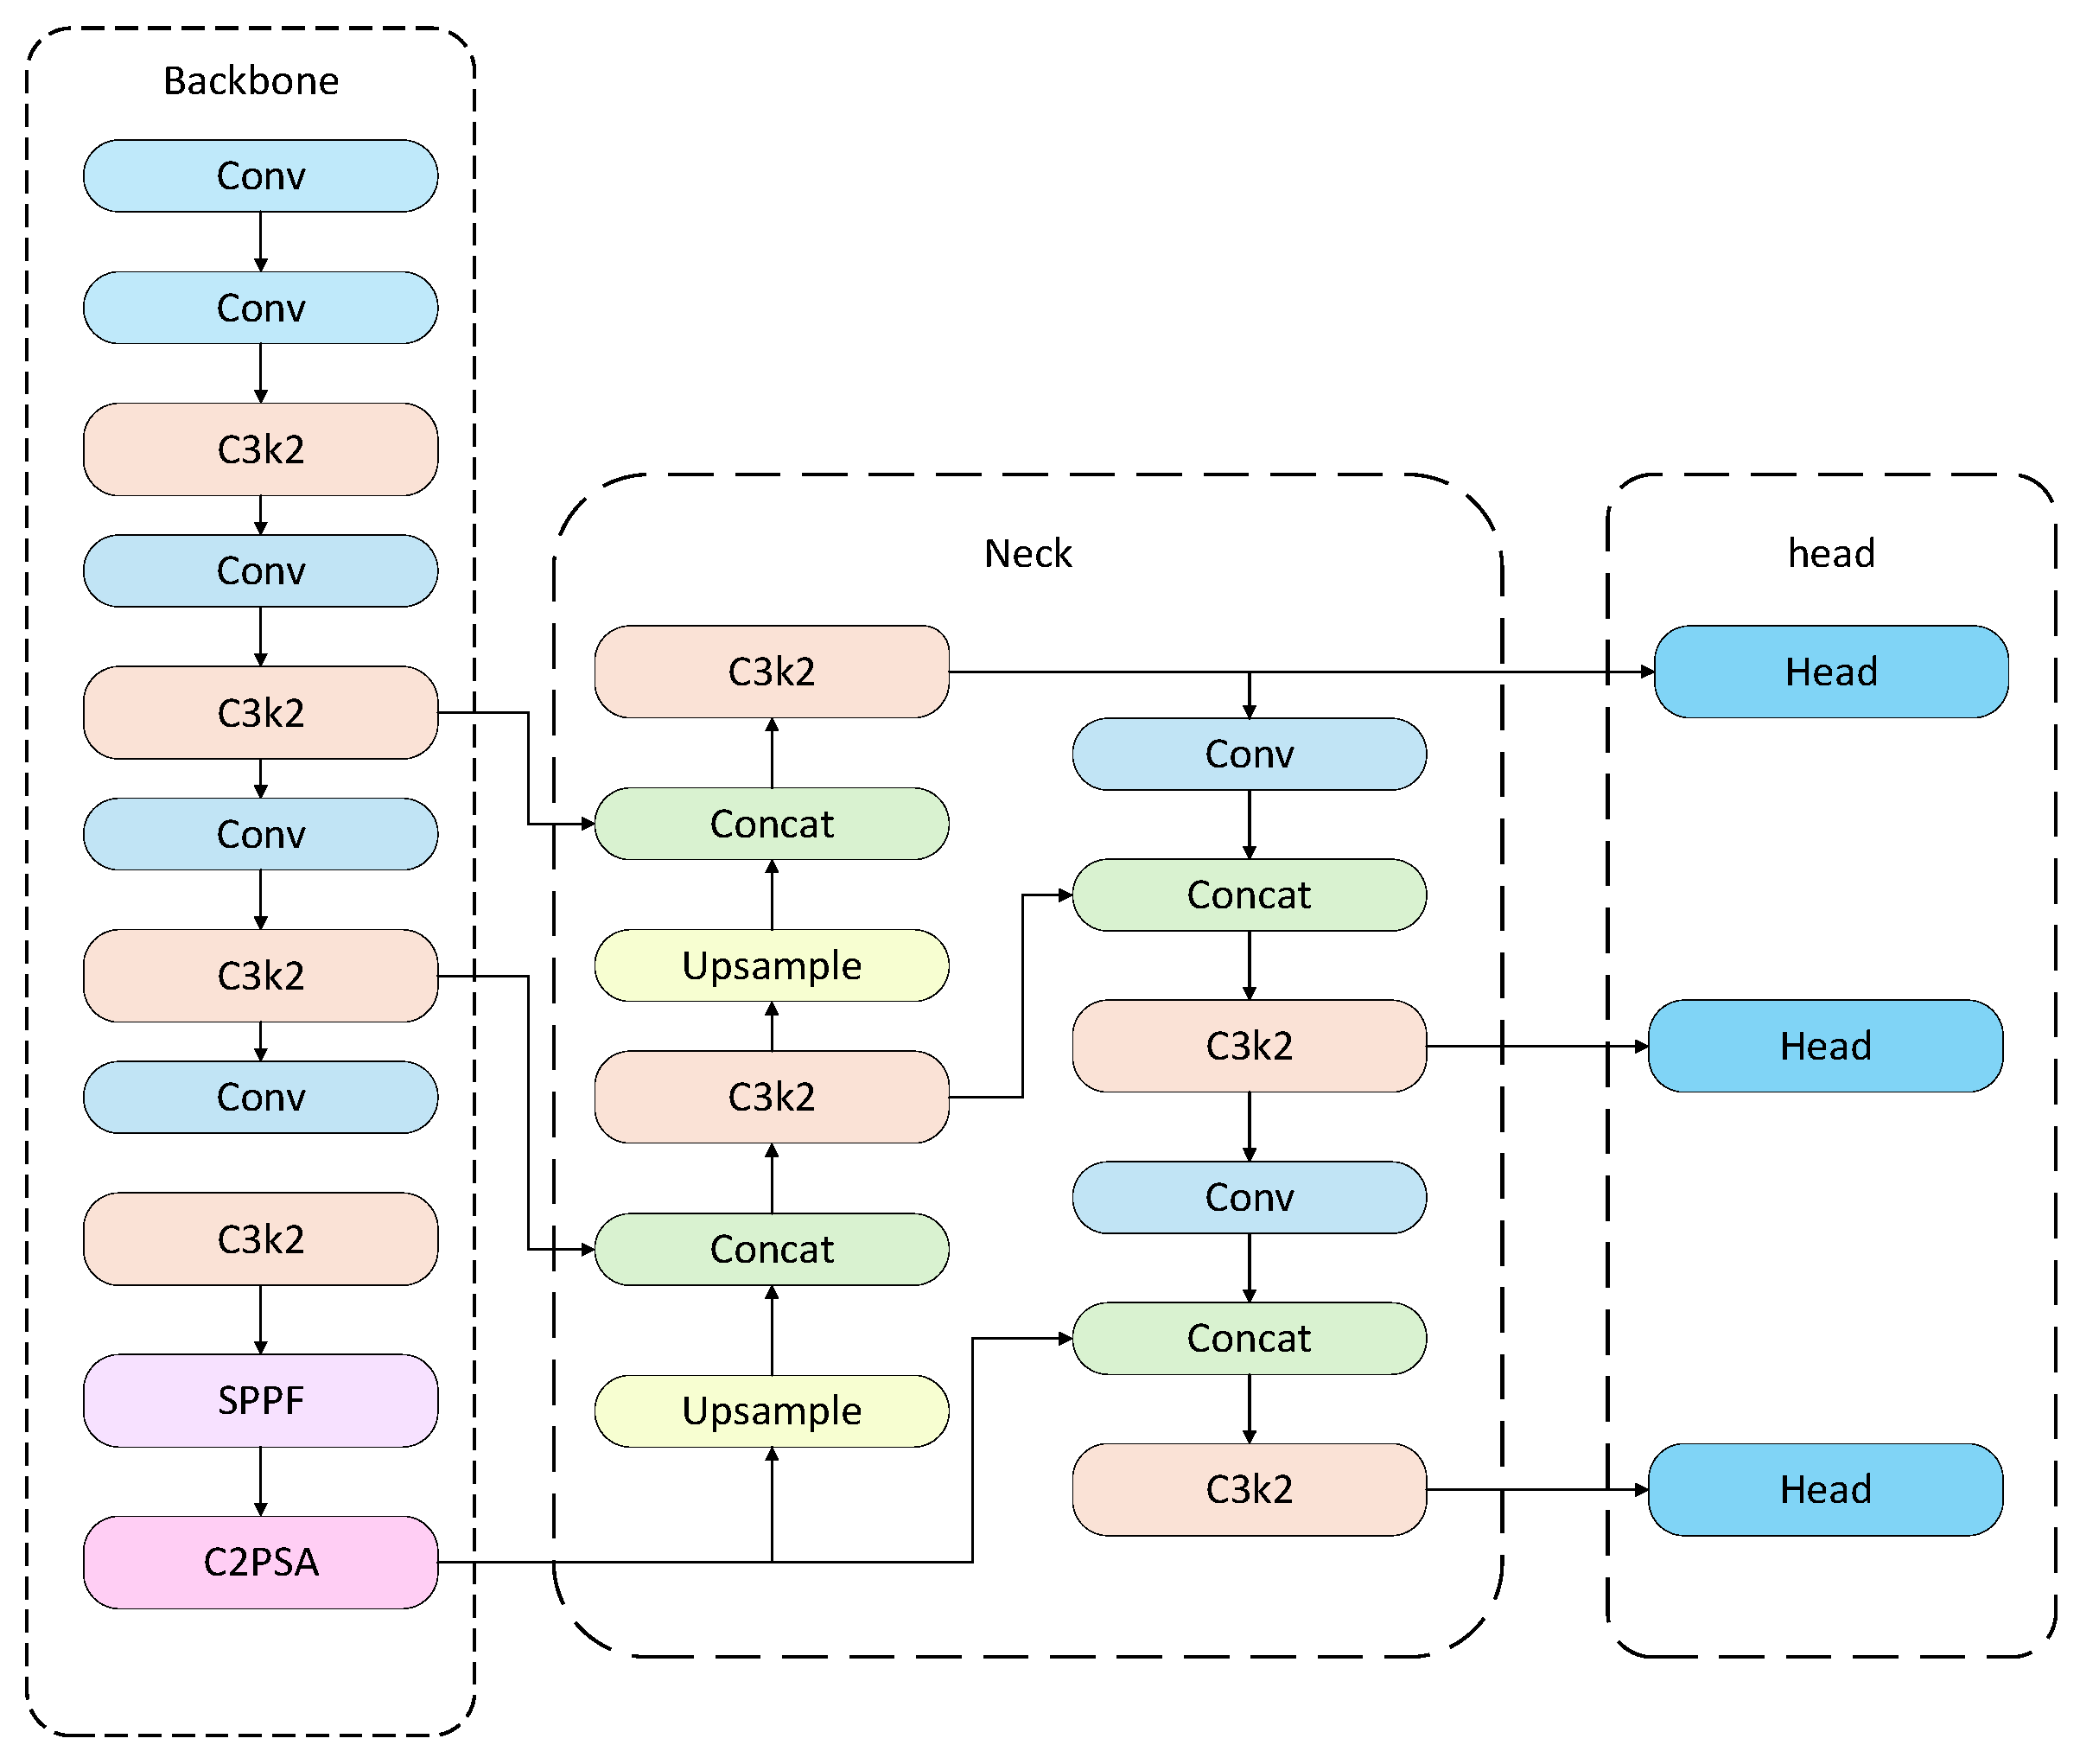
Figure 3: YOLO11 architecture.
To enhance the model’s capability in semantic feature extraction, this study introduces the SEAM [22] attention module in the final stage of the backbone. The SEAM (Spatially Enhanced Attention Module) is designed to compensate for the response loss caused by occluded lesions by strengthening the responses of unobstructed regions. The SEAM module is implemented through a combination of depth wise separable convolutions and residual connections. Depth wise separable convolutions operate channel-wise, allowing the model to learn the importance of individual channels and reduce parameter count, but they neglect inter-channel relationships. To address this limitation, outputs from different depth wise convolutions are combined using pointwise (1 × 1) convolutions. Subsequently, a two-layer fully connected network integrates information from each channel to enhance inter-channel connectivity. This design aims to learn the relationships between occluded and unobstructed regions, thereby compensating for the loss caused by occlusions.
The schematic diagram of the SEAM module is shown in Fig. 4. On the left is the overall architecture of SEAM, which includes three CSMM modules of different sizes (patch-6, patch-7, and patch-8). The outputs of these modules undergo average pooling, followed by a channel expansion operation, and are finally multiplied to provide an enhanced feature representation. On the right is the detailed structure of the CSMM module, which leverages multi-scale features through patches of different sizes and employs depth wise separable convolutions to learn correlations between spatial dimensions and channels. The module includes the following components:
- (a)Patch Embedding: Embeds the input patches.
- (b)GELU: Gaussian Error Linear Unit, an activation function.
- (c)Batch Norm: Batch normalization, used to accelerate training and improve performance.
- (d)Depth wise Convolution: Performs convolution separately on each input channel.
- (e)Pointwise Convolution: A 1 × 1 convolution used to integrate features from the depth wise convolutions.
By carefully processing both spatial dimensions and channels, this module enhances the network’s attention to and ability to capture features of occluded lesions. By comprehensively leveraging multi-scale features and depthwise separable convolutions, CSMM improves feature extraction accuracy while maintaining computational efficiency. This is particularly important for tomato leaf disease identification in complex environments, where lesion size, shape, and degree of occlusion can vary greatly. Through the integration of SEAM and CSMM, the model’s capability to recognize tomato leaf diseases in complex scenarios is significantly enhanced.
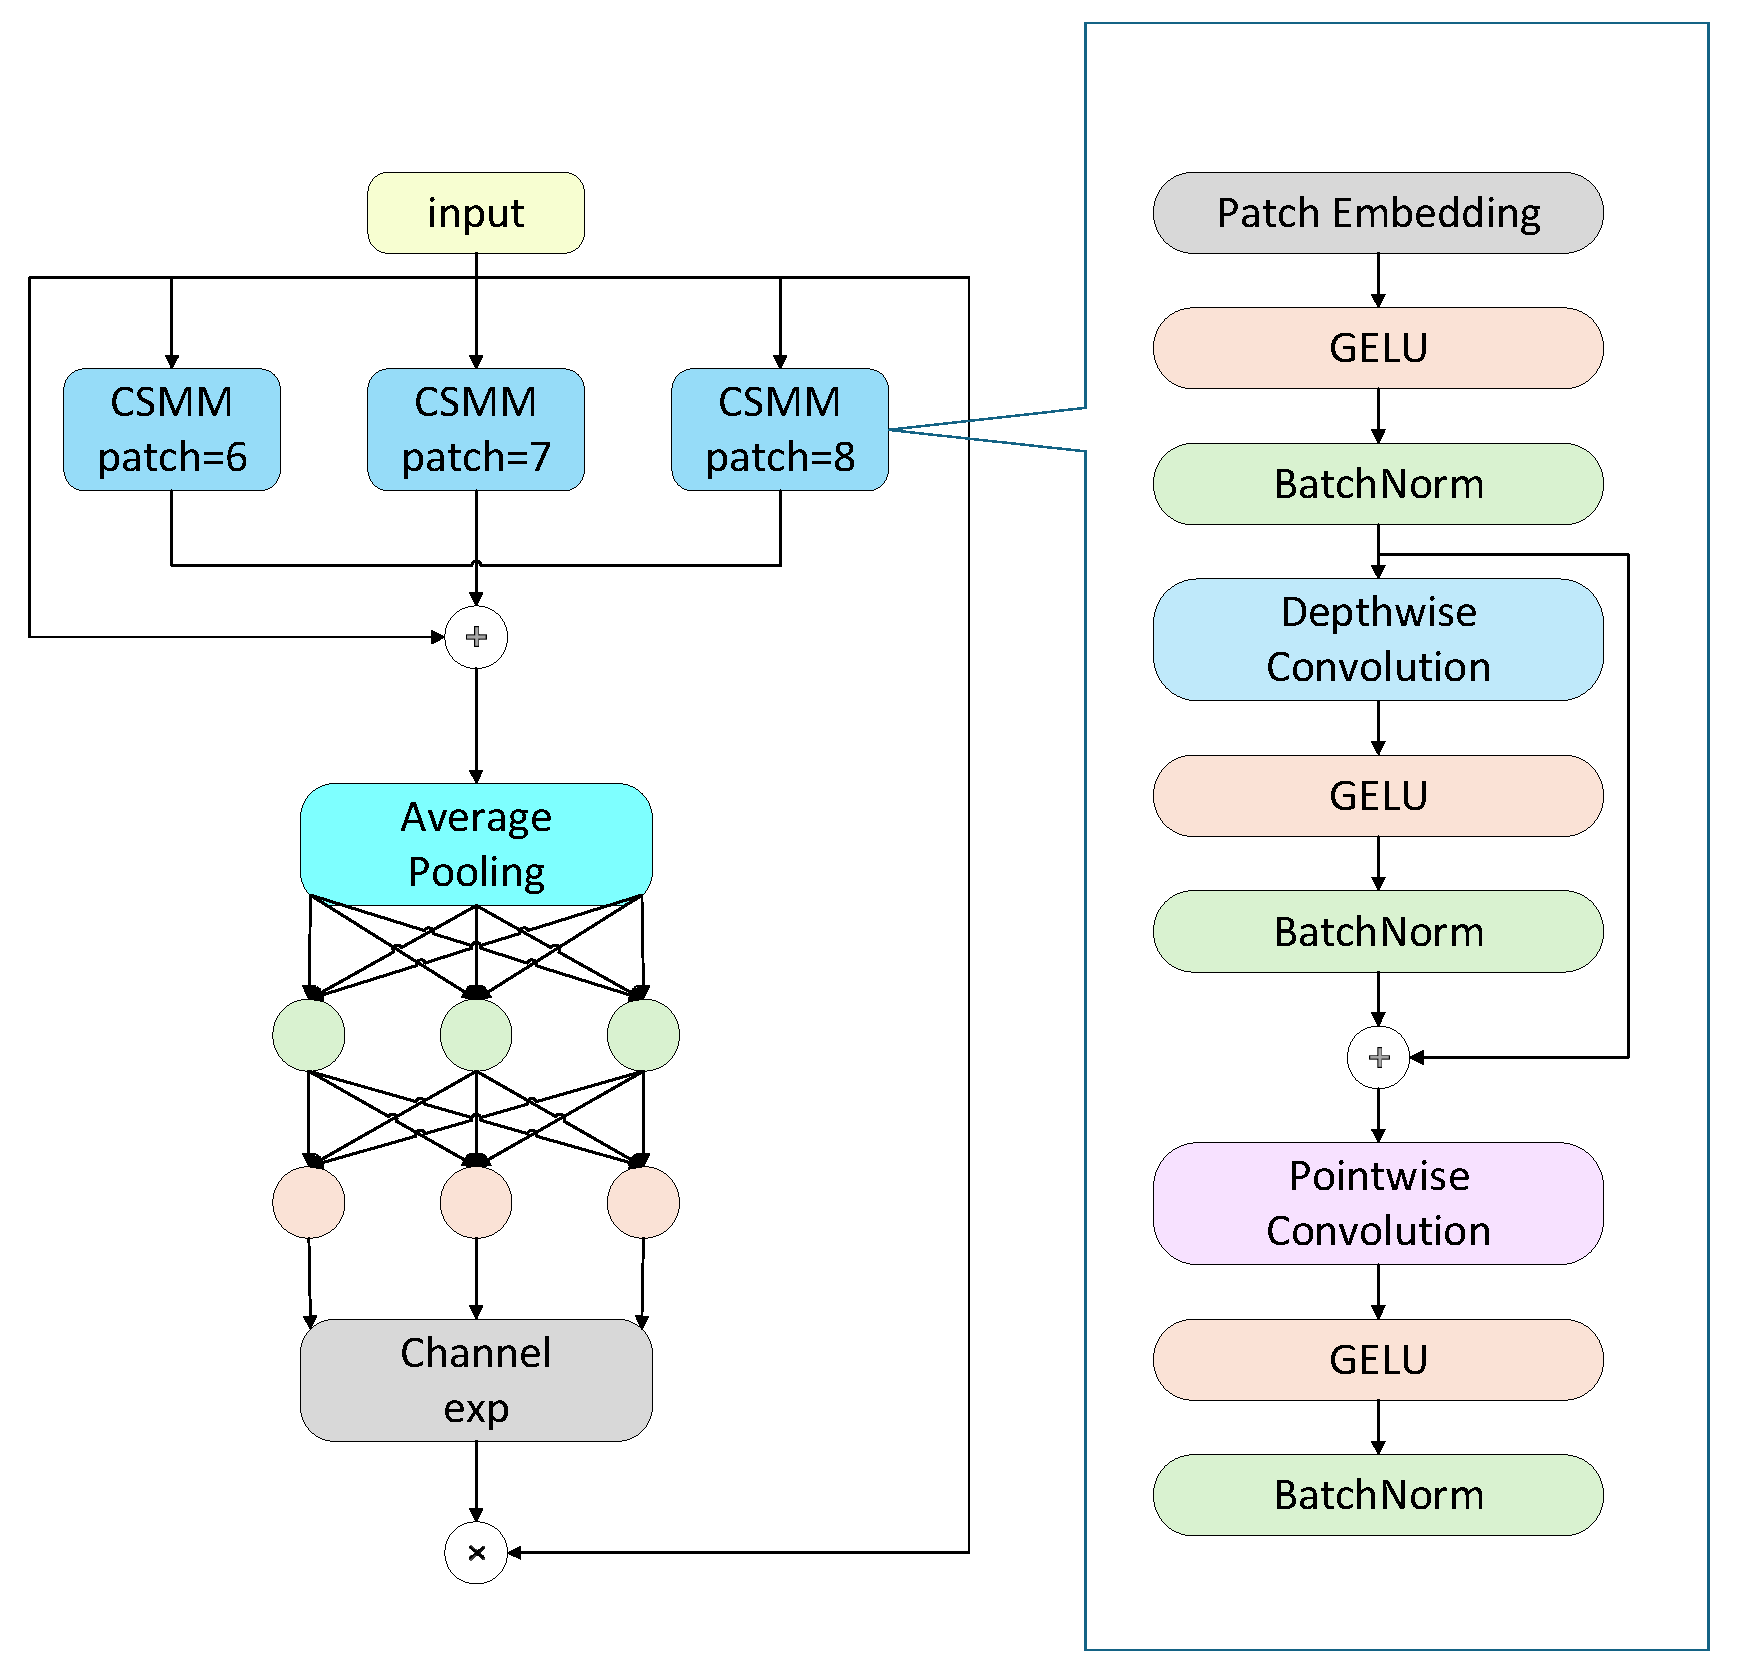
Figure 4: SEAM architecture.
To address the differing requirements of fine-grained details and semantic information in multi-scale features for object detection, this study employs a lightweight Mixed Local-Channel Attention (MLCA) [23] mechanism, which is inserted into the P3, P4, and P5 feature layers. MLCA (Mixed Local-Channel Attention) is a lightweight hybrid attention mechanism specifically designed to enhance the performance of object detection networks. It ingeniously integrates local and global features, as well as channel and spatial information, greatly improving the network’s ability to capture critical features.
Specifically, the workflow of MLCA is illustrated in Fig. 5. The input feature map (C × W × H) is subjected to both Local Average Pooling (LAP) and Global Average Pooling (GAP) to extract local region features and overall contextual information. Subsequently, the features from both pooling paths are channel-compressed via 1D convolutions while preserving the spatial structure. The processed features are then re-shaped to accommodate subsequent operations. Next, the features from the local pooling path are fused with the original input via multiplication, enhancing responses to key regions, while the features from the global pooling path are added to the local features to incorporate global semantic information. Finally, the fused feature map is restored to the original spatial dimensions through anunpooling (UNAP) operation, achieving efficient integration of local and global attention information. Fig. 5 provides a high-level schematic of MLCA, illustrating the overall processing from input to output.
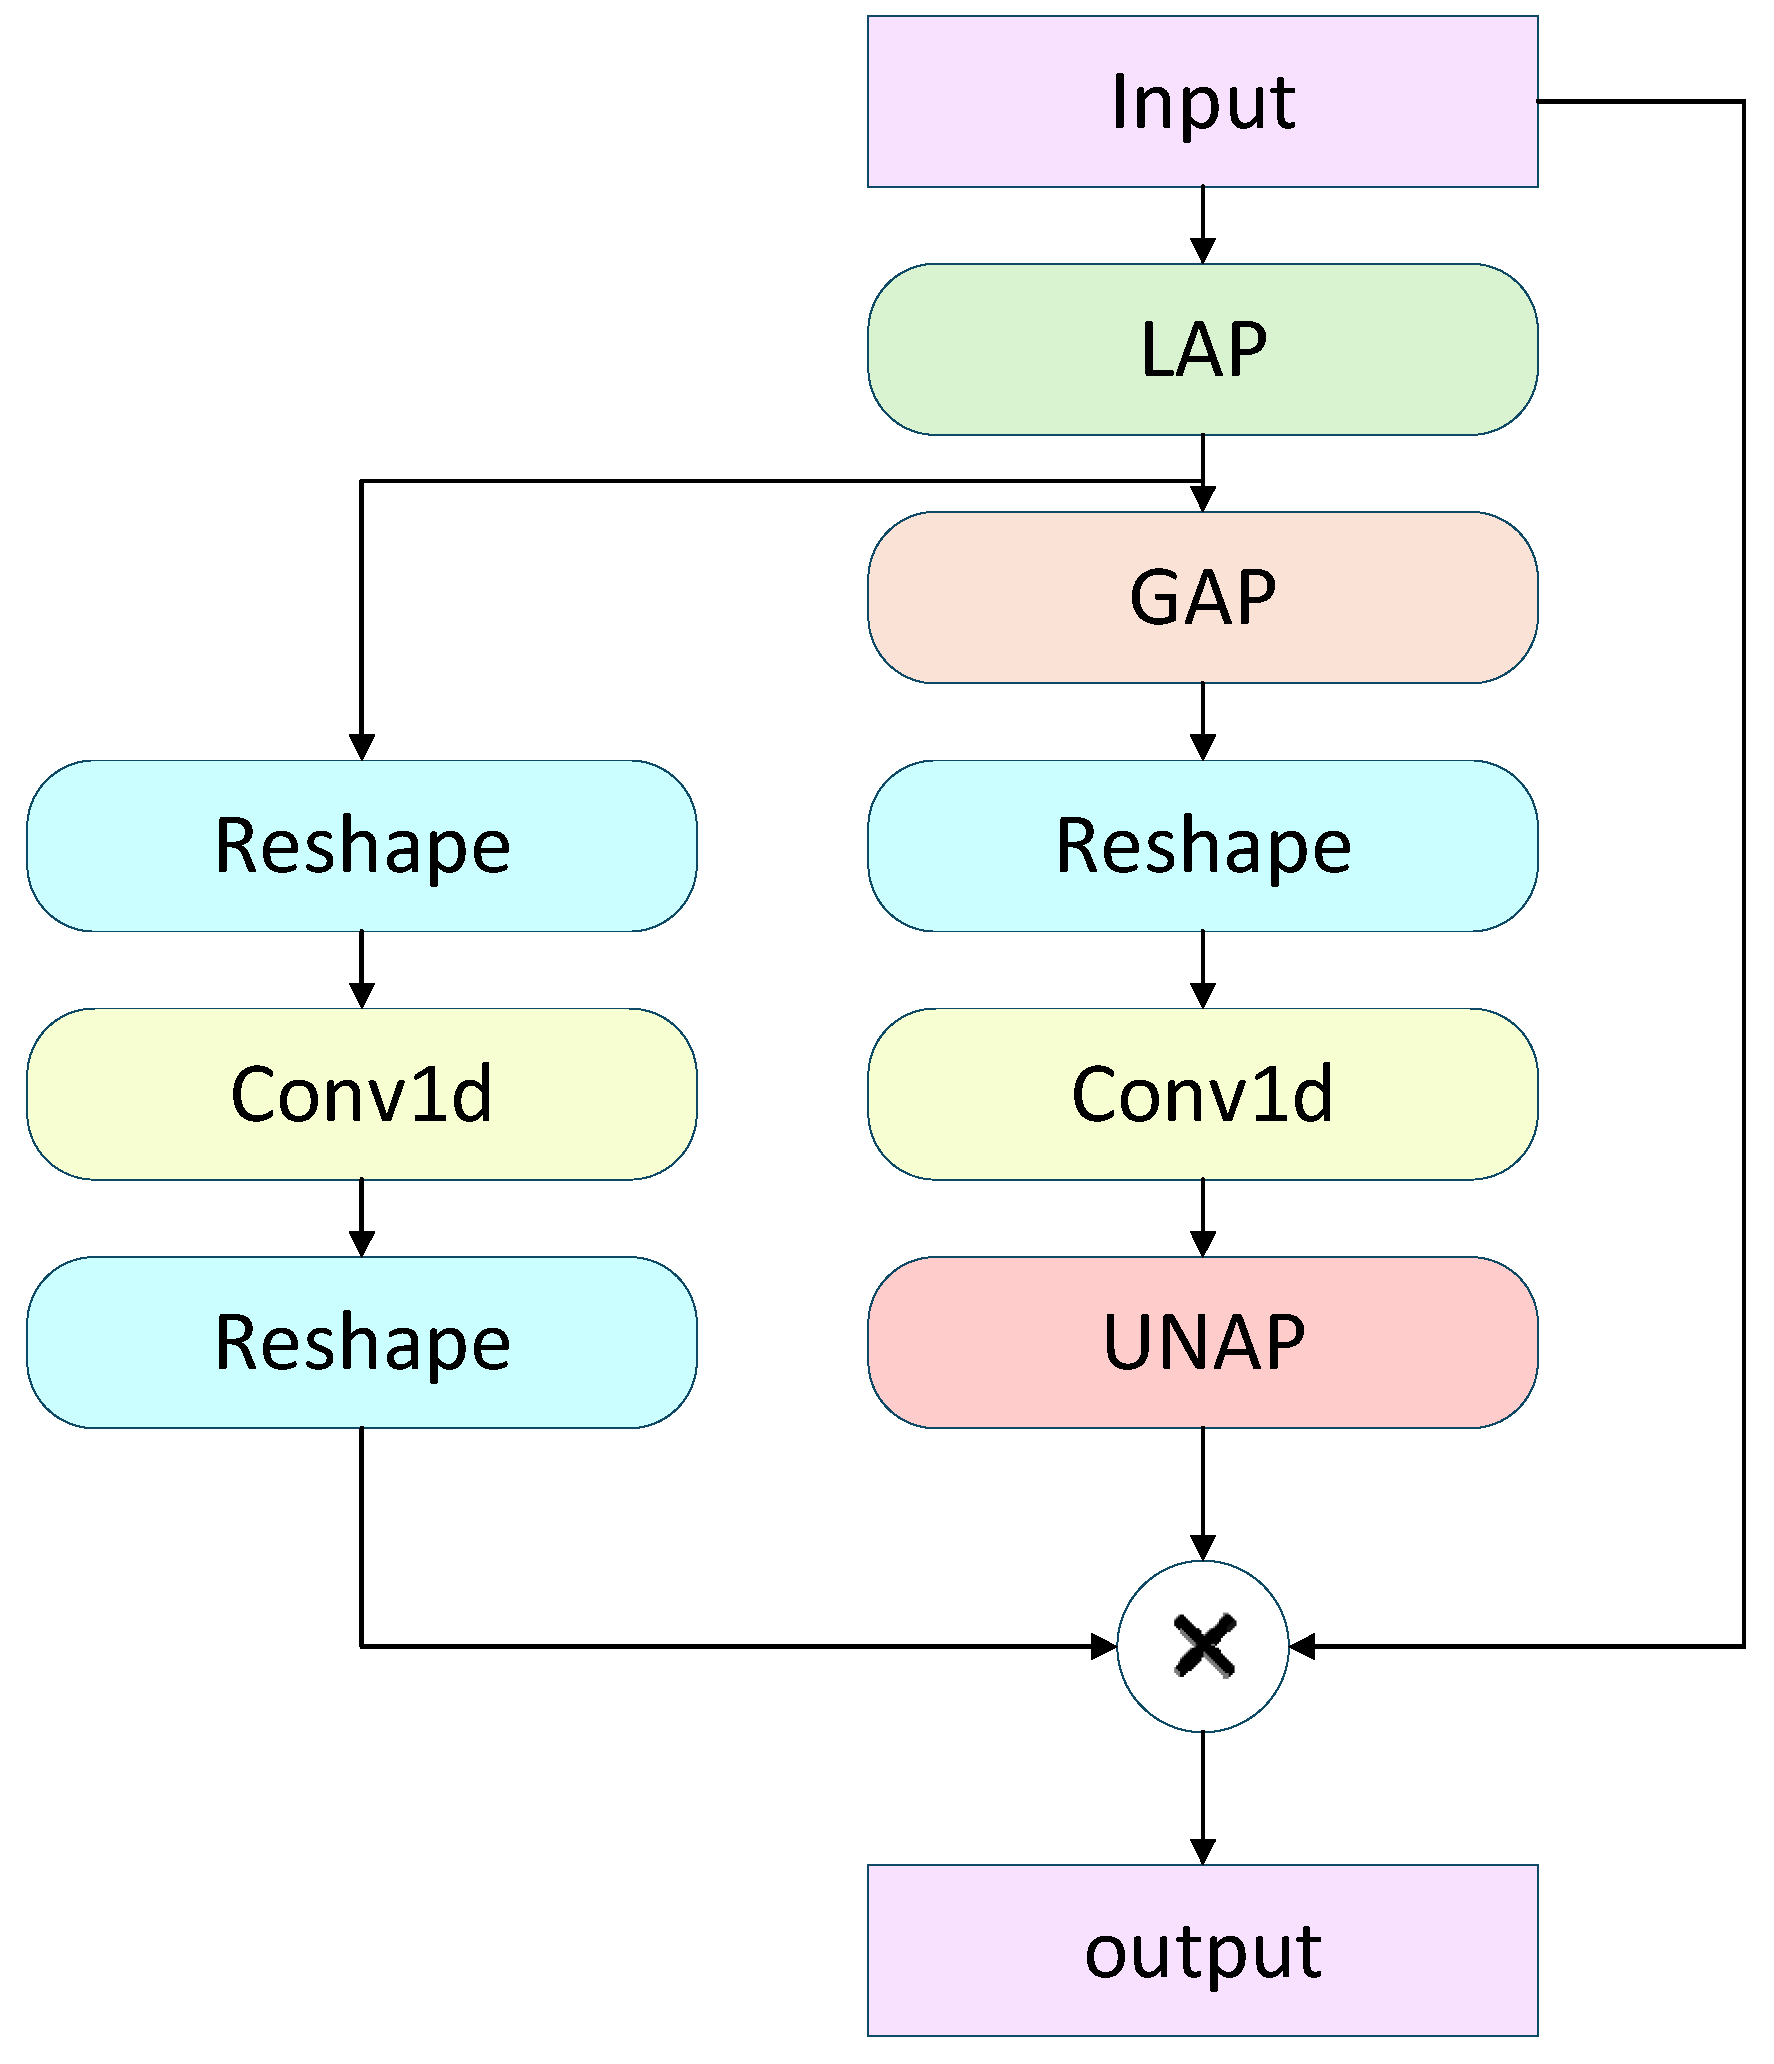
Figure 5: Workflow of the MLCA module.
To enhance the model’s capability for detecting and segmenting small objects, this study constructs an SPA (Scale-Position-Detail Awareness) module within the detection head, comprising three sub-modules: the Scale Sequence Feature Fusion (SSFF) [24] module, the Three-Scale Feature Encoding (TFE) [24] module, and the Channel-Position Attention Mechanism (CPAM) [24] module. The SSFF module integrates multi-scale semantic information to strengthen the model’s ability to represent targets of different scales; the TFE module supplements local details of small objects, aiding in the resolution of densely packed regions; and the CPAM module fuses features from the SSFF and TFE modules, capturing both channel information and fine-grained spatial localization of small objects, thereby improving detection and segmentation accuracy.
The structure of the SSFF module is illustrated in Fig. 6. To effectively address the multi-scale problem caused by significant variations in object size in cellular images, the Scale Sequence Feature Fusion (SSFF) module is employed to fully exploit the correlations among multi-scale features, enabling the joint modeling of deep semantic information and shallow detailed features. SSFF takes multi-layer feature maps (P3, P4, P5) extracted by the backbone network as input. First, these three feature maps are convolved with a series of Gaussian kernels with incrementally increasing standard deviations, as described by the following formula:
Next, the P4 and P5 feature maps are upsampled to match the spatial resolution of P3, and their channel dimensions are unified. An unsqueeze operation is applied to add a scale dimension to each feature map, and the resulting 3D tensors (height, width, channels) are concatenated along this dimension to form a 4D tensor (depth, height, width, channels). The 4D feature maps are then combined to form a 3D feature map for subsequent convolution. Finally, 3D convolution, 3D batch normalization, and the SiLU activation function are applied to extract multi-scale feature correlations, thereby enhancing the model’s ability to detect small objects.
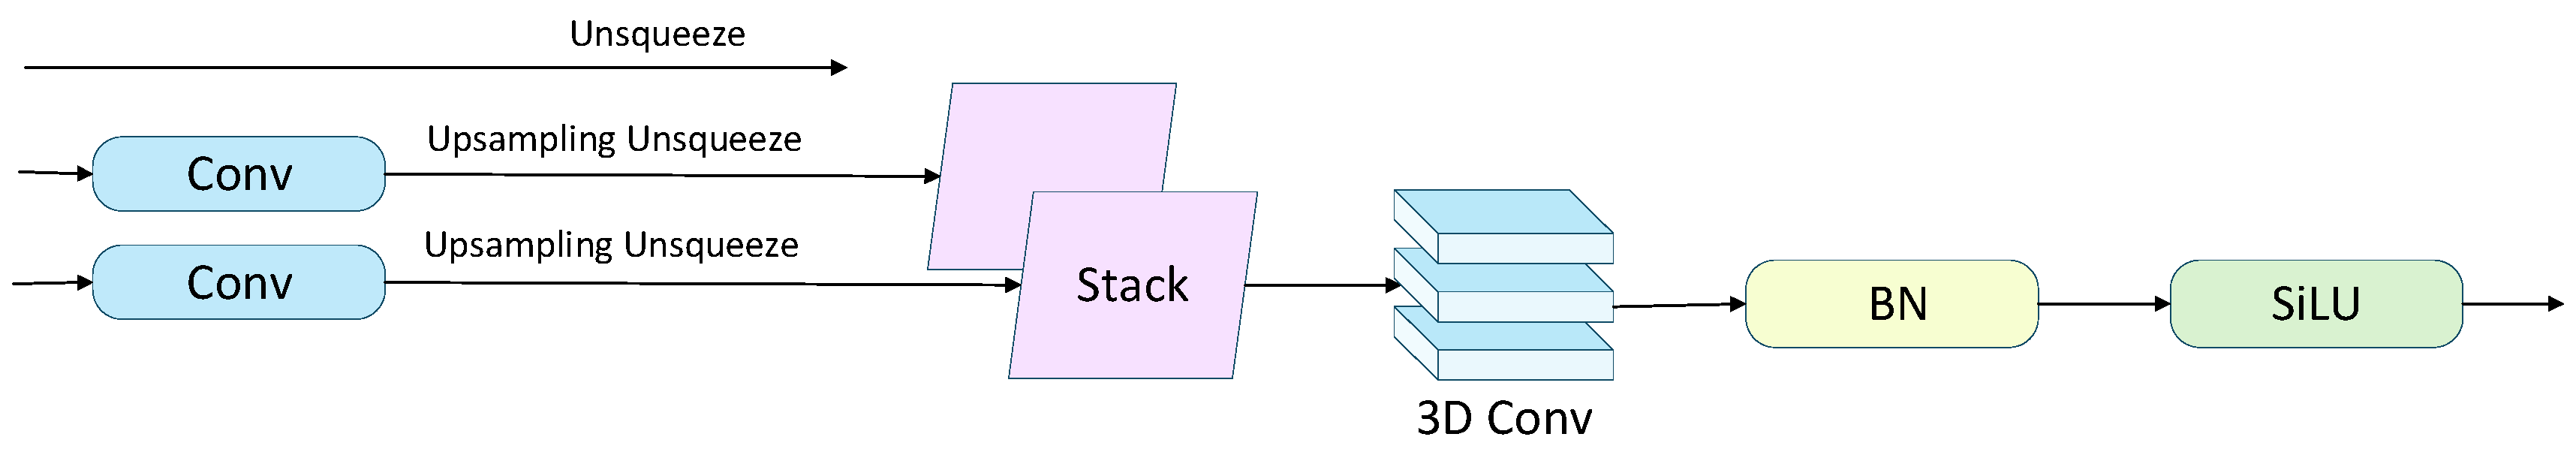
Figure 6: Architecture of the SSFF module.
To enhance the model’s perception of dense and overlapping small objects, this study employs the Three-Scale Feature Encoding (TFE) module, with its structure illustrated in Fig. 7. Unlike traditional FPNs, which only upsample and fuse small-scale feature maps, the TFE module incorporates large, medium, and small-scale feature maps, and uses scale reconstruction and feature enhancement to effectively preserve the rich detail information in large-scale feature maps. Specifically, the TFE module first adjusts the channels of the large-scale feature map and applies a combination of max pooling and average pooling for downsampling to enhance translation invariance. The small-scale feature map, after channel adjustment via convolution, is upsampled using nearest-neighbor interpolation, preserving local details while minimizing the loss of small-object information. Finally, the feature maps of the three scales with matching dimensions are subjected to a final convolution and concatenated along the channel dimension, as described by the following formula:
The TFE module effectively integrates rich contextual and local structural information across different scales, providing strong support for subsequent detection branches.
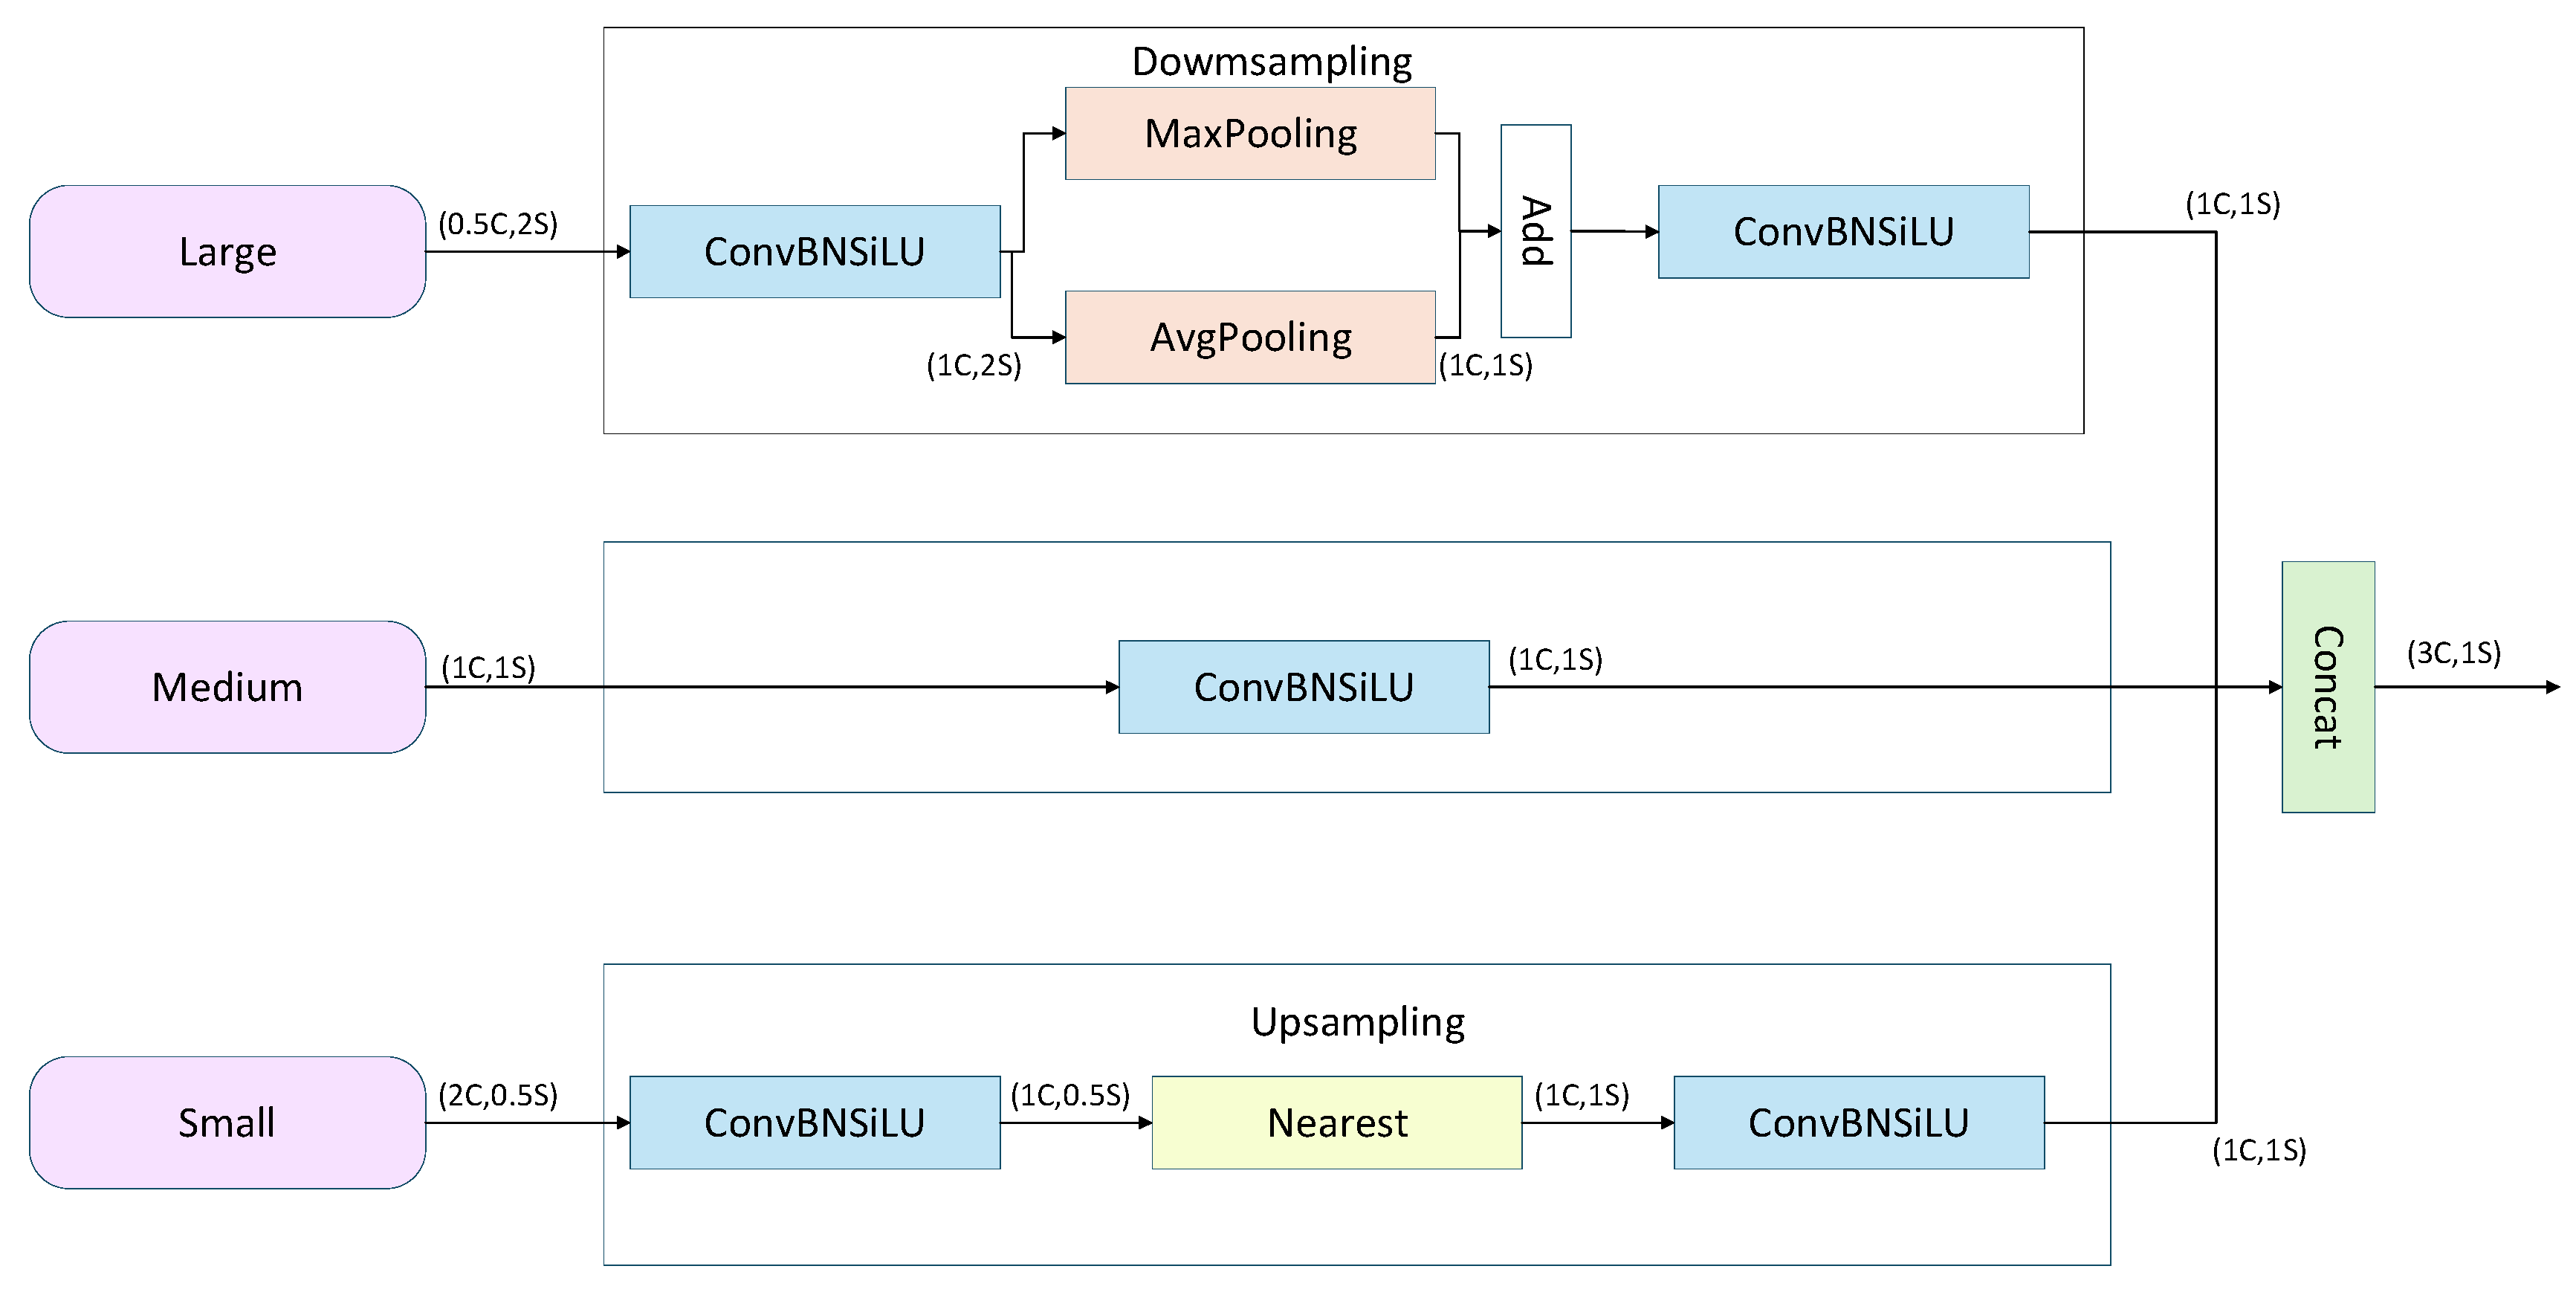
Figure 7: TFE module structure.
To further enhance the model’s perception of critical regions, this study employs the Channel-Position Attention Module (CPAM), with its structure illustrated in Fig. 8. CPAM consists of a channel attention network that receives input from the TFE module (Input 1) and a position attention network that takes as input the combination of the channel attention output and SSFF features (Input 2). Specifically, Input 1, the channel attention network, processes feature maps from PANet containing detailed TFE features. Each channel undergoes independent global average pooling, followed by two fully connected layers and a nonlinear Sigmoid function to generate channel weights. Subsequently, the output of the channel attention mechanism is combined with the SSFF feature map (Input 2) as the input to the position attention network, enabling the extraction of critical spatial information. Unlike the channel attention mechanism, the position attention mechanism first models features along the horizontal and vertical directions and then merges them to produce the output. Finally, the CPAM module achieves synergistic enhancement in both feature detail representation and spatial localization, effectively improving the detection accuracy of small objects.
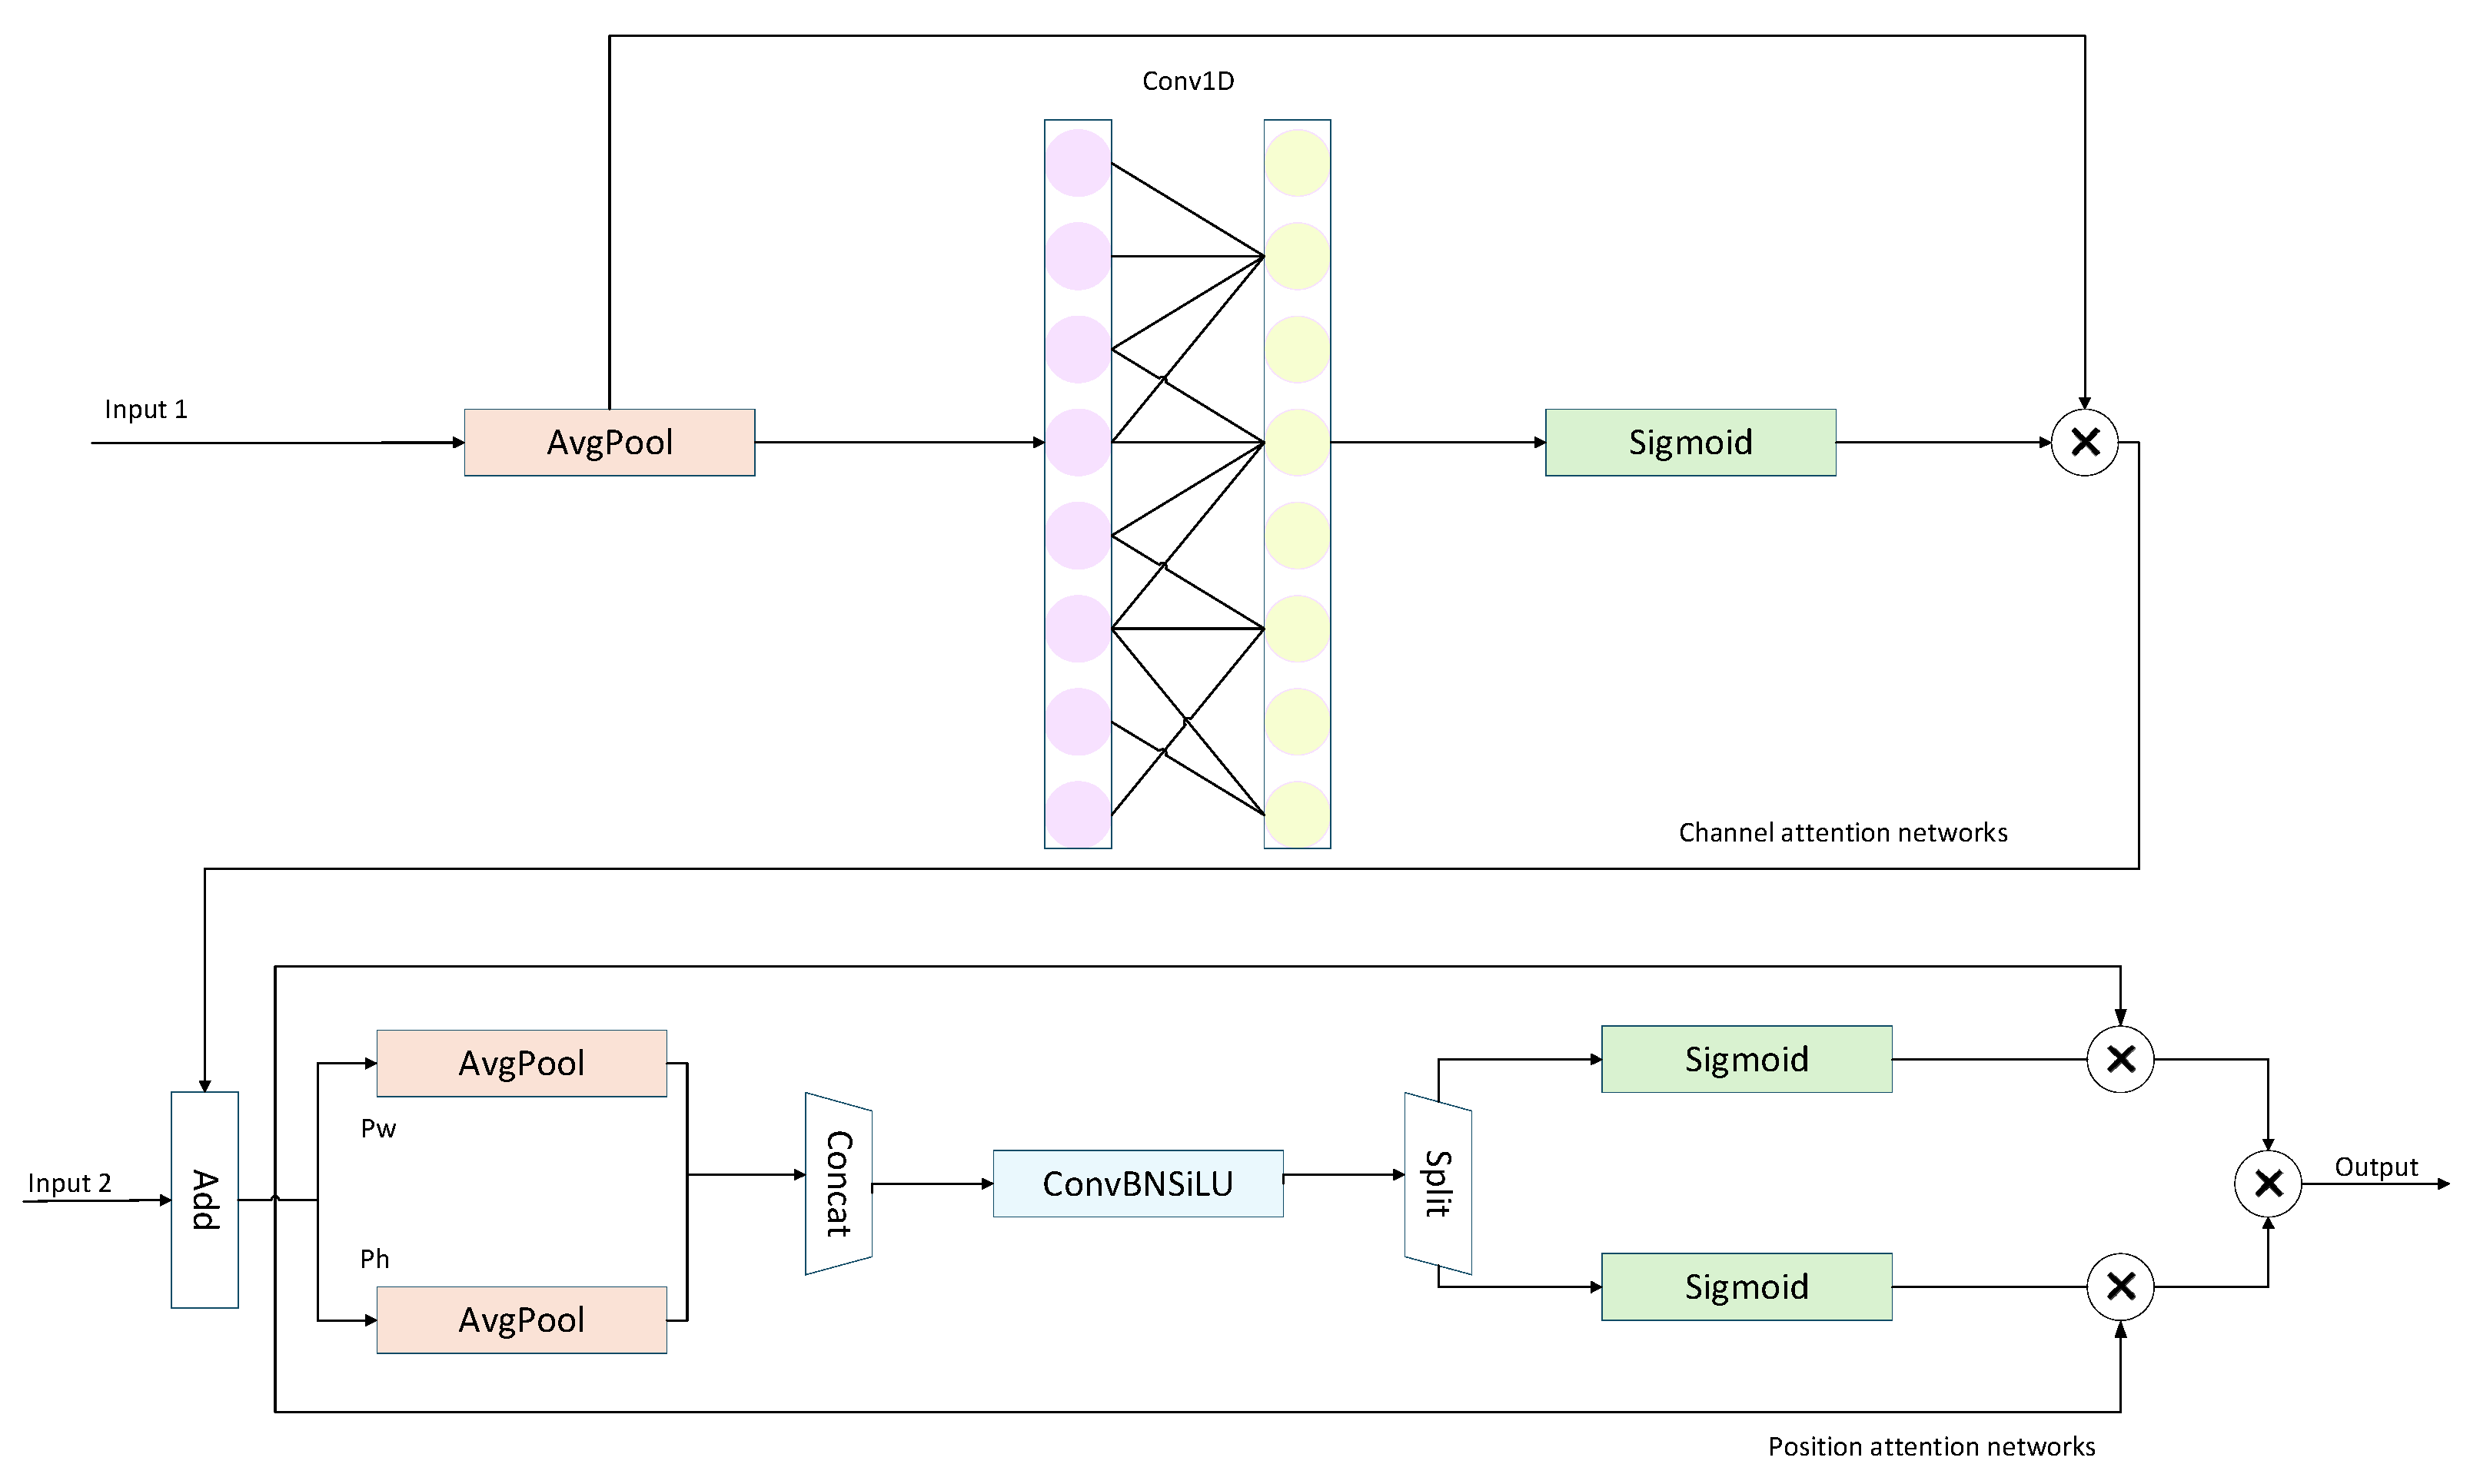
Figure 8: CPAM module structure.
In summary, to improve both the accuracy and speed of tomato disease detection, this study introduces several key module optimizations based on YOLO11. In the detection head, an SPA module composed of SSFF, TFE, and CPAM is incorporated to fully integrate multi-scale semantic and local detail information, enhancing the model’s channel-wise and spatial attention to target regions. At the end of the backbone, a SEAM module is introduced to strengthen the discriminative power of feature representations. Additionally, a lightweight multi-layer attention perception is achieved through the MLCA module. The overall structure of the improved model, YOLO-SPDNet, is illustrated in Fig. 9.
To enhance training sample diversity, mitigate overfitting, and improve generalization, the dataset was systematically preprocessed and augmented. All images were standardized through resizing, color normalization, and cropping of redundant backgrounds to ensure consistent inputs. During augmentation, brightness adjustment, horizontal and vertical flipping, random cropping, translation, and rotation were applied synchronously to images and annotations, expanding the dataset fivefold. These operations simulate variations in imaging conditions, viewpoints, and illumination, enriching the data distribution.
Building on YOLO11, YOLO-SPDNet incorporates several key modules. The SPA module (SSFF, TFE, CPAM) in the detection head fuses multi-scale semantics with local details, SEAM at the backbone’s end enhances high-level semantic discriminability, and MLCA in the Neck enables lightweight multi-layer attention. Feature activation analysis revealed that small lesion regions exhibited strong responses, while healthy leaves and backgrounds remained low. This indicates that SEAM reinforces small-lesion semantics, and SPA and MLCA suppress background interference, directing attention to local lesions. Low-level features mainly respond to leaf edges and textures, whereas attention-weighted high-level features concentrate on small spots, demonstrating clear local enhancement.
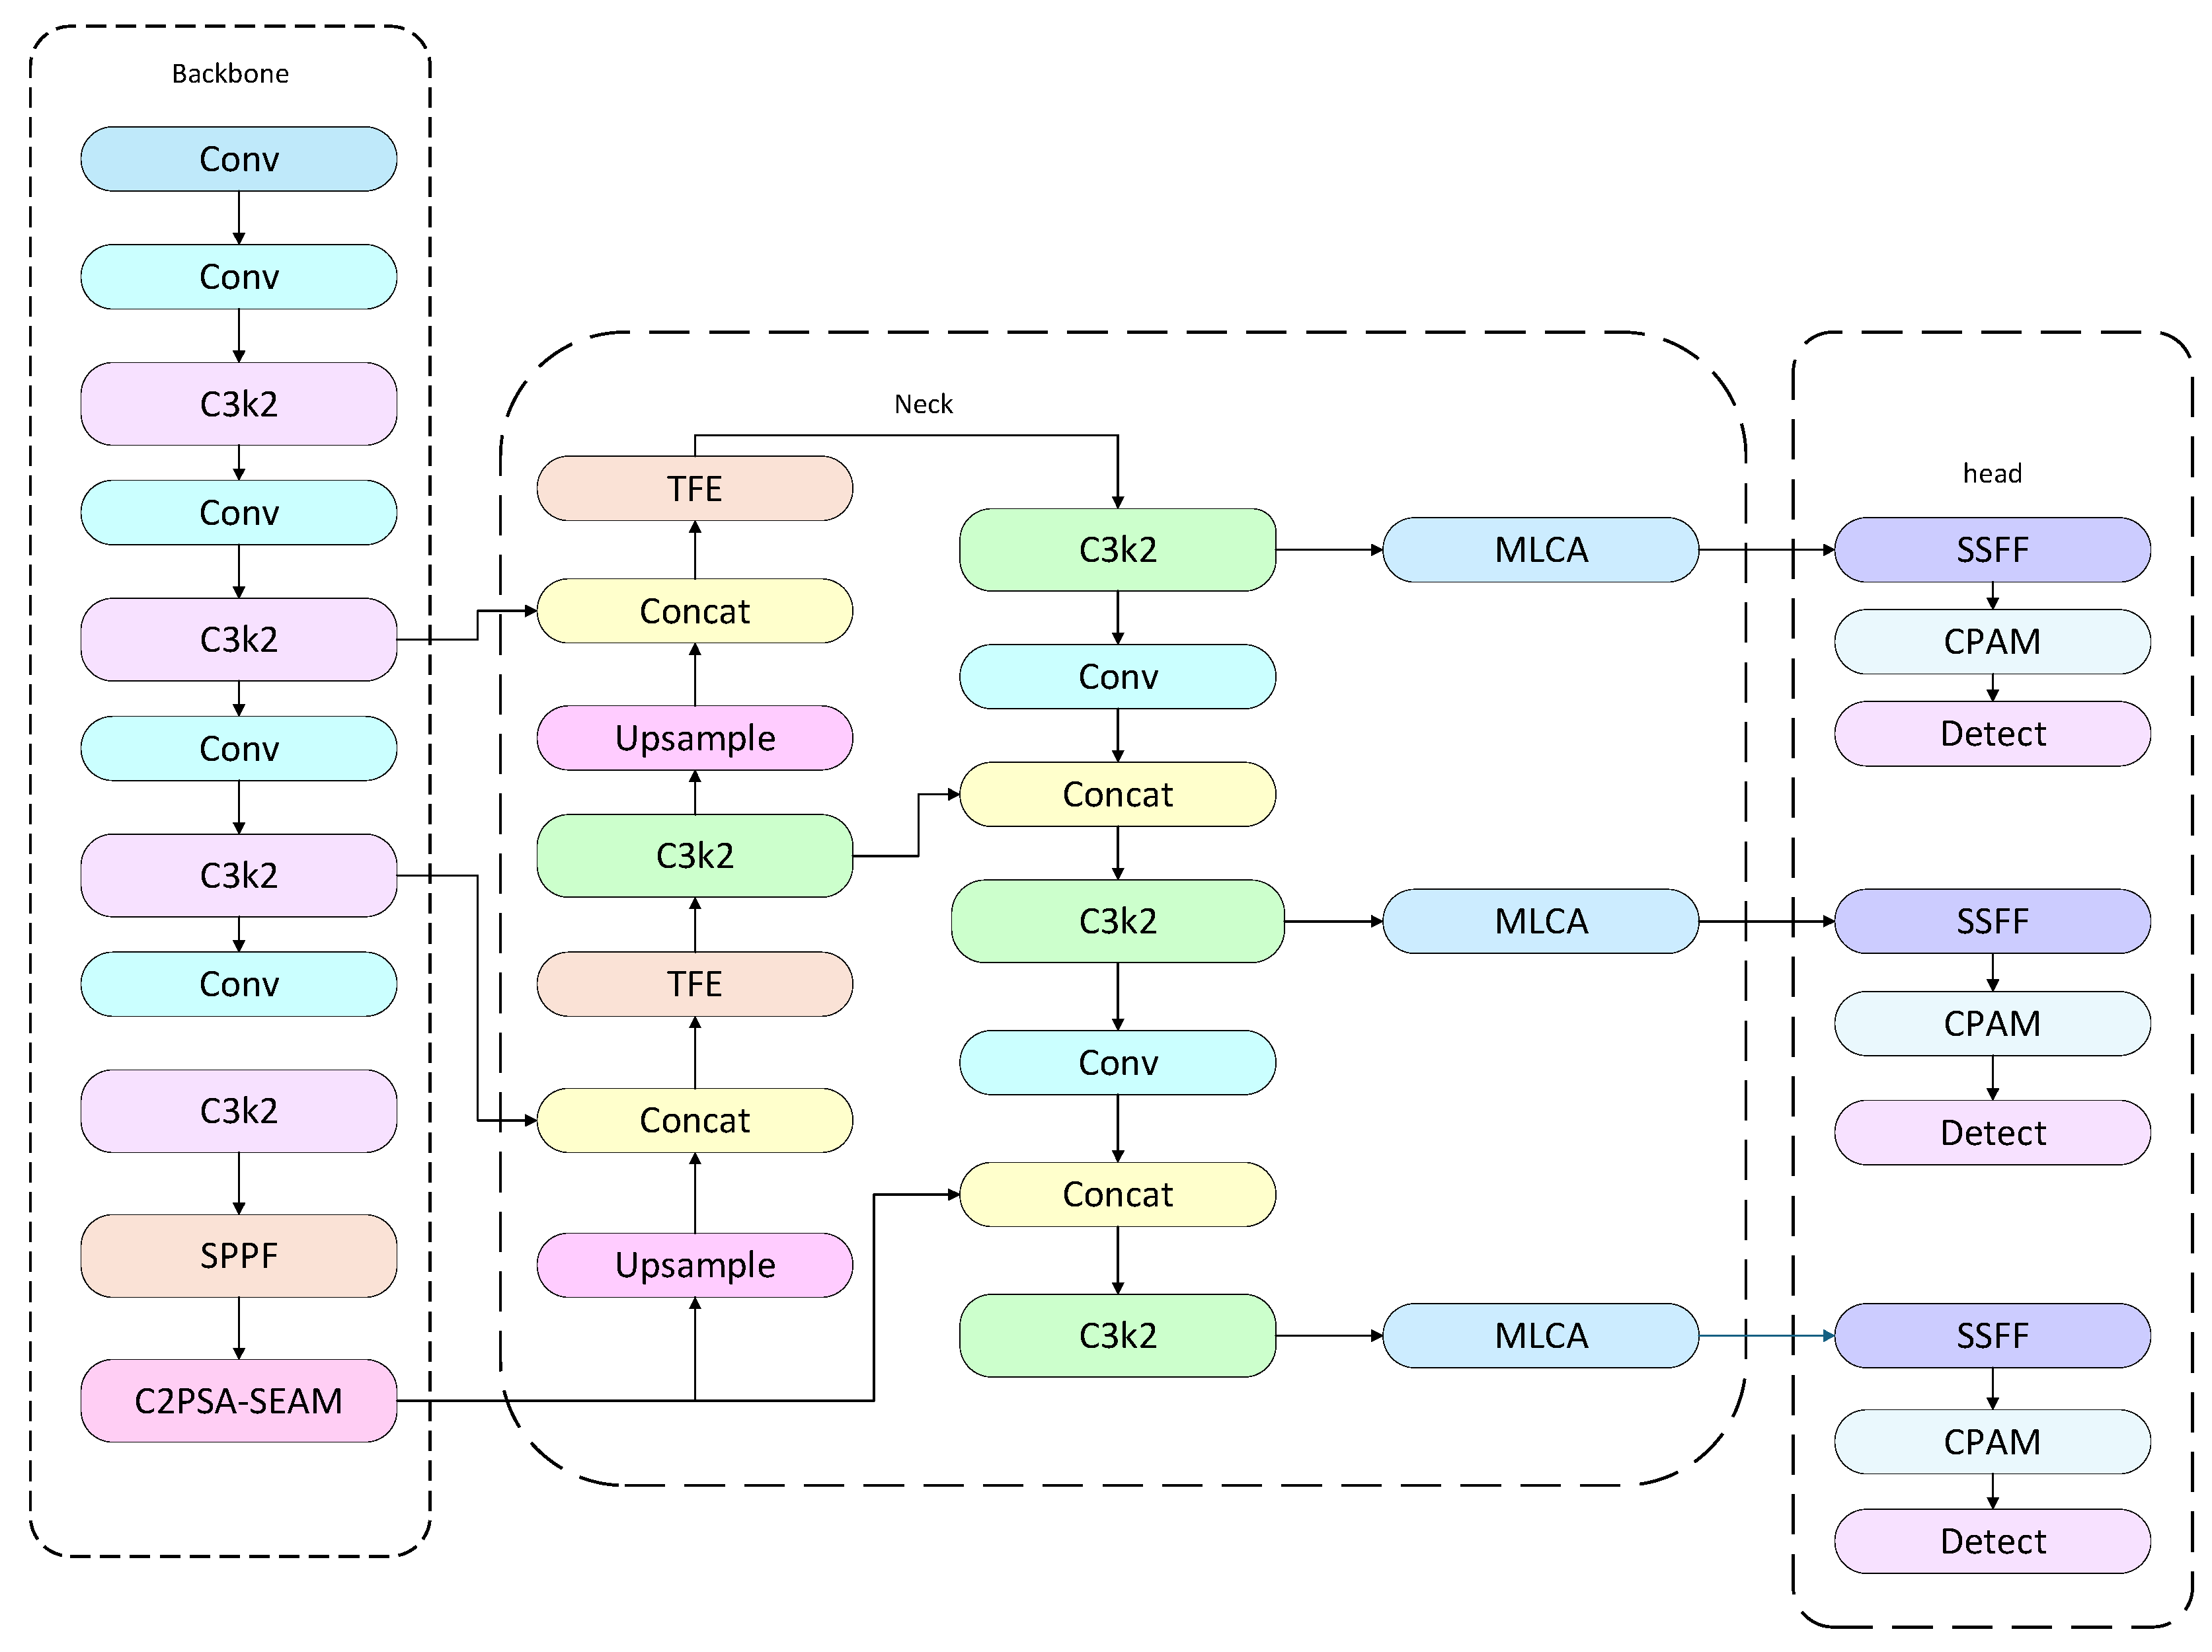
Figure 9: YOLO-SPDNet architecture.
This study employs the following metrics to comprehensively evaluate the model’s performance:
- (1)Precision
Measures the accuracy of the model’s detection results, defined as the proportion of correctly predicted positive samples among all predicted positive samples:
- (2)Recall
Measures the comprehensiveness of the model’s detection, defined as the proportion of correctly predicted positive samples among all true positive samples:
- (3)mAP
Mean Average Precision (mAP) at an IoU threshold of 0.5, calculated as the average of the AP values across all classes:
- (4)GFLOPS
GigaFLOPs (GFLOPs) represent the number of floating-point operations (FLOPs) performed by a model, expressed in billions. A lower GFLOPs count generally indicates faster inference speed, lower hardware requirements, and reduced energy consumption. It measures the amount of floating-point computation during the model’s forward pass and is defined as:
- (5)FPS
FPS (Frames Per Second) is used as a metric for inference speed, reflecting the model’s real-time processing capability on a single image. FPS indicates the computational efficiency of the model across different devices and serves as an important engineering metric for evaluating lightweight object detection networks. FPS is calculated as follows:
The model was developed based on the PyTorch 2.2.0 deep learning framework, with PyCharm 2023.1 as the integrated development environment, using Python 3.10 as the programming language. Both the baseline and improved models were run under the same hardware and software conditions to ensure experimental consistency. The YOLO-SPDNet network was fine-tuned using the dataset and transfer learning techniques to construct the tomato leaf disease detection model. Pretraining was performed on the JPG image dataset to initialize the model’s configuration parameters. All input images were standardized to a resolution of 640 × 640 pixels. The server configuration is shown in Table 2.
Table 2: Device specifications.
| Setup | Equipment Model |
|---|---|
| System | Windows 11 |
| Processor | AMD Ryzen 9 7950X 16-Core Processor |
| Operating memory | 128 GB |
| GPU | 24 GB NVIDIA GeForce RTX 4090D |
Prior to model training, key hyperparameters were iteratively tuned to ensure stable and efficient convergence. The Adam optimizer was employed due to its robustness in small-sample disease image scenarios. The initial learning rate was set to 0.01 and monitored during preliminary experiments over the first 50 epochs to assess the loss reduction trend. Weight decay was fixed at 0.0005 to balance overfitting mitigation with sufficient gradient updates. The model was trained for 200 epochs to achieve full convergence, and a batch size of 16 was adopted to accommodate GPU memory limitations while maintaining training stability. Momentum was set to 0.937 and the number of data loading workers was eight, following the recommended defaults of the YOLO series, thereby ensuring efficient data throughput and convergence. Overall, the hyperparameter configuration was determined based on observations of initial convergence curves and multiple trial runs, achieving stable training while keeping computational requirements manageable. The core specifications are listed in Table 3.
Table 3: Core configuration.
| Parameters | Values |
|---|---|
| Optimizer | Adam |
| Epochs | 200 |
| Batch | 16 |
| Workers | 8 |
| Momentum | 0.937 |
| Initial learning rate | 0.01 |
| Weight learning rate | 0.0005 |
3 Experimental Results and Analysis
3.1 Model Performance Evaluation
The performance of YOLO-SPDNet was evaluated on the custom dataset, with detection results shown n Table 4 and Fig. 10. As shown in Table 5, the mAP values for Early Blight and Groundnut Bud Necrosis Virus are higher compared to Leaf Mold. In practice, Leaf Mold lesions are smaller, and diseased leaves are often intermingled with healthy leaves, making key features more difficult to learn. The average scores for precision (P), recall (R), mAP, and GFLOPs are 91.8%, 86.5%, 90.6%, and 12.5, respectively, with model weights of 6.4 MB. The precision-recall curves and loss curves are shown in Fig. 11. The model maintains excellent real-time detection performance across different tomato leaf diseases. Therefore, YOLO-SPDNet can adapt to complex natural environments, enabling effective early detection of tomato leaf diseases. The training and validation loss curves are shown in Fig. 10, demonstrating a stable decline with both curves converging in the later training stages, indicating strong generalization ability. Precision and recall metrics steadily improve and stabilize during training and validation, confirming the model’s progressively enhanced detection capability.
Table 4: Evaluation results of the YOLO-SPDNet detection model on the test set.
| Model | Class | P (%) | R (%) | mAP@0.5 (%) |
|---|---|---|---|---|
| YOLO-SPDNet | All | 91.8 | 86.5 | 90.6 |
| Early blight (eb) | 98.6 | 98.1 | 99.4 | |
| Groundnut bud necrosis virus (gbnv) | 99.9 | 94.9 | 97.6 | |
| Healthy leaf (hl) | 97.1 | 99.0 | 99.3 | |
| Leaf mold (lm) | 72.4 | 53.2 | 65.9 |
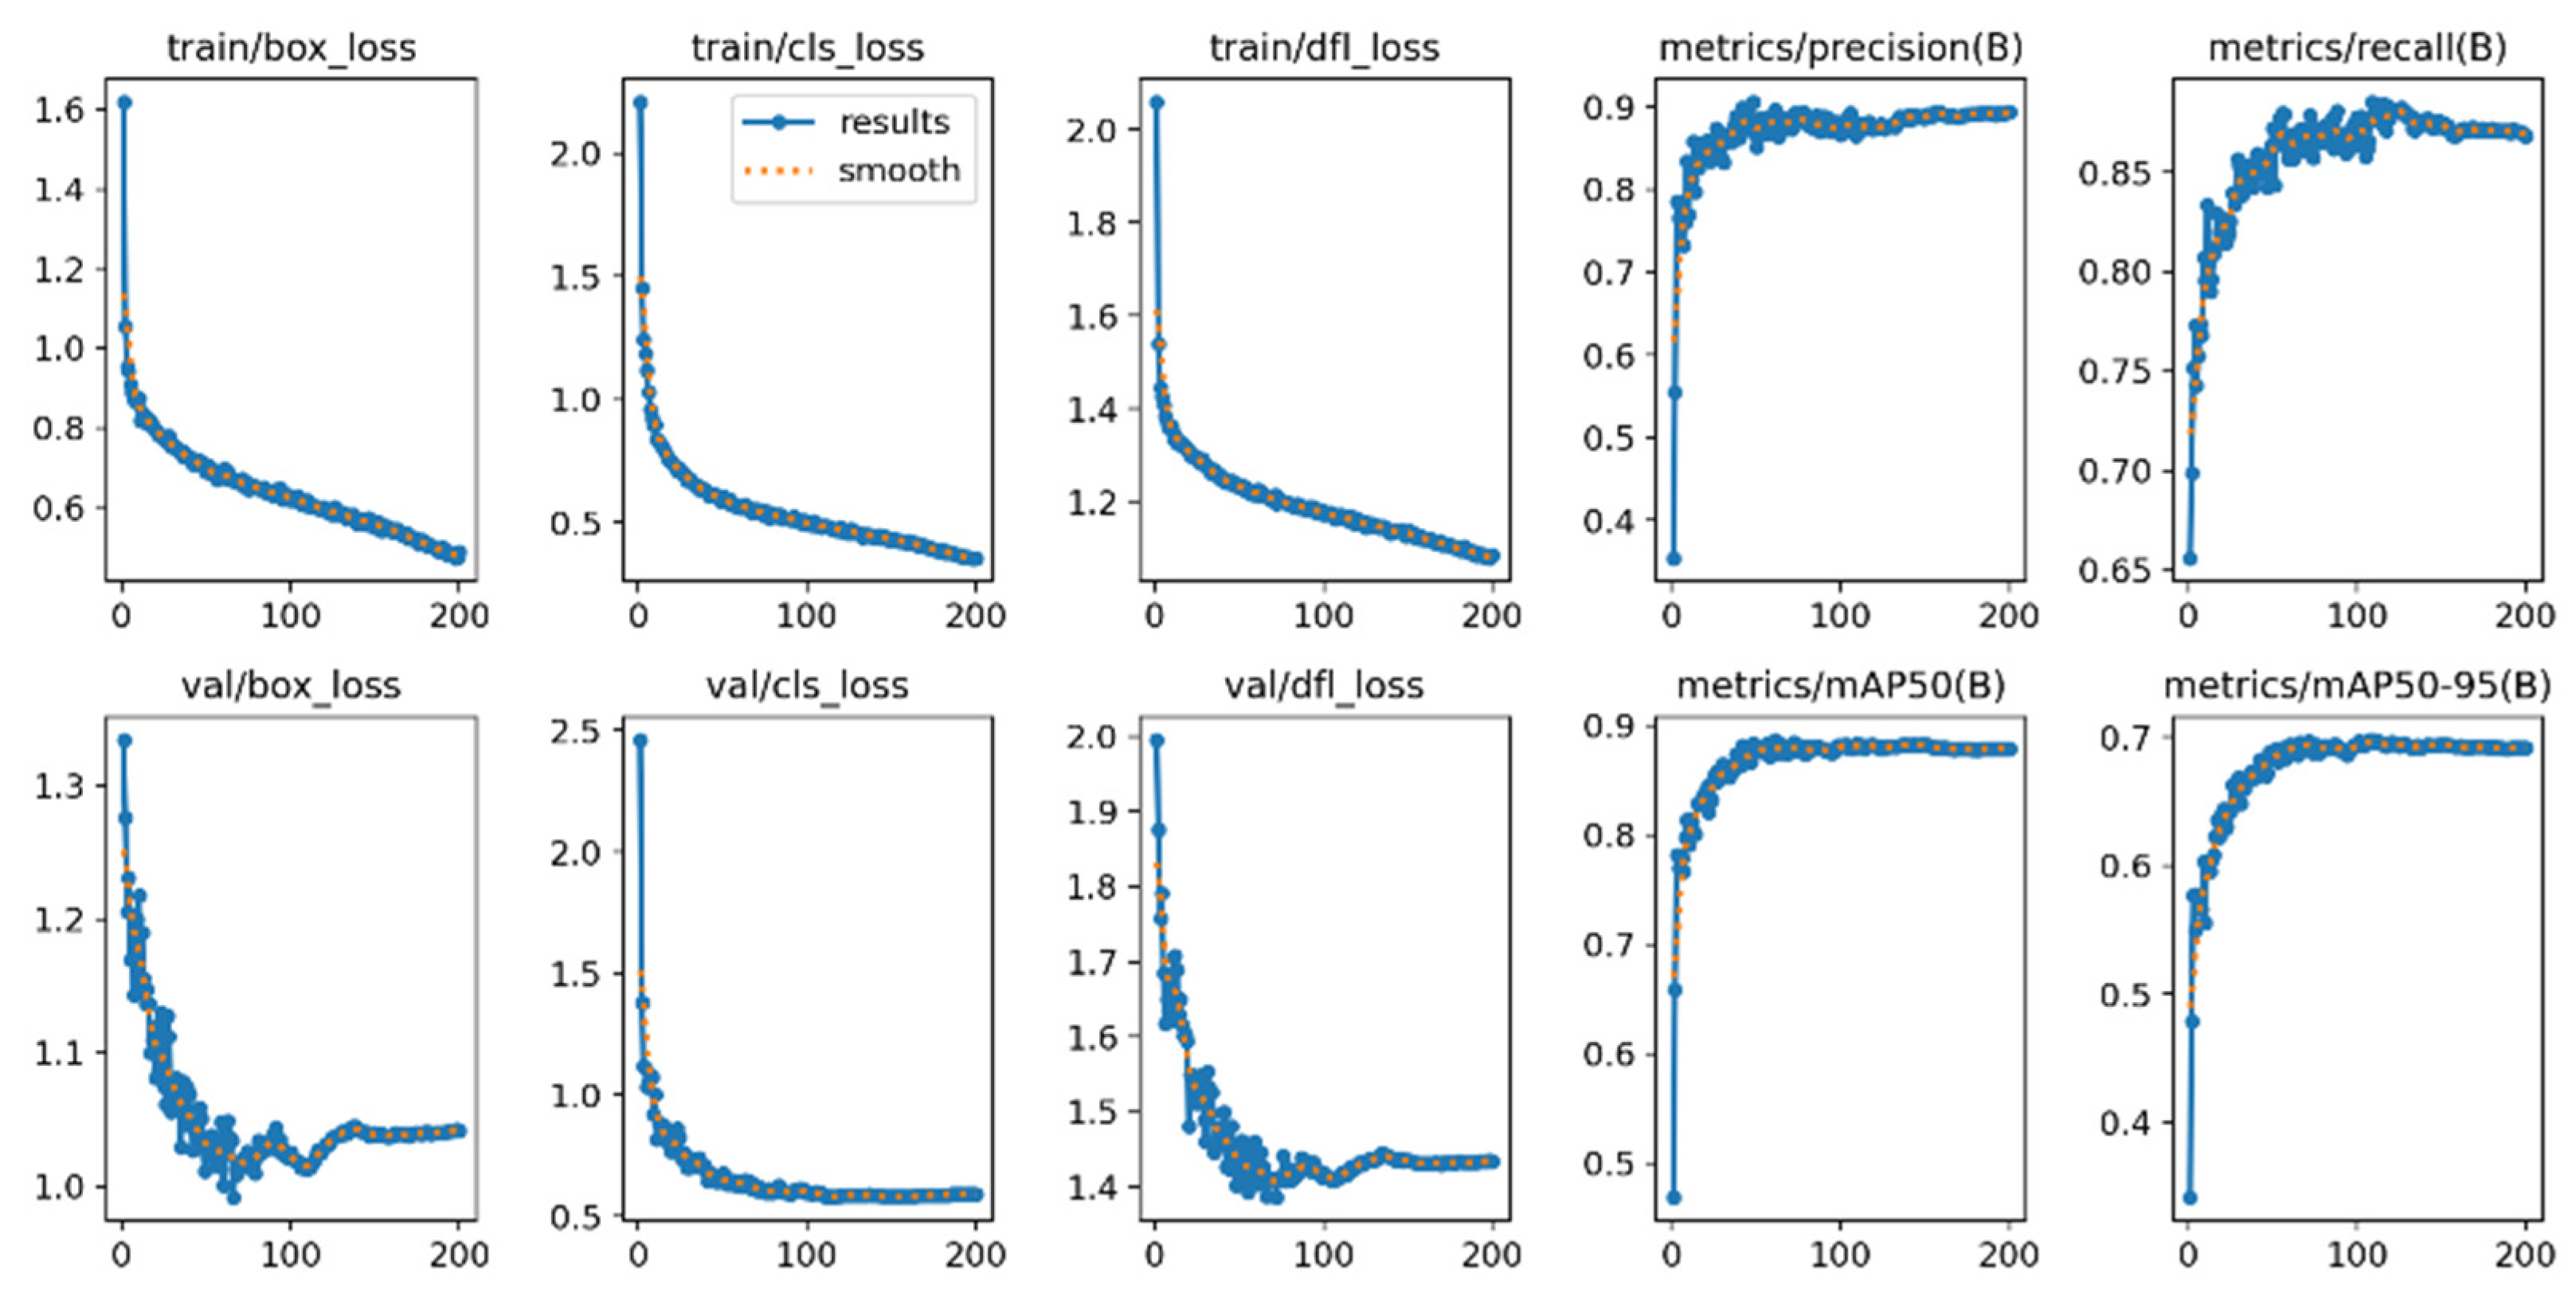
Figure 10: Training and validation loss curves.
3.2 Comparison of Different Models
As shown in Table 5, mainstream object detection models exhibit substantial differences in accuracy, efficiency, and model size for tomato disease detection. The YOLO11 series demonstrates the strongest overall performance. YOLO11n achieves an accuracy of 87.9 percent, a recall of 87.6 percent, and a mAP at 0.5 of 88.3 percent, with a computational cost of 6.3 GFLOPs, a model size of 5.5 megabytes, and an inference speed of 969 frames per second. YOLO11s and YOLO11m maintain high accuracy while achieving inference speeds of 411 frames per second and 209 frames per second, respectively, illustrating the balanced performance of the series across different scales. The YOLOv10 [25] series shows distinct characteristics. YOLOv10n reaches a mAP at 0.5 of 84.0 percent with an inference speed of 932 frames per second. YOLOv10s improves accuracy to 84.8 percent and recall to 84.4 percent, with a computational cost of 46.6 GFLOPs. YOLOv10m achieves the highest mAP at 0.5 in the series, 85.1 percent, but the computational cost increases to 76.8 GFLOPs and the model size reaches 53.4 megabytes. The YOLOv5 series delivers high inference speed, reaching 867 frames per second for YOLOv5n, 411 frames per second for YOLOv5s, and 201 frames per second for YOLOv5m, but its mAP at 0.5 ranges only from 76.2 percent to 77.7 percent. The YOLOv12 [26] series emphasizes lightweight design. YOLOv12n achieves an inference speed of 1011 frames per second with a computational cost of 5.8 GFLOPs and a model size of 5.5 megabytes, maintaining a mAP at 0.5 of 80.8 percent. YOLOv12s and YOLOv12m achieve mAP at 0.5 of 84.6 percent and 83.8 percent, with inference speeds of 423 frames per second and 203 frames per second, respectively. SSD [27] reaches a mAP at 0.5 of 88.2 percent, but its computational cost is 30.5 GFLOPs, model size is 92.1 megabytes, and inference speed is only 231 frames per second.
YOLO-SPDNet incorporates SEAM, MLCA, and SPA modules to further improve performance. It achieves a mAP at 0.5 of 90.6 percent, an accuracy of 91.8 percent, and a recall of 86.5 percent, with a computational cost of 12.5 GFLOPs, a model size of 6.4 megabytes, and an inference speed of 987 frames per second. Compared with other models, YOLO-SPDNet achieves the most favorable balance between accuracy, speed, and model size. Its mAP at 0.5 surpasses all YOLOv5, YOLOv10, and YOLOv12 variants, approaches YOLO11n in accuracy with lower computational cost, and maintains near real-time inference speed, demonstrating its suitability for practical agricultural applications requiring both high accuracy and efficiency.
Table 5: Comparison of Different Models.
| Model | P (%) | R (%) | mAP@0.5 (%) | GFLOPs | Model Size (MB) | FPS (f/s) |
|---|---|---|---|---|---|---|
| YOLOv5n | 79.0 | 80.2 | 77.7 | 15.8 | 14.4 | 867 |
| YOLOv5s | 78.2 | 77.1 | 76.2 | 33.1 | 27.8 | 411 |
| YOLOv5m | 80.1 | 76.4 | 77.6 | 50.4 | 43.9 | 201 |
| YOLOv10n | 84.4 | 81.9 | 84.0 | 24.5 | 16.5 | 932 |
| YOLOv10s | 84.8 | 84.4 | 83.8 | 46.6 | 31.6 | 439 |
| YOLOv10m | 85.2 | 83.2 | 85.1 | 76.8 | 53.4 | 238 |
| YOLO11n | 87.9 | 87.6 | 88.3 | 6.3 | 5.5 | 969 |
| YOLOv11s | 85.0 | 85.3 | 85.0 | 21.3 | 19.2 | 411 |
| YOLOv11m | 82.5 | 81.0 | 81.0 | 67.7 | 40.5 | 209 |
| YOLOv12n | 81.8 | 82.8 | 80.8 | 5.8 | 5.5 | 1011 |
| YOLOv12s | 86.9 | 82.2 | 84.6 | 20.8 | 13.1 | 423 |
| YOLOv12m | 85.2 | 82.9 | 83.8 | 65.9 | 27.5 | 203 |
| SSD | 88.2 | 77.01 | 80.15 | 30.50 | 92.1 | 231 |
| YOLO-SPDNet | 91.8 | 86.5 | 90.6 | 12.5 | 6.4 | 987 |
3.3 Comparison of Detection Performance across Different Models
As shown in the visualization results in Fig. 11, the performance of different detection models in natural scenarios for tomato disease recognition exhibits significant variation. YOLOv5 demonstrates relatively stable generation of bounding boxes overall but lacks sufficient attention to small targets. In particular, it often misses early lesions on leaves or fails to fully cover subtle diseased regions, limiting its effective-ness in early-stage disease monitoring and making it difficult to capture initial disease features promptly. YOLOv8 shows some improvement over YOLOv5 in small-target detection and can recognize fine spots and edge lesions in certain disease types. However, it remains insufficiently sensitive to small lesions in complex scenarios, with some areas exhibiting blurred boundaries or inaccurately positioned boxes, indicating that YOLOv8 still struggles with comprehensive multi-scale lesion perception despite its improved detection accuracy. YOLO11 achieves excellent overall detection precision and can effectively separate different types of diseased regions. Nevertheless, when multiple diseases coexist in a single image, the model is prone to miss detections, particularly when lesion regions overlap or have unclear boundaries, leaving some disease targets incompletely enclosed. This limitation could result in biased disease statistics in practice, potentially affecting subsequent disease grading and management strategies. YOLO12 offers greater flexibility in bounding box positioning and fitting, but in complex disease scenarios, it can produce overlapping or redundant boxes for the same lesion area. This redundancy not only increases post-processing workload but may also compromise the accuracy of disease count and localization.
In contrast, the proposed improved model, YOLO-SPDNet, demonstrates superior detection performance. It maintains high overall accuracy while accurately detecting small lesions and significantly reducing missed detections and overlapping boxes in images with multiple coexisting diseases. The detected bounding boxes closely match the true lesion shapes, are clearly delineated, and exhibit minimal redundancy, providing more reliable data for subsequent disease grading and severity assessment. This advantage is largely attributed to the integration of multi-scale feature fusion and attention mechanisms, allowing the model to achieve a better balance between overall lesion region recognition and fine-grained detail capture.
This section may be divided by subheadings. It should provide a concise and precise description of the experimental results, their interpretation, as well as the experimental conclusions that can be drawn.
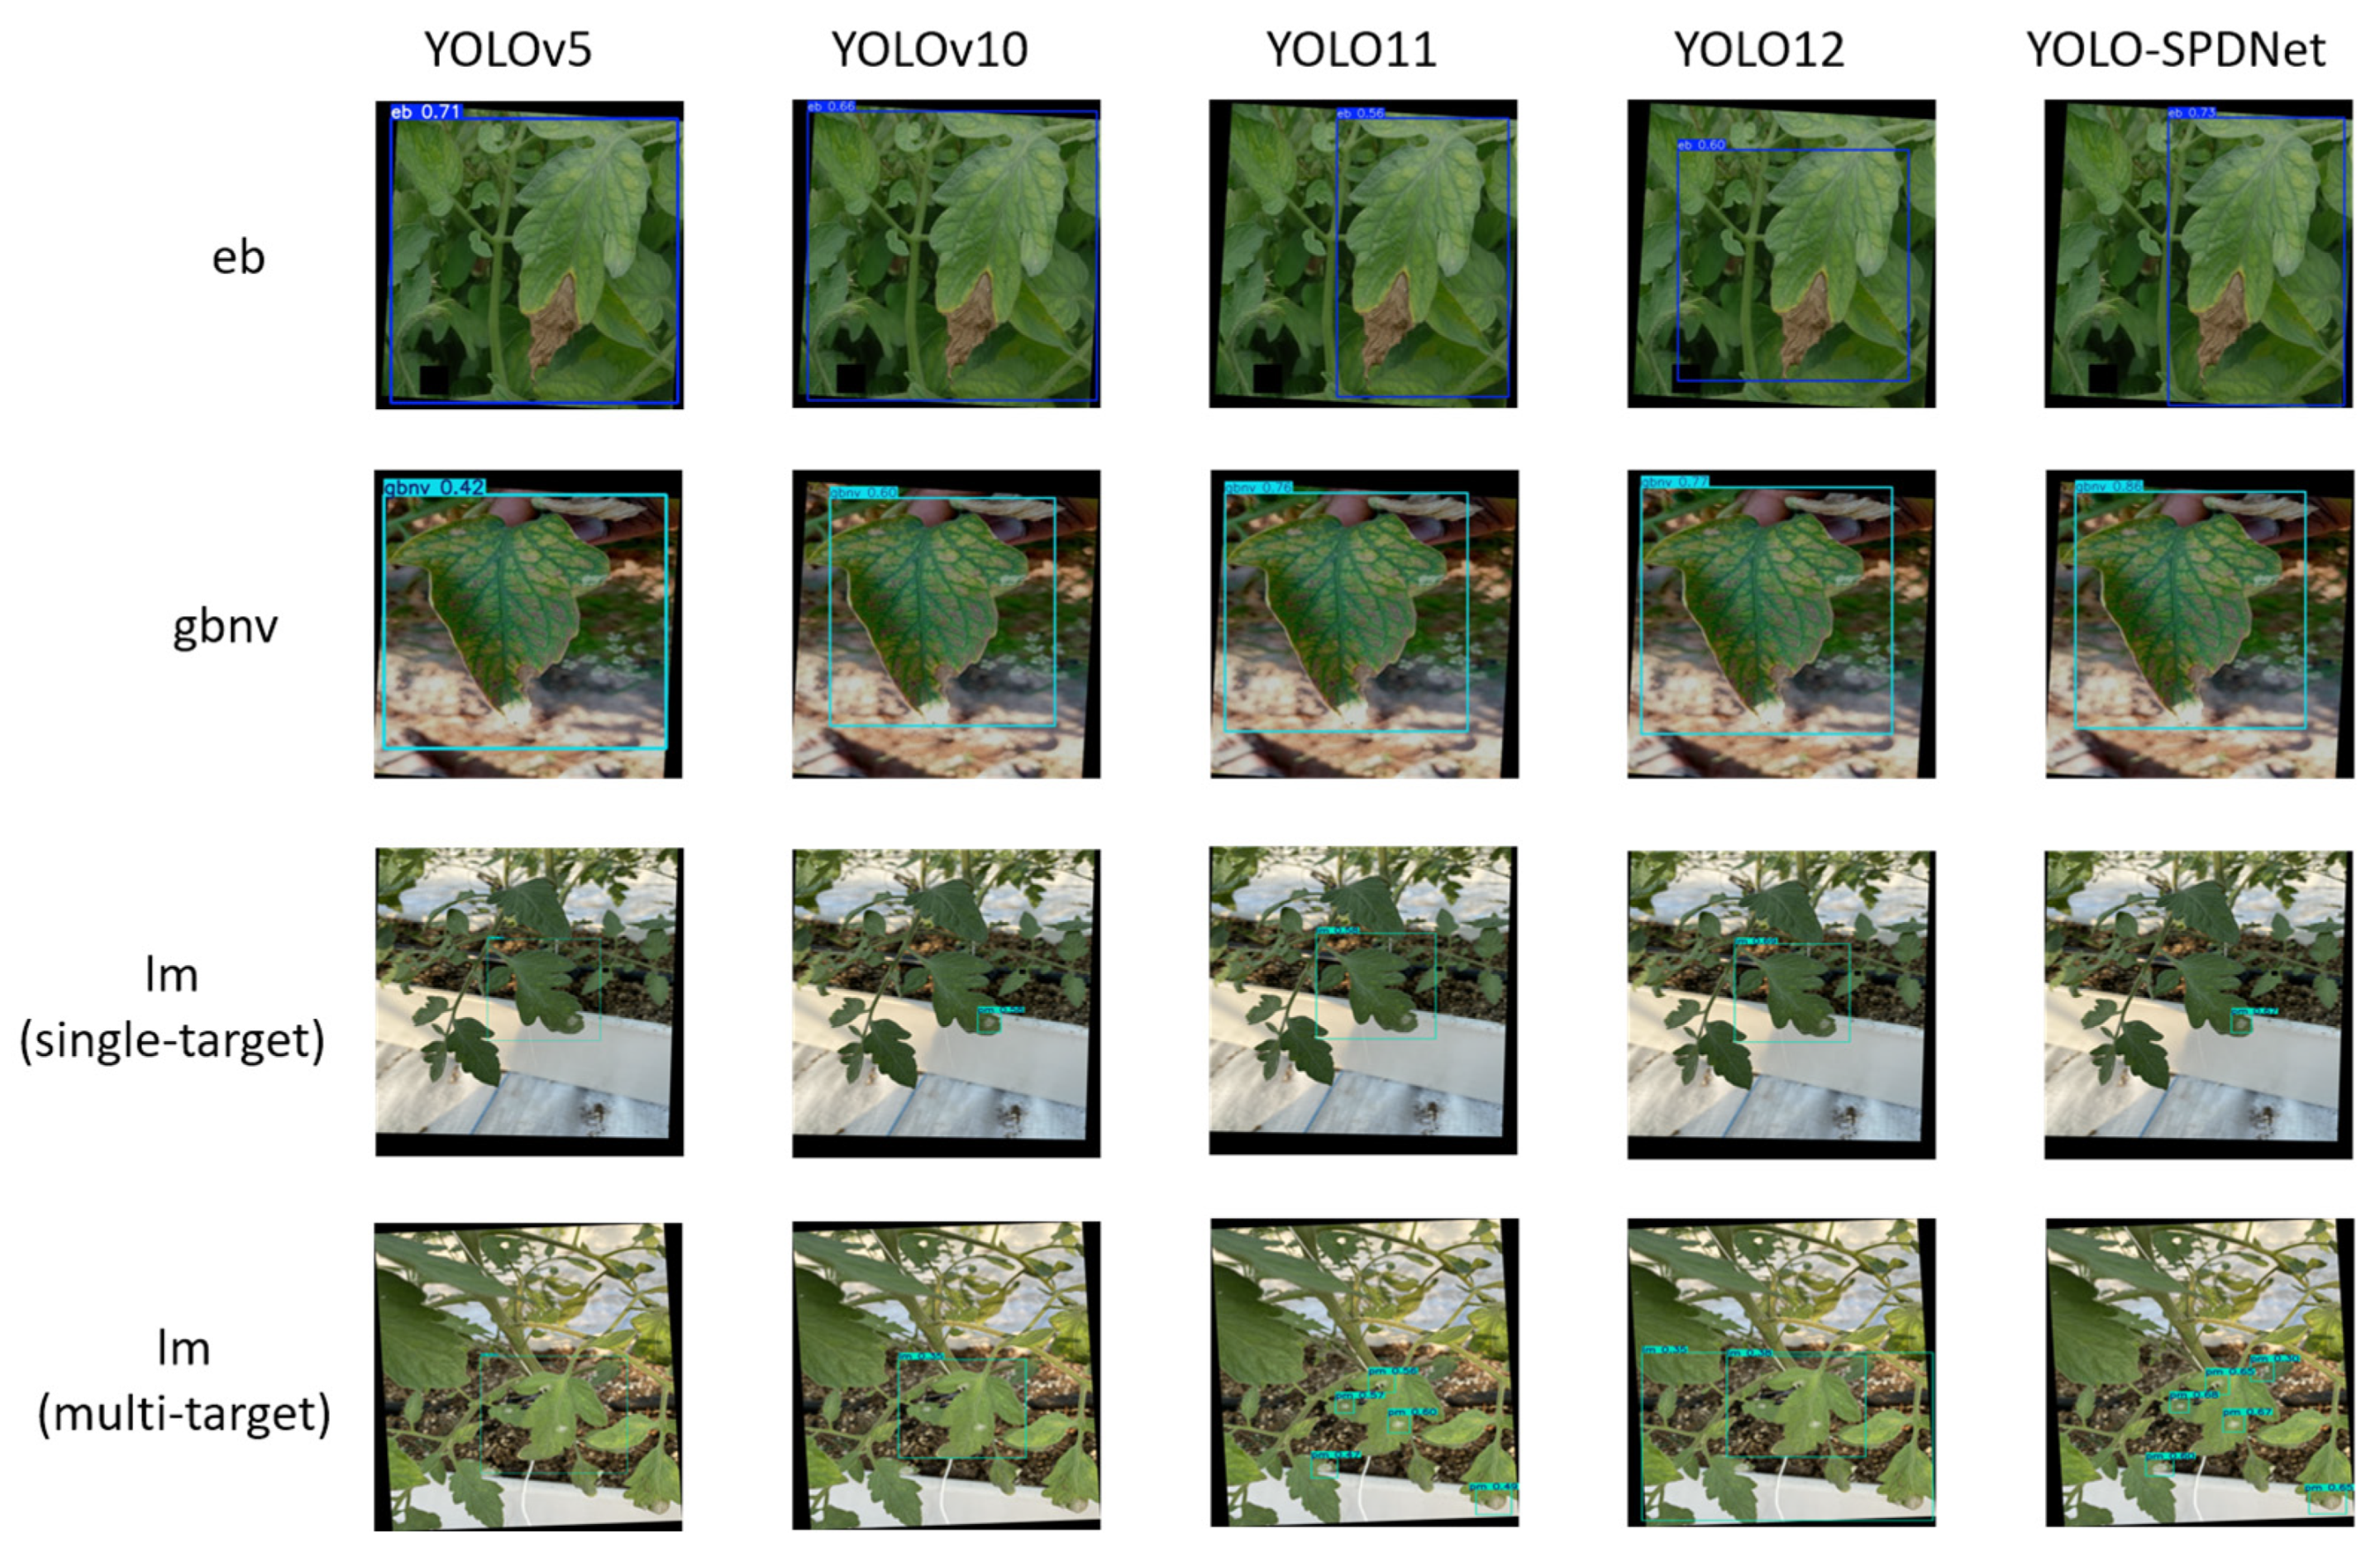
Figure 11: Comparison of detection results across different models.
Table 6 presents the results of four experiments involving three different improvement strategies. Experiment E0 serves as the baseline without any modifications, whereas EP incorporates all proposed enhancements. The modified model structures are as follows: E1 replaces C2PSA with C2PSA_SEAM; E2 adds the MLCA attention mechanism; E3 builds upon E1 and E2 by further incorporating the SPA module.
Experiment E0 serves as the baseline model and incorporates no enhancement strategies. It achieves an accuracy of 87.9%, a recall of 87.6%, and a mAP@0.5 of 88.3%, with a computational cost of 6.3 GFLOPs, a model size of 5.5 MB, and an inference speed of 969 FPS. These results provide a reference point for evaluating subsequent architectural modifications. Experiment E1 replaces the C2PSA module in the baseline with the SEAM-enhanced version. Accuracy increases to 88.6%, while recall decreases marginally to 85.4%, and mAP@0.5 slightly declines to 87.9%. Computational complexity and inference speed remain essentially unchanged, indicating that although SEAM improves discriminative capacity, it introduces minor limitations in feature coverage that affect recall. Experiment E2 further integrates the MLCA attention mechanism on top of E1. Accuracy improves to 89.6%, recall recovers to 86.9%, and mAP@0.5 rises to 88.4%. The computational cost increases slightly to 6.4 GFLOPs, and the inference speed reaches 981 FPS. These results demonstrate that MLCA enhances the model’s responsiveness to salient regions through multilayer lightweight attention, contributing to gains in both accuracy and recall without compromising efficiency. The final experiment, EP, incorporates all enhancements—SEAM, MLCA, and SPA—yielding the best overall performance. Accuracy reaches 91.8%, recall is maintained at 86.5%, and mAP@0.5 increases to 90.6%, the highest among all variants. Although GFLOPs rise to 12.5 and the model size increases to 6.4 MB, the inference speed remains high at 987 FPS. The SPA module significantly strengthens multi-scale feature modeling and spatial localization of small targets, enabling the model to achieve the most favorable overall detection performance.
Overall, the experimental results indicate that each improvement strategy plays a crucial role in enhancing model performance, with evident synergistic effects. The SEAM module, by introducing multi-scale receptive fields and spatial enhancement, significantly improves feature representation of complex lesions, providing a stable semantic foundation for subsequent attention and feature fusion modules. MLCA combines local and channel attention, reinforcing the model’s sensitivity to key regions and further boosting detection accuracy. The SPA module’s SSFF and TFE sub-modules efficiently integrate multi-scale semantic information with small-target details for precise representation of tomato disease regions, while the CPAM submodule jointly models channel and spatial dimensions to enhance localization of small lesions. Collectively, these integrated structural optimizations demonstrate clear design rationale and substantial empirical performance improvements, validating their practical value and synergistic advantage in tomato disease detection tasks.
Table 6: Comparison of performance among different YOLO11 versions.
| Model | Seam | MLCA | SPA | P (%) | R (%) | mAP@0.5 (%) | GFLOPs | Model Size (MB) | FPS (f/s) |
|---|---|---|---|---|---|---|---|---|---|
| E0 | 87.9 | 87.6 | 88.3 | 6.3 | 5.5 | 969 | |||
| E1 | √ | 88.6 | 85.4 | 87.9 | 6.3 | 5.4 | 973 | ||
| E2 | √ | √ | 89.6 | 86.9 | 88.4 | 6.4 | 5.3 | 981 | |
| EP | √ | √ | √ | 91.8 | 86.5 | 90.6 | 12.5 | 6.4 | 987 |
The present study proposes a tomato leaf disease detection method based on YOLO-SPDNet and demonstrates its superior performance under natural environmental conditions through a series of comparative and ablation experiments. YOLO-SPDNet achieves a precision of 91.8%, a recall of 86.5%, and a mean average precision of 90.6%, significantly outperforming several mainstream object detection models. In addition to high detection accuracy, the model maintains low computational complexity and a compact size, achieving an inference speed of 987FPS. These results indicate that YOLO-SPDNet is not only highly effective in accurately localizing and identifying diseased regions but also suitable for real-time deployment on resource-constrained agricultural monitoring devices.
Ablation experiments further confirm the effectiveness of each module in the model architecture. The SEAM attention mechanism enhances feature extraction in the backbone network, while the MLCA module in the detection head improves the network’s responsiveness to critical target features. Within the SPA module, the SSFF module constructs a scale-sequence tensor to achieve deep multi-scale feature fusion, improving the model’s perception of lesions of varying sizes; the TFE module preserves fine-grained local details of small targets, boosting recognition in densely diseased regions; and the CPAM module jointly models channel and spatial information, increasing attention to lesion locations. The synergistic effect of these modules contributes to substantial improvements in overall detection performance. YOLO-SPDNet not only achieves a favorable balance between accuracy and efficiency but also possesses high engineering practicality. Its lightweight design facilitates rapid deployment in real agricultural environments, particularly on mobile or edge computing devices.
Nonetheless, some limitations remain. First, the model does not account for variations in growth stages across different regions or tomato varieties, and its generalization capability requires validation on more diverse datasets. Second, while the current model emphasizes accuracy improvements, quantitative comparisons of inference speed and other efficiency metrics have not yet been conducted. Finally, although the model effectively detects and classifies diseases, it does not yet integrate lesion severity assessment, limiting its utility for detailed agricultural decision-making. Future work will focus on constructing more comprehensive and diverse disease datasets to enhance generalization, optimizing inference speed, and exploring algorithms for lesion area calculation and disease severity grading, thereby providing a more robust technical foundation for tomato leaf disease identification and monitoring.
Acknowledgement:
Funding Statement: Tianmin Tianyuan Boutique Vegetable Industry Technology Service Station (Grant No. 2024120011003081), Development of Environmental Monitoring and Traceability System for Wuqing Agricultural Production Areas (Grant No. 2024120011001866)
Author Contributions: The authors confirm contribution to the paper as follows: Conceptualization, Meng Wang and Jinghan Cai; methodology, Meng Wang; software, Wenzheng Liu; validation, Jingjing Zhang, Xue Yang and Hang Zhang; formal analysis, Meng Wang; investigation, Tonghai Liu; resources, Fanzhen Wang; data curation, Qiangmin Zhou; writing—original draft preparation, Meng Wang; writing—review and editing, Meng Wang and Qiangmin Zhou; visualization, Qiangmin Zhou and Xue Yang; supervision, Fanzhen Wang; project administration, Hang Zhang and Tonghai Liu; funding acquisition, Jingjing Zhang and Fanzhen Wang. All authors reviewed the results and approved the final version of the manuscript.
Availability of Data and Materials: The data that support the findings of this study are available from the corresponding author, [Hang Zhang and Tonghai Liu], upon reasonable request.
Ethics Approval: Not applicable.
Conflicts of Interest: The authors declare no conflicts of interest to report regarding the present study.
References
1. Abulizi A , Ye J , Abudukelimu H , Guo W . DM-YOLO: improved YOLOv9 model for tomato leaf disease detection. Front Plant Sci. 2025; 15: 1473928. doi:10.3389/fpls.2024.1473928. [Google Scholar] [CrossRef]
2. David HE , Ramalakshmi K , Gunasekaran H , Venkatesan R . Literature review of disease detection in tomato leaf using deep learning techniques. In: Proceedings of the 2021 7th International Conference on Advanced Computing and Communication Systems (ICACCS); 2021 Mar 19–20; Coimbatore, India. doi:10.1109/icaccs51430.2021.9441714. [Google Scholar] [CrossRef]
3. Aegerter BJ , Stoddard CS , Miyao EM , Le Strange M , Turini TA . Impact of powdery mildew (Leveillula taurica) on yield and fruit quality of processing tomatoes in California. Acta Hortic. 2015; 1081( 1081): 153– 8. doi:10.17660/actahortic.2015.1081.17. [Google Scholar] [CrossRef]
4. Ghosh H , Rahat IS , Emon MMR , Mashrafi MJ , Al Arafat Tanzin MA , Mohanty SN , et al. Advanced neural network architectures for tomato leaf disease diagnosis in precision agriculture. Discov Sustain. 2025; 6( 1): 312. doi:10.1007/s43621-025-01149-1. [Google Scholar] [CrossRef]
5. Zhang R , Liu T , Liu W , Yuan C , Seng X , Guo T , et al. YOLO-CRD: a lightweight model for the detection of rice diseases in natural environments. Phyton. 2024; 93( 6): 1275– 96. doi:10.32604/phyton.2024.052397. [Google Scholar] [CrossRef]
6. Trinh DC , Mac AT , Dang KG , Nguyen HT , Nguyen HT , Bui TD . Alpha-EIOU-YOLOv8: an improved algorithm for rice leaf disease detection. AgriEngineering. 2024; 6( 1): 302– 17. doi:10.3390/agriengineering6010018. [Google Scholar] [CrossRef]
7. Haque E , Rahman A , Tohidi F , Islam R , Kundu H , Pretosi JJ , et al. Fast and accurate apple leaf disease detection and classification using zero-shot Yolov11 approach. SSRN. 2025. doi:10.2139/ssrn.5222809. [Google Scholar] [CrossRef]
8. Lin J , Hu G , Chen J . Mixed data augmentation and osprey search strategy for enhancing YOLO in tomato disease, pest, and weed detection. Expert Syst Appl. 2025; 264: 125737. doi:10.1016/j.eswa.2024.125737. [Google Scholar] [CrossRef]
9. Ahmad I , Hamid M , Yousaf S , Shah ST , Ahmad MO . Optimizing pretrained convolutional neural networks for tomato leaf disease detection. Complexity. 2020; 2020: 8812019. doi:10.1155/2020/8812019. [Google Scholar] [CrossRef]
10. Huang X , Chen A , Zhou G , Zhang X , Wang J , Peng N , et al. Tomato leaf disease detection system based on FC-SNDPN. Multimed Tools Appl. 2023; 82( 2): 2121– 44. doi:10.1007/s11042-021-11790-3. [Google Scholar] [CrossRef]
11. Wang Y , Zhang P , Tian S . Tomato leaf disease detection based on attention mechanism and multi-scale feature fusion. Front Plant Sci. 2024; 15: 1382802. doi:10.3389/fpls.2024.1382802. [Google Scholar] [CrossRef]
12. Cardellicchio A , Renò V , Cellini F , Summerer S , Petrozza A , Milella A . Incremental learning with domain adaption for tomato plant phenotyping. Smart Agric Technol. 2025; 12: 101324. doi:10.1016/j.atech.2025.101324. [Google Scholar] [CrossRef]
13. Ahmad Kirmani M , Afaq Y . Developments in deep learning approaches for apple leaf Alternaria disease identification: a review. Comput Electron Agric. 2024; 227: 109593. doi:10.1016/j.compag.2024.109593. [Google Scholar] [CrossRef]
14. Tang Z , He X , Zhou G , Chen A , Wang Y , Li L , et al. A precise image-based tomato leaf disease detection approach using PLPNet. Plant Phenomics. 2023; 5: 0042. doi:10.34133/plantphenomics.0042. [Google Scholar] [CrossRef]
15. Islam MA , Shuvo MNR , Shamsojjaman M , Hasan S , Hossain MS , Khatun T . An automated convolutional neural network based approach for paddy leaf disease detection. Int J Adv Comput Sci Appl. 2021; 12( 1): 280– 8. doi:10.14569/IJACSA.2021.0120134. [Google Scholar] [CrossRef]
16. Sujatha R , Chatterjee JM , Jhanjhi NZ , Brohi SN . Performance of deep learning vs machine learning in plant leaf disease detection. Microprocess Microsyst. 2021; 80: 103615. doi:10.1016/j.micpro.2020.103615. [Google Scholar] [CrossRef]
17. Mukhopadhyay S , Paul M , Pal R , De D . Tea leaf disease detection using multi-objective image segmentation. Multimed Tools Appl. 2021; 80( 1): 753– 71. doi:10.1007/s11042-020-09567-1. [Google Scholar] [CrossRef]
18. Ricky LNS , Nazari A . Tomato leaf disease detection using convolution neural network (CNN). Evol Electr Electron Eng. 2021; 2( 2): 667– 76. [Google Scholar]
19. Zhang C . An improved ResNet50-based method for tomato leaf disease recognition. Fujian Comput. 2025; 41( 5): 18– 22. (In Chinese). doi:10.16707/j.cnki.fjpc.2025.05.004. [Google Scholar] [CrossRef]
20. Song GZ , Huang WJ , Cui SS , Gao XC , Xue PJ , Wang K . Lightweight tomato leaf small-target disease recognition method based on improved YOLOv8n. Trans Chin Soc Agric Eng. 2025; 41( 10): 232– 42. (In Chinese). doi:10.11975/j.issn.1002-6819.202410098. [Google Scholar] [CrossRef]
21. Shinde S , Kothari A , Gupta V . YOLO based human action recognition and localization. Procedia Comput Sci. 2018; 133: 831– 8. doi:10.1016/j.procs.2018.07.112. [Google Scholar] [CrossRef]
22. Wang Y , Zhang J , Kan M , Shan S , Chen X . Self-supervised equivariant attention mechanism for weakly supervised semantic segmentation. In: Proceedings of the 2020 IEEE/CVF Conference on Computer Vision and Pattern Recognition (CVPR); 2020 Jun 13–19; Seattle, WA, USA. doi:10.1109/cvpr42600.2020.01229. [Google Scholar] [CrossRef]
23. Dutta S , Das M , Maulik U . Lightweight deep learning models for aerial scene classification: a comprehensive survey. Eng Appl Artif Intell. 2025; 142: 109859. doi:10.1016/j.engappai.2024.109859. [Google Scholar] [CrossRef]
24. Kang M , Ting CM , Ting FF , Phan RCW . ASF-YOLO: a novel YOLO model with attentional scale sequence fusion for cell instance segmentation. Image Vis Comput. 2024; 147: 105057. doi:10.1016/j.imavis.2024.105057. [Google Scholar] [CrossRef]
25. Chen H , Chen K , Ding G , Han J , Lin Z , Liu L , et al. YOLOv10: real-time end-to-end object detection. In: Proceedings of the Advances in Neural Information Processing Systems 37; 2024 Dec 10–15; Vancouver, BC, Canada. doi:10.52202/079017-3429. [Google Scholar] [CrossRef]
26. Tian Y , Ye Q , Doermann D . Yolov12: attention-centric real-time object detectors. arXiv: 2502.12524. 2025. [Google Scholar] [CrossRef]
27. Liu W , Anguelov D , Erhan D , Szegedy C , Reed S , Fu CY , et al. SSD: single shot MultiBox detector. In: Computer Vision–ECCV 2016. Berlin/Heidelberg, Germany: Springer; 2016. p. 21– 37. doi:10.1007/978-3-319-46448-0_2. [Google Scholar] [CrossRef]
Cite This Article
 Copyright © 2026 The Author(s). Published by Tech Science Press.
This work is licensed under a Creative Commons Attribution 4.0 International License , which permits unrestricted use, distribution, and reproduction in any medium, provided the original work is properly cited.
 Downloads
 Citation Tools