
 Submit a Paper
 Propose a Special lssue
 Open Access
ARTICLE

Presence of Acetogenins in Starches and Pectins Extracted from Soursop (Annona muricata L.) Fruits
1 Programa de Posgrado en Ciencias Biológico-Agropecuarias, Universidad Autónoma de Nayarit, Carretera Tepic-Compostela Km. 9, Xalisco, Nayarit, México
2 Unidad Académica de Agricultura, Universidad Autónoma de Nayarit, Carretera Tepic-Compostela Km. 9, Xalisco, Nayarit, México
3 Laboratorio Integral de Investigación en Alimentos, Instituto Tecnológico de Tepic, Avenida Insurgentes #2595, Colonia Lagos del Country, Tepic, Nayarit, México
4 Unidad de Tecnología de Alimentos, Secretaría de Investigación y Posgrado, Universidad Autónoma de Nayarit, Ciudad de la Cultura S/N, Tepic, Nayarit, México
* Corresponding Author: Andrés Eloy León-Fernández. Email:
(This article belongs to the Special Issue: Advances in the Physiological, Biochemical and Molecular Mechanisms Regulating Fruit Ripening in Tropical Fruits)
Phyton-International Journal of Experimental Botany 2026, 95(2), 9 https://doi.org/10.32604/phyton.2026.076197
Received 16 November 2025; Accepted 20 January 2026; Issue published 28 February 2026
 View Full Text
 Download PDF
Abstract
Acetogenins are lipidic polyketides with antioxidant, antimicrobial, cytotoxic, and antitumor properties, mainly found in the roots, stems, bark, leaves, and fruits (particularly the seeds) of Annonaceae species. Previous studies have identified acetogenins in the peel and pulp of soursop (Annona muricata L.) fruits. In this research, acetogenins present in starch and pectin extracted from these fruits were analyzed and identified, given their potential importance in the pharmaceutical and possibly in the food industries. The objective was to identify and quantify acetogenins in starch and pectin of soursop fruits. Extraction of both polysaccharides was performed using conventional and ultrasound-assisted methods, obtaining two types of pastes (white and brown). These were characterized by Fourier Transform Infrared Spectroscopy (FTIR). Methanolic extracts from the pastes were analyzed by thin-layer chromatography and open-column fractionation. Acetogenins were identified and quantified by high-performance liquid chromatography (HPLC). The compounds identified were pseudoannonacin and anonacin. In pectin, the concentration (μg g−1 of dry basis P/A) of pseudoannonacin was 340.06 (conventional) and 452.80 (ultrasound-assisted), while for anonacin it was 302.29 (conventional) and 397.23 (ultrasound-assisted). In starch, the concentration (μg g−1 of dry basis P/A) of pseudoannonacin was 20.72 (conventional) and 21.60 (ultrasound-assisted), whereas anonacin showed concentrations of 1.63 (conventional) and 3.12 (ultrasound-assisted). These results confirm the presence of anonacin and pseudoannonacin in both starch and pectin of soursop fruits, with pseudoannonacin being the most abundant acetogenin detected.Keywords
The production of soursop (Annona muricata L.) in Mexico reaches 30,122.2 t per year, with Nayarit being the main producer (24,450.69 t; 81.3%), followed by Michoacán (1946 t), Colima (1645 t), and Guerrero (1061 t) [1]. Different parts of the soursop plant leaves, stems, inflorescences, and seeds are used in herbal, cosmetic, and pharmaceutical applications, while the fruits are consumed fresh or processed into desserts [2]. The pulp is a valuable source of vitamins (C and E), minerals (Ca, P, Mg, K, Na, Fe, Zn, Cu, Mn, and B), and phytochemicals such as phenols, flavonoids, phytosterols, alkaloids, and acetogenins [3].
Structural organs of plants store polysaccharides in their cell walls, whose accumulation depends on the species, environmental conditions, and organ type (root, stem, leaf, or fruit). Among these, starch and pectin are polysaccharides of major importance to the food and pharmaceutical industries [4]. Starch has been reported to exhibit potential for applications in food, textile, paper, and electrical insulation industries, due to its biocompatibility, bioactivity, homogeneity, and bioadhesive properties [5,6]. Starch extraction has been performed from several botanical sources such as potato (Solanum tuberosum), maize (Zea mays), wheat (Triticum spp.), sweet potato (Ipomoea batatas), and cassava (Manihot esculenta). Reports also exist on starch characterization from other species, including fruits of banana (Musa spp.), mango (Mangifera indica), and soursop (Annona muricata L.); roots of jicama (Pachyrhizus erosus), carrot (Daucus carota), yam (Dioscorea alata), and oca (Oxalis tuberosa); and seeds of bean (Phaseolus vulgaris), chickpea (Cicer arietinum), jackfruit (Artocarpus heterophyllus), and avocado (Persea americana). These sources represent alternatives to commercial starches due to their high amylopectin content (waxy starches), low syneresis, and ability to form transparent and freeze–thaw stable gels [4,7].
Previous studies on soursop starch have described its morphological, physicochemical, techno-functional, and phytochemical characteristics using well-established analytical techniques; morphological features have been evaluated through optical and scanning electron microscopy, while physicochemical and structural properties have been assessed using X-ray diffraction and differential scanning calorimetry. Thecnofuncional behavior has been analyzed through pasting and rheological measurements, and phytochemical profiles have been explored using Fourier transform infrared spectroscopy (FT-IR) and chromatographic methods [4,8]. Regarding the phytochemicals present in this fruit, phenolic compounds (tannins and flavonoids), phytosterols, alkaloids, and acetogenins have been reported [3]. Qualitative evaluations of soursop starch have revealed the presence of acetogenins [9], and quantitative analyses confirmed the occurrence of phenolic compounds, alkaloids, and acetogenins [8].
In previous studies, the extraction of bioactive compounds from soursop plants has commonly been performed using conventional solid–liquid extraction techniques, employing polar organic solvents or hydroalcoholic systems [3,8]; these approaches are widely used due to their effectiveness in recovering phenolic compounds, acetogenins, and other secondary metabolites of interest from plant-derived materials. Conventional wet milling and ultrasound-assisted extraction have also been widely applied for the recovery of polysaccharides and bioactive compounds from plant matrices, as these techniques enhance cell wall disruption and improve extraction efficiency while preserving compound integrity; in particular, ultrasound-assisted extraction has gained increasing attention in recent years as an efficient and environmentally friendly alternative to conventional extraction methods, as it enhances mass transfer through cavitation effects, improving the recovery of bioactive compounds while reducing extraction time and solvent consumption and preserving thermo-sensitive compounds [10]. These advantages have promoted its application in the extraction of phytochemicals and polysaccharides from plant-derived matrices. Recent studies have specifically highlighted the application of high-intensity ultrasound for pectin extraction, reporting improved yields and modifications in techno functional properties, which support its use as a green and efficient approach for pectin recovery from agri-food matrices [11]. In this study, starch and pectin were extracted from soursop fruits (peel, seeds, and pulp) using both conventional and ultrasound-assisted wet milling methods. Ultrasound-assisted extraction has also been applied to soursop starch, where improvements in extraction efficiency and functional properties have been reported, supporting the feasibility of this technique for starch recovery from Annona muricata fruits [9]. Soursop peels are known to contain a high pectin content which, due to its physicochemical characteristics, has applications as a gelling, thickening, stabilizing, and emulsifying agent, as well as a prebiotic and a source of dietary fiber [12]. In addition, peels have been reported to contain phenolic compounds and acetogenins [8,11,13]. Acetogenins are lipophilic polyketides found in the Annonaceae family, characterized by long aliphatic chains (35–37 carbons), a terminal γ-lactone ring with a methyl α,β-unsaturated moiety, and the presence of tetrahydrofuran (THF) and/or tetrahydropyran (THP) rings [5,12,14]. Their bioactivity depends on their structural features, and they have attracted scientific interest for their antioxidant [14], antibacterial and antifungal [15], pesticidal [16], cytotoxic, and antitumor activities [17].
Previous research has confirmed the presence of acetogenins in soursop starch [8], which has encouraged further investigation not only in starch but also in pectin extracted from soursop fruits. The identification and quantification of these compounds could support their application in the food industry as functional ingredients and as biodegradable materials (edible films and coatings) with biological activity. Recent reviews have highlighted soursop (Annona muricata L.) as a relevant source of bioactive compounds and have summarized extraction approaches and potential applications across fruit tissues (peel, pulp, and seeds) [18]. The objective of this study was to identify and quantify acetogenins present in starch and pectin from soursop fruits.
Soursop (Annona muricata L.) fruits at physiological maturity were harvested according to the ripening index reported by Balois-Morales et al. [19], corresponding to 160 days after anthesis. The harvest took place in the ejido Venustiano Carranza, Tepic, Nayarit, Mexico (21°32′2.77″ N, 104°58′37.73″ W; 893 m a.s.l.).
2.2 Extraction of Polysaccharides
Polysaccharides were extracted from soursop fruits using conventional and ultrasound-assisted wet-milling methods. Fruit grinding and homogenization were performed in an industrial blender (International LI-5a, Mexico) for 3 min using a 1% citric acid solution in a 1:4 (w/v) ratio.
Conventional extraction
The extraction of starch and pectin followed a previously reported methodology [20]. The ground pulp was washed with distilled water and sequentially sieved through 100 mesh (150 μm), 200 mesh (75 μm), and 270 mesh (53 μm) sieves. The remaining bagasse was subjected to a second milling with distilled water in a 1:2 (w/v) ratio for 3 min, followed by the same filtration sequence.
Ultrasound-assisted extraction
The ultrasound-assisted extraction was carried out according to a previously reported method [9,20]. Sonication was performed using an ultrasonic processor (Model CPX750, Cole-Parmer Instruments, Vernon Hills, IL, USA) with a maximum nominal power of 750 W, operated at 40% amplitude (300 W) and a frequency of 20 kHz for 10 min at 25°C. Temperature was monitored using a mercury thermometer. The sonicated bagasse was filtered through 100, 200, and 270 mesh sieves. Subsequently, the residue was milled again with distilled water (1:2 w/v) for 3 min and refiltered.
Separation and drying
For both extraction methods, the liquid phase was allowed to stand for 24 h. The precipitate was recovered by decantation and centrifuged at 1537× g for 5 min at 25°C (Hermle Z326K, Wehingen, Germany) to remove residual liquid. As a result, two pastes were obtained from each extraction method, differing in color (white and brown). These pastes were dried in a recirculation oven (LSIS-B2V/VC 55, Germany) for 24 h at 35°C, ground, and sieved (100 mesh). Samples were then weighed for yield quantification and stored for further analysis.
2.3 Fourier Transform Infrared Spectroscopy (FT-IR)
The dried pastes containing starch and pectin were characterized by Fourier Transform Infrared Spectroscopy (FT-IR) to identify their chemical groups and confirm the presence of polysaccharides.
2.4 Identification and Quantification of Acetogenins
Methanolic extracts were prepared from the dried starch- and pectin-containing pastes, and acetogenins were identified and quantified by High-Performance Liquid Chromatography (HPLC).
2.5 Identification of Functional Chemical Groups by FT-IR
The dried pastes containing starch and pectin were characterized by Fourier transform infrared spectroscopy (FT-IR) to identify functional chemical groups and confirm the presence of polysaccharides. FT-IR spectra were obtained using an ATR-FT-IR spectrophometer (Cary 630 FT-IR, Agilent Technologies, Santa Clara, CA, USA) equipped with a zinc selenide (ZnSe) Crystal. Spectra were recorded in attenuated total reflection (ATR) mode by accumulating 64 scans at resolution of 4 cm−1 over the wavenumber range of 600–4000 cm−1. Commercial corn starch (Sigma-Aldrich, S-4126) and citrus pectin (Genu Pectin, Rapid set, CP Kelco, G51669; DE = 71%) were used as reference standards to identify characteristic functional groups. Data acquisition and analysis were performed using SigmaPlot 14.0 software.
The degree of esterification (DE) was calculated to distinguish low- and high-methoxyl pectins using a previously reported equation [21]:
For nomenclature, the following codes were used: AEC, AEU, PEC, and PEU, where A = starch, P = pectin, C = conventional extraction, and U = ultrasound-assisted extraction (e.g., AEU = starch extracted by ultrasound).
For chromatographic analysis, starch and pectin extracts were prepared to identify and quantify acetogenins. Twenty grams of starch or pectin paste were dispersed in 100 mL of methanol. The suspension was sonicated in an ultrasonic bath (KYMEN® Digital Ultrasonic Cleaner, Model JP-4820, Shenzhen, China) at 35 kHz for eight cycles of 8 min each, with agitation between cycles. The mixture was centrifuged at 1537× g for 5 min at 4°C to recover the liquid phase, followed by a second centrifugation at 6147× g for 10 min at 4°C. The supernatant was filtered through filter paper and concentrated under reduced pressure using a rotary evaporator (IKA®, C-MAG HS7, Wilmington, NC, USA) at 40°C, 80 rpm, and 65 cm Hg [3].
Thin-Layer Chromatography (TLC) and Open-Column Chromatography (OCC)
Acetogenin separation was performed by TLC and OCC. Analytical TLC plates (silica gel 60 F254, 200 μm, 20 × 20 cm, Merck KGaA, Darmstadt, Germany) were used. One mg of dried extract was dissolved in 1 mL of methanol, and 2 μL were spotted on the plate. The mobile phase consisted of chloroform, methanol, ethyl acetate, and acetone (6:1:2:1, v/v). Acetogenins were visualized using Kedde reagent [22], and iodine vapor was used as a universal developer [23].
The Kedde reaction involves the γ-lactone ring of acetogenins reacting with 3,5-hydroxybenzoic acid dissolved in methanol and 5.7% KOH solution, forming an intermediate anion in alkaline medium that nucleophilically adds to 3,5-dinitrobenzoic acid, producing a stable pink anionic complex [24].
The retention factor (Rf) of each acetogenin band was calculated using the equation [25]:
For OCC, 1 g of dried extract was dissolved in 4 g of high-purity silica gel (SiO2; pore size 60 Å, mesh 70–230, catalog 7734) and loaded onto an open glass column (6.4 × 57 cm) packed with 100 g of SiO2 (mesh 60). Elution began with the same solvent mixture (chloroform:methanol:ethyl acetate:acetone, 6:1:2:1 v/v/v/v), gradually increasing polarity until reaching 100% methanol. Fractions of 50 mL were collected and concentrated under vacuum (IKA®, C-MAG HS7, 40°C, 80 rpm, 65 cm Hg). Aliquots (2 μL) of each fraction were analyzed by TLC (5 × 5 cm silica plates, HX312859, Germany) to determine the presence or absence of acetogenins using Kedde reagent [26] and Rf values [25]. Fractions with identical Rf values were pooled, and those showing more intense pink coloration were selected, as greater color intensity correlates with higher acetogenin content [26].
These fractions were resuspended in methanol (HPLC grade) and further purified using a 10 mL glass column (funnel type 14/23) packed with 4 g of SiO2 (mesh 60) and pre-conditioned with a dichloromethane:ethyl acetate (1:1 v/v) mixture, eluting with pure methanol to remove pigments. The resulting fractions were checked again by TLC, and acetogenin-positive fractions were pooled, evaporated to dryness, and used for HPLC-DAD analysis.
2.7 Identification and Quantification of Acetogenins by HPLC-DAD
Identification and quantification of acetogenins were performed following the methodology of López-Romero et al [27]. Purified acetogenic fractions were resuspended in HPLC-grade methanol and filtered through 0.22 μm nylon membrane filters (Thermo Scientific, Shanghai, China).
Samples were injected into an HPLC system (Agilent Technologies 1260 Infinity, Waldbronn, Germany®) equipped with a diode-array detector (DAD) and a reverse-phase C18 column (5 μm particle size, 4.6 mm × 250 mm, Agilent Zorbax SB-C18) at 20°C. The mobile phase consisted of methanol (Eluent A) and water (Eluent B) under a linear gradient: 0–40 min, 85:15 (v/v, methanol:water), 40–60 min, 95:5 (v/v, methanol:water) at a flow rate of 1 mL min−1.
Acetogenins were detected at 220 nm. Quantification was based on calibration curves prepared with two standards (anonacin and pseudoannonacin). Results were expressed as micrograms of anonacin/pseudoannonacin equivalents per gram of dry sample (μg anonacin/pseudoannonacin g−1 d.b.).
A completely randomized design a 2 × 2 factorial arrangement (extraction method x polysaccharide phase) was used. Four treatments were evaluated: starch and pectin obtained by conventional and ultrasound-assisted extraction. All analyses were performed in triplicate (n = 3 independent extractions per treatment), and the experimental unit corresponded to each independent extraction. Data were analyzed using a two-way analysis of variance (ANOVA), and mean comparisons were performed using Tukey’s multiple comparison test (p ≤ 0.05). Statistical analyses were conducted using SAS® software (version 9.2).
3.1 Identification of Functional Chemical Groups by FT-IR
FT-IR analysis of the starch samples revealed characteristic absorption bands corresponding to the stretching vibrations of OH groups (3275.2 cm−1) and CH groups (2908.5 cm−1), as well as CH bending vibrations (1329.1 cm−1). The fingerprint region showed bands at 1148.5, 1072.2, 987.7, 930, and 855.4 cm−1, corresponding to polysaccharide structures consistent with the standard starch spectrum (Fig. 1A). For pectin, absorption bands were observed corresponding to OH stretching (3267.1 cm−1), symmetric and asymmetric stretching of CH, CH2, and CH3 groups (2916.6 cm−1), and esterified and free C=O stretching vibrations (1732.2 and 1636 cm−1, respectively). The fingerprint region exhibited bands at 1147.1, 1074.0, 1036.3, 968.4, and 855.4 cm−1, consistent with the standard pectin spectrum (Fig. 1B). Additionally, the identified pectin presented a degree of esterification (DE) of 39.9%, classifying it as low-methoxyl pectin.
3.2 Thin-Layer Chromatography (TLC)
TLC results of starch and pectin extracts (PEU, PEC, AEU, and AEC) showed pink bands upon reaction with Kedde reagent, indicating the presence of acetogenins. Pectin extracts exhibited seven bands, with Rf values ranging from 0.11 to 0.80 (PEU) and from 0.11 to 0.82 (PEC). In addition to acetogenins, other pigments were observed that may have influenced the reduction of Rf values (Fig. 2A,B). Starch extracts presented Rf values from 0.17 to 0.89 (AEC) and 0.17 to 0.91 (AEU), with no visible presence of other pigments (Fig. 2C,D). Among all samples, PEU and PEC extracts exhibited lower Rf values compared to AEU and AEC.
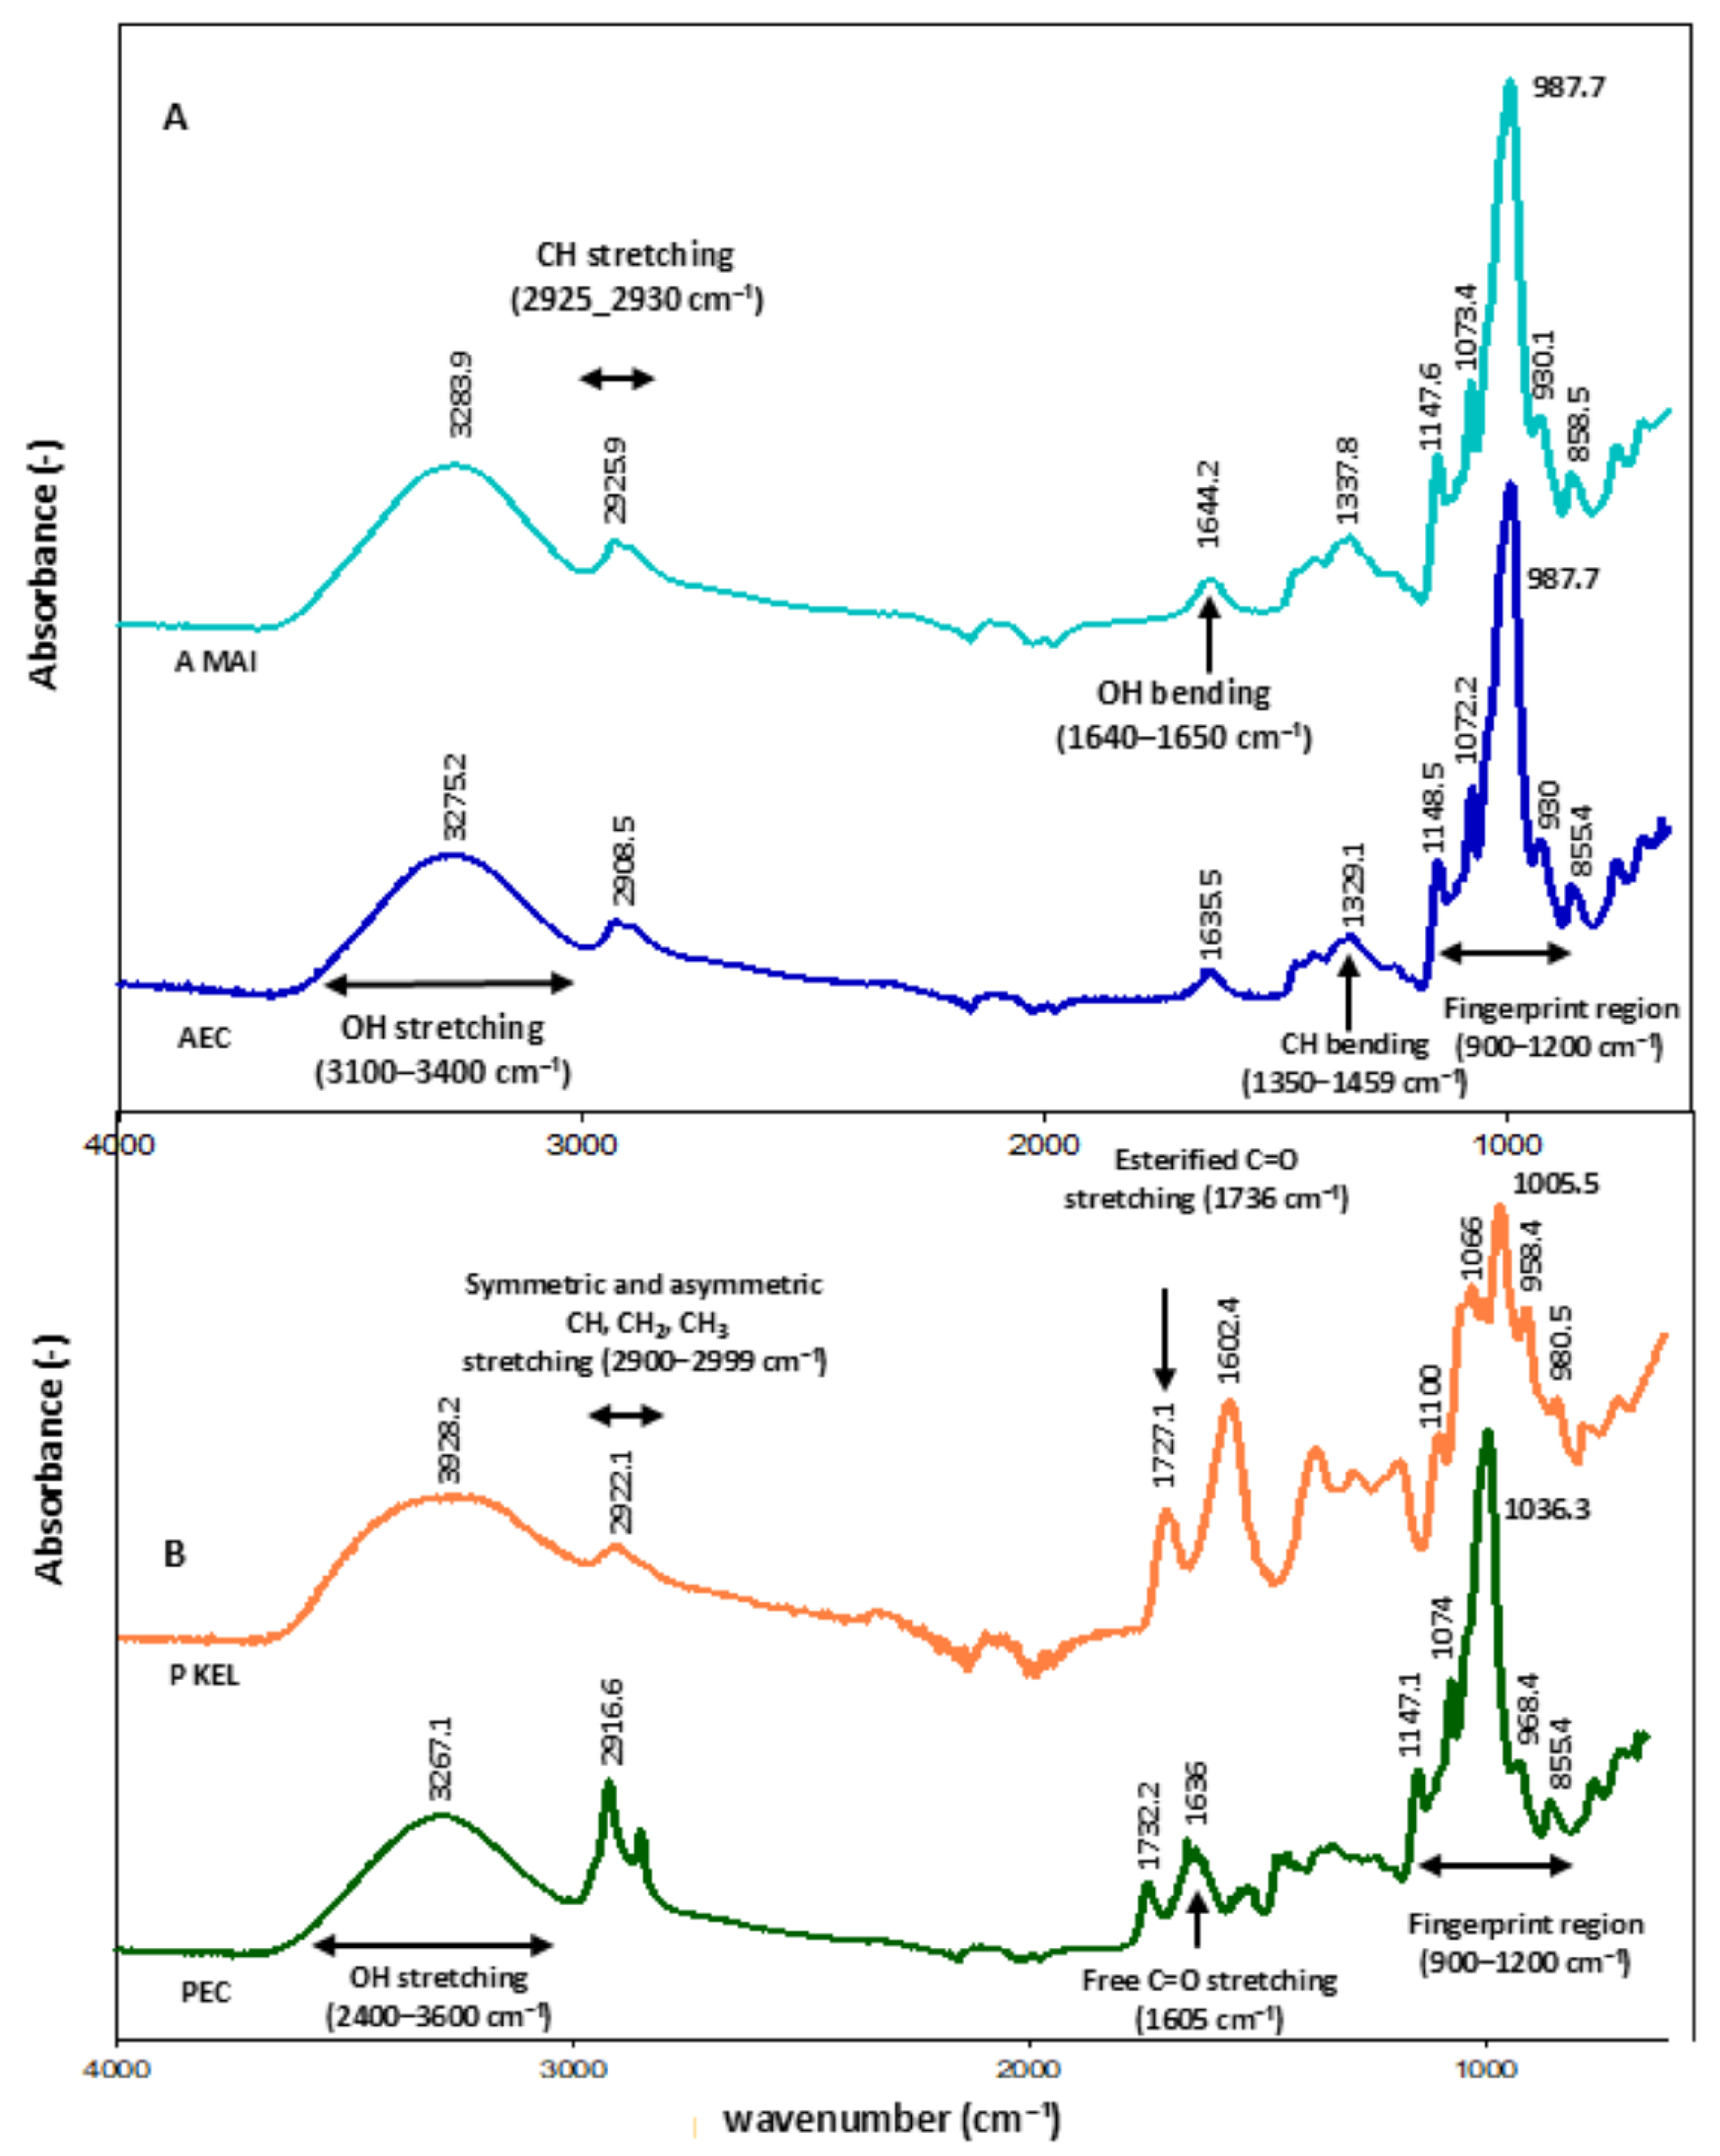
Figure 1: FT-IR spectra of starch (A) and pectin (B) extracted from soursop fruits. AMAI = maize starch (standard), AEC = starch obtained by conventional extraction, PKEL = citrus pectin (standard), PEC = pectin obtained by conventional extraction.
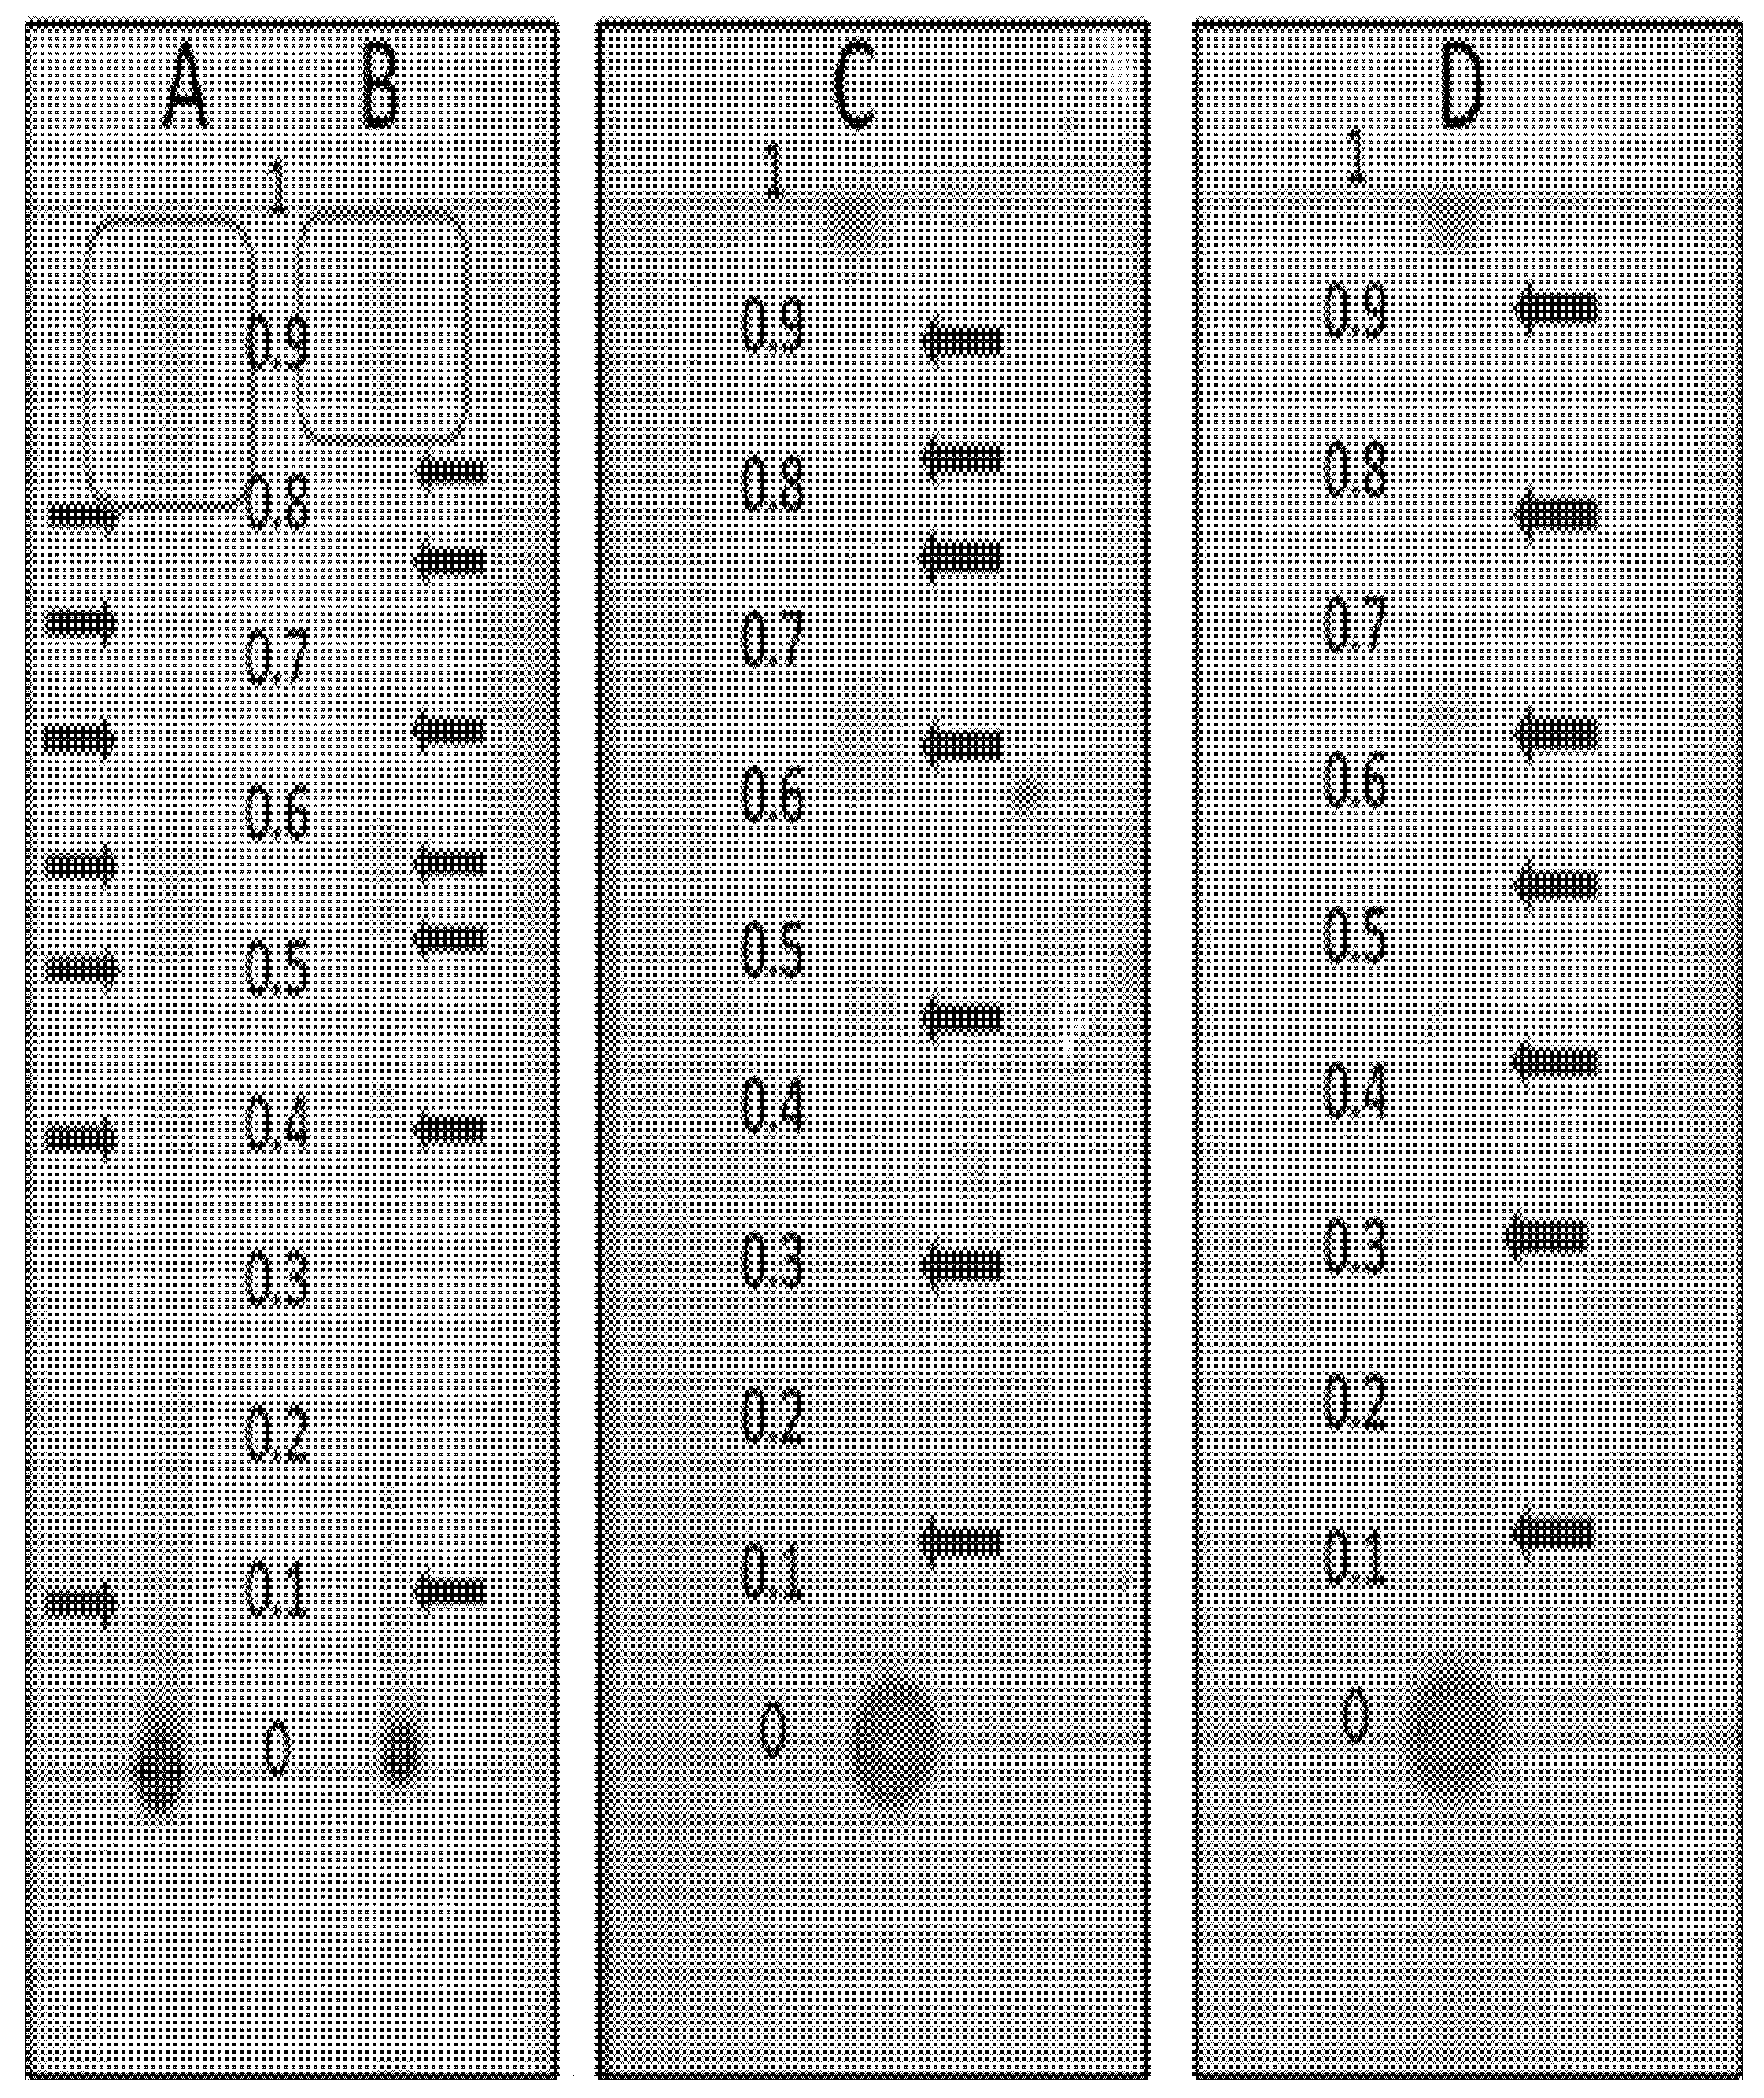
Figure 2: Thin-layer chromatography of starch and pectin extracts developed with Kedde reagent. PEU (A), PEC (B), AEC (C), and AEU (D).
3.3 Isolation of Acetogenins by Open-Column Chromatography (OCC)
From the pectin extracts, a total of 70 fractions were obtained and grouped according to Rf values into 14 (PEU) and 9 (PEC) fraction groups: PEU: G1 (F1–F2), G2 (F3), G3 (F4), G4 (F5–F8), G5 (F9–F14), G6 (F15–F28), G7 (F29–F70) (Fig. 3A), PEC: G1 (F1–F2), G2 (F3–F4), G3 (F5), G4 (F6–F7), G5 (F8–F10), G6 (F11–F31), G7 (F32–F70) (Fig. 3B), For starch extracts, 20 fractions were obtained from AEU and 31 from AEC: AEU: G1 (F1), G2 (F2), G3 (F3), G4 (F4–F7), G5 (F8), G6 (F9–F16), G7 (F17–F20) (Fig. 3C), AEC: G1 (F1–F2), G2 (F3), G3 (F4), G4 (F5–F6), G5 (F7), G6 (F8–F26), G7 (F27–F31) (Fig. 3D). Fractions G3 (PEU), G4 (PEC), G4 (AEU), and G3 (AEC) showed the highest color intensity in the Kedde reaction, confirming a greater concentration of acetogenins (Fig. 3). The presence of acetogenins was detected in both starch and pectin extracts.
3.4 Identification and Quantification of Acetogenins by HPLC-DAD
Two acetogenins—anonacin and pseudoannonacin—were identified in the G3 (PEU), G4 (PEC), G4 (AEU), and G3 (AEC) fractions (Fig. 4). The concentration of anonacin in pectin extracts was 397.23 μg g−1 d.b. (PEU) and 302.29 μg g−1 d.b. (PEC), while in starch extracts it was 3.12 μg g−1 d.b. (AEU) and 1.63 μg g−1 d.b. (AEC) (Table 1). The concentration of pseudoannonacin in pectin extracts was 452.81 μg g−1 d.b. (PEU) and 340.07 μg g−1 d.b. (PEC), whereas in starch extracts it was 21.61 μg g−1 d.b. (AEU) and 20.73 μg g−1 d.b. (AEC) (Table 2).
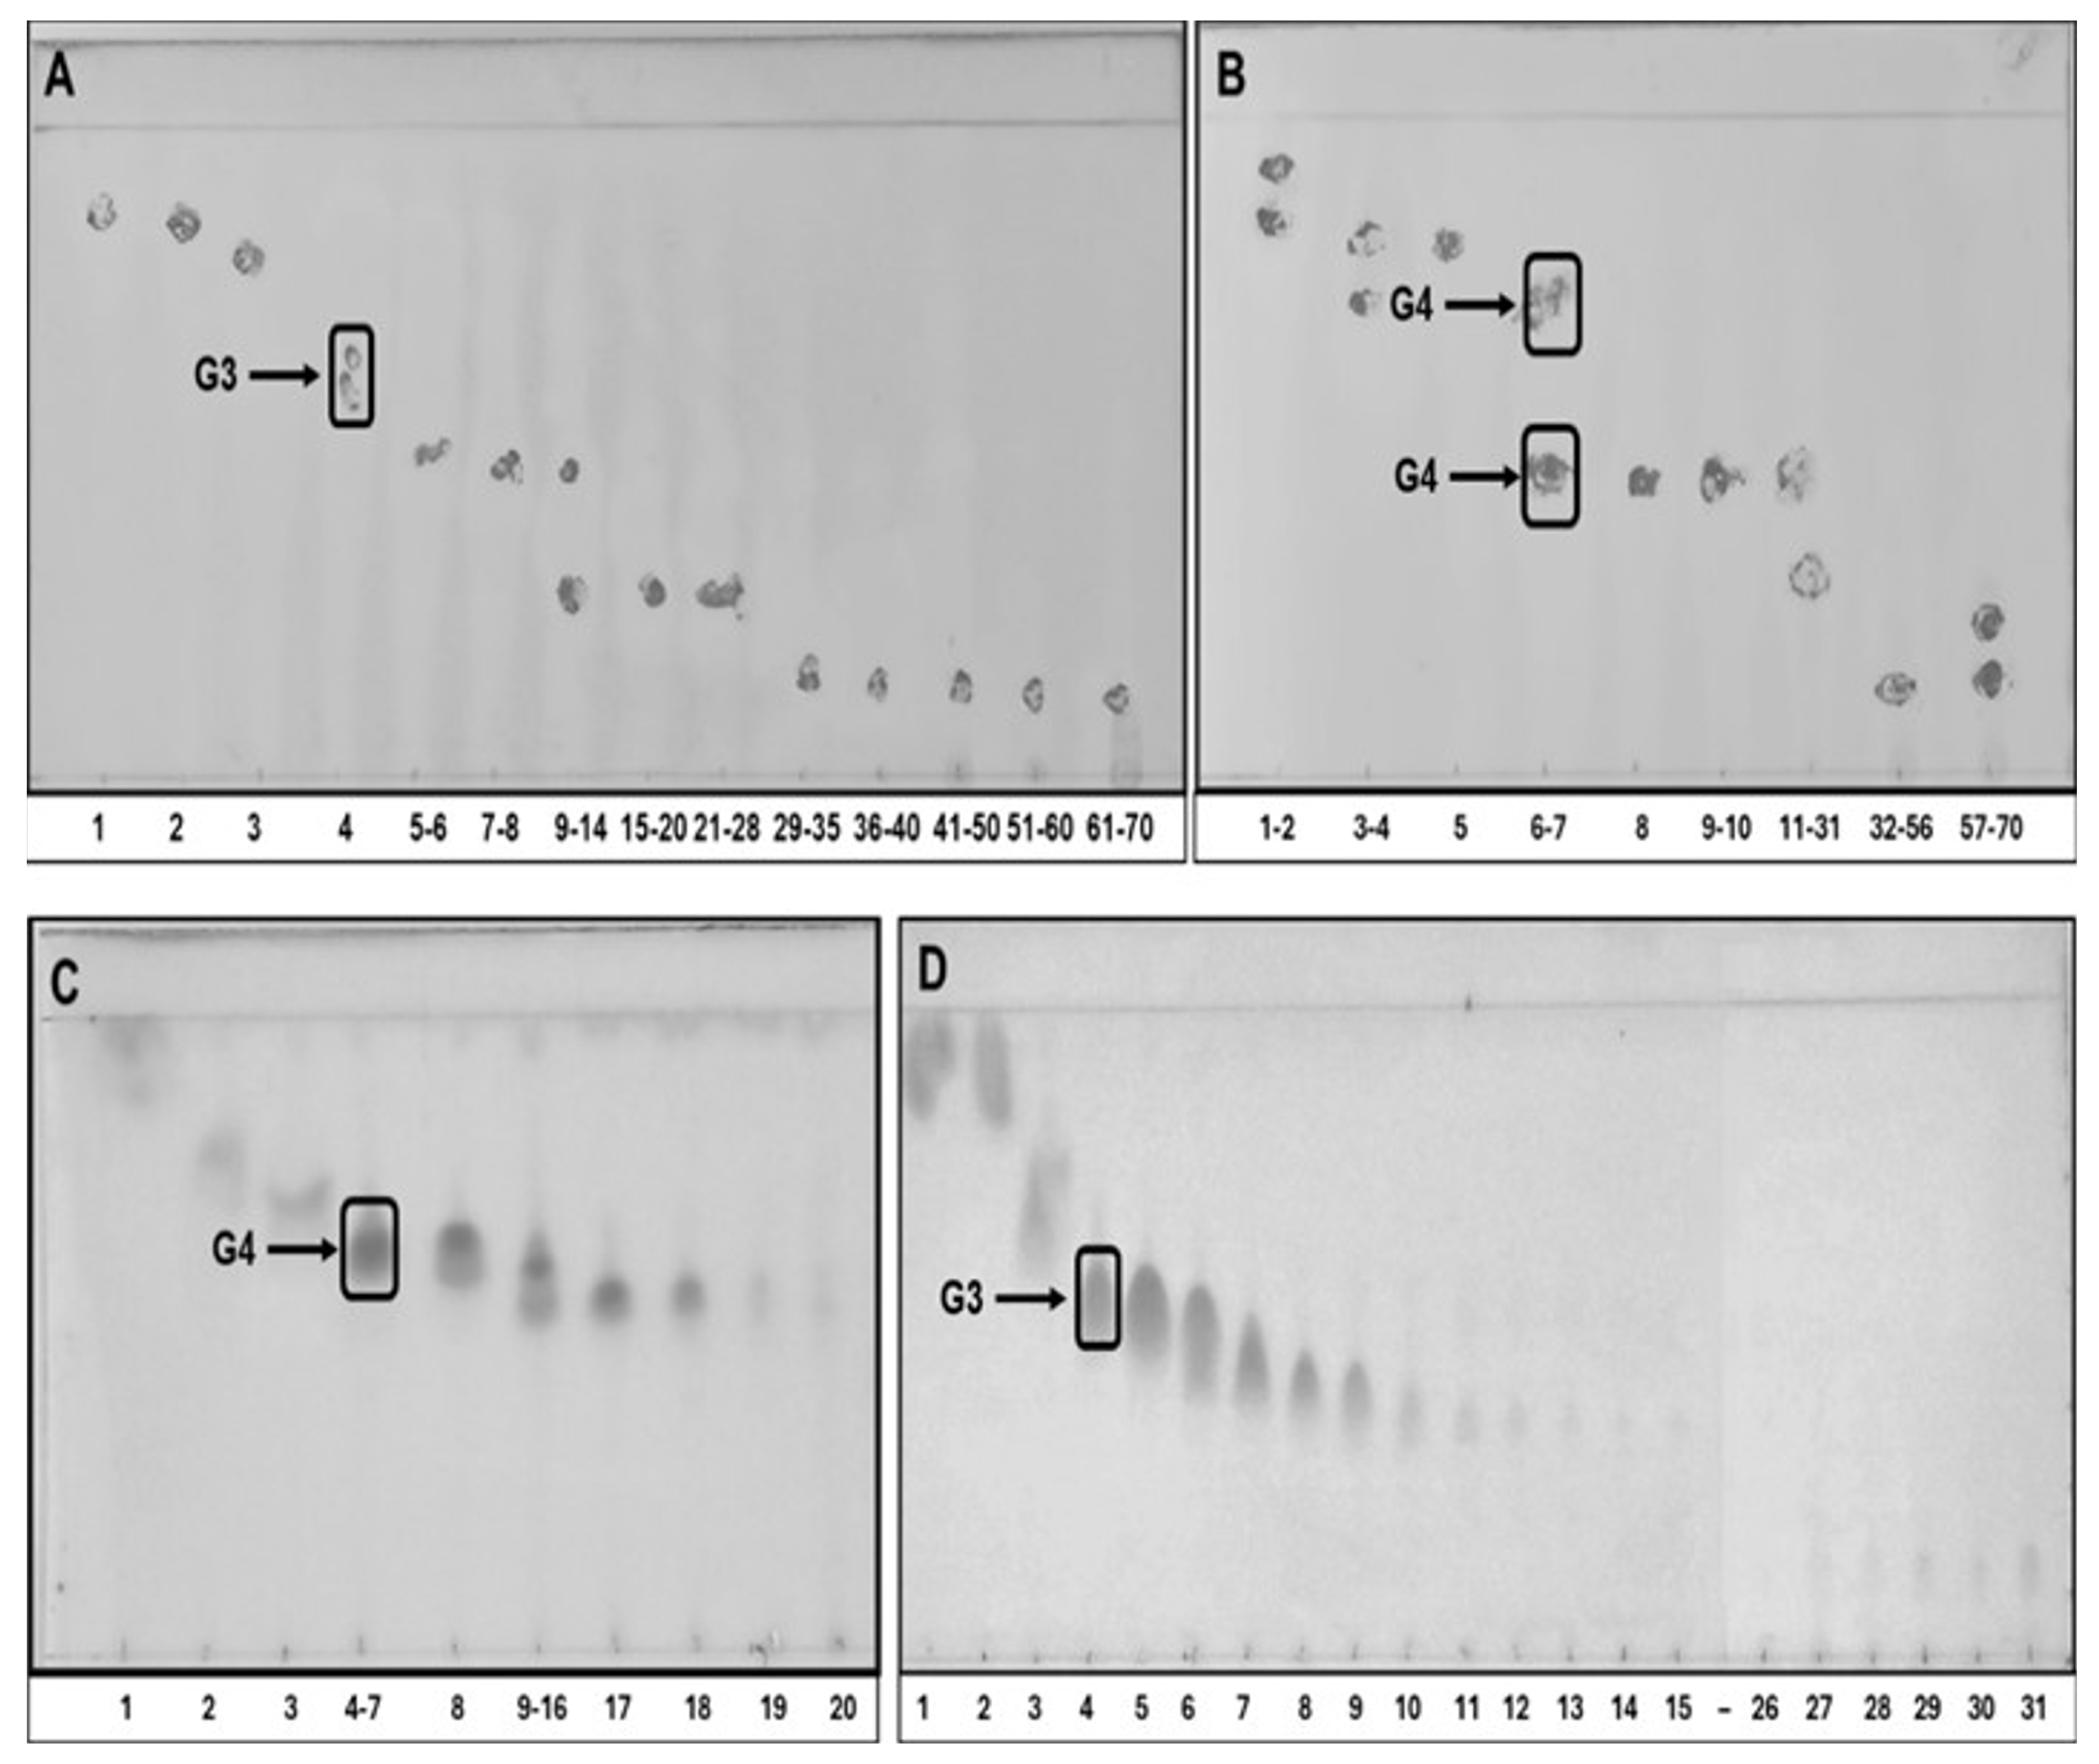
Figure 3: Thin-layer chromatography of acetogenic fractions isolated from starch and pectin extracts, developed with Kedde reagent. PEU (A), PEC (B), AEU (C), and AEC (D).
Table 1: Quantification of Annonacin in pectin and starch extracts from soursop fruits obtained by conventional and ultrasound-assisted extraction.
| Polysaccharide | Fraction | Acetogenin | Λ (nm) | Rt (min) | μg g1 d.b. (Mean ± SD) |
|---|---|---|---|---|---|
| PEC | F6–7 | Annonacin | 220 | 26.5 | 302.29 ± 3.70a |
| PEU | F4 | Annonacin | 220 | 27 | 397.23 ±5.30a |
| AEC | F4 | Annonacin | 220 | 26.2 | 1.63 ± 0.05c |
| AEU | F4–7 | Annonacin | 220 | 26.2 | 3.12 ± 0.02c |
| DMS | 13.2 | ||||
| CV | 1.85 |
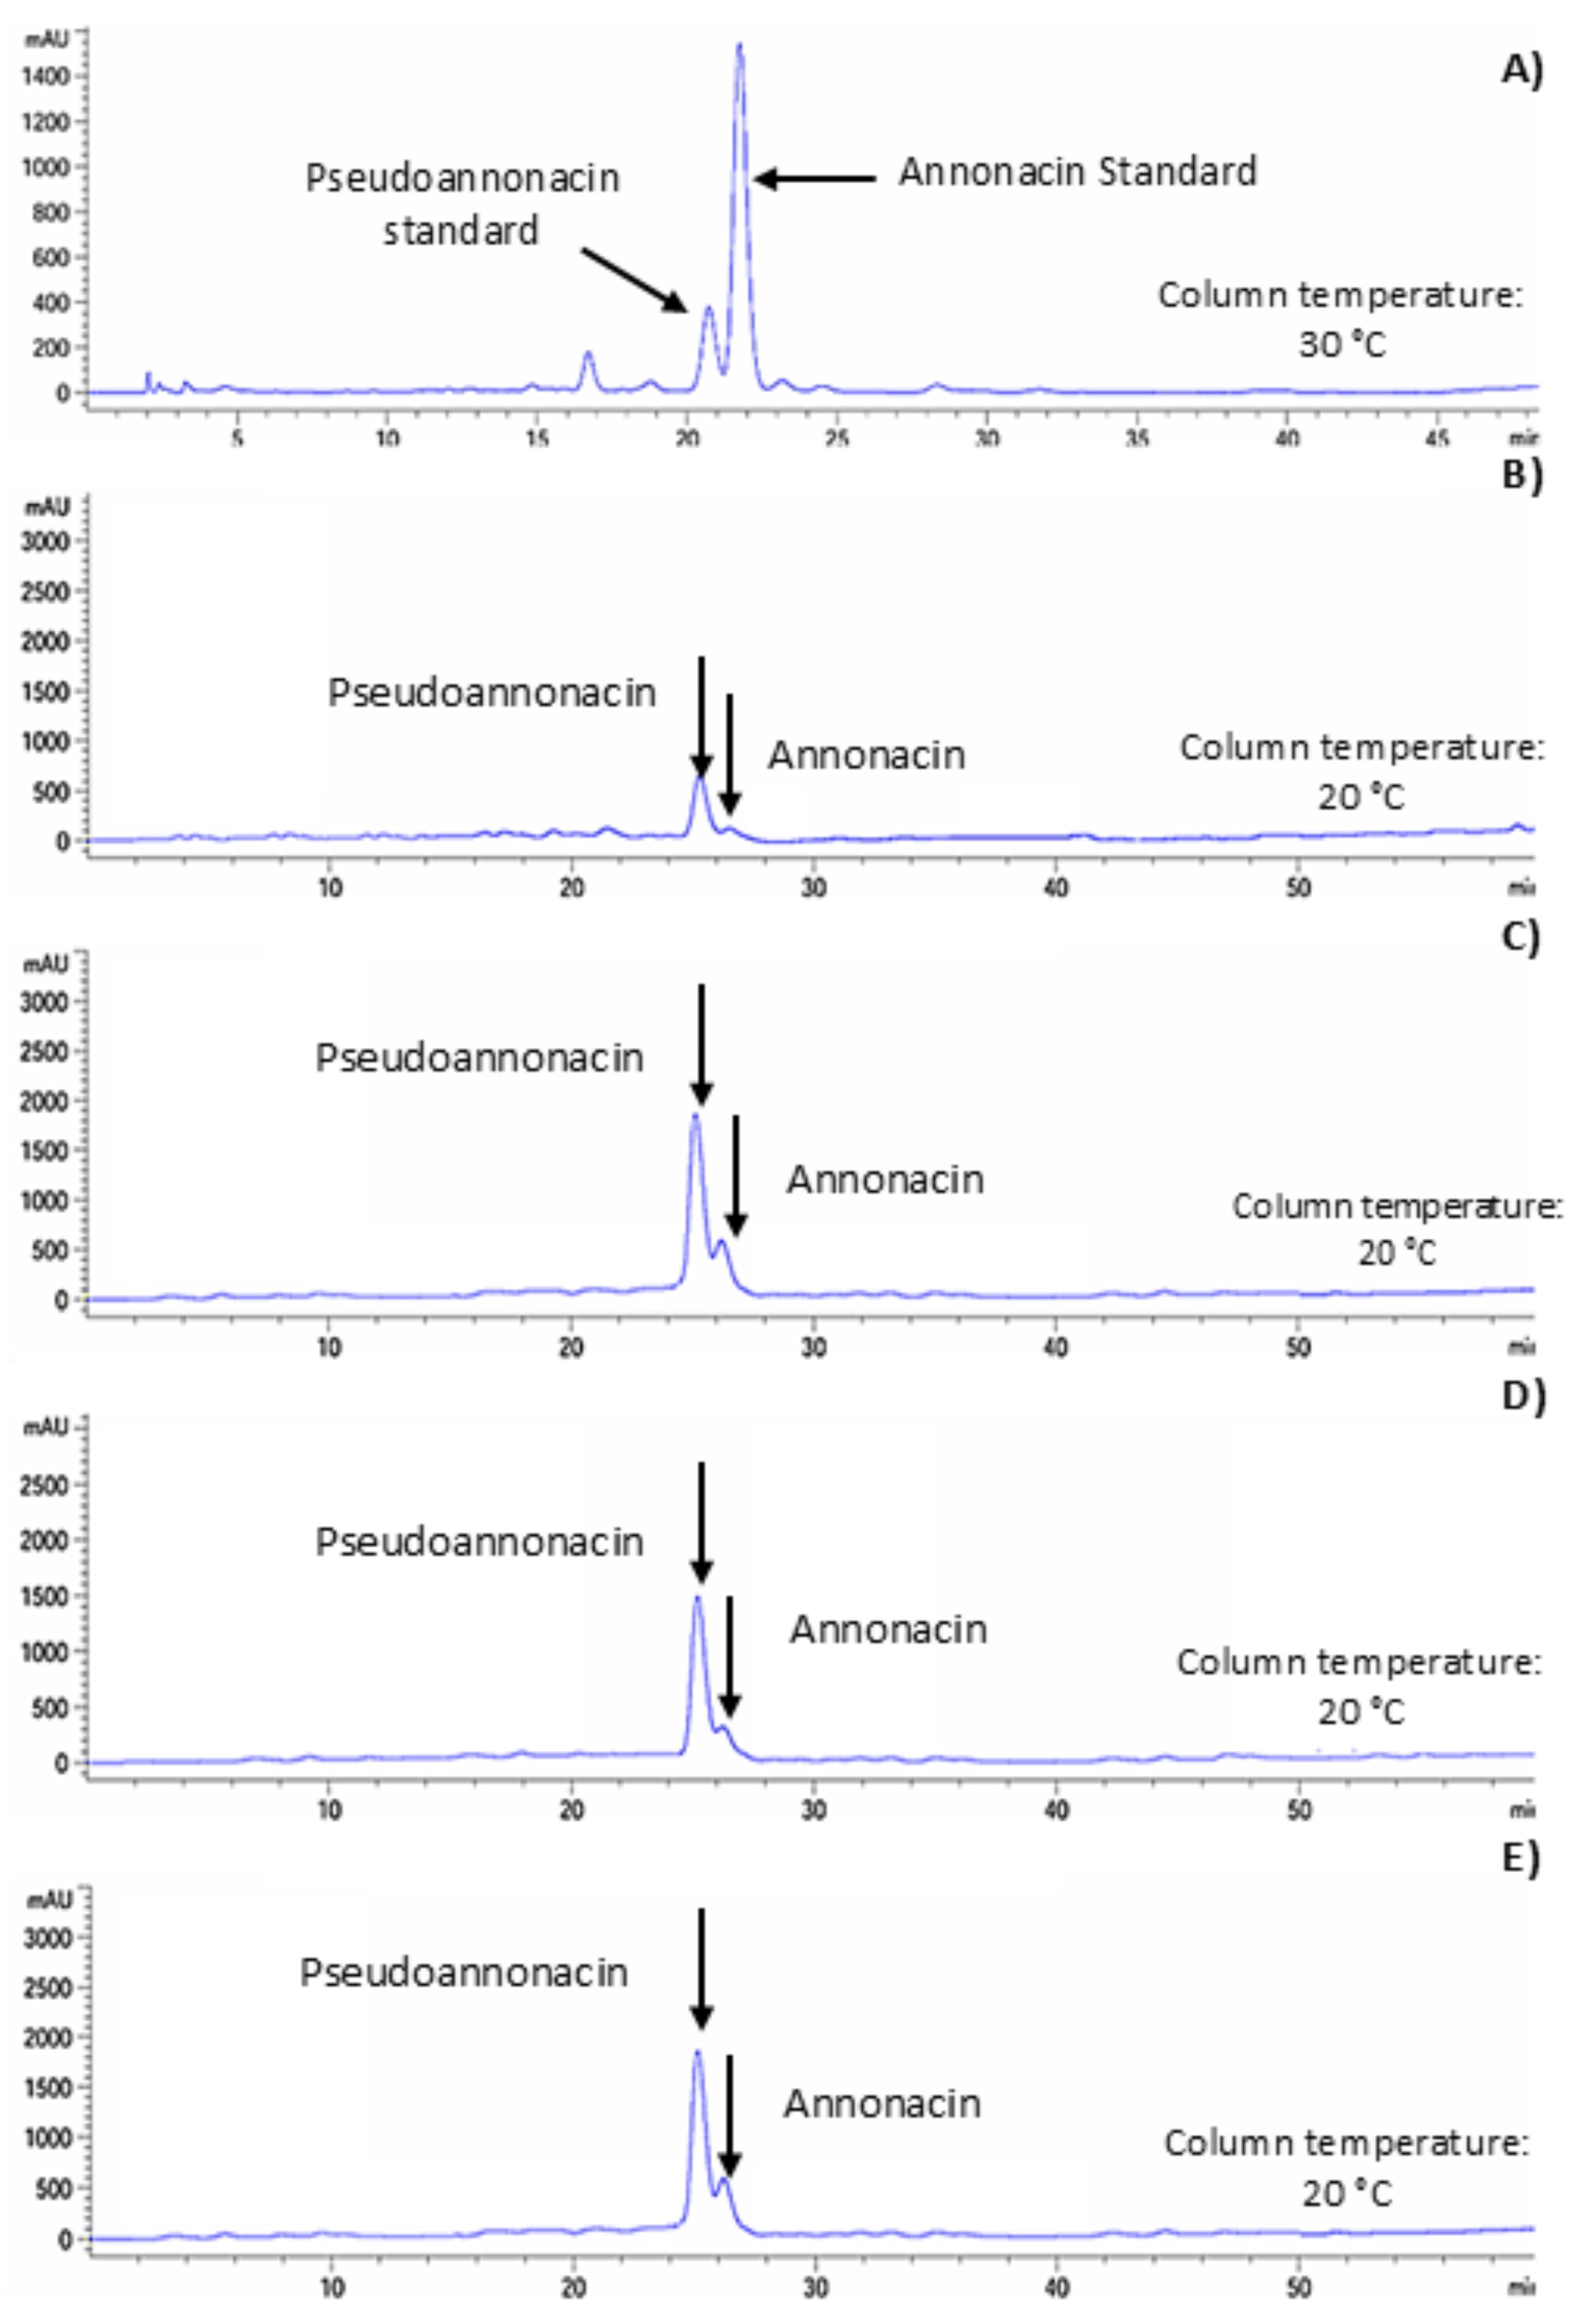
Figure 4: Representative HPLC chromatograms of standard acetogenins (A) and those isolated from starch and pectin extracts: PEC (B), PEU (C), AEC (D), and AEU (E).
Table 2: Quantification of Pseudoannonacin in pectin and starch extracts from soursop fruits obtained by conventional and ultrasound-assisted extraction.
| Polysaccharide | Fraction | Acetogenin | Λ (nm) | Rt (min) | μg g1 d.b. (Mean ± SD) |
|---|---|---|---|---|---|
| PEC | F6–7 | Pseudoannonacin | 220 | 25.3 | 340.07 ± 0.60b |
| PEU | F4 | Pseudoannonacin | 220 | 25.8 | 452.81 ± 0.38a |
| AEC | F4 | Pseudoannonacin | 220 | 25.2 | 20.73 ± 0.22c |
| AEU | F4–7 | Pseudoannonacin | 220 | 25.1 | 21.61 ± 0.15c |
| DMS | 1.57 | ||||
| CV | 0.18 |
4.1 Identification of Functional Chemical Groups by FT-IR
The absorption bands in the 3.000–3.600 cm−1 region are attributed to the stretching of OH groups, which are related to intra- and intermolecular hydrogen bonds, whereas the stretching vibrations observed between 2.891–2.925 cm−1 correspond to CH groups [28]. Pourfarzad et al. [29] reported that the wavenumber at 1.640 cm−1 is associated with moisture content and arises from the stretching vibrations of water molecules absorbed by amylose. Starches exhibit characteristic peaks (fingerprint region) in the 800–1.300 cm−1 range, which are sensitive to conformational and crystalline order. These peaks are assigned to stretching vibrations of CO, CC, and COH bonds, as well as COH bending [30,31]. In soursop starches, in addition to the typical functional groups of starch, additional bands between 1.200 and 1.700 cm−1 were observed, which, according to Warren et al. [31], correspond to minor components such as protein and lipid residues. Regarding soursop pectin, peaks in the 3.140–3.400 cm−1 region are associated with OH stretching, while those near 2.900 cm−1 correspond to CH and CH2 stretching [28]. Santos et al. [32], studying pectins extracted from industrial residues, reported that the key peaks in pectin structure are those representing the degree of esterification, appearing in the 1.600–1.750 cm−1 region, indicative of free and esterified carboxyl groups. Wavenumbers below 1.500 cm−1 correspond to the fingerprint region, which includes complex vibrational interactions of functional groups present in pectin (800–1.200 cm−1) [28]. The pectin identified in this study was classified as low-methoxyl, with a degree of esterification (DE) below 50%, consistent with the classification proposed by Rascón-Chu et al. [33].
4.2 Thin-Layer Chromatography (TLC)
The different retention factors (Rf) observed in the chromatographic bands of pectin and starch extracts are likely due to the higher content of phytochemicals in pectins compared to starches [8]. These authors reported high levels of phenols, phytosterols, and alkaloids in soursop fruits, which could interfere with acetogenin migration on the TLC plate, reducing their Rf values. Furthermore, since soursop peel contains a high amount of pectin, pigment residues may remain in this polysaccharide. Meléndez-Martínez et al. [34], reported that pigments present in fruit peels are highly soluble in organic solvents such as chloroform (a low-polarity compound), resulting in higher Rf values that can interfere with acetogenin band migration. Variations in Rf values observed among TLC bands can also be attributed to differences in the functional groups of the acetogenin molecules present in the extracts, such as hydroxyl (–OH), keto (C=O), and ether (–O–) groups [25]. Fernández [35] stated that such structural characteristics confer intermediate polarity to acetogenins, which are soluble in chloroform, dichloromethane, and ethyl acetate, and highly soluble in methanol and ethanol. Additionally, differences in band color intensity—where PEU and PEC extracts exhibited lower intensity than starch extracts (Fig. 2) may be associated with the higher content of total lipids (4.03% and 2.4%), phytosterols (3.55 and 2.09 mg EC g−1 pectin d.b.), and acetogenins (1.5 and 1.8 mg EAn g−1 pectin d.b.) in pectin phases [8]. The high content of these compounds may interfere with the colorimetric Kedde reaction, since the alkaline medium (KOH) promotes lipid saponification [36].
4.3 Isolation of Acetogenins by Open-Column Chromatography (OCC)
Open-column chromatography allows the separation of different acetogenic fractions. These molecules are polyketide-derived compounds that are highly soluble in organic solvents such as methanol, acetone, ethanol, ethyl acetate, chloroform, and dichloromethane, but insoluble in hexane, acetonitrile, petroleum ether, and water [30].
Thus, mobile phases composed of mixed solvents can be used to isolate acetogenins according to their polarity. The different Rf values obtained in this study suggest the presence of acetogenins with distinct structural features, depending on the type and number of functional groups—such as hydroxyl (OH), lactone, unsaturation, and furan rings [25]. Acetogenins containing hydroxyl groups are more polar and can form hydrogen bonds with the SiO2 of the chromatographic plate, resulting in lower Rf values. In contrast, those containing carbonyl (C=O) groups are less polar and yield higher Rf values [26,37]. The presence of alcohol, epoxide, and alkene groups modifies molecular polarity and, consequently, the retention factor, while solvent composition during purification can also affect migration [38,39]. Differences among acetogenin Rf groups may further relate to the fruit tissues of origin (peel, seed, or pulp) [26]. Based on these findings, it is likely that PEU and PEC correspond to peel- and seed-derived structures, whereas AEC and AEU originate mainly from pulp tissues [8,40]. In this study, the acetogenic fraction groups that exhibited greater pink color intensity in the Kedde reaction were confirmed by HPLC-DAD analysis. According to Aguilar-Hernández et al. (2022), a stronger pink coloration corresponds to higher acetogenin content, as the lactone rings of acetogenins react with 3,5-dinitrobenzoic acid in alkaline medium (KOH), forming a stable pink complex. The higher acetogenin content in pectins likely reflects their origin from seed and peel tissues [8], consistent with results reported by Aguilar-Hernández et al. [26] and López-Romero et al. [27] for soursop seeds and pulp. The ultrasound-assisted extraction method increased acetogenin yield, likely due to ultrasonic cavitation, which causes cell wall disruption through microbubble formation, growth, and collapse, releasing energy into the medium. This process enhances solvent penetration and contact surface area, improving extraction efficiency [41]. The lower acetogenin concentrations observed in starches (AEU and AEC) may result from washing during purification and from their origin in the pulp, which contains fewer acetogenins [15]. In contrast, acetogenins are synthesized mainly in the peel and seed tissues [26,42]. Recent studies have highlighted the potential of ultrasound-assisted extraction and advanced chromatographic techniques for improving the recovery and characterization of acetogenins and other bioactive compounds from plant-derived polysaccharides [26,27,41].
4.4 Identification and Quantification of Acetogenins by HPLC-DAD
Annonacin and pseudoannonacin were the predominant acetogenins identified in both starch and pectin fractions. These structurally similar molecules differ at the C15 carbon atom [26]. Annonacin is a mono-THF α,α′-dihydroxylated acetogenin, whereas pseudoannonacin is a ketonic tetra- or trihydroxylated acetogenin [43]. A key feature of these acetogenins is their long nonpolar chain, which may allow them to form amylose–lipid complexes in starch, since amylose adopts a helical structure capable of incorporating free fatty acids [44]. Such complexes may form during extraction, particularly under ultrasound-assisted conditions, where the localized temperature increase caused by cavitation may promote complex formation and enhance acetogenin recovery. The acetogenin concentrations (μg mg−1) obtained in this study were lower than those reported by López-Romero et al. [27], who quantified pseudoannonacin (350 mg g−1) and annonacin (15 mg g−1) from soursop seeds. This difference likely arises because, in polysaccharides such as pectins and starches, acetogenins are bound as polar lipids (via hydrogen bonding) that require polar solvents (e.g., methanol–water) for extraction, as applied in this study. In contrast, higher concentrations occur in specialized idioblast cells, where acetogenin biosynthesis takes place, primarily in the seeds and peel of soursop fruits [45].
Annonacin and pseudoanonacin were identified in starch and pectin extracted from soursop (Annona muricata L.) fruits, confirming the presence of acetogenins in polysaccharide-rich fractions. Pectin extracts showed significantly higher concentrations of both compounds compared to starch, with pseudoanonacin being the most abundant acetogenin in all samples. Ultrasound-assisted extraction significantly enhanced the recovery of annonacin and pseudoanonacin, particularly in pectin fractions, highlighting the influence of the extraction method on acetogenin yield. These findings demonstrate that soursop-derived polysaccharides may act as carriers of bioactive compounds, supporting their potential application in food, pharmaceutical, and functional material development.
Acknowledgement:
Funding Statement: This research was funded by the Sectoral Fund for Research in Agricultural, Livestock, Aquaculture, Agrobiotechnology, and Plant Genetic Resources (SADER-SECIHTI) Number 266891; and the Sectoral Fund for Research for Education (SEP-SECIHTI) Number 242718.
Author Contributions: The authors confirm contribution to the paper as follows: study conception and design: Andrés Eloy León-Fernández, Miguel Ángel De los Santos-Santos; data collection: Rosendo Balois-Morales, Efigenia Montalvo-González; analysis and interpretation of results: Juan Esteban Bello-Lara, José Orlando Jiménez-Zurita; draft manuscript preparation: Guillermo Berumen-Varela, Carlos Azhael Rodríguez-Guzmán, Graciela Guadalupe López-Guzmán. All authors reviewed and approved the final version of the manuscript.
Availability of Data and Materials: The authors confirm that the data supporting the findings of the study are available within the article.
Ethics Approval: This study did not involve human participants or animal subjects.
Conflicts of Interest: The authors declare no conflicts of interest.
References
1. Servicio de Información Agroalimentaria y Pesquera (SIAP) . Anuario estadístico de la producción agrícola. Ciudad de México, México: Secretaría de Agricultura y Desarrollo Rural; 2023. (In Spanish). [Google Scholar]
2. Virgen-Ceceña LJ , Anaya-Esparza LM , Coria-Téllez AV , de Lourdes García-Magaña M , García-Galindo HS , Yahia E , et al. Evaluation of nutritional characteristics and bioactive compounds of soursop-yoghurt and soursop-frozen dessert. Food Sci Biotechnol. 2019; 28( 5): 1337– 47. doi:10.1007/s10068-019-00584-x. [Google Scholar] [CrossRef]
3. León-Fernández AE , Balois Morales R , Bautista-Rosales PU , Palomino-Hermosillo YA , Bello-Lara JE , López-Rivas CE . Extracción de compuestos fitoquímicos de inflorescencia y frutos de guanábana (Annona muricata L.). Acta Agric Pecu. 2021; 7( 1): e007102. (In Spanish). doi:10.30973/aap/2021.7.0071021. [Google Scholar] [CrossRef]
4. Martínez-Ortiz MA , León-Fernández AE , Bello-Lara JE , Berumen-Varela G , Bautista-Rosales PU , Jiménez-Zurita JO , et al. Tropical fruit starches and their application in the food industry: mango, banana, cherimoya and soursop. A review. Rev Int Investig Innov Tecnol. 2022; 10( 1): 1– 13. [Google Scholar]
5. Mohanta B , Sen DJ , Mahanti B , Nayak AK . Recent advances in the extraction, purification, and antioxidant activities of fruit polysaccharides: a review. Food Hydrocoll Health. 2023; 4: 100163. doi:10.1016/j.fhfh.2023.100163. [Google Scholar] [CrossRef]
6. Nayak AK , Hasnain MS , Dhara AK , Pal D . Plant polysaccharides in pharmaceutical applications. In: Pal D , Nayak AK , editors. Bioactive natural products for pharmaceutical applications. Cham, Switzerland: Springer; 2020. p. 93– 125. doi:10.1007/978-3-030-54027-2_3. [Google Scholar] [CrossRef]
7. Nwokocha LM , Williams PA . New starches: physicochemical properties of sweetsop (Annona squamosa) and soursop (Anonna muricata) starches. Carbohydr Polym. 2009; 78( 3): 462– 8. doi:10.1016/j.carbpol.2009.05.003. [Google Scholar] [CrossRef]
8. De-los-Santos-Santos MA , Balois-Morales R , Bello-Lara JE , León-Fernández AE , Jiménez-Zurita JO , Bautista-Rosales PU , et al. Phytochemical compounds in starches from soursop fruits (Annona muricata L.). Rev BioCiencias. 2023; 10: e1502. doi:10.15741/revbio.10.e1502. [Google Scholar] [CrossRef]
9. Ramírez-Balboa G , Balois-Morales R , Bello-Lara JE , Bautista-Rosales PU , León-Fernández AE , López-Guzmán GG , et al. Ultrasound-assisted extraction and characterization of the functional properties of starch from soursop fruits (Annona muricata L.). Acta Sci Technol. 2021; 43: e49052. doi:10.4025/actascitechnol.v43i1.49052. [Google Scholar] [CrossRef]
10. Shen L , Pang S , Zhong M , Sun Y , Qayum A , Liu Y , et al. A comprehensive review of ultrasonic assisted extraction (UAE) for bioactive components: principles, advantages, equipment, and combined technologies. Ultrason Sonochem. 2023; 101: 106646. doi:10.1016/j.ultsonch.2023.106646. [Google Scholar] [CrossRef]
11. Hernández-Hernández O , Ferreira-Lazarte A , Tiwari B , Villamiel M . Update of high-intensity ultrasound applications for the extraction of pectin from agri-food by-products. Trends Anal Chem. 2024; 175: 117728. doi:10.1016/j.trac.2024.117728. [Google Scholar] [CrossRef]
12. Kumar S , Konwar J , Das Purkayastha M , Kalita S , Mukherjee A , Dutta J . Current progress in valorization of food processing waste and by-products for pectin extraction. Int J Biol Macromol. 2023; 239: 124332. doi:10.1016/j.ijbiomac.2023.124332. [Google Scholar] [CrossRef]
13. Rascón A , Martínez A , Carbajal E , Martínez K , Campa A . Ionic gelation of low esterified pectin extracted from immature thinning apples. Rev Fitotec Mex. 2016; 39( 1): 17– 24. doi:10.35196/rfm.2016.1.17-24. [Google Scholar] [CrossRef]
14. Neske A , Ruiz J , Núria C , Cortes D . Acetogenins from Annonaceae family. Their potential biological applications. Phytochemistry. 2020; 174: 112332. doi:10.1016/j.phytochem.2020.112332. [Google Scholar] [CrossRef]
15. León-Fernández AE , Martínez-Cárdenas L , Zepeda-Vallejo LG , Arteaga-Garibay RI , Gutiérrez-Martínez P , Montalvo-González E . Antibacterial, antifungal, antioxidant and toxic effect of fractioned extracts from soursop pulp. Rev BioCiencias. 2019; 6: e400. doi:10.15741/revbio.06.e400. [Google Scholar] [CrossRef]
16. Gavamukulya Y , Wamunyokoli F , El-Shemy HA . Annona muricata: is the natural therapy to most disease conditions including cancer growing in our backyard? A systematic review of its research history and future prospects. Asian Pac J Trop Med. 2017; 10( 9): 835– 48. doi:10.1016/j.apjtm.2017.08.009. [Google Scholar] [CrossRef]
17. González-Periche P , Ramdular A , Bhupathiraju NV , Kalidindi T , Johnson DS , Pillarsetty N , et al. Synthesis of carbohydrate analogues of the THF-acetogenin 4-deoxyannomontacin and their cytotoxicity against human prostate cancer cell lines. Carbohydr Res. 2022; 521: 108671. doi:10.1016/j.carres.2022.108671. [Google Scholar] [CrossRef]
18. Igiehon OO , Idowu AT , Toluwabori S . Soursop (Annona muricata) nutritional composition, bioactivities and its potential applications: a review. Waste Biomass Valorization. 2025; 1– 15. doi:10.1007/s12649-025-03282-4. [Google Scholar] [CrossRef]
19. Balois-Morales R , Jiménez-Zurita JO , Alia-Tejacal I , López-Guzmán GG , Palomino-Hermosillo YA , Sánchez-Herrera LM . Antioxidant enzymes and antioxidant activity in two soursop selections (Annona muricata L.) from Nayarit, Mexico stored at 15°C. Rev Bras Frutic. 2019; 41: e083. doi:10.1590/0100-29452019083. [Google Scholar] [CrossRef]
20. Flores-Gorosquera E , García-Suárez FJ , Flores-Huicochea E , Núñez-Santiago MC , González-Soto RA , Bello-Pérez LA . Yield of starch extraction from plantain (Musa paradisiaca) fruits: pilot plant study. Acta Cient Venez. 2004; 55( 1): 86– 90. [Google Scholar]
21. Karbuz P , Tugrul N . Microwave and ultrasound assisted extraction of pectin from various fruits peel. J Food Sci Technol. 2021; 58( 2): 641– 50. doi:10.1007/s13197-020-04578-0. [Google Scholar] [CrossRef]
22. Aguilar-Hernández G , Vivar-Vera M , García-Magaña ML , González-Silva N , Pérez-Larios A , Montal-vo-González E . Ultrasound-assisted extraction of total acetogenins from the soursop fruit by response surface methodology. Molecules. 2020; 25( 5): 1139. doi:10.3390/molecules25051139. [Google Scholar] [CrossRef]
23. Dueñas-Deyá A , Castañeda-Bauta V , Martín-Cruz L , Ojito-Ramos K , Guerra-de-León JO . Phytochemical study of the Cuban endemic species Zanthoxylum pseudodumosum, a plant with potential antifungal activity. Rev Cub Quím. 2020; 32( 3): 406– 19. [Google Scholar]
24. Cavé A , Figadère B , Laurens A , Cortes D . Acetogenins from Annonaceae. In: Progress in the chemistry of organic natural products. New York, NY, USA: Springer; 1997. p. 81– 288. doi:10.1007/978-3-7091-6551-5_2. [Google Scholar] [CrossRef]
25. Melot A , Fall D , Gleye C , Champy P . Apolar Annonaceous acetogenins from the fruit pulp of Annona muricata. Molecules. 2009; 14( 11): 4387– 95. doi:10.3390/molecules14114387. [Google Scholar] [CrossRef]
26. Aguilar-Hernández G , Zepeda LG , García-Magaña ML , López-García UM , Aguilera S , Montal-vo-González E . Content of acetogenins from Annona muricata L. seeds: evaluation of different extraction conditions. Biotecnia. 2022; 24( 2): 12– 9. doi:10.18633/biotecnia.v24i2.1453. [Google Scholar] [CrossRef]
27. López-Romero BA , Luna-Bárcenas G , García-Magaña ML , Anaya-Esparza LM , Zepeda-Vallejo LG , López-García UM , et al. Extraction of acetogenins using thermosonication-assisted extraction from Annona muricata seeds and their antifungal activity. Molecules. 2022; 27( 18): 6045. doi:10.3390/molecules27186045. [Google Scholar] [CrossRef]
28. Baum A , Dominiak M , Vidal-Melgosa S , Willats WGT , Søndergaard KM , Hansen PW , et al. Prediction of pectin yield and quality by FTIR and carbohydrate microarray analysis. Food Bioprocess Technol. 2017; 10( 1): 143– 54. doi:10.1007/s11947-016-1802-2. [Google Scholar] [CrossRef]
29. Pourfarzad A , Yousefi A , Ako K . Steady/dynamic rheological characterization and FTIR study on wheat starch-sage seed gum blends. Food Hydrocoll. 2021; 111: 106380. doi:10.1016/j.foodhyd.2020.106380. [Google Scholar] [CrossRef]
30. Xiong J , Li Q , Shi Z , Ye J . Interactions between wheat starch and cellulose derivatives in short-term retrogradation: rheology and FTIR study. Food Res Int. 2017; 100: 858– 63. doi:10.1016/j.foodres.2017.07.061. [Google Scholar] [CrossRef]
31. Warren FJ , Gidley MJ , Flanagan BM . Infrared spectroscopy as a tool to characterise starch ordered structure—a joint FTIR-ATR, NMR, XRD and DSC study. Carbohydr Polym. 2016; 139: 35– 42. doi:10.1016/j.carbpol.2015.11.066. [Google Scholar] [CrossRef]
32. Santos EE , Amaro RC , Bustamante CCC , Guerra MHA , Soares LC , Santos Froes RE . Extraction of pectin from agroindustrial residue with an ecofriendly solvent: use of FTIR and chemometrics to differentiate pectins according to degree of methyl esterification. Food Hydrocoll. 2020; 107: 105921. doi:10.1016/j.foodhyd.2020.105921. [Google Scholar] [CrossRef]
33. Rascón-Chu A , Martínez-López AL , Carvajal-Millán E , León-Renova N , Márquez-Escalante JA , Romo-Chacón A . Pectin from low quality ‘Golden Delicious’ apples: composition and gelling capability. Food Chem. 2009; 116( 1): 101– 3. doi:10.1016/j.foodchem.2009.02.016. [Google Scholar] [CrossRef]
34. Meléndez-Martínez AJ , Vicario IM , Heredia FJ . Carotenoid pigments: structural and physicochemical considerations. Arch Latinoam Nutr. 2007; 57( 2): 109– 17. [Google Scholar]
35. Fernández G . Fundamentos de química orgánica. Madrid, España: Editorial Médica Panamericana; 2014. (In Spanish). [Google Scholar]
36. Proaño F , Stuart JR , Chongo B , Flores L , Herrera M , Medina Y , et al. Evaluation of three saponification methods in two types of fats as protection against bovine ruminal degradation. Rev Cub Cienc Agric. 2015; 49( 1): 35– 9. [Google Scholar]
37. Rupprecht JK , Hui YH , McLaughlin JL . Annonaceous acetogenins: a review. J Nat Prod. 1990; 53( 2): 237– 78. doi:10.1021/np50068a001. [Google Scholar] [CrossRef]
38. León-Méndez G , Pájaro-Castro N , Granados-Conde C . Annona squamosa: a current source of acetogenins. Cienc Salud Virtual. 2020; 12( 1): 88– 101. doi:10.22519/21455333.1289. [Google Scholar] [CrossRef]
39. Pasto D , Johnson M . Determinación de estructuras orgánicas. Barcelona, España: Reverté; 2023. 594 p. (In Spanish). [Google Scholar]
40. Sun S , Liu J , Kadouh H , Sun X , Zhou K . Three new anti-proliferative Annonaceous acetogenins with mono-tetrahydrofuran ring from graviola fruit (Annona muricata). Bioorg Med Chem Lett. 2014; 24( 12): 2773– 6. doi:10.1016/j.bmcl.2014.03.099. [Google Scholar] [CrossRef]
41. Nolasco-González Y , Chacón-López MA , Ortiz-Basurto RI , Aguilera-Aguirre S , González-Aguilar GA , Rodríguez-Aguayo C , et al. Annona muricata leaves as a source of bioactive compounds: extraction and quantification using ultrasound. Horticulturae. 2022; 8( 7): 560. doi:10.3390/horticulturae8070560. [Google Scholar] [CrossRef]
42. Durán-Ruiz CA , González-Esquinca AR , De-la-Cruz-Chacón I . Annonaceous acetogenins: a comparative analysis of insecticidal activity. Rev Bras Frutic. 2024; 46: e– 508. doi:10.1590/0100-29452024508. [Google Scholar] [CrossRef]
43. Aguilar-Hernández G , López-Romero BA , Huerta-Castellanos I , Tellez-Isaias G , Montalvo-González E . Acetogenins from Annona muricata as antimicrobial agents. In: Enterococcus—unveiling the emergence of a potent pathogen. London, UK: IntechOpen; 2024. p. 1– 20. doi:10.5772/intechopen.115064. [Google Scholar] [CrossRef]
44. Krishnan V , Mondal D , Thomas B , Singh A , Praveen S . Starch-lipid interaction alters the molecular structure and ultimate starch bioavailability: a comprehensive review. Int J Biol Macromol. 2021; 182: 626– 38. doi:10.1016/j.ijbiomac.2021.04.030. [Google Scholar] [CrossRef]
45. Rodríguez-López CE , Hernández-Brenes C , Treviño V , Díaz de la Garza RI . Avocado fruit maturation and ripening: dynamics of aliphatic acetogenins and lipidomic profiles from mesocarp, idioblasts and seed. BMC Plant Biol. 2017; 17( 1): 159. doi:10.1186/s12870-017-1103-6. [Google Scholar] [CrossRef]
Cite This Article
 Copyright © 2026 The Author(s). Published by Tech Science Press.
This work is licensed under a Creative Commons Attribution 4.0 International License , which permits unrestricted use, distribution, and reproduction in any medium, provided the original work is properly cited.
 Downloads
 Citation Tools