
 Submit a Paper
 Propose a Special lssue
 Open Access
ARTICLE

Codon Usage Bias in the Chloroplast Genome of the Traditional Chinese Medicinal Plant Corydalis yanhusuo
Shaanxi Collaborative Innovation Center of Chinese Medicinal Resources Industrialization, State Key Laboratory of Research & Development of Characteristic Qin Medicine Resources (Cultivation), Shaanxi University of Chinese Medicine, Xianyang, China
* Corresponding Author: Bo Li. Email:
Phyton-International Journal of Experimental Botany 2026, 95(3), 9 https://doi.org/10.32604/phyton.2026.076367
Received 19 November 2025; Accepted 04 February 2026; Issue published 31 March 2026
 View Full Text
 Download PDF
Abstract
This study aims to clarify the codon usage bias and influencing factors of protein-coding genes in the chloroplast genome of the medicinal plant Corydalis yanhusuo. The chloroplast genome sequence of C. yanhusuo was obtained by resequencing, approximately 50 protein-coding genes were screened, and the nucleotide composition and codon usage patterns were calculated and analyzed using CodonW 1.4.2 and EMBOSS software. The results showed that the total guanine and cytosine (GC) content of codons in the chloroplast genome of C. yanhusuo was 40.06%, and the GC contents at the third, second, and first codon positions (GC3, GC2, and GC1) were 32.12%, 40.21%, and 47.84%, respectively, indicating that codons in the chloroplast genome of C. yanhusuo preferentially used adenine (A) or uracil (U). The effective number of codons (ENC) ranged from 42.87 to 61.00, with an average value of 50.54, indicating weak codon usage bias. A significant positive correlation existed between the GC content at the third codon position (GC3) and ENC, showing that codon bias was mainly affected by the third base. Neutral plot, ENC-plot, and PR2-plot analyses showed that the codon bias of the chloroplast genome of C. yanhusuo was mainly influenced by natural selection. Sixteen optimal codons—UUA, AUU, GUU, GUA, UCU, AGU, CCU, ACU, GCU, CAA, AAA, GAU, UGU, CGU, CGA, and GGU—were finally determined based on the relative synonymous codon usage analysis of high-frequency and highly expressed codons, all of which preferentially ended with A/U. Overall, this study reveals the codon usage bias of the chloroplast genome of C. yanhusuo and its influencing factors, and provides a theoretical basis for chloroplast genetic engineering and phylogenetic research.Keywords
Chloroplasts are specialized organelles in green plant cells that carry out photosynthesis. The chloroplast genome contains both protein-coding genes and non-coding regulatory regions, and it participates in essential biological processes—including light capture, electron transport, photophosphorylation, and carbon fixation—through the expression of numerous photosynthesis-related proteins and enzymes [1]. Because of features such as a highly conserved structure, maternal inheritance, and a generally low rate of recombination, chloroplast genomes are widely applied in research on plant phylogeny, molecular evolution, and phylogeography [2]. In recent years, chloroplast genomics has emerged as a major research area in plant biology, and genomes from diverse plant species have now been sequenced and characterized. These studies are of great importance for advancing our understanding of photosynthesis [3], genetic traits [4], species evolution [5], and environmental adaptation [6].
Codon usage bias is defined as the phenomenon in which organisms differ in the frequency with which they use synonymous codons that encode the same amino acid during protein translation. Studies have shown that the usage frequency of synonymous codons exhibits preferences at multiple levels, including interspecific, intraspecific, and intergenic levels [7]. It is generally recognized that differences in the cellular abundance of various tRNAs directly influence the frequency of synonymous codon usage; specifically, the greater the abundance of a tRNA, the more frequently its corresponding codon is used. To satisfy the need for rapid synthesis of large quantities of proteins, highly expressed genes in organisms preferentially employ codons that match high-abundance tRNAs [8]. Additionally, other factors such as mutational pressure, genomic GC content, and protein structure also influence codon usage bias [9]. Therefore, analyzing codon usage bias helps deepen our understanding of molecular evolution in different species and the mechanisms regulating gene expression.
Corydalis yanhusuo W. T. Wang is a perennial herbaceous plant belonging to the genus Corydalis in the family Papaveraceae. Its dried tubers are used as the traditional Chinese medicinal material “Yuanhu”, which has notable efficacy in promoting blood circulation, regulating qi, and relieving pain [10]. Corydalis is the largest genus in Papaveraceae, with approximately 288 species recorded in China; members of this genus are widely distributed across both northern and southern China, particularly in the southwest region [11]. At present, chloroplast genome sequences of dozens of Corydalis species—such as C. yanhusuo, C. turtschaninovii [12], C. temulifolia [13], C. edulis, C. shensiana [14], and C. fangshanensis [15]—have been published and used for phylogenetic and evolutionary analyses, greatly enriching the available genetic information on Corydalis species.
Current studies on C. yanhusuo mainly focus on processing methods [16], chemical constituents [17], pharmacology and clinical efficacy [18], whereas studies on the codon usage bias of its chloroplast genome remain relatively limited. In this study, the chloroplast genome of C. yanhusuo was obtained through resequencing, and CodonW 1.4.2 software, together with EMBOSS online tools, was used to analyze the codon base composition characteristics of protein-coding genes and to examine the factors influencing codon bias. An in-depth investigation of the chloroplast genome of C. yanhusuo will contribute to further research on its genetic evolution and chloroplast genetic engineering.
Fresh tubers of C. yanhusuo were collected on May 10, 2022, from Lefeng Village, Shangyuanguan Town, Chenggu County, Hanzhong City, Shaanxi Province, China (latitude 33°5′15″ N, longitude 107°13′49″ E; altitude 481 m). Tubers with smooth surfaces and no mechanical damage were selected and planted in plastic flowerpots filled with nutrient substrate, and the surface was covered with an appropriate amount of substrate. All tubers were cultured at 20°C and a relative humidity of 50–70%, under a 12 h light (2000 lux)/12 h dark photoperiod, with timely watering. The plant material was identified as C. yanhusuo (Papaveraceae, Corydalis) by Associate Professor Xinjie Yang from the Herbarium of Shaanxi University of Chinese Medicine (Fig. 1). When the plants reached a height of 10–15 cm and had fully expanded leaves, fresh, healthy leaves were collected, rapidly frozen in liquid nitrogen, and sent to Sangon Biotech (Shanghai) Co., Ltd. for high-throughput sequencing of the chloroplast genome.
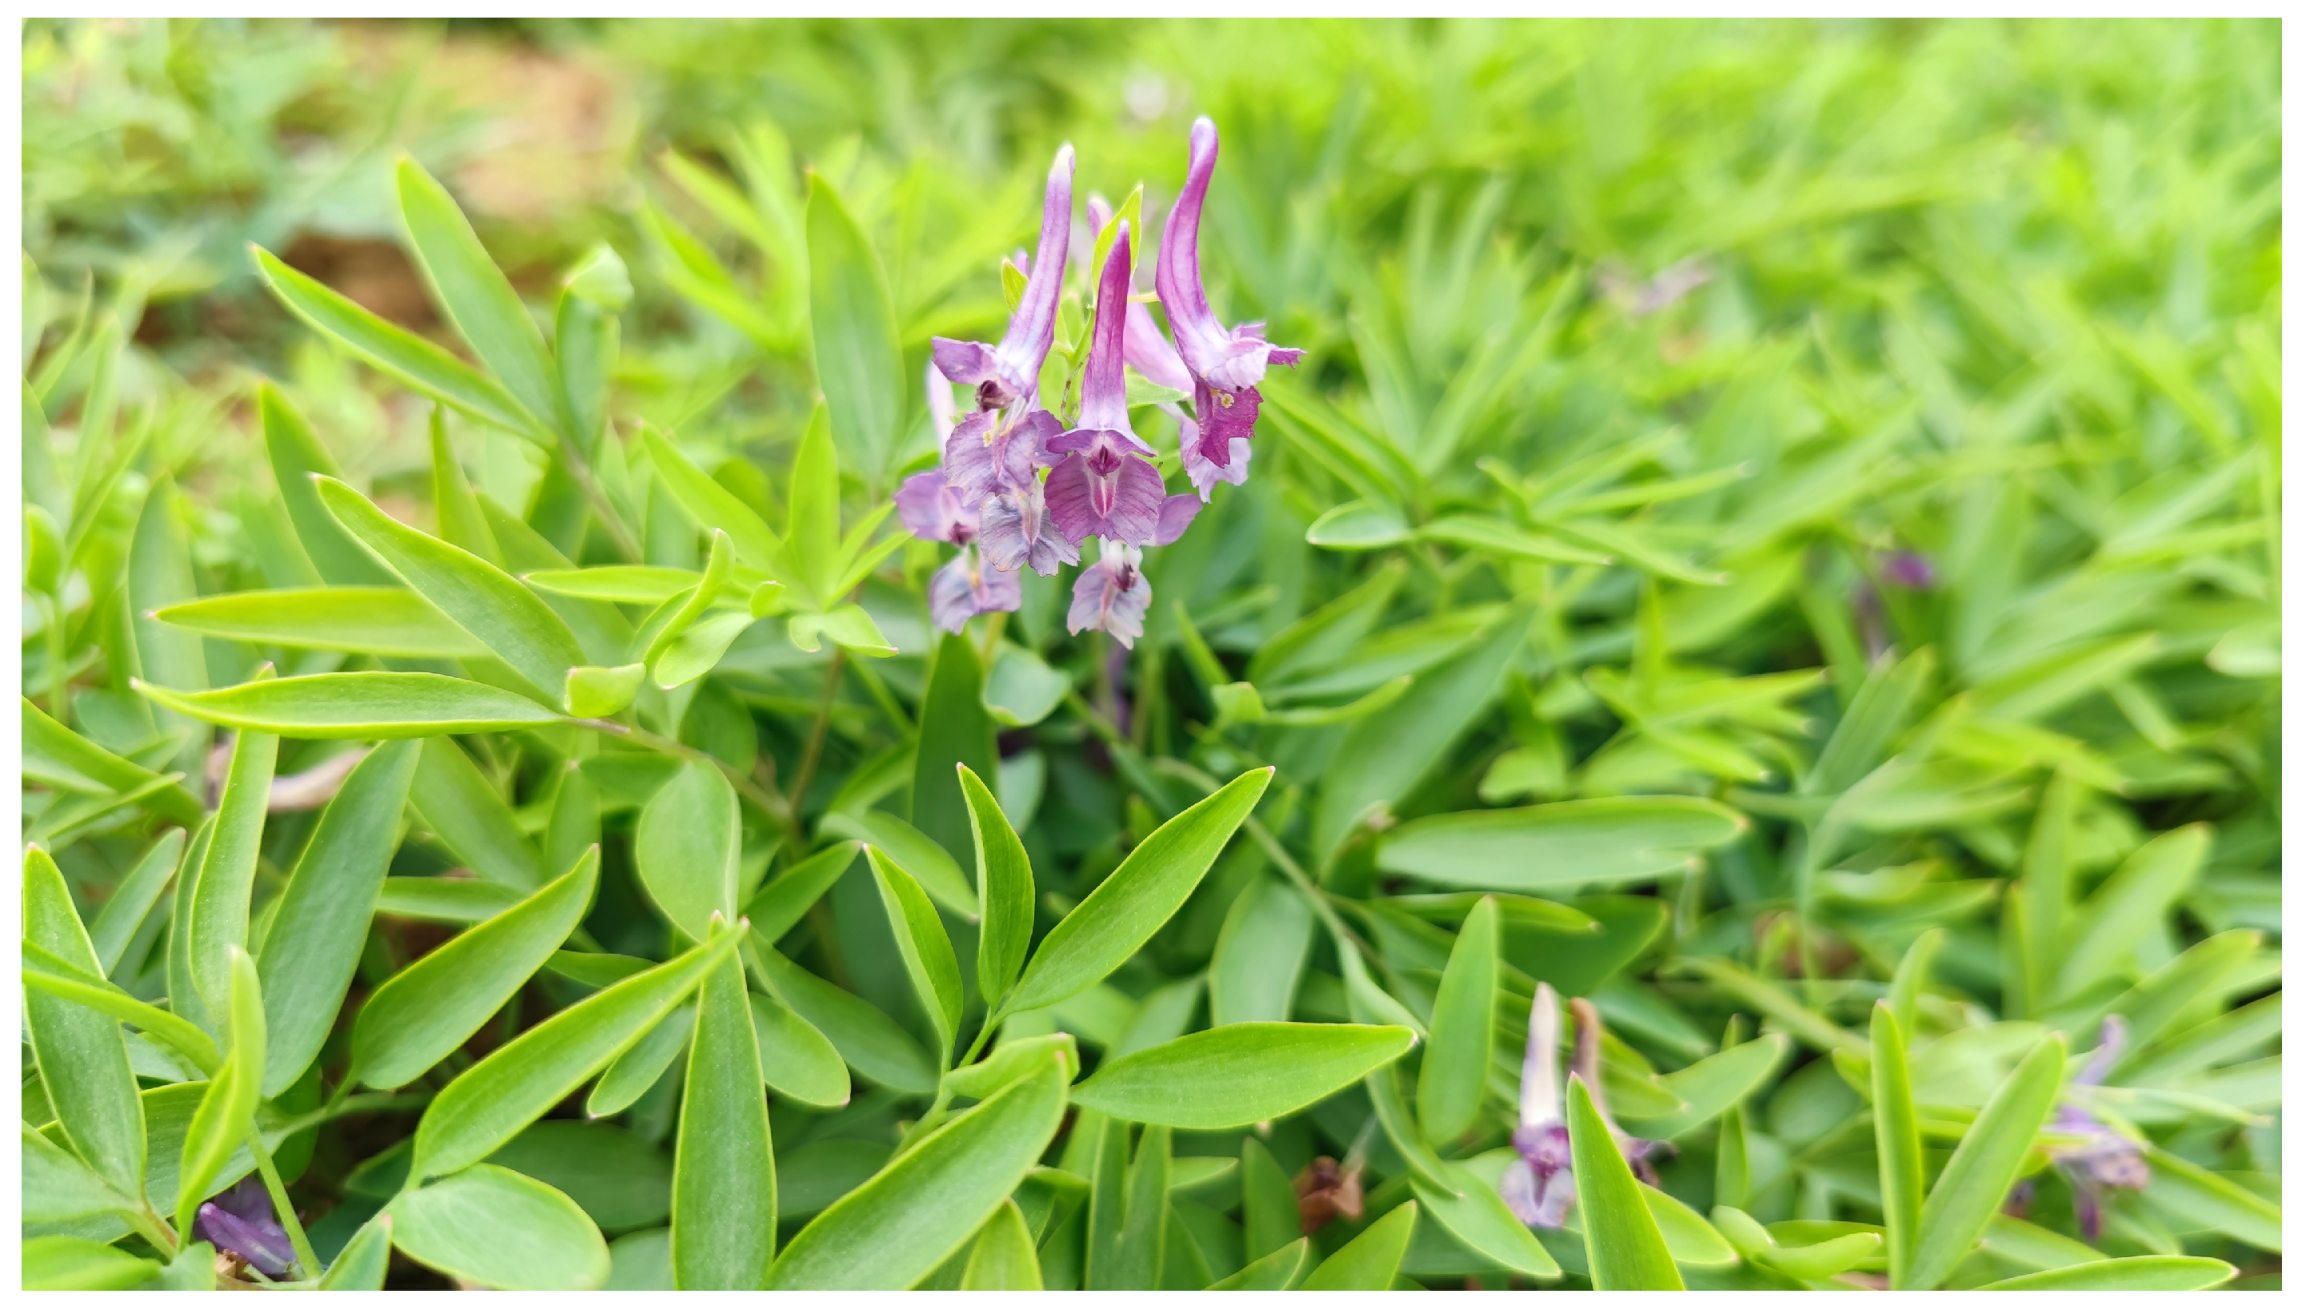
Figure 1: Morphological characteristics of Corydalis yanhusuo.
2.2 Chloroplast Genome Resequencing and Gene Screening
The chloroplast genome of C. yanhusuo was resequenced using the Illumina Novaseq 6000 platform. Following sequence assembly, annotation, and correction, the raw data were deposited in the Genome Sequence Archive of the National Genomics Data Center, Beijing Institute of Genomics, Chinese Academy of Sciences [19] (https://ngdc.cncb.ac.cn/gsa; Accession No.: CRA014252). To ensure data reliability, the coding sequences (CDS) were screened according to the following criteria: repeated sequences and sequences shorter than 300 bp were removed to avoid sampling bias, sequence lengths were ensured to be multiples of three, and each CDS was verified to start with the codon ATG and end with one of the stop codons TAA, TGA, or TAG. Ultimately, 50 chloroplast CDS of C. yanhusuo were selected for subsequent codon usage bias analysis.
2.3 Codon Composition Analysis
Based on the screened chloroplast CDS of C. yanhusuo, the GC content at the first, second, and third codon positions (designated GC1, GC2, and GC3, respectively) as well as the overall GC content of codons (GCall) were analyzed using the EMBOSS online tool (https://www.bioinformatics.nl/emboss-explorer/) and CodonW 1.4.2 software (https://codonw.sourceforge.net). Additional parameters, including the effective number of codons (ENC), relative synonymous codon usage (RSCU), codon adaptation index (CAI), and the frequency of guanine or cytosine at the third codon position (GC3s), were also calculated [20,21]. Pearson correlation analysis of these codon-related parameters was performed using SPSS 22.0 to assess relationships within the chloroplast genome of C. yanhusuo.
A neutral plot analysis was performed using Excel 2019, with GC3 plotted on the x-axis and GC12 (the average of GC1 and GC2) on the y-axis. The factors influencing codon usage bias were inferred by examining the relationship among the first, second, and third codon positions. A significant correlation between GC12 and GC3 with a regression coefficient close to 1 indicates that codon bias is largely driven by mutation; otherwise, codon bias is mainly influenced by natural selection [22].
A scatter plot was generated with GC3s on the x-axis and the observed ENC values on the y-axis, and a standard curve of expected ENC values was added. The expected ENC was calculated using the formula: ENC = 2 + x + 29/[x2 + (1 − x)2], where x = GC3s. The closer the scatter points are to the standard curve, the stronger the influence of mutation on codon usage bias; conversely, the farther the points are from the curve, the more codon usage bias is determined by natural selection [23].
Parity Rule 2 (PR2) analysis was conducted using Excel. A scatter plot was generated with G3/(G3 + C3) on the x-axis and A3/(A3 + T3) on the y-axis, and horizontal and vertical symmetry lines were added. The center of the plot represents the point where A = T and G = C. If codon usage bias is mainly driven by mutation, the scatter points are expected to be evenly distributed around the plot [24].
2.7 Identification of Optimal Codons
Codons with RSCU values greater than 1 were identified as high-frequency codons. The 50 CDS sequences were ranked by their ENC values, and five genes with relatively low ENC (high-expression genes) and five with relatively high ENC (low-expression genes) were selected to construct high- and low-expression libraries, respectively. The ΔRSCU value was then calculated (ΔRSCU = RSCU of high-expression genes − RSCU of low-expression genes), and codons with ΔRSCU ≥ 0.08 were considered advantageous codons for high-expression genes [25]. The intersection of these high-frequency codons and high-expression ones was defined as optimal codons of the C. yanhusuo chloroplast genome.
3.1 Analysis of Codon Usage in the Corydalis yanhusuo Chloroplast Genome
The basic codon composition of the C. yanhusuo chloroplast genome is summarized in Table 1. Among the 50 screened genes, the number of synonymous codons ranged from 94 (rpl23) to 2224 (ycf2), with an average of 385.36, while the number of encoded amino acids ranged from 100 (ndhE, rpl23, and rps14) to 2311 (ycf2), with an average of 402.04. The ycf2 gene is the largest plastid gene in angiosperms and, owing to its long sequence and low nucleotide substitution rate, is frequently used in studies of angiosperm phylogenetic relationships. It has been reported that the ycf2 gene alone can generate a generally well-supported phylogenetic tree [26]. The protein hydrophobicity ranged from −1.122 (rps18) to 1.016 (ndhG), with an average of −0.083, while protein aromaticity (Aromo) ranged from 0.027 (rps11) to 0.183 (ndhC). These results indicate that the ndhG and ndhC genes, which encode reduced nicotinamide adenine dinucleotide (NADH) dehydrogenase subunit proteins, exhibit the highest hydrophobicity and aromaticity indices, respectively. Previous studies have shown that hydrophobicity and aromaticity are major factors influencing amino acid usage variation in the chicken proteome [27].
Table 1: Codon composition of the Corydalis yanhusuo chloroplast genome.
| Gene Function | Gene | No. of Synonymous Codons | No. of Amino Acids | Grand Average of Hydropathy | Aromo |
|---|---|---|---|---|---|
| ATP synthase subunit | atpA | 497 | 507 | −0.088 | 0.059 |
| atpB | 479 | 496 | −0.039 | 0.060 | |
| atpE | 136 | 140 | −0.104 | 0.036 | |
| atpF | 180 | 184 | −0.320 | 0.071 | |
| atpI | 239 | 247 | 0.634 | 0.121 | |
| Cytochrome c synthase | ccsA | 300 | 322 | 0.567 | 0.149 |
| Envelope membrane protein | cemA | 215 | 229 | 0.229 | 0.135 |
| Maturase | matK | 478 | 499 | −0.249 | 0.150 |
| NADH dehydrogenase subunit | ndhA | 351 | 363 | 0.649 | 0.135 |
| ndhB | 484 | 510 | 0.613 | 0.129 | |
| ndhC | 112 | 120 | 0.827 | 0.183 | |
| ndhE | 97 | 100 | 0.543 | 0.090 | |
| ndhF | 712 | 750 | 0.495 | 0.143 | |
| ndhG | 169 | 176 | 1.016 | 0.125 | |
| ndhH | 365 | 393 | −0.106 | 0.117 | |
| ndhI | 157 | 165 | −0.055 | 0.109 | |
| ndhJ | 149 | 158 | −0.308 | 0.139 | |
| ndhK | 237 | 245 | −0.329 | 0.094 | |
| Cytochrome b/f complex subunit | petA | 312 | 320 | −0.149 | 0.081 |
| petB | 200 | 215 | 0.540 | 0.135 | |
| petD | 160 | 167 | 0.525 | 0.102 | |
| Photosystem I subunit | psaA | 707 | 750 | 0.248 | 0.132 |
| psaB | 687 | 734 | 0.105 | 0.149 | |
| Photosystem II subunit | psbA | 331 | 353 | 0.335 | 0.136 |
| psbB | 481 | 508 | 0.132 | 0.148 | |
| psbC | 446 | 471 | 0.252 | 0.138 | |
| psbD | 331 | 353 | 0.359 | 0.170 | |
| Rubisco large subunit | rbcL | 458 | 475 | −0.264 | 0.099 |
| Ribosomal protein large subunit | rpl14 | 117 | 122 | 0.040 | 0.049 |
| rpl16 | 126 | 135 | −0.470 | 0.089 | |
| rpl20 | 120 | 125 | −0.522 | 0.072 | |
| rpl22 | 128 | 133 | −0.385 | 0.060 | |
| rpl23 | 94 | 100 | −0.461 | 0.090 | |
| RNA polymerase subunit | rpoA | 330 | 342 | −0.379 | 0.076 |
| rpoB | 1034 | 1068 | −0.311 | 0.082 | |
| rpoC1 | 655 | 677 | −0.312 | 0.092 | |
| rpoC2 | 1329 | 1367 | −0.292 | 0.072 | |
| Ribosomal protein small subunit | rps11 | 145 | 149 | −0.381 | 0.027 |
| rps12 | 122 | 123 | −0.690 | 0.041 | |
| rps14 | 95 | 100 | −0.915 | 0.070 | |
| rps18 | 150 | 152 | −1.122 | 0.059 | |
| rps2 | 225 | 236 | −0.310 | 0.072 | |
| rps3 | 222 | 228 | −0.357 | 0.079 | |
| rps4 | 199 | 202 | −0.711 | 0.050 | |
| rps7 | 150 | 155 | −0.704 | 0.032 | |
| rps8 | 128 | 133 | −0.397 | 0.060 | |
| Hypothetical chloroplast open reading frames | ycf1 | 1868 | 1940 | −0.769 | 0.110 |
| ycf2 | 2224 | 2311 | −0.421 | 0.123 | |
| ycf3 | 164 | 170 | −0.543 | 0.141 | |
| ycf4 | 173 | 184 | 0.195 | 0.141 |
The GC content at the first, second, and third codon positions, the frequency of G or C at the third codon position (GC3s), the ENC, and the CAI for the CDS of the C. yanhusuo chloroplast genome are summarized in Table 2. The GCall content ranged from 34.35% to 48.67%, with an average of 40.06%; GC1 ranged from 37.15% to 57.98%, averaging 47.84%; GC2 ranged from 25.22% to 59.33%, with an average of 40.21%; and GC3 ranged from 24.45% to 39.53%, with an average of 32.12%. It has been reported that the plastome of the closely related species C. adunca exhibits the highest total GC content (41.03%), which is higher than that of the chloroplast genomes of C. saxicola, C. hsiaowutaishanensis, and C. davidii [28]. Kim [12] analyzed the chloroplast genomes of 36 Corydalis species and found that their total GC content ranged from 40.1% to 41.5%, higher than that observed in other genera of Papaveraceae, such as Eschscholzia californica, Chelidonium majus, and Lamprocapnos spectabilis, as well as in various green algae and land plants [29].
Codon usage bias in plant chloroplast genomes is influenced by numerous factors, among which gene mutation and natural selection are the most significant. GC content serves as an important indicator for assessing mutation tendencies [30]. In this study, the GC content at the first, second, and third codon positions followed the order GC3 < GC2 < GC1, indicating that GC was unevenly distributed across the three codon positions in the C. yanhusuo chloroplast genome. This pattern suggests that synonymous codons are relatively conserved, with a preference for ending in A or U. Similarly, Ren [31] reported that the third codon position in all coding genes of C. tomentella had a high AT content of 65.83%, and 65.91% in C. saxicola, reflecting the low GC3 content in the chloroplast genomes of these two Corydalis species. Furthermore, our results are consistent with findings in other medicinal plants, such as Mesona chinensis [32], Dryas octopetala var. asiatica [33], and Aroideae species [34]. Sablok [35] reported that the chloroplast genomes of Pooid grasses exhibit a narrow, unimodal GC3 distribution. The low GC3 values not only indicate evolutionary equilibrium in plastid genomes but also suggest a predominance of cytosine (C) deamination relative to other evolutionary forces.
The ENC values of the CDS in the C. yanhusuo chloroplast genome ranged from 42.87 (rps12) to 61.00 (rpl23), with an average of 50.54. Only five genes—rps12, psbA, petD, petB, and ndhC—had ENC values below 45 (Table 2), indicating that codon usage bias in the C. yanhusuo chloroplast genome is generally weak. The ENC is a comprehensive measure of synonymous codon bias, quantifying the extent to which a gene deviates from equal usage of synonymous codons. This index is independent of gene length or amino acid composition. For a single gene, ENC values theoretically range from 20 to 61, with values ≤ 35 indicating strong codon bias; higher ENC values correspond to weaker codon usage bias [36]. In this study, the average ENC value of the selected genes in the C. yanhusuo chloroplast genome was 50.54, higher than that of Dryas octopetala var. asiatica (average ENC 47.20) [33] and various Camellia species (average ENC 48.48–48.51) [24], indicating that overall codon usage bias in the C. yanhusuo chloroplast genome is weak. Among the genes, rps12 had the lowest ENC value, suggesting relatively strong codon bias. The rps12 gene encodes the S12 protein of the 30S small subunit of chloroplast ribosomes. Notably, rps12 has been identified as a highly variable site in the chloroplast genome of the medicinal plant Alpinia japonica [37] and exhibits high codon usage divergence in Malus chloroplasts [38].
Furthermore, the GC3s values of genes in the C. yanhusuo chloroplast genome ranged from 0.217 to 0.371, with an average of 0.292. The CAI values ranged from 0.110 to 0.305, with an average of 0.170 (Table 2), indicating relatively low gene expression levels in the C. yanhusuo chloroplast genome. Robbins [39] reported that gene expression, gene location, and nucleotide composition together account for over 50% of the variation in molecular evolutionary rates of plastid-encoded genes, imposing significant constraints on chloroplast molecular adaptation. Additionally, plastid genes involved in energy production exhibit slower evolutionary rates and stronger constraints than those associated with information processing, as demonstrated in 773 angiosperm plastid genomes [39]. In this study, photosynthesis-related genes—including atp, ccsA, ndh, pet, psa, psb, and rbcL—exhibited a higher average CAI value (0.183) compared with genetic system-related genes, such as matK, rpl, rpo, and rps (average CAI 0.153), indicating relatively higher expression levels and stronger adaptation of photosynthesis-related genes. This finding is consistent with previous studies on Solanum species [40]. Moreover, the psbA gene has been shown to possess a significantly higher codon adaptation level than expected, suggesting that selective constraints have shaped its codon usage during angiosperm evolution [41].
Table 2: Analysis of codon usage bias in the Corydalis yanhusuo chloroplast genome.
| Gene Function | Gene | GC Content (%) | ENC | GC3s | CAI | |||
|---|---|---|---|---|---|---|---|---|
| GC1 | GC2 | GC3 | GCall | |||||
| ATP synthase subunit | atpA | 54.53 | 41.14 | 29.33 | 41.67 | 47.70 | 0.280 | 0.199 |
| atpB | 56.34 | 42.05 | 31.99 | 43.46 | 49.65 | 0.294 | 0.205 | |
| atpE | 51.77 | 39.01 | 26.24 | 39.01 | 52.16 | 0.243 | 0.161 | |
| atpF | 47.03 | 36.22 | 35.68 | 39.64 | 45.90 | 0.339 | 0.144 | |
| atpI | 51.61 | 37.50 | 30.65 | 39.92 | 45.01 | 0.285 | 0.183 | |
| Cytochrome c synthase | ccsA | 37.15 | 39.63 | 29.41 | 35.40 | 50.85 | 0.243 | 0.134 |
| Envelope membrane protein | cemA | 41.30 | 25.22 | 36.52 | 34.35 | 58.02 | 0.326 | 0.180 |
| Maturase | matK | 41.60 | 33.00 | 32.20 | 35.60 | 53.27 | 0.293 | 0.154 |
| NADH dehydrogenase subunit | ndhA | 44.78 | 40.66 | 24.45 | 36.63 | 46.58 | 0.219 | 0.130 |
| ndhB | 43.05 | 39.33 | 34.05 | 38.81 | 49.85 | 0.304 | 0.160 | |
| ndhC | 51.24 | 37.19 | 32.23 | 40.22 | 44.74 | 0.268 | 0.206 | |
| ndhE | 43.56 | 34.65 | 32.67 | 36.96 | 56.67 | 0.299 | 0.181 | |
| ndhF | 39.28 | 38.88 | 29.29 | 35.82 | 48.40 | 0.256 | 0.147 | |
| ndhG | 48.02 | 34.46 | 31.07 | 37.85 | 49.35 | 0.284 | 0.164 | |
| ndhH | 51.27 | 36.29 | 32.99 | 40.19 | 50.29 | 0.279 | 0.149 | |
| ndhI | 41.57 | 40.36 | 25.30 | 35.74 | 48.44 | 0.217 | 0.164 | |
| ndhJ | 51.57 | 37.74 | 34.59 | 41.30 | 60.62 | 0.309 | 0.165 | |
| ndhK | 43.90 | 41.06 | 32.52 | 39.16 | 53.05 | 0.304 | 0.174 | |
| Cytochrome b/f complex subunit | petA | 52.96 | 35.51 | 32.71 | 40.39 | 52.66 | 0.308 | 0.186 |
| petB | 50.00 | 41.67 | 31.94 | 41.20 | 44.50 | 0.265 | 0.212 | |
| petD | 51.19 | 39.29 | 29.76 | 40.08 | 44.35 | 0.269 | 0.161 | |
| Photosystem I subunit | psaA | 52.33 | 43.54 | 35.82 | 43.90 | 52.56 | 0.320 | 0.195 |
| psaB | 49.25 | 42.72 | 34.56 | 42.18 | 51.16 | 0.301 | 0.184 | |
| Photosystem II subunit | psbA | 50.00 | 43.50 | 35.59 | 43.03 | 43.83 | 0.314 | 0.305 |
| psbB | 53.44 | 45.97 | 34.38 | 44.60 | 52.00 | 0.308 | 0.178 | |
| psbC | 52.54 | 43.50 | 34.75 | 43.60 | 47.20 | 0.323 | 0.181 | |
| psbD | 52.54 | 43.50 | 34.75 | 43.60 | 47.75 | 0.305 | 0.237 | |
| Rubisco large subunit | rbcL | 57.98 | 43.28 | 31.09 | 44.12 | 47.74 | 0.286 | 0.253 |
| Ribosomal protein large subunit | rpl14 | 52.03 | 35.77 | 28.46 | 38.75 | 53.60 | 0.256 | 0.194 |
| rpl16 | 53.68 | 52.21 | 29.41 | 45.10 | 46.16 | 0.238 | 0.145 | |
| rpl20 | 39.68 | 43.65 | 32.54 | 38.62 | 48.58 | 0.300 | 0.110 | |
| rpl22 | 39.55 | 38.81 | 32.84 | 37.06 | 49.04 | 0.305 | 0.145 | |
| rpl23 | 45.54 | 40.59 | 33.66 | 39.93 | 61.00 | 0.298 | 0.125 | |
| RNA polymerase subunit | rpoA | 46.94 | 33.53 | 32.65 | 37.71 | 55.28 | 0.303 | 0.179 |
| rpoB | 50.89 | 38.73 | 32.37 | 40.66 | 51.09 | 0.302 | 0.157 | |
| rpoC1 | 51.77 | 37.02 | 33.19 | 40.66 | 53.48 | 0.308 | 0.162 | |
| rpoC2 | 47.44 | 39.77 | 34.36 | 40.52 | 52.43 | 0.325 | 0.148 | |
| Ribosomal protein small subunit | rps11 | 56.00 | 59.33 | 30.67 | 48.67 | 55.13 | 0.283 | 0.121 |
| rps12 | 52.42 | 49.19 | 28.23 | 43.28 | 42.87 | 0.279 | 0.147 | |
| rps14 | 43.56 | 49.50 | 37.62 | 43.56 | 50.47 | 0.347 | 0.140 | |
| rps18 | 38.56 | 41.18 | 32.03 | 37.25 | 51.15 | 0.307 | 0.117 | |
| rps2 | 43.04 | 43.88 | 32.49 | 39.80 | 51.13 | 0.293 | 0.173 | |
| rps3 | 45.41 | 34.93 | 30.13 | 36.83 | 50.82 | 0.284 | 0.185 | |
| rps4 | 51.23 | 38.42 | 31.03 | 40.23 | 51.46 | 0.302 | 0.178 | |
| rps7 | 50.64 | 42.95 | 27.56 | 40.38 | 49.16 | 0.253 | 0.201 | |
| rps8 | 43.28 | 42.54 | 31.34 | 39.05 | 45.89 | 0.289 | 0.127 | |
| Hypothetical chloroplast open reading frames | ycf1 | 42.25 | 32.66 | 31.48 | 35.46 | 51.64 | 0.289 | 0.180 |
| ycf2 | 44.33 | 37.07 | 39.53 | 40.31 | 54.72 | 0.371 | 0.163 | |
| ycf3 | 46.78 | 39.77 | 31.58 | 39.38 | 53.95 | 0.293 | 0.160 | |
| ycf4 | 45.41 | 42.16 | 36.22 | 41.26 | 53.63 | 0.324 | 0.155 | |
| Average | 47.84 | 40.21 | 32.12 | 40.06 | 50.54 | 0.292 | 0.170 | |
Correlation analysis of base composition parameters is illustrated in Fig. 2. The results indicated that GCall was significantly positively correlated with both GC1 and GC2 (p < 0.05), and GC1 was significantly positively correlated with GC2 (p < 0.05). In contrast, GC3 showed no significant correlation with either GC1 or GC2 (p > 0.05), suggesting notable differences between the third codon position and the first and second positions in the codon composition of the C. yanhusuo chloroplast genome. Additionally, GC3s were significantly positively correlated with GC3 (p < 0.05). The ENC value showed no significant correlation with GC1, a significant negative correlation with GC2 (p < 0.05), and a significant positive correlation with GC3 (p < 0.05). The ENC value, GC3, and GC3s contents were all significantly positively correlated, indicating that codon usage bias in the C. yanhusuo chloroplast genome is mainly influenced by the nucleotide composition at the third codon position.
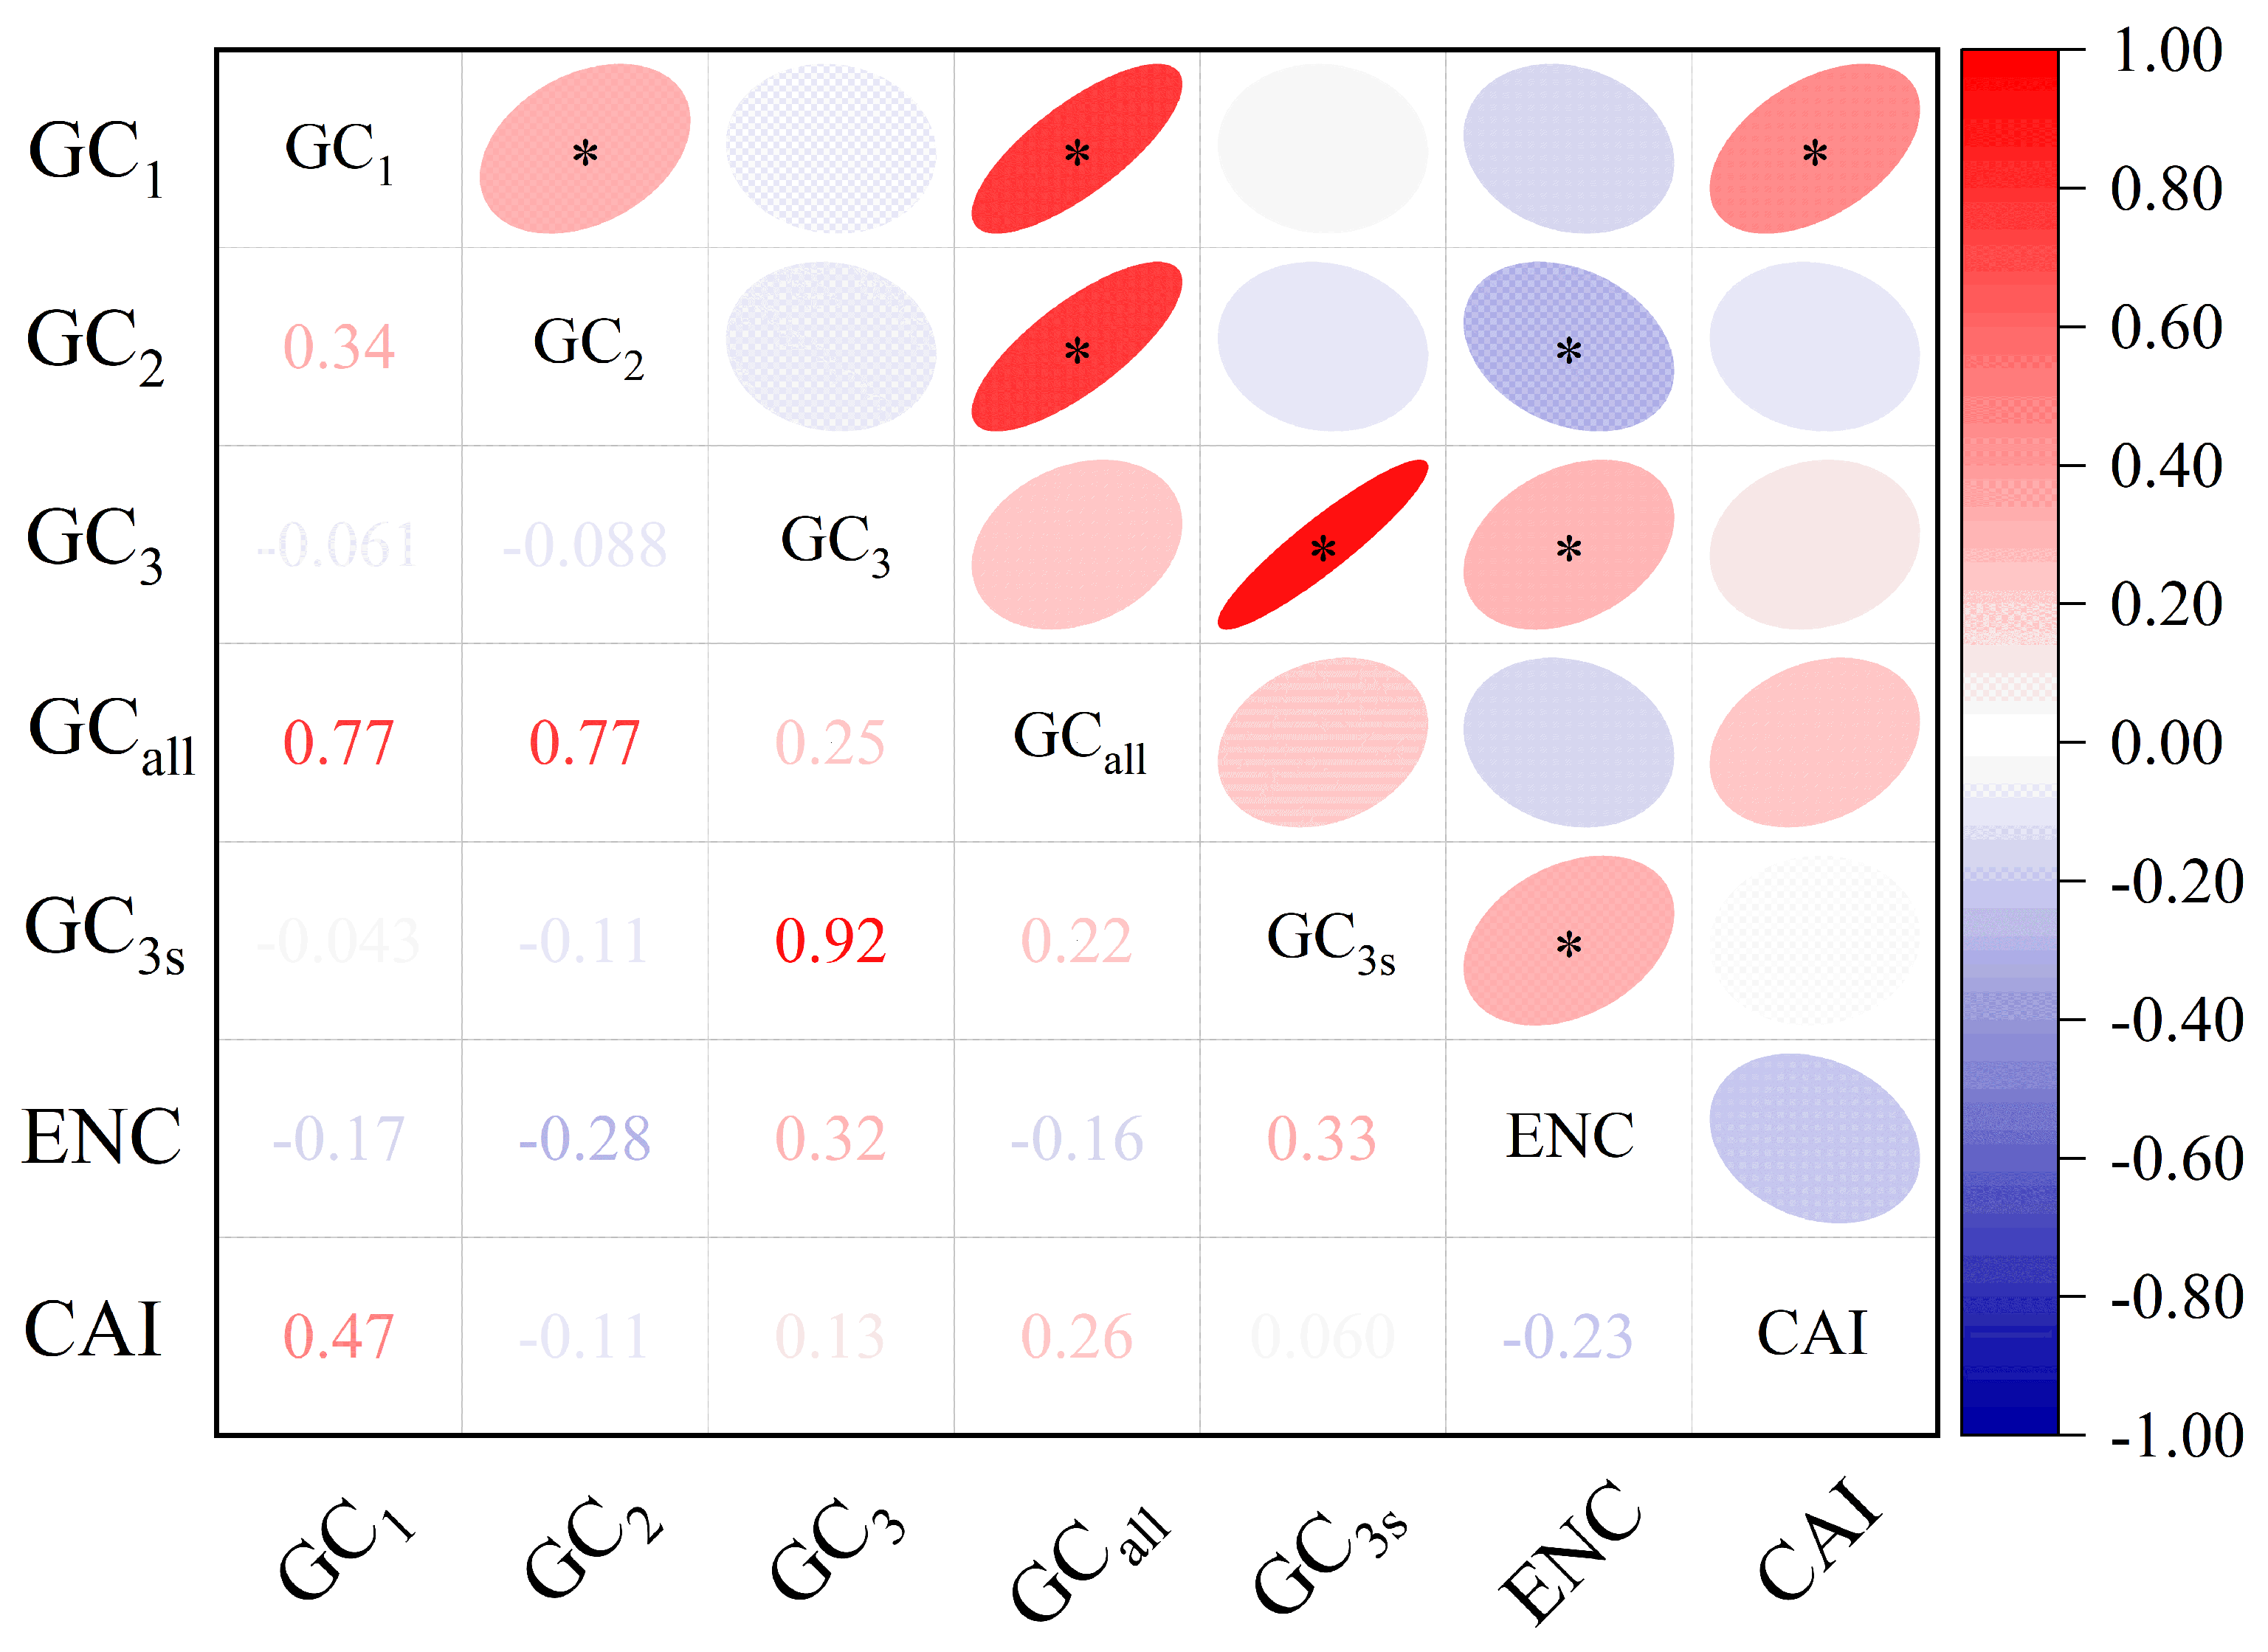
Figure 2: Correlation analysis of codon parameters in the Corydalis yanhusuo chloroplast genome. Note: * represents a significant correlation (p < 0.05).
The analysis of RSCU values in the C. yanhusuo chloroplast genome is presented in Table 3. Among the 61 codons (excluding the stop codons UAA, UAG, and UGA), approximately 30 codons had RSCU values greater than 1. Of these, 12 codons, including UUA, GUA, and UCA, ended with A; 16 codons, such as UUU, CUU, and AUU, ended with U; and two codons, UUG and UCC, ended with G and C, respectively. In a previous study [12], about 30 codons had RSCU > 1 across the chloroplast genomes of 48 Corydalis species, with the highest RSCU observed for AGA (1.69). Consistently, in C. yanhusuo, the AGA codon, which encodes arginine (Arg), exhibited the highest RSCU value (1.72) among all 61 codons, fully agreeing with the earlier findings. Previous works [42] have shown that the translation efficiencies of three arginine codons—AGA, CGU, and CGA—differ significantly, with nearly a 10-fold variation; AGA exhibits very high translation efficiency, whereas CGA is translated at an extremely low rate. Meanwhile, the two codons AUG and UGG, which encode methionine (Met) and tryptophan (Trp), respectively, have RSCU values of 1, indicating no codon usage bias. In contrast, 29 codons, including UUC, CUC, and CUA, show low occurrence frequency and weak usage bias (RSCU < 1). These results indicate that most high-frequency codons in the C. yanhusuo chloroplast genome end with A or U, accounting for 93.33% of such codons. Similarly, Nie [43] reported that codons ending in A and/or T exhibit higher RSCU values (>1) than their synonymous counterparts in the chloroplast genomes of five Asteraceae species.
Table 3: Relative synonymous codon usage in the chloroplast genome of Corydalis yanhusuo.
| Amino Acid | Codon | n | RSCU | Amino Acid | Codon | n | RSCU |
|---|---|---|---|---|---|---|---|
| Phe | UUU | 677 | 1.22 | Ala | GCU | 458 | 1.62 |
| UUC | 431 | 0.78 | GCC | 192 | 0.68 | ||
| Leu | UUA | 564 | 1.58 | GCA | 318 | 1.13 | |
| UUG | 453 | 1.27 | GCG | 162 | 0.57 | ||
| CUU | 452 | 1.26 | His | CAU | 367 | 1.47 | |
| CUC | 192 | 0.54 | CAC | 131 | 0.53 | ||
| CUA | 293 | 0.82 | Gln | CAA | 571 | 1.49 | |
| CUG | 190 | 0.53 | CAG | 198 | 0.51 | ||
| Ile | AUU | 765 | 1.46 | Asn | AAU | 688 | 1.51 |
| AUC | 356 | 0.68 | AAC | 221 | 0.49 | ||
| AUA | 454 | 0.86 | Lys | AAA | 763 | 1.43 | |
| Met | AUG | 464 | 1.00 | AAG | 307 | 0.57 | |
| Val | GUU | 385 | 1.39 | Asp | GAU | 599 | 1.52 |
| GUC | 163 | 0.59 | GAC | 187 | 0.48 | ||
| GUA | 377 | 1.37 | Glu | GAA | 799 | 1.44 | |
| GUG | 179 | 0.65 | GAG | 314 | 0.56 | ||
| Ser | UCU | 424 | 1.66 | Cys | UGU | 161 | 1.48 |
| UCC | 265 | 1.03 | UGC | 57 | 0.52 | ||
| UCA | 282 | 1.10 | Trp | UGG | 370 | 1.00 | |
| UCG | 164 | 0.64 | Arg | CGU | 283 | 1.34 | |
| AGU | 302 | 1.18 | CGC | 90 | 0.43 | ||
| AGC | 100 | 0.39 | CGA | 298 | 1.41 | ||
| Pro | CCU | 341 | 1.53 | CGG | 94 | 0.44 | |
| CCC | 172 | 0.77 | AGA | 363 | 1.72 | ||
| CCA | 263 | 1.18 | AGG | 141 | 0.67 | ||
| CCG | 118 | 0.53 | Gly | GGU | 426 | 1.22 | |
| Thr | ACU | 393 | 1.49 | GGC | 180 | 0.52 | |
| ACC | 227 | 0.86 | GGA | 508 | 1.45 | ||
| ACA | 298 | 1.13 | GGG | 284 | 0.81 | ||
| ACG | 135 | 0.51 | TER | UAA | 22 | 1.32 | |
| Tyr | UAU | 555 | 1.60 | UAG | 12 | 0.72 | |
| UAC | 138 | 0.40 | UGA | 16 | 0.96 |
The results of the neutral plot analysis for the CDS codon bases of the C. yanhusuo chloroplast genome are illustrated in Fig. 3. The x-axis (GC3) ranged from 0.2445 to 0.3953, and the y-axis (GC12) ranged from 0.3326 to 0.5767. Most genes were distributed above the diagonal, while only one gene, cemA, which encodes an envelope membrane protein, was located below the diagonal. The correlation coefficient between GC3 and GC12 was −0.091 (p > 0.05), indicating no significant correlation. The slope of the regression line was −0.1317, suggesting that base mutation contributes approximately 13.17% to codon usage bias. These results indicate that codon usage bias in the C. yanhusuo chloroplast genome is mainly influenced by natural selection. In evolutionary biology, mutation pressure and natural selection are the main forces driving species or gene evolution, and a regression coefficient close to zero implies that natural selection plays the dominant role in shaping codon usage bias [44].
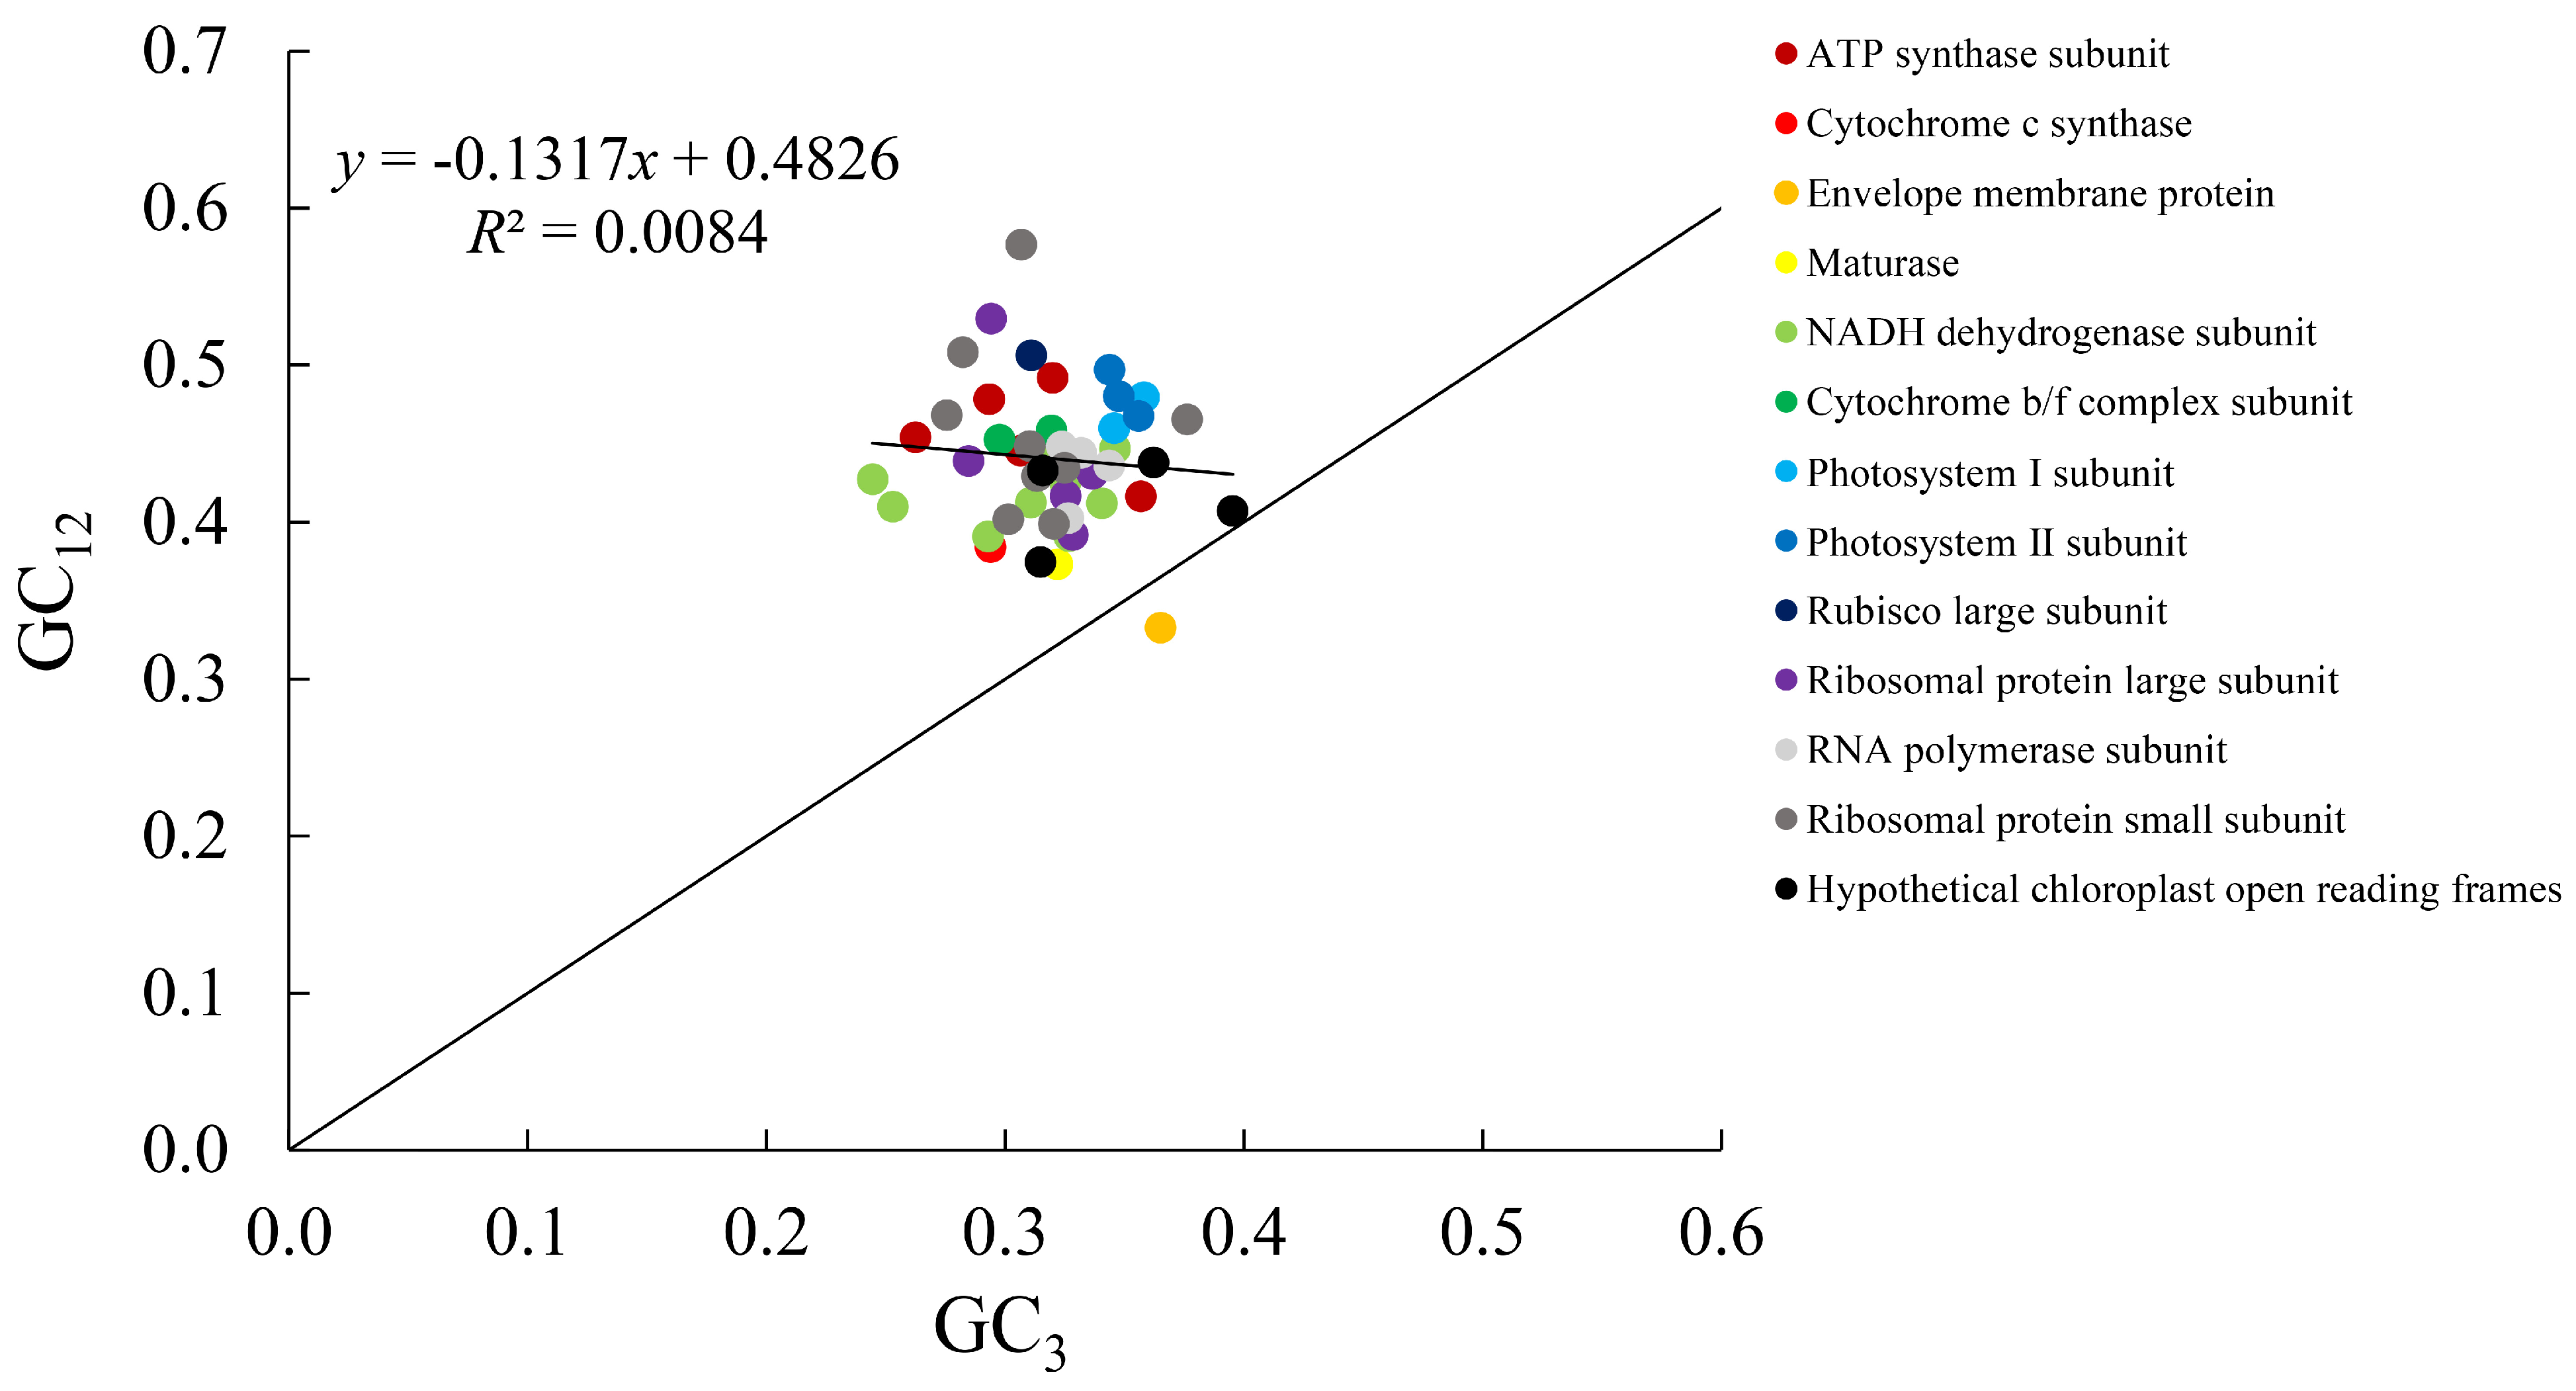
Figure 3: Neutrality plot analysis of the Corydalis yanhusuo chloroplast genome.
As illustrated in Fig. 4, a small number of genes in the C. yanhusuo chloroplast genome were distributed close to the expected ENC curve, while most genes deviated from the theoretical values and were scattered on both sides of the curve. Notably, more than half of the genes were located below the standard curve, suggesting that their codon usage bias is likely more strongly influenced by natural selection. Overall, the codon usage bias in the C. yanhusuo chloroplast genome appears to be shaped by the combined effects of mutation pressure and natural selection.
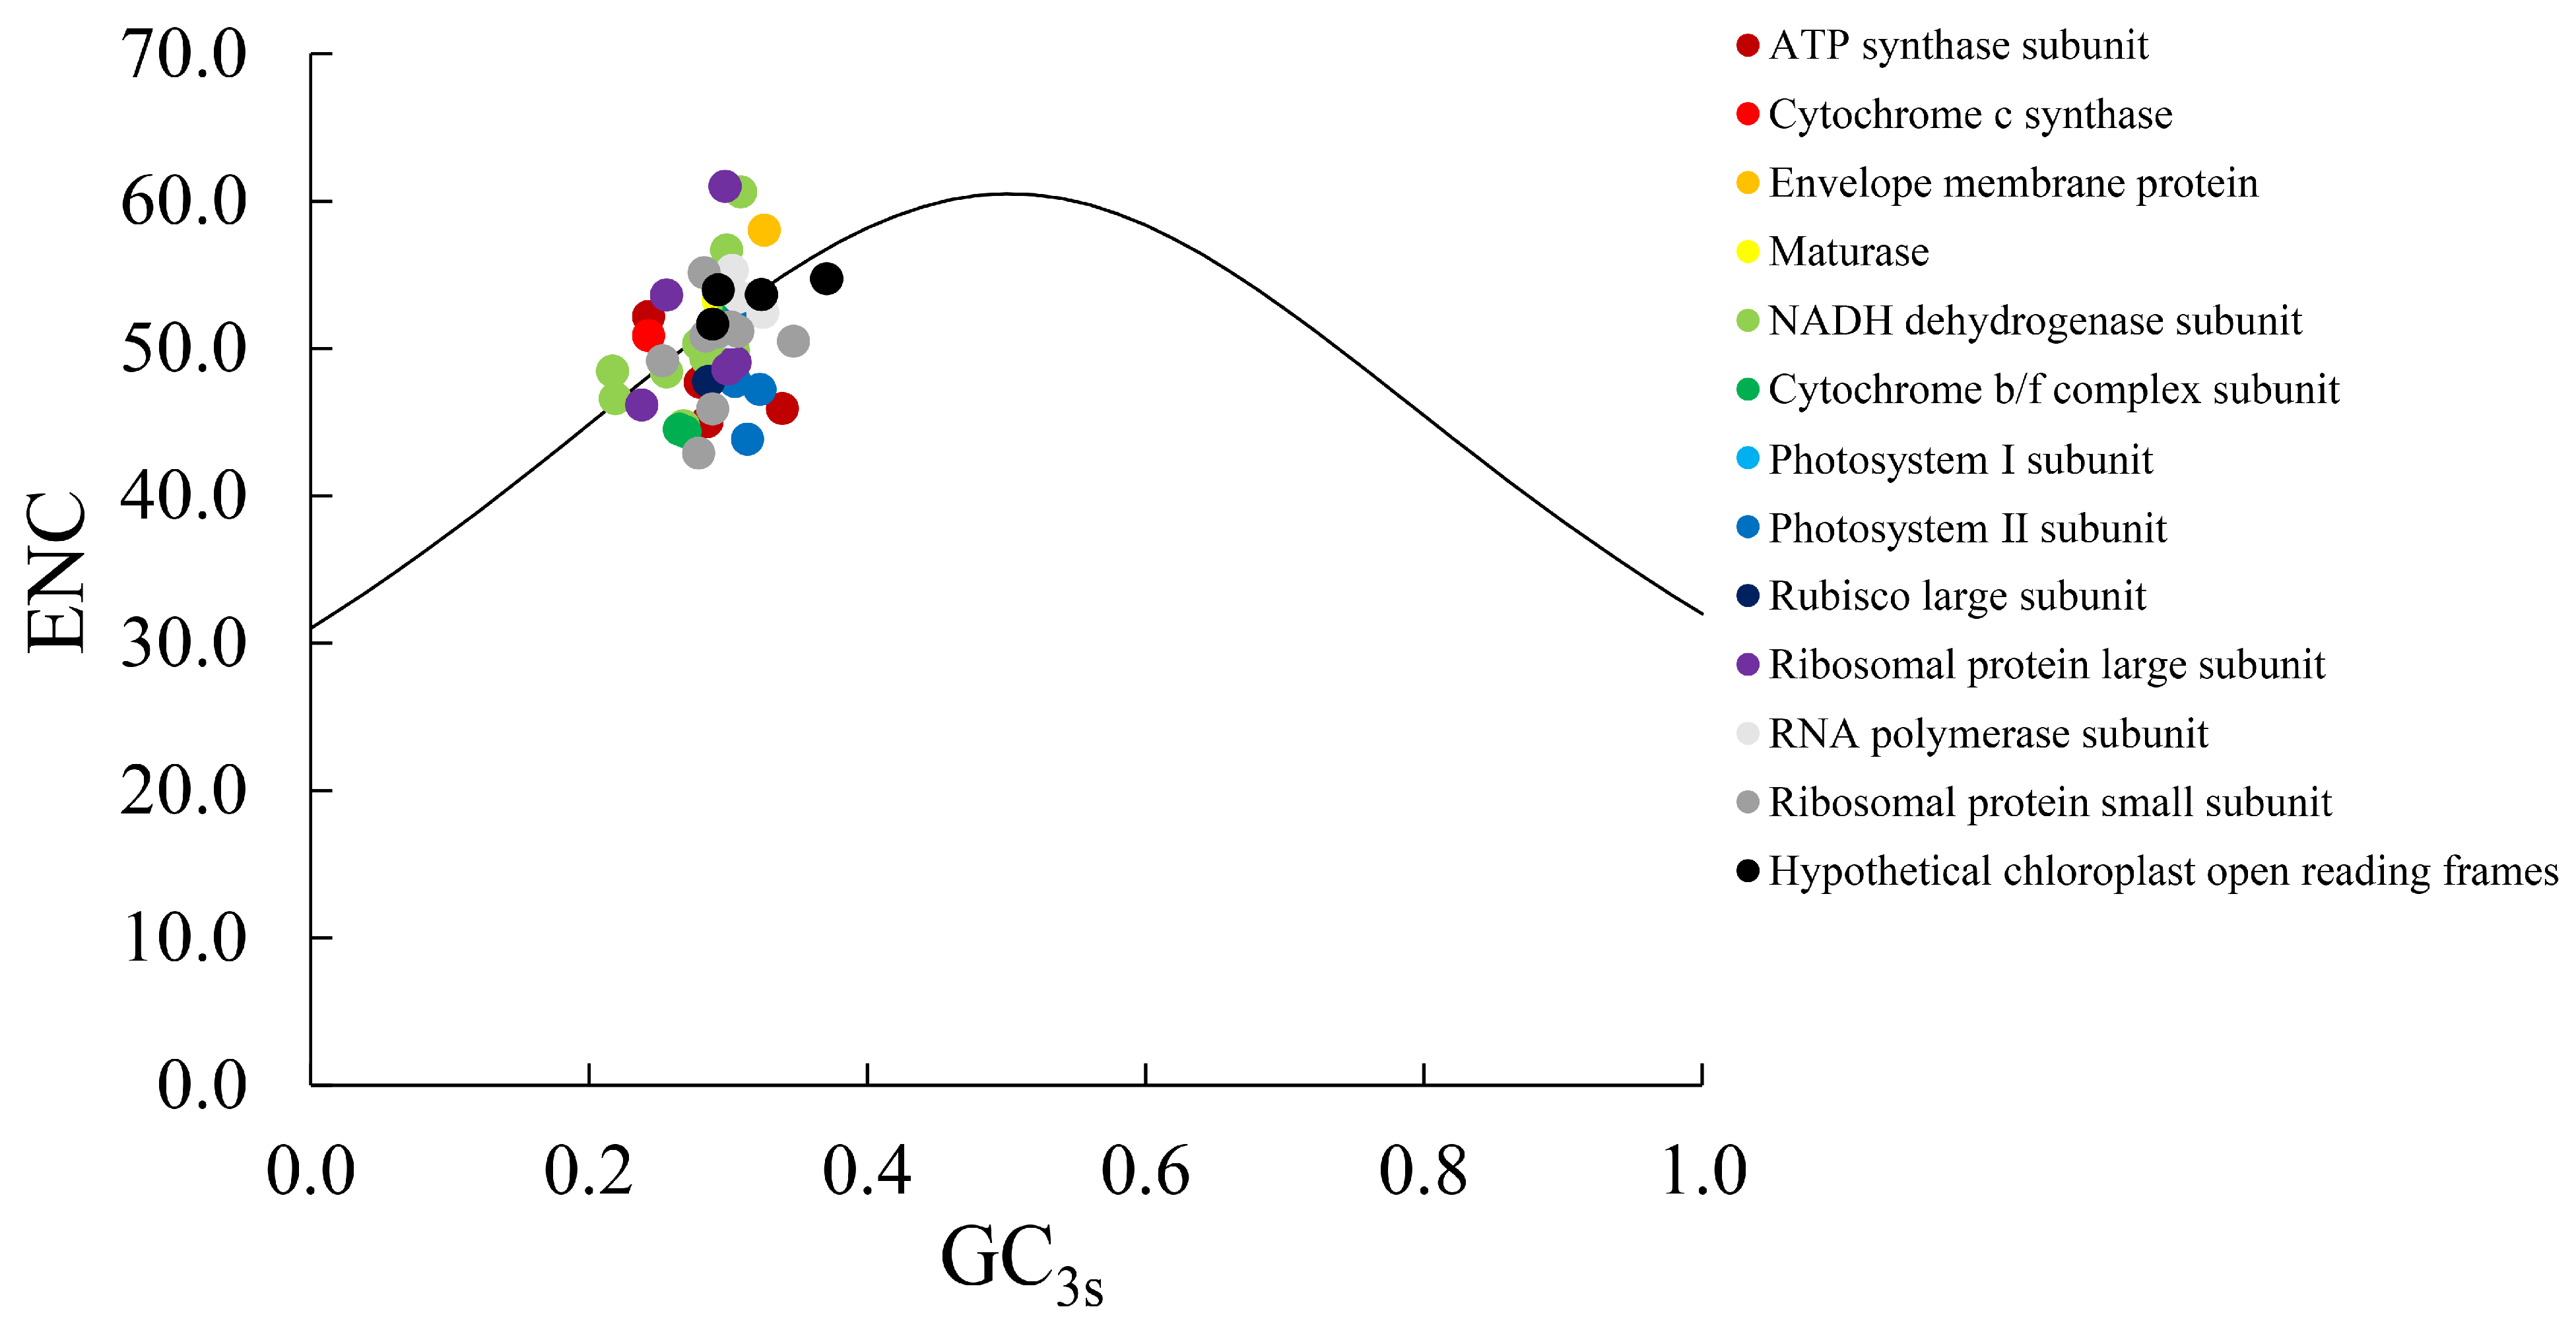
Figure 4: ENC-Plot analysis of the Corydalis yanhusuo chloroplast genome.
The results of the Parity Rule 2 (PR2) analysis are illustrated in Fig. 5. The 50 gene loci were unevenly distributed across the four quadrants: 26 genes were located in the region where G3/(G3 + C3) > 0.5 (right side of the plot), and 32 genes had A3/(A3 + T3) values below 0.5 (lower portion of the plot). These patterns indicate that in the CDS codons of the C. yanhusuo chloroplast genome, guanine (G) is used more frequently than cytosine (C) at the third codon position, and thymine (T) is used more frequently than adenine (A). Moreover, codon usage bias appears to be influenced by both mutation and natural selection, with natural selection playing the dominant role.
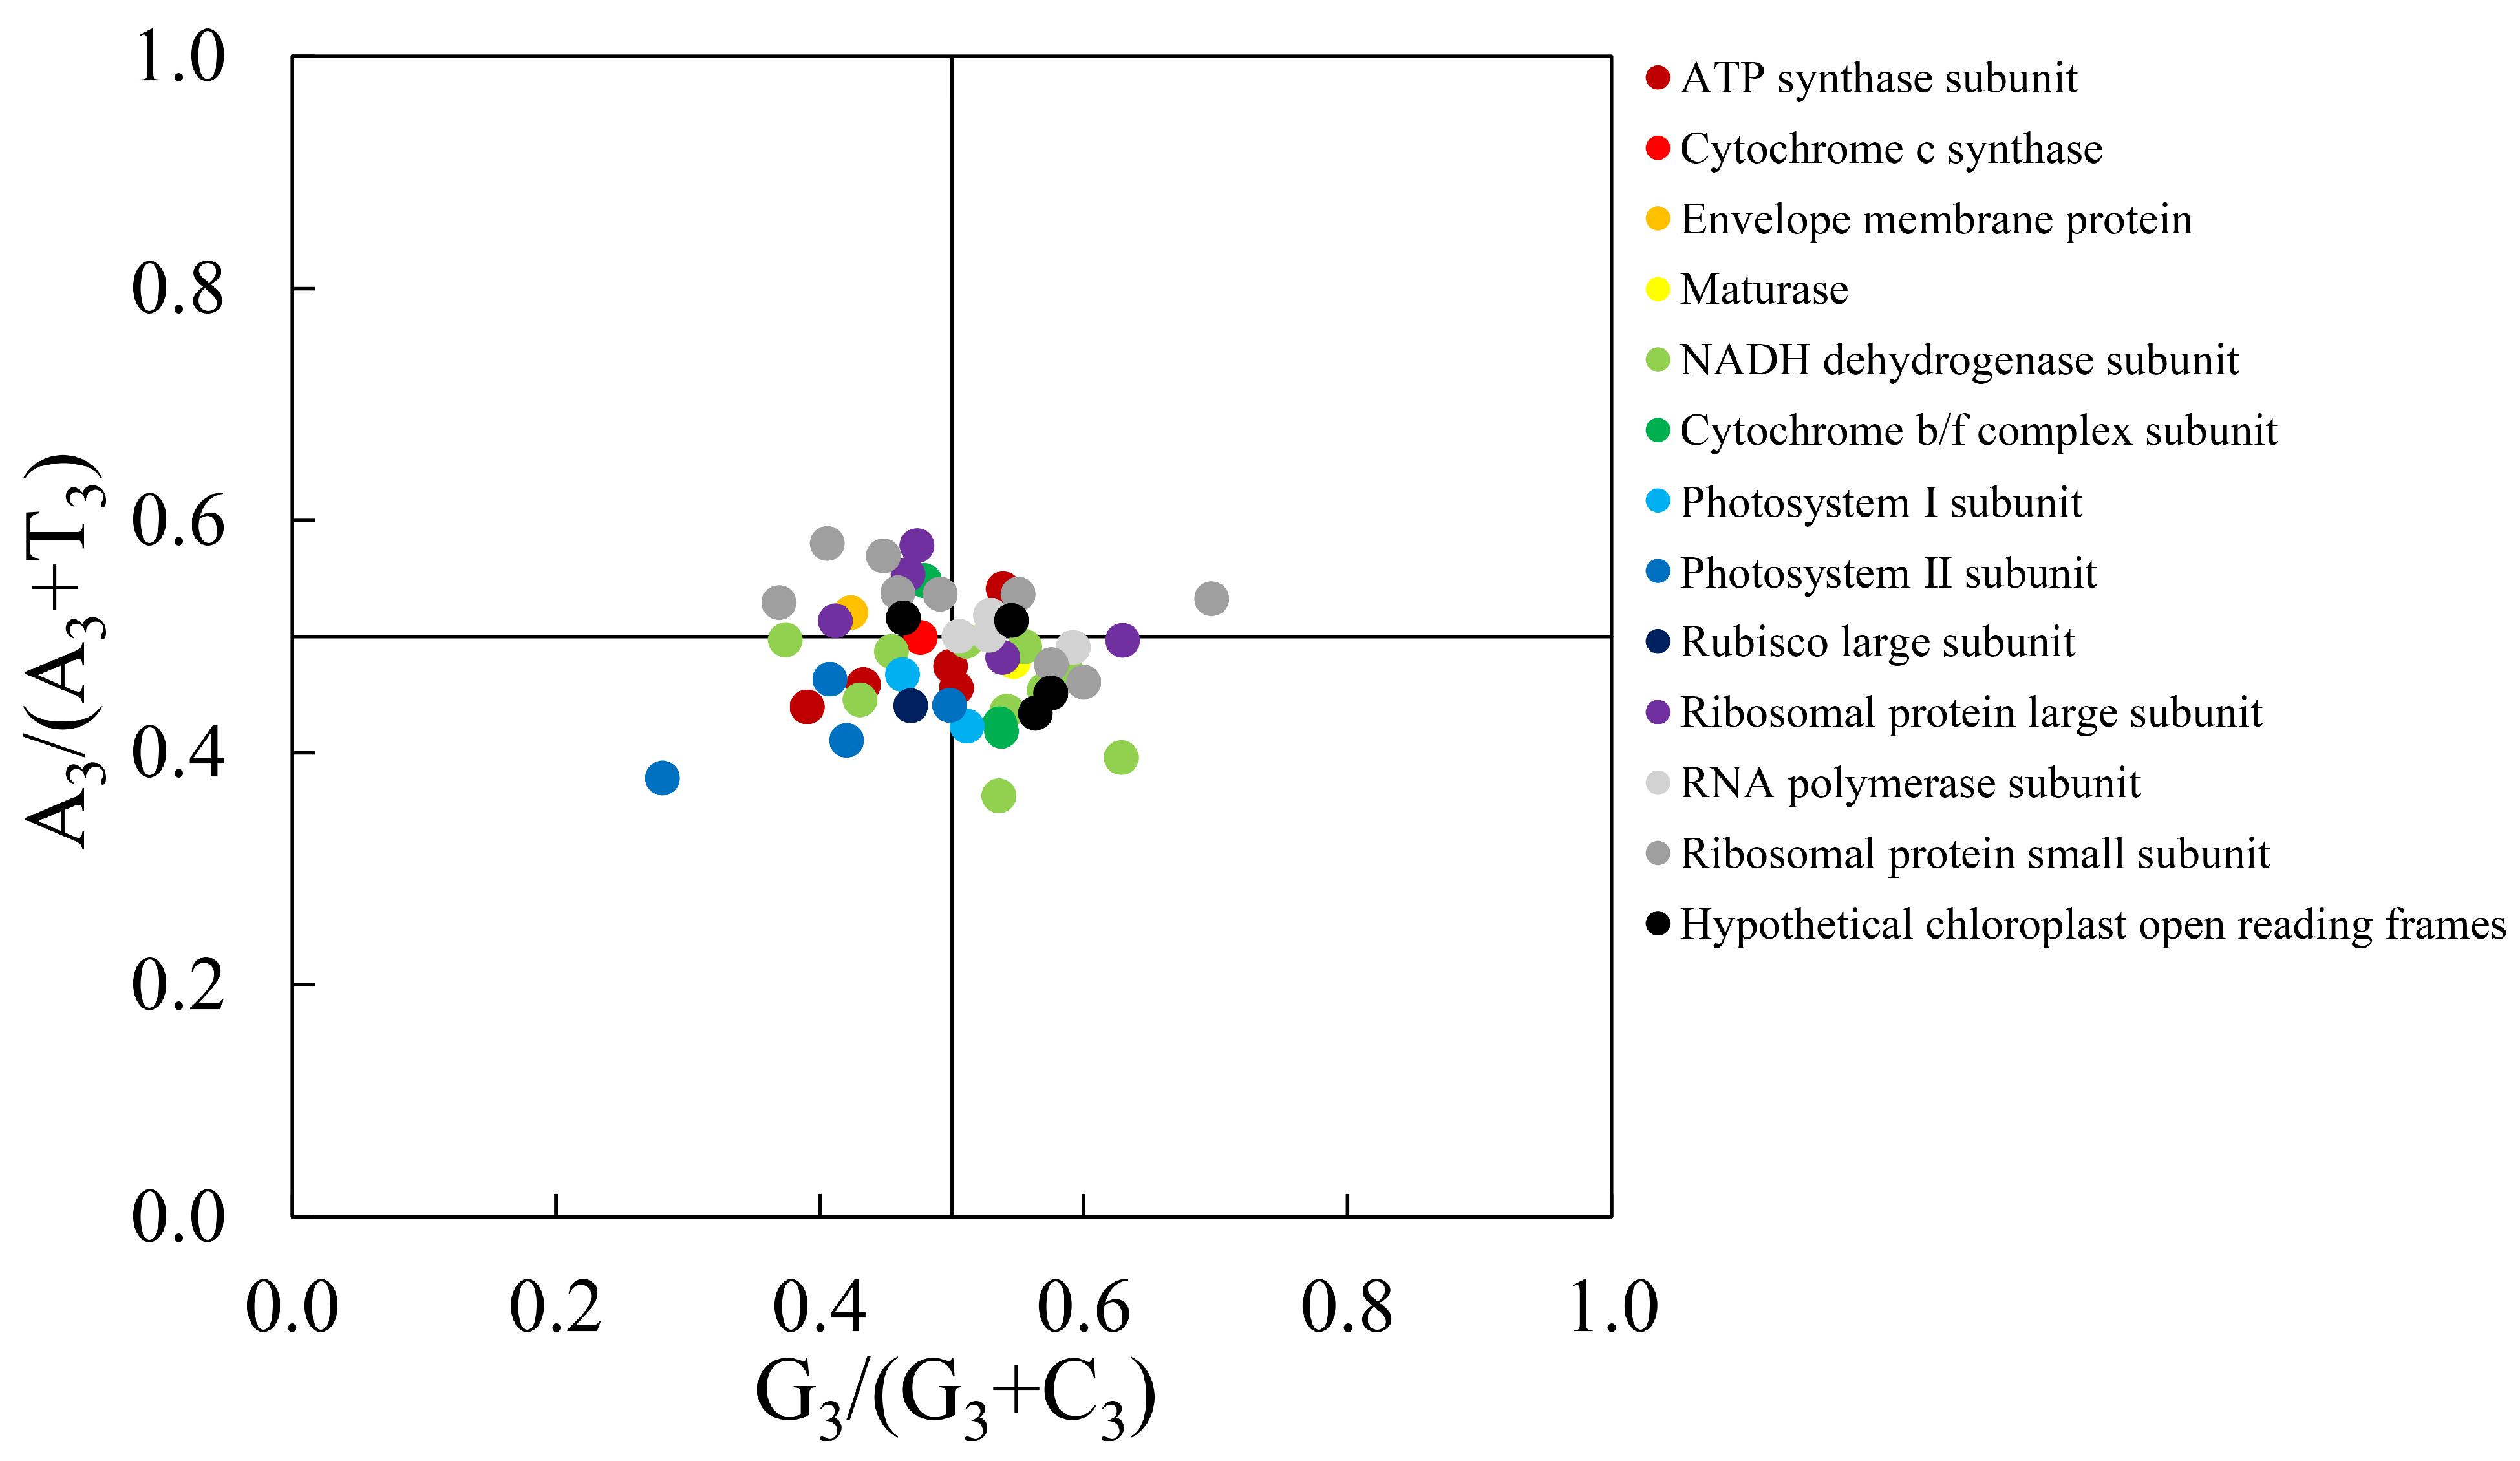
Figure 5: PR2-Plot analysis of the chloroplast genome of Corydalis yanhusuo.
3.5 Analysis of Optimal Codons
Identifying optimal codons in the chloroplast genome can enhance translation efficiency and gene expression accuracy. In this study, the 50 CDS were ranked in ascending order of their ENC values. The genes rps12, psbA, petD, petB, and ndhC, with the lowest ENC values, were classified as the high-expression library, while rpoA, ndhE, cemA, ndhJ, and rpl23, with the highest ENC values, were assigned to the low-expression group (Table 2). The RSCU values of both groups and the corresponding ΔRSCU value were calculated, and optimal codons were identified by selecting those with ΔRSCU > 0.08 and RSCU > 1 [33]. As shown in Table 3, a total of 30 high-frequency codons were identified based on RSCU values greater than 1; of these, 28 codons ended with U or A, while only two codons, UUG and UCC, encoding leucine and serine, respectively, ended with G and C. This result is consistent with findings from the Caragana chloroplast genome [45]. In addition, 23 codons with ΔRSCU ≥ 0.08 were identified as high-expression codons (Table 4). By selecting codons that were both high-expression and high-frequency, 16 optimal codons were ultimately determined: UUA, AUU, GUU, GUA, UCU, AGU, CCU, ACU, GCU, CAA, AAA, GAU, UGU, CGU, CGA, and GGU. All of these optimal codons end with A or U, confirming that codons in the C. yanhusuo chloroplast genome preferentially terminate with A or U. This finding is consistent with the RSCU results described above and with observations in Codonopsis chloroplast genomes [46].
Previous studies have proposed that codon usage bias is a key factor for enhancing recombinant protein expression in heterologous expression systems. Natural selection shapes codon usage by favoring translation-optimal codons, thereby improving the translational efficiency of specific genes and creating fitness differences among synonymous codons [47]. Given that each plant cell contains numerous copies of the chloroplast genome, transgenes inserted into chloroplasts can be expressed at extremely high levels, reaching up to 70% of total leaf protein. Generally, stronger codon usage bias correlates with higher gene expression levels. By selecting optimal codons for constructing gene expression vectors, the efficiency of gene expression can be significantly enhanced [48]. Therefore, identifying optimal codons in the C. yanhusuo chloroplast genome may provide a foundation for optimizing gene expression and facilitating molecular breeding.
Table 4: Optimal codon analysis of the chloroplast genome of Corydalis yanhusuo.
| Amino Acid | Codon | High-Expression Gene | Low-Expression Gene | ΔRSCU | ||
|---|---|---|---|---|---|---|
| n | RSCU | n | RSCU | |||
| Phe | UUU | 36 | 1.14 | 27 | 1.20 | −0.06 |
| UUC | 27 | 0.86 | 18 | 0.80 | 0.06 | |
| Leu | UUA* | 34 | 2.10 | 21 | 1.21 | 0.89 |
| UUG | 19 | 1.18 | 24 | 1.38 | −0.20 | |
| CUU | 18 | 1.11 | 26 | 1.50 | −0.39 | |
| CUC | 4 | 0.25 | 6 | 0.35 | −0.10 | |
| CUA | 16 | 0.99 | 17 | 0.98 | 0.01 | |
| CUG | 6 | 0.37 | 10 | 0.58 | −0.21 | |
| Ile | AUU* | 41 | 1.64 | 41 | 1.38 | 0.26 |
| AUC* | 20 | 0.80 | 21 | 0.71 | 0.09 | |
| AUA | 14 | 0.56 | 27 | 0.91 | −0.35 | |
| Met | AUG | 31 | 1.00 | 26 | 1.00 | 0.00 |
| Val | GUU* | 31 | 1.43 | 15 | 1.20 | 0.23 |
| GUC | 8 | 0.37 | 13 | 1.04 | −0.67 | |
| GUA* | 36 | 1.66 | 16 | 1.28 | 0.38 | |
| GUG | 12 | 0.55 | 6 | 0.48 | 0.07 | |
| Ser | UCU* | 23 | 2.26 | 18 | 1.54 | 0.72 |
| UCC | 5 | 0.49 | 12 | 1.03 | −0.54 | |
| UCA | 8 | 0.79 | 11 | 0.94 | −0.15 | |
| UCG | 5 | 0.49 | 8 | 0.69 | −0.20 | |
| AGU* | 14 | 1.38 | 13 | 1.11 | 0.27 | |
| AGC | 6 | 0.59 | 8 | 0.69 | −0.10 | |
| Pro | CCU* | 24 | 1.68 | 8 | 0.82 | 0.86 |
| CCC | 10 | 0.70 | 8 | 0.82 | −0.12 | |
| CCA | 16 | 1.12 | 15 | 1.54 | −0.42 | |
| CCG | 7 | 0.49 | 8 | 0.82 | −0.33 | |
| Thr | ACU* | 27 | 1.89 | 13 | 1.44 | 0.45 |
| ACC* | 15 | 1.05 | 4 | 0.44 | 0.61 | |
| ACA | 10 | 0.70 | 14 | 1.56 | −0.86 | |
| ACG | 5 | 0.35 | 5 | 0.56 | −0.21 | |
| Tyr | UAU | 26 | 1.44 | 29 | 1.71 | −0.27 |
| UAC* | 10 | 0.56 | 5 | 0.29 | 0.27 | |
| Ala | GCU* | 38 | 2.00 | 12 | 1.14 | 0.86 |
| GCC* | 13 | 0.68 | 6 | 0.57 | 0.11 | |
| GCA | 18 | 0.95 | 15 | 1.43 | −0.48 | |
| GCG | 7 | 0.37 | 9 | 0.86 | −0.49 | |
| His | CAU | 10 | 1.00 | 28 | 1.56 | −0.56 |
| CAC* | 10 | 1.00 | 8 | 0.44 | 0.56 | |
| Gln | CAA* | 18 | 1.71 | 23 | 1.59 | 0.12 |
| CAG | 3 | 0.29 | 6 | 0.41 | −0.12 | |
| Asn | AAU | 15 | 0.86 | 40 | 1.54 | −0.68 |
| AAC* | 20 | 1.14 | 12 | 0.46 | 0.68 | |
| Lys | AAA* | 23 | 1.64 | 36 | 1.33 | 0.31 |
| AAG | 5 | 0.36 | 18 | 0.67 | −0.31 | |
| Asp | GAU* | 19 | 1.65 | 25 | 1.28 | 0.37 |
| GAC | 4 | 0.35 | 14 | 0.72 | −0.37 | |
| Glu | GAA | 36 | 1.57 | 50 | 1.54 | 0.03 |
| GAG | 10 | 0.43 | 15 | 0.46 | −0.03 | |
| Cys | UGU* | 7 | 2.00 | 9 | 1.64 | 0.36 |
| UGC | 0 | 0.00 | 2 | 0.36 | −0.36 | |
| Trp | UGG | 22 | 1.00 | 18 | 1.00 | 0.00 |
| Arg | CGU* | 19 | 2.19 | 10 | 1.30 | 0.89 |
| CGC | 6 | 0.69 | 5 | 0.65 | 0.04 | |
| CGA* | 12 | 1.38 | 5 | 0.65 | 0.73 | |
| CGG | 3 | 0.35 | 5 | 0.65 | −0.30 | |
| AGA | 9 | 1.04 | 15 | 1.96 | −0.92 | |
| AGG | 3 | 0.35 | 6 | 0.78 | −0.43 | |
| Gly | GGU* | 40 | 1.90 | 10 | 0.91 | 0.99 |
| GGC | 9 | 0.43 | 6 | 0.55 | −0.12 | |
| GGA | 23 | 1.10 | 23 | 2.09 | −0.99 | |
| GGG* | 12 | 0.57 | 5 | 0.45 | 0.12 | |
| TER | UAA | 3 | 1.20 | 1 | 1.00 | |
| UAG | 2 | 0.80 | 1 | 1.00 | ||
| TER | UGA | 0 | 0.00 | 3 | 1.00 | |
In this study, the chloroplast genome of the medicinal plant C. yanhusuo was resequenced, assembled, and analyzed, and codon usage bias was comprehensively investigated based on 50 protein-coding sequences. Analysis of GCall and GC3 contents, together with the observed pattern GC3 < GC2 < GC1, indicated that codons in C. yanhusuo chloroplast genome preferentially end with A or U. Further analyses, including calculations of ENC and RSCU values, as well as neutral-plot and ENC-plot assessments, confirmed that codon usage bias in this plant is relatively weak, with natural selection exerting a greater influence on codon usage patterns than mutation. In total, 30 high-frequency codons, 23 high-expression codons, and 16 optimal codons were identified in the chloroplast genome, with the third base of the optimal codons showing a strong preference for A or U. Overall, these results provide insight into the genomic composition and codon usage patterns of the C. yanhusuo chloroplast genome. This study establishes a foundational dataset that can support future research on gene expression, chloroplast genetic engineering, and the phylogenetic evolution of C. yanhusuo.
Acknowledgement:
Funding Statement: This research was funded by General Program of Natural Sciences Basic Research of Shaanxi Provincial Department of Science and Technology (2024JC-YBMS-761); the Youth Innovation Team Construction Scientific Research Program of Shaanxi Provincial Department of Education (21JP030); the Special Funds Project for Traditional Chinese Medicine of the Shaanxi Provincial Administration of TCM (No. 2021-QYZL-02); and the Project of the Shaanxi Provincial Natural Science Foundation (2023-JC-QN-0996).
Author Contributions: The authors confirm contribution to the paper as follows: Study conception and design: Bo Li; Data collection: Yuying Liang, Muqing He; Analysis and interpretation of results: Bo Li, Xiuhe Fan, Honghong Jiao; Draft manuscript preparation: Bo Li, Yuying Liang, Muqing He. All authors reviewed and approved the final version of the manuscript.
Availability of Data and Materials: The datasets used and/or analyzed during the current study are available from the corresponding author on reasonable request.
Ethics Approval: Not applicable.
Conflicts of Interest: The authors declare no conflicts of interest.
References
1. Daniell H , Lin CS , Yu M , Chang WJ . Chloroplast genomes: diversity, evolution, and applications in genetic engineering. Genome Biol. 2016; 17( 1): 134. doi:10.1186/s13059-016-1004-2. [Google Scholar] [CrossRef]
2. Dobrogojski J , Adamiec M , Luciński R . The chloroplast genome: a review. Acta Physiol Plant. 2020; 42( 6): 98. doi:10.1007/s11738-020-03089-x. [Google Scholar] [CrossRef]
3. Zupok A , Kozul D , Schöttler MA , Niehörster J , Garbsch F , Liere K , et al. A photosynthesis operon in the chloroplast genome drives speciation in evening primroses. Plant Cell. 2021; 33( 8): 2583– 601. doi:10.1093/plcell/koab155. [Google Scholar] [CrossRef]
4. Huang X , Coulibaly D , Tan W , Ni Z , Shi T , Li H , et al. The analysis of genetic structure and characteristics of the chloroplast genome in different Japanese apricot germplasm populations. BMC Plant Biol. 2022; 22( 1): 354. doi:10.1186/s12870-022-03731-5. [Google Scholar] [CrossRef]
5. Sabater B . Evolution and function of the chloroplast. Current investigations and perspectives. Int J Mol Sci. 2018; 19( 10): 3095. doi:10.3390/ijms19103095. [Google Scholar] [CrossRef]
6. Zhang Y , Zhang A , Li X , Lu C . The role of chloroplast gene expression in plant responses to environmental stress. Int J Mol Sci. 2020; 21( 17): 6082. doi:10.3390/ijms21176082. [Google Scholar] [CrossRef]
7. Behura SK , Severson DW . Codon usage bias: causative factors, quantification methods and genome-wide patterns: with emphasis on insect genomes. Biol Rev Camb Philos Soc. 2013; 88( 1): 49– 61. doi:10.1111/j.1469-185X.2012.00242.x. [Google Scholar] [CrossRef]
8. Parvathy ST , Udayasuriyan V , Bhadana V . Codon usage bias. Mol Biol Rep. 2022; 49( 1): 539– 65. doi:10.1007/s11033-021-06749-4. [Google Scholar] [CrossRef]
9. Fages-Lartaud M , Hundvin K , Hohmann-Marriott MF . Mechanisms governing codon usage bias and the implications for protein expression in the chloroplast of Chlamydomonas reinhardtii. Plant J. 2022; 112( 4): 919– 45. doi:10.1111/tpj.15970. [Google Scholar] [CrossRef]
10. National Pharmacopoeia Commission. Pharmacopoeia of the People’s Republic of China Volume I. Beijing, China: China Medical Science Press; 2025. p. 145– 6. [Google Scholar]
11. Editorial Committee of Flora of China, Chinese Academy of Sciences. Flora of China. Beijing, China: Science Press; 1999. p. 475– 6. [Google Scholar]
12. Kim SC , Ha YH , Park BK , Jang JE , Kang ES , Kim YS , et al. Comparative analysis of the complete chloroplast genome of Papaveraceae to identify rearrangements within the Corydalis chloroplast genome. PLoS One. 2023; 18( 9): e0289625. doi:10.1371/journal.pone.0289625. [Google Scholar] [CrossRef]
13. Huang X , Xu X , Wang D . Insight from newly sequenced chloroplast genome challenges the primitive position of Corydalis temulifolia (Papaveraceae). Phytotaxa. 2022; 548( 2): 223– 39. doi:10.11646/phytotaxa.548.2.6. [Google Scholar] [CrossRef]
14. Liu YY , Kan SL , Wang JL , Cao YN , Li JM . Complete chloroplast genome sequences of Corydalis edulis and Corydalis shensiana (Papaveraceae). Mitochondrial DNA B Resour. 2021; 6( 1): 257– 8. doi:10.1080/23802359.2020.1863167. [Google Scholar] [CrossRef]
15. Yu Z , Zhou T , Li N , Wang D . The complete chloroplast genome and phylogenetic analysis of Corydalis fangshanensis W.T. Wang ex S.Y. He (Papaveraceae). Mitochondrial DNA B Resour. 2021; 6( 11): 3171– 3. doi:10.1080/23802359.2021.1987172. [Google Scholar] [CrossRef]
16. Wu H , Waldbauer K , Tang L , Xie L , McKinnon R , Zehl M , et al. Influence of vinegar and wine processing on the alkaloid content and composition of the traditional Chinese medicine Corydalis Rhizoma (Yanhusuo). Molecules. 2014; 19( 8): 11487– 504. doi:10.3390/molecules190811487. [Google Scholar] [CrossRef]
17. Jin F , Jiao H , Song Z , Zhang M , Li B , Hua Z , et al. Size-dependent diversity and accumulation of isoquinoline alkaloids in Corydalis yanhusuo tubers. J Appl Res Med Aromat Plants. 2025; 48: 100660. doi:10.1016/j.jarmap.2025.100660. [Google Scholar] [CrossRef]
18. Tian B , Tian M , Huang SM . Advances in phytochemical and modern pharmacological research of Rhizoma Corydalis. Pharm Biol. 2020; 58( 1): 265– 75. doi:10.1080/13880209.2020.1741651. [Google Scholar] [CrossRef]
19. CNCB-NGDC Members and Partners . Database resources of the national genomics data center, China national center for bioinformation in 2024. Nucleic Acids Res. 2024; 52( D1): D18– 32. doi:10.1093/nar/gkad1078. [Google Scholar] [CrossRef]
20. Wang Z , Cai Q , Wang Y , Li M , Wang C , Wang Z , et al. Comparative analysis of codon bias in the chloroplast genomes of Theaceae species. Front Genet. 2022; 13: 824610. doi:10.3389/fgene.2022.824610. [Google Scholar] [CrossRef]
21. Liu H , He R , Zhang H , Huang Y , Tian M , Zhang J . Analysis of synonymous codon usage in Zea mays. Mol Biol Rep. 2010; 37( 2): 677– 84. doi:10.1007/s11033-009-9521-7. [Google Scholar] [CrossRef]
22. Hu H , Dong B , Fan X , Wang M , Wang T , Liu Q . Mutational bias and natural selection driving the synonymous codon usage of single-exon genes in rice (Oryza sativa L.). Rice. 2023; 16( 1): 11. doi:10.1186/s12284-023-00627-2. [Google Scholar] [CrossRef]
23. Wright F . The ‘effective number of codons’ used in a gene. Gene. 1990; 87( 1): 23– 9. doi:10.1016/0378-1119(90)90491-9. [Google Scholar] [CrossRef]
24. Chen J , Ma W , Hu X , Zhou K . Synonymous codon usage bias in the chloroplast genomes of 13 oil-tea Camellia samples from South China. Forests. 2023; 14( 4): 794. doi:10.3390/f14040794. [Google Scholar] [CrossRef]
25. Li Y , Hu X , Xiao M , Huang J , Lou Y , Hu F , et al. An analysis of codon utilization patterns in the chloroplast genomes of three species of Coffea. BMC Genom Data. 2023; 24( 1): 42. doi:10.1186/s12863-023-01143-4. [Google Scholar] [CrossRef]
26. Huang JL , Sun GL , Zhang DM . Molecular evolution and phylogeny of the angiosperm ycf2 gene. J Syst Evol. 2010; 48( 4): 240– 8. doi:10.1111/j.1759-6831.2010.00080.x. [Google Scholar] [CrossRef]
27. Rao Y , Wang Z , Chai X , Nie Q , Zhang X . Hydrophobicity and aromaticity are primary factors shaping variation in amino acid usage of chicken proteome. PLoS One. 2014; 9( 10): e110381. doi:10.1371/journal.pone.0110381. [Google Scholar] [CrossRef]
28. Xu X , Wang D . Comparative chloroplast genomics of Corydalis species (Papaveraceae): evolutionary perspectives on their unusual large scale rearrangements. Front Plant Sci. 2021; 11: 600354. doi:10.3389/fpls.2020.600354. [Google Scholar] [CrossRef]
29. Kusumi J , Tachida H . Compositional properties of green-plant plastid genomes. J Mol Evol. 2005; 60( 4): 417– 25. doi:10.1007/s00239-004-0086-8. [Google Scholar] [CrossRef]
30. Knight RD , Freeland SJ , Landweber LF . A simple model based on mutation and selection explains trends in codon and amino-acid usage and GC composition within and across genomes. Genome Biol. 2001; 2( 4): RESEARCH0010. doi:10.1186/gb-2001-2-4-research0010. [Google Scholar] [CrossRef]
31. Ren F , Wang L , Li Y , Zhuo W , Xu Z , Guo H , et al. Highly variable chloroplast genome from two endangered Papaveraceae lithophytes Corydalis tomentella and Corydalis Saxicola. Ecol Evol. 2021; 11( 9): 4158– 71. doi:10.1002/ece3.7312. [Google Scholar] [CrossRef]
32. Tang D , Wei F , Cai Z , Wei Y , Khan A , Miao J , et al. Analysis of codon usage bias and evolution in the chloroplast genome of Mesona chinensis Benth. Dev Genes Evol. 2021; 231( 1–2): 1– 9. doi:10.1007/s00427-020-00670-9. [Google Scholar] [CrossRef]
33. Ling L , Zhang S , Yang T . Analysis of codon usage bias in chloroplast genomes of Dryas octopetala var. asiatica (rosaceae). Genes. 2024; 15( 7): 899. doi:10.3390/genes15070899. [Google Scholar] [CrossRef]
34. Jia X , Wei J , Chen Y , Zeng C , Deng C , Zeng P , et al. Codon usage patterns and genomic variation analysis of chloroplast genomes provides new insights into the evolution of Aroideae. Sci Rep. 2025; 15: 4333. doi:10.1038/s41598-025-88244-5. [Google Scholar] [CrossRef]
35. Sablok G , Nayak KC , Vazquez F , Tatarinova TV . Synonymous codon usage, GC3, and evolutionary patterns across plastomes of three pooid model species: emerging grass genome models for monocots. Mol Biotechnol. 2011; 49( 2): 116– 28. doi:10.1007/s12033-011-9383-9. [Google Scholar] [CrossRef]
36. Sun X , Yang Q , Xia X . An improved implementation of effective number of codons (nc). Mol Biol Evol. 2013; 30( 1): 191– 6. doi:10.1093/molbev/mss201. [Google Scholar] [CrossRef]
37. Sheng W , Lei X , Chen X , Kuang Q . Structural characterization of chloroplast genome in Alpinia japonica (thunb.) Miq., a medicinal plant of the genus Alpinia. Phyton. 2024; 93( 8): 1897– 911. doi:10.32604/phyton.2024.052395. [Google Scholar] [CrossRef]
38. Li G , Zhang L , Xue P , Zhu M . Comparative analysis on the codon usage pattern of the chloroplast genomes in Malus species. Biochem Genet. 2023; 61( 3): 1050– 64. doi:10.1007/s10528-022-10302-8. [Google Scholar] [CrossRef]
39. Robbins EHJ , Kelly S . The evolutionary constraints on angiosperm chloroplast adaptation. Genome Biol Evol. 2023; 15( 6): evad101. doi:10.1093/gbe/evad101. [Google Scholar] [CrossRef]
40. Zhang R , Zhang L , Wang W , Zhang Z , Du H , Qu Z , et al. Differences in codon usage bias between photosynthesis-related genes and genetic system-related genes of chloroplast genomes in cultivated and wild Solanum species. Int J Mol Sci. 2018; 19( 10): 3142. doi:10.3390/ijms19103142. [Google Scholar] [CrossRef]
41. Kalkus A , Barrett J , Ashok T , Morton BR . Evidence from simulation studies for selective constraints on the codon usage of the Angiosperm psbA gene. PLoS Comput Biol. 2021; 17( 10): e1009535. doi:10.1371/journal.pcbi.1009535. [Google Scholar] [CrossRef]
42. Nakamura M , Sugiura M . Translation efficiencies of synonymous codons for arginine differ dramatically and are not correlated with codon usage in chloroplasts. Gene. 2011; 472( 1–2): 50– 4. doi:10.1016/j.gene.2010.09.008. [Google Scholar] [CrossRef]
43. Nie X , Deng P , Feng K , Liu P , Du X , You FM , et al. Comparative analysis of codon usage patterns in chloroplast genomes of the Asteraceae family. Plant Mol Biol Rep. 2014; 32( 4): 828– 40. doi:10.1007/s11105-013-0691-z. [Google Scholar] [CrossRef]
44. Wang Y , Jiang D , Guo K , Zhao L , Meng F , Xiao J , et al. Comparative analysis of codon usage patterns in chloroplast genomes of ten Epimedium species. BMC Genom Data. 2023; 24( 1): 3. doi:10.1186/s12863-023-01104-x. [Google Scholar] [CrossRef]
45. Li X , Liu L , Ren Q , Zhang T , Hu N , Sun J , et al. Analysis of synonymous codon usage bias in the chloroplast genome of five Caragana. BMC Plant Biol. 2025; 25( 1): 322. doi:10.1186/s12870-025-06351-x. [Google Scholar] [CrossRef]
46. Yan F , Wu S , Zhou Y , Wei S . Natural selection-driven A/U-ending preference in codon usage patterns of Codonopsis chloroplast genomes. Genet Resour Crop Evol. 2025; 73( 1): 49. doi:10.1007/s10722-025-02705-4. [Google Scholar] [CrossRef]
47. Suzuki H , Morton BR . Codon adaptation of plastid genes. PLoS One. 2016; 11( 5): e0154306. doi:10.1371/journal.pone.0154306. [Google Scholar] [CrossRef]
48. Kwon KC , Chan HT , León IR , Williams-Carrier R , Barkan A , Daniell H . Codon optimization to enhance expression yields insights into chloroplast translation. Plant Physiol. 2016; 172( 1): 62– 77. doi:10.1104/pp.16.00981. [Google Scholar] [CrossRef]
Cite This Article
 Copyright © 2026 The Author(s). Published by Tech Science Press.
This work is licensed under a Creative Commons Attribution 4.0 International License , which permits unrestricted use, distribution, and reproduction in any medium, provided the original work is properly cited.
 Downloads
 Citation Tools