
 Submit a Paper
 Propose a Special lssue
 Open Access
ARTICLE

Genetic Diversity of Soursop (Annona muricata L.) Accessions from Mexico and Colombia
1 Programa de Doctorado en Ciencias Biológico Agropecuarias en el Área de Ciencias Agrícolas, Universidad Autónoma de Nayarit, Carretera Tepic-Compostela km. 9, Xalisco, México
2 INIFAP-CIRPAC, Campo experimental Uruapan. Av. Latinoamericana Núm. 1101, col. Revolución, Uruapan, México
3 Estancias Posdoctorales-Secretaría de Ciencia, Humanidades, Tecnología e Innovación, Coordinación de Apoyos a Becarios e Investigadores. Dirección de Posgrado. Av. Insurgentes Sur 1582, Col. Crédito Constructor, Demarcación Territorial Benito Juárez, Ciudad de México, México
4 Unidad Académica de Agricultura, Universidad Autónoma de Nayarit, Carretera Tepic-Compostela km 9, Xalisco, México
5 Unidad de Tecnología de Alimentos-Secretaría de Investigación y Posgrado, Universidad Autónoma de Nayarit, Ciudad de la Cultura s/n., Tepic, México
* Corresponding Authors: Rosendo Balois-Morales. Email: ; Guillermo Berumen-Varela. Email:
(This article belongs to the Special Issue: Advances in the Physiological, Biochemical and Molecular Mechanisms Regulating Fruit Ripening in Tropical Fruits)
Phyton-International Journal of Experimental Botany 2026, 95(3), 13 https://doi.org/10.32604/phyton.2026.077481
Received 10 December 2025; Accepted 20 February 2026; Issue published 31 March 2026
 View Full Text
 Download PDF
Abstract
Genetic diversity is essential for the conservation and genetic improvement of perennial fruit crops such as soursop (Annona muricata L.), an economically important species in tropical and subtropical regions. However, information on the genetic variability of soursop across different producing regions remains limited. In this study, we evaluated the genetic diversity and population structure of soursop accessions from two geographically distant producing regions: the Pacific–Occident region of Mexico (R1) and Valle del Cauca, Colombia (R2). A total of 11 accessions, collected from seven orchards in R1 and four orchards in R2, were analyzed using three simple sequence repeat (SSR) markers (LMCH36, LMCH43, and LMCH79) and three sequence-related amplified polymorphism (SRAP) marker combinations (me3+em1, me3+em15, and me4+em15). SSR analysis revealed limited polymorphism, as markers LMCH36 and LMCH79 were monomorphic across all accessions. In contrast, the LMCH43 marker showed polymorphic behavior in the Nuevo Urecho, Tecomán 1, and Coquimatlán accessions, allowing the identification of allelic variation and the discrimination between homozygous and heterozygous individuals. SRAP markers exhibited a high level of polymorphism in all evaluated accessions, demonstrating greater efficiency for detecting genetic diversity in A. muricata. The percentage of polymorphic loci ranged from 25.45% to 56.38% in R1 and from 74.55% to 86.46% in R2, with the highest diversity detected using the SRAP combinations me3+em1, me3+em15, and me4+em15. Analysis of molecular variance indicated that most genetic variation was distributed within accessions (82% in R1 and 97% in R2), rather than among accessions. Cluster analysis, principal coordinate analysis, and Bayesian population structure consistently separated the accessions into two main genetic populations corresponding to their geographic origin, with additional sub-structuring within the Mexican region. Overall, Colombian accessions showed higher genetic diversity than Mexican accessions. These results highlight the utility of SRAP markers and the SSR marker LMCH43 for genetic studies in soursop providing valuable information for the conservation of genetic resources and the development of future breeding and genetic improvement programs, particularly in Mexico.Keywords
Soursop (Annona muricata L.) is a tropical fruit of increasing agronomic and economic importance, valued for both its edible fruit and potential health applications. It is widely cultivated in tropical and subtropical regions of the Americas, with Mexico recognized as the leading global producer and distribution extending from Central and South America to the Caribbean and beyond [1]. In Mexico, annual production exceeds 16,000 t, primarily in the states of Nayarit, Colima, and Michoacán, where the fruit is consumed fresh and processed into juices, nectars, and other products, contributing to local incomes and smallholder livelihoods [2]. In Colombia, A. muricata is an important component of tropical fruit systems in Valle del Cauca and other producing areas, where it is marketed locally and regionally and integrated into diverse agroecosystems [1]. Beyond fresh consumption, the crop’s bioactive compounds, including acetogenins, alkaloids, and phenolic constituents, have attracted significant research interest due to reported antioxidant, antimicrobial, and potential therapeutic effects, underpinning a growing ethnobotanical and nutraceutical relevance [2]. Globally, Mexico is followed by countries such as Peru, Brazil, Ecuador, and Haiti in soursop production, and the fruit’s nutritional and phytochemical properties support its expanding role in international fruit markets and value chains [3]. While precise global statistics remain difficult to obtain, this expanding cultivation and diverse utilization highlight A. muricata’s economic, cultural, and potential health significance across producing regions in the Americas and beyond. Genetic resources are essential for agricultural production and food security, as their diversity underpins crop genetic improvement; therefore, their conservation is of paramount importance. The analysis of genetic diversity enables the assessment of variation within and among breeding lines [4], supporting informed selection and breeding strategies. Consequently, preserving plant genetic diversity is critical to ensure its availability to the global community. The characterization of plant genetic resources at regional, national, and international levels is a key step in this process. In this context, characterization refers to the systematic description of plant germplasm, enabling the identification of highly heritable morphological, physiological, and agronomic traits [5]. However, this process is often time-consuming and costly, highlighting the importance of using replicated evaluations, particularly when assessing highly heritable traits.
Biotechnology encompasses a broad range of tools for the conservation and sustainable utilization of genetic resources for food and agriculture, including the application of molecular markers for genetic characterization. Among these, Simple Sequence Repeats (SSR) markers are widely used due to their ability to amplify short tandemly repeated nucleotide motifs (2–6 bp). SSR markers have been applied in population genetic studies of several Annona species, revealing genetic diversity levels ranging from 66.67% and 100% [6]. These markers are co-dominant, locus-specific, highly polymorphic, and reproducible [7]. Another class of molecular marker, Sequence-related amplified polymorphisms (SRAP), targets coding regions of the genome and is valued for its reproducibility and versatility [8]. In contrast to the SSR markers, SRAP markers are dominant, non-locus-specific, and exhibit a medium to high level of polymorphism, while maintaining good reproducibility [7,9]. The use of co-dominant markers allows the detection of multiple alleles at a locus, enabling discrimination between heterozygous and homozygous individuals. In contrast, dominant markers provide only an approximation of allele frequencies. Nevertheless, SRAP markers are simple, cost-effective, and less time-consuming, making them particularly suitable for the analysis of large germplasm collections [10]. Moreover, because SRAP markers are preferentially located within the open reading frame (ORF), they are especially valuable for crop breeding and genetic improvement studies [11].
Genetic diversity has been determined in soursop accessions in countries such as Mexico, Venezuela, Brazil, Colombia, and India, consistently revealing low genetic diversity among accessions from the same country [12,13,14]. To date, only a limited number of varieties of this crop are available worldwide, largely due to the absence of established germplasm banks and formal breeding programs. Therefore, a comprehensive understanding of the molecular characteristics of soursop is required to initiate effective breeding strategies. In this context, the use of co-dominant and dominant markers, such as SSR and SRAP, provides a broader assessment of genetic polymorphism and enables discrimination between homozygotes and heterozygotes across populations from two different countries. Therefore, the objective of this study was to determine the genetic diversity of soursop accessions from two major producing regions: Mexico (Pacifico-Occidente-R1) and Colombia (Valle del Cauca-R2), using SSR and SRAP markers.
Leaf tissue without physical damage, free of pests and diseases was collected from a total of 55 soursop trees, with five sampled per accession, from two geographically distant regions: the Western Pacific region of Mexico (R1) and the Valle del Cauca in Colombia (R2), during the production cycles 2019–2021. A total of 11 accessions were collected, 7 correspond to R1, Tonino (Nayarit), Puerto Vallarta 1 and Puerto Vallarta 2 (Jalisco), Coquimatlán, Tecomán 1 and Tecomán 2 (Colima), and Nuevo Urecho (Michoacán); and 4 accessions of R2: Cascajal, Flamenco, Makro, and Pantano Vargas (Colombia). Nayarit trees have an average age of 33 years, while the Colima trees have between 7 and 10 years. On the other hand, the age is unknown for the trees of Jalisco and Michoacán, as well as the trees of the R2, because they were found in the wild or the backyard. Further, all the trees in this research reproduce sexually. The leaf tissue was stored at −80°C for 48 h in an ultra-freezer (Thermo Scientific Revco Value Series ULT1386-3-a41, Waltham, MA, USA) and subsequently lyophilized at 420 mBar, −46°C, for 48 h (Free Zone 2.5, LABCONCO, Houston, TX, USA). Finally, the tissue was ground (KRUPS GX4100, Solingen, Germany) and stored at 25°C until use.
Genomic DNA was extracted based on the methodology reported by [15]. DNA concentration and purity were determined using a Biotek Synergy HT nano spectrophotometer (BioTek Instruments, Winooski, VT, USA) by measuring absorbance ratios at A260/280 nm and A260/230 nm. Likewise, DNA integrity was verified by electrophoresis on a 1.0% agarose gel. The gels were visualized using a transilluminator coupled to a photodocumenter (Benchtop UV Transilluminator PhotoDoc-ItTM 60 Imaging System, Cambridge, UK). Good quality DNA with a 260/280 ratio between 1.8 and 2.1 was used for the following experiments.
2.3 Molecular Markers and PCR Reaction
The number and sequence of these markers were based on the previously reported by [16,17] for Annonaceae species such as cherimoya and soursop, respectively. This selection enabled a targeted screening of loci that had been previously validated as informative and polymorphic in closely related Annonaceae species. On the other hand, the sequence of the SRAP markers was obtained from those reported by [18], which are designed with a CCGG motif to amplify the exon of ORF regions. This targeted approach reduces experimental complexity and minimizes the inclusion of non-informative markers, while still allowing the reliable detection of genetic variation relevant to our research.
Three SSR markers were selected as shown in Table 1. The PCR reaction consisted of 4 μL of 0.8× RED Taq Ready MixTM PCR Reaction Mix R2523 (Sigma Aldrich Spruce Street, St. Louis, MO, USA), 2 μL of DNA (12.5 ng/μL), and 3 μL of DNase-free water for a final volume of 10 μL. The PCR conditions were as follows: 94°C for 5 min, followed by 35 cycles of 94°C for 40 s, 55°C for 40 s, and 72°C for 1 min with a final extension of 72°C for 10 min. PCR was performed in a Prime Thermal Cycle Thermocycler (5PRIME/02, Cole-Parmer, Stone, Staffordshire, OSA, UK). SSR markers were used to assess band polymorphism among accessions, but were not included in the genetic diversity and population structure analyses.
Table 1: SSR molecular markers and primer sequences used in this study.
| Marker | Forward Primer (5′-3′) | Reverse Primer (5′-3′) |
|---|---|---|
| LMCH36 | ATAGAAGATTTACCCAGGAG | GTAAGTAGCTGATTGTTGATCT |
| LMCH43 | CTAGTTCCAAGACGTGAGAGAT | ATAGGAATAAGGGACTGTTGAG |
| LMCH79 | GAAGCAAGTAGACACGTAGTA | AGGGTTGGTATTTCTTTATAGT |
Three SRAP marker combinations were used in this study (Table 2). The PCR reaction consisted of 4 μL of 0.8× REDTaq ready MixTM PCR Reaction Mix R2523 (Sigma Aldrich Spruce Street, St. Louis, MO, USA), 0.8 μL of each marker (0.5 mM), 1.5 μL of DNA (50 ng/μL), and 3.7 μL of DNase-free water for a final volume of 10 μL. The PCR conditions were as follows: 94°C for 5 min, followed by five cycles at 94°C for 1 min, 35°C for 1 min, and 72°C for 1 min, for denaturation, annealing, and extension, respectively. Subsequently, 35 cycles of 94°C for 1 min, 50°C for 1 min, and 72°C for 1 min, respectively, were used. The final extension was carried out at 72°C for 10 min.
Table 2: SRAP molecular markers and primer combination used in this study. The CCG motif is highlighted in bold.
| Marker | Forward Primer (5′-3′) | Reverse Primer (5′-3′) |
|---|---|---|
| me3+em1 | TGAGTCCAAACCGGAAT | GACTGCGTACGAATTAAT |
| me3+em15 | TGAGTCCAAACCGGAAT | GACTGCGTACGAATTCTG |
| me4+em15 | TGAGTCCAAACCGGACC | GACTGCGTACGAATTCTG |
PCR products amplified using both marker systems (SSR and SRAP) were analyzed by electrophoresis on 2.5% agarose gels at 120 V for 90 min. The gels were visualized using a transilluminator coupled to a photodocumenter (Benchtop UV Transilluminator PhotoDoc-ItTM 60 Imaging System, Cambridge, UK).
Molecular data generated by SRAP markers were analyzed using a binary matrix based on the absence (zero) and presence (one) of bands. Genetic diversity parameters, including the percentage of polymorphic loci (P), Shannon Index (I) (Pla, 2006), and Expected heterozygosity (He) [19] were estimated based on SRAP data in GenAlEx version 6.5. Genetic structure was evaluated through principal component analysis (PCoA), analysis of molecular variance (AMOVA) implemented in GenAlEx version 6.5. Genetic differentiation among populations was estimated using AMOVA based on SRAP markers. The ΦST statistic, which is considered an analogue of Wright’s FST for dominant data, was calculated using GenAlEx version 6.5. The significance of variance components and ΦST values was assessed through 999 random permutations. According to Wright’s classification, FST values ranging from 0 to 0.05 indicate little genetic differentiation, values between 0.05 and 0.15 indicate moderate genetic differentiation, and values greater than 0.25 indicate high genetic differentiation. Cluster analysis was performed using Unweighted Pair Group Method with Arithmetic Mean (UPGMA) based on Nei’s genetic distance (D) [20] using MEGA X. In addition, population structure was inferred using a Bayesian clustering approach implemented in STRUCTURE version 2.3.4 [21], applying Markov Chain Monte Carlo (MCMC) simulations of 250,000 iterations with a burn-in period of 50,000, and 10 independent runs for each value of K.
The 11 accessions evaluated with the molecular markers LMCH36 and LMCH79 presented a monomorphic behavior. On the other hand, different DNA fragments with the LMCH43 marker were observed, approximately 300 bp in the Nuevo Urecho, Coquimatlán, and Tecomán 1 accessions (Fig. 1), which suggests a polymorphic behavior, since, in some individuals, two bands were observed, which means that there are two different alleles. Likewise, other accessions showed the presence of only one band, which means that the two alleles are the same [22].
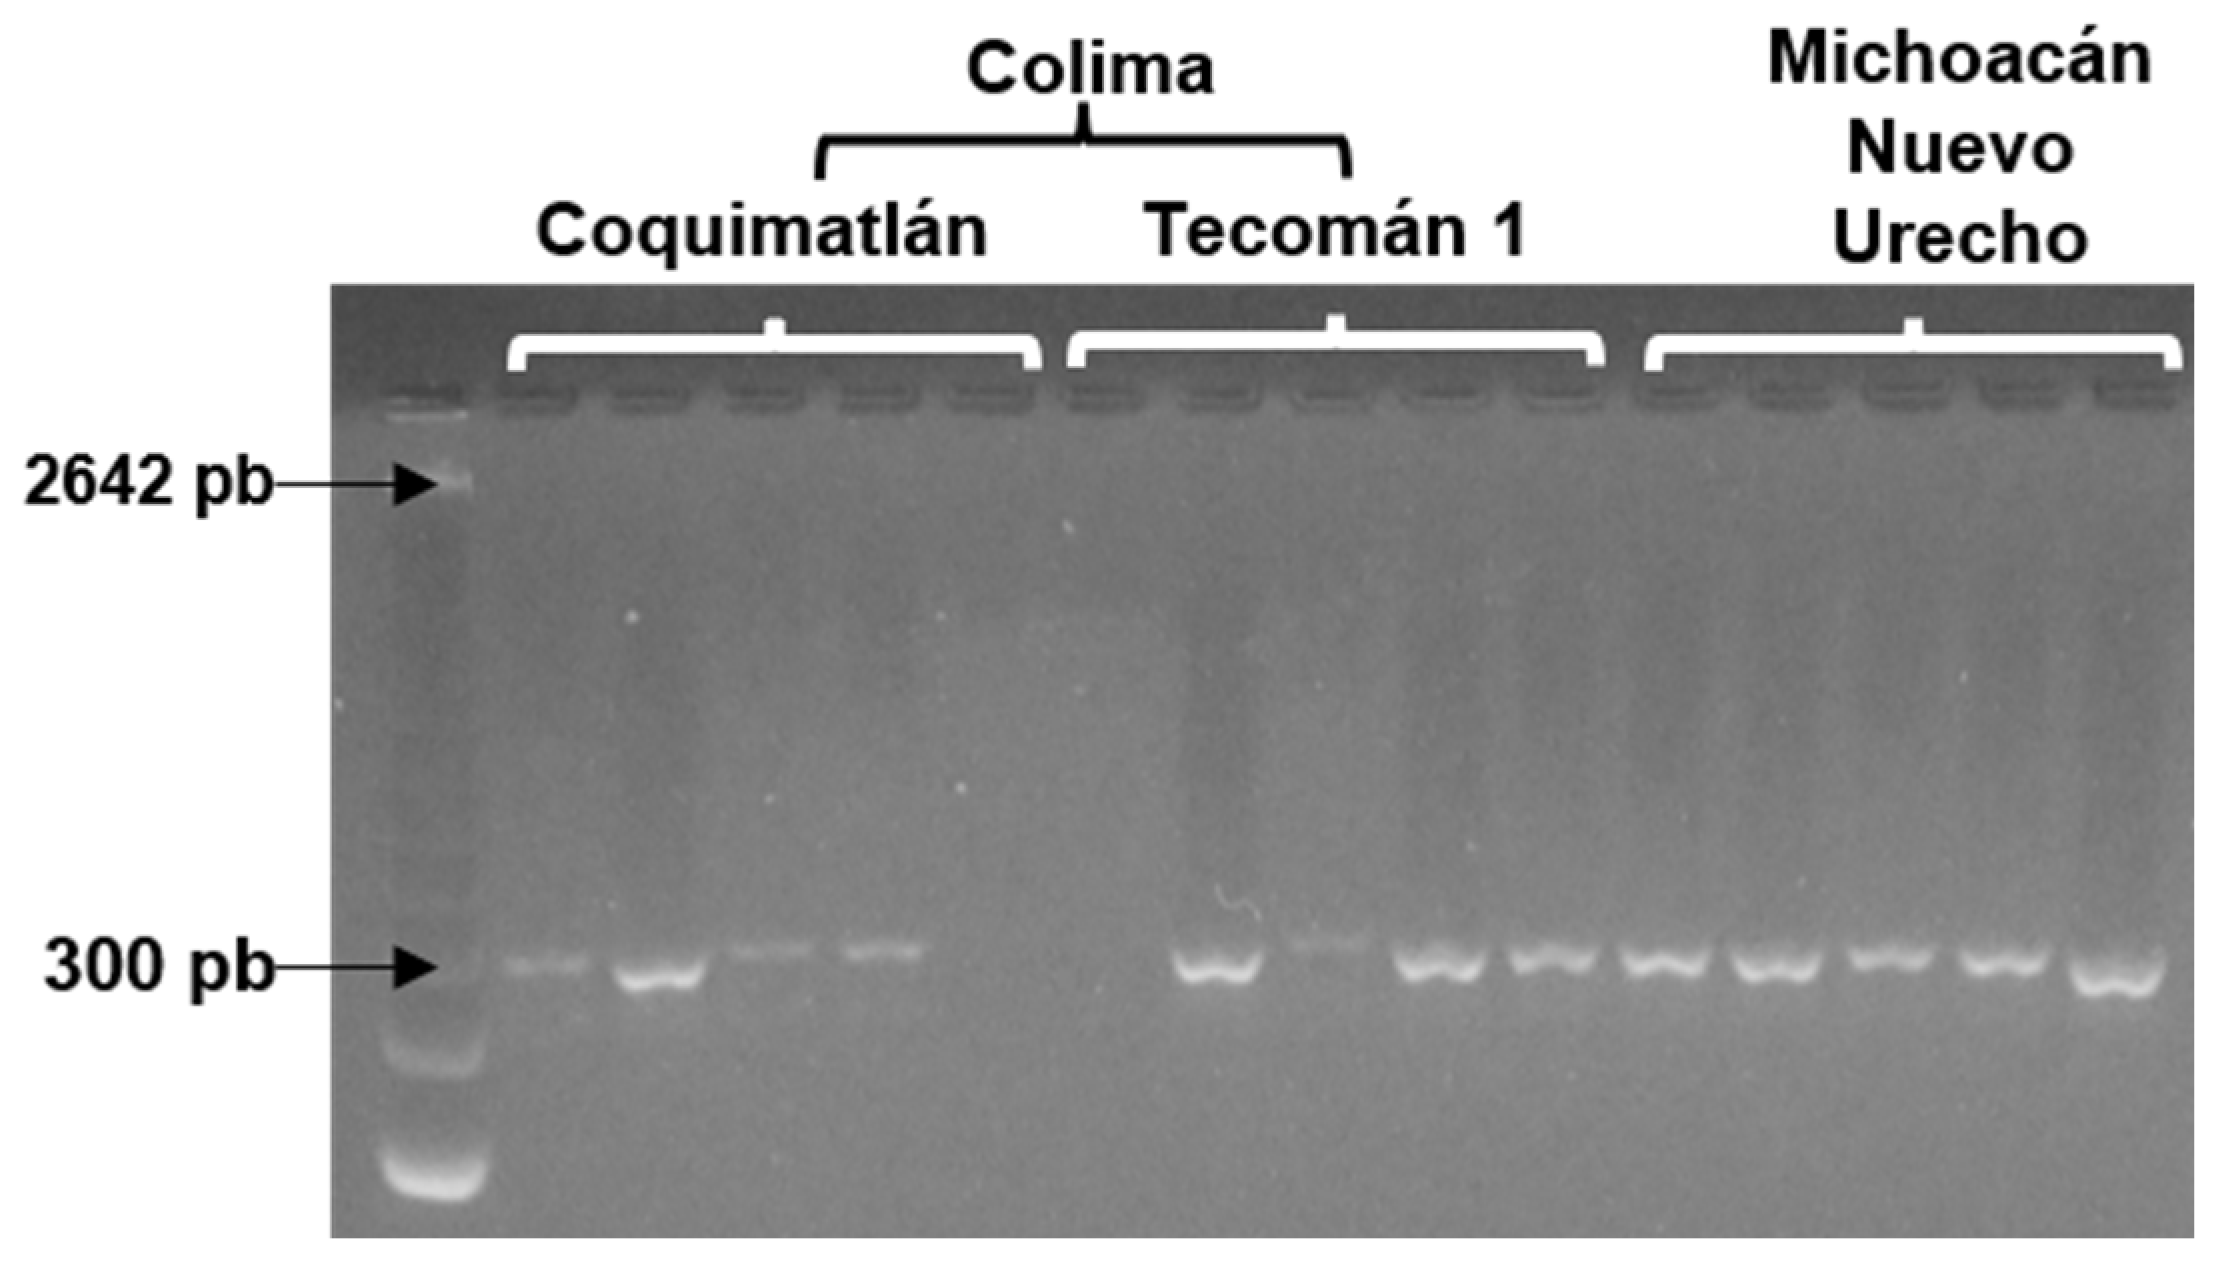
Figure 1: Band polymorphism of the SSR marker LMCH43 in soursop (Annona muricata L.) accessions from Colima and Michoacán, Mexico. Arrows indicate the polymorphic bands among accessions.
Genetic diversity was determined from 55 polymorphic loci with a range of bands between 100 and 800 bp. The percentage of polymorphic loci of the R1 accessions was as follows: Nuevo Urecho (56.36%), Tecomán 2 (45.45%), Tecomán 1 (41.82%), Coquimatlán (36.36%), Puerto Vallarta 2 (34.55%), Puerto Vallarta 1 (30.91%), and Tonino (25.45%). On the other hand, the R2 accessions showed a polymorphic locus of Pantano Vargas (86.46%), Flamenco (80.00%), Makro (78.18%), and Cascajal (74.55%), as shown in Table 3.
Table 3: Genetic diversity indices of soursop accessions. P: Percentage of polymorphic loci, I: Shannon index, He: Expected heterozygosity.
| Region | Place of Collection | Accession | P (%) | I | He |
|---|---|---|---|---|---|
| R1 | Nayarit | Tonino | 25.45 | 0.12 | 0.07 |
| Jalisco | Puerto Vallarta 1 | 30.91 | 0.15 | 0.09 | |
| Puerto Vallarta 2 | 34.55 | 0.17 | 0.11 | ||
| Colima | Coquimatlán | 36.36 | 0.19 | 0.13 | |
| Tecomán 1 | 41.82 | 0.19 | 0.12 | ||
| Tecomán 2 | 45.45 | 0.25 | 0.17 | ||
| Michoacán | Nuevo Urecho | 56.38 | 0.27 | 0.18 | |
| R2 | Cali | Cascajal | 74.55 | 0.40 | 0.27 |
| Flamenco | 80.00 | 0.32 | 0.21 | ||
| Makro | 78.18 | 0.42 | 0.28 | ||
| Pantano Vargas | 86.46 | 0.38 | 0.26 |
The results of the I show us the relative abundance of the species within the accessions, the I of R1 were: Nuevo Urecho (0.27), Tecomán 2 (0.25), Coquimatlán (0.19), Tecomán 1 (0.19), Puerto Vallarta 2 (0.17), Puerto Vallarta 1 (0.15), and Tonino (0.12). Furthermore, the I of R2 were: Makro (0.42), Cascajal (0.40), Pantano Vargas (0.38), and Flamenco (0.32) as observed in Table 3. The following values were obtained according to the expected heterozygosity (He): 0.18 (Nuevo Urecho), 0.17 (Tecomán 2), 0.13 (Coquimatlán), 0.12 (Tecomán 1), 0.11 (Puerto Vallarta 2), 0.09 (Puerto Vallarta 1), and 0.07 (Tonino) as shown in Table 3. These values were similar to those obtained in I within R1, while the He values in R2 were: 0.28 (Makro), 0.27 (Cascajal), 0.26 (Pantano Vargas), and 0.21 (Flamenco), as shown in Table 3. The statistical analysis via AMOVA partitioned genetic variance among soursop accessions from two regions: Pacific-Occident (R1, Mexico) and Valle del Cauca (R2, Colombia), as shown in Table 4. AMOVA analysis revealed that genetic variance within R1 accessions was predominantly intra-group (WG: 82%, DF = 28, SQ = 152.40, V = 5.44) versus between groups (BG: 18%, DF = 6, SQ = 68.17, V = 1.18). For R2, variance was even higher within groups (WG: 97%, DF = 16, SQ = 154.40, V = 9.65) compared to between groups (BG: 3%, DF = 3, SQ = 33.50, V = 0.30). The combined R1-R2 comparison showed 73% variance within groups (WG: DF = 44, SQ = 303.60, V = 6.90) and 27% between groups (BG: DF = 10, SQ = 198.03, V = 2.58; P < 0.001), showing significant genetic differentiation between the two soursop-producing areas (Table 4).
Table 4: AMOVA in soursop accessions. BG: Between groups, WG: Within groups, DF: Degrees of freedom, SQ: Sum of squares, RMS: Root mean square, V: Variance, %: Percentage of variance.
| DF | SQ | RMS | V | % | ||
|---|---|---|---|---|---|---|
| R1 | BG | 6 | 68.17 | 11.36 | 1.18 | 18 |
| WG | 28 | 152.40 | 5.44 | 5.44 | 82 | |
| Total | 34 | 220.57 | 6.62 | 100 | ||
| R2 | BG | 3 | 33.50 | 11.16 | 0.30 | 3 |
| WG | 16 | 154.4 | 9.65 | 9.65 | 97 | |
| Total | 19 | 187.90 | 9.95 | 100 | ||
| R1-R2 | BG | 10 | 198.03 | 19.80 | 2.58 | 27 |
| WG | 44 | 303.60 | 6.90 | 6.90 | 73 | |
| Total | 54 | 501.63 | 9.48 | 100 |
The ΦST value estimated from the AMOVA was 0.27 (P = 0.001), indicating a high level of genetic differentiation among populations. In dominant SRAP markers, ΦST represents an analogue of Wright’s FST and was therefore interpreted as an estimate of population genetic differentiation. According to Wright’s classification, this value corresponds to strong genetic differentiation among the analyzed populations. These results are consistent with the AMOVA variance components, which showed that approximately 27% of the total genetic variation was attributed to differences among groups.
According to the results obtained in the dendrogram by the UPGMA method, the accessions of R1 and R2 showed a separation and the formation of two main groups (Fig. 2). The first branch of R1 shows a bifurcation generating two subgroups. In the first, the accessions of Tonino, Puerto Vallarta 1, Puerto Vallarta 2, and Tecomán 2 are grouped; in the second, the Coquimatlán, and Tecomán 1 accessions are grouped. On the other hand, R2 is found independently, while the accessions of Makro, Cascajal, Flamenco, and Pantano Vargas were nested (Fig. 2).
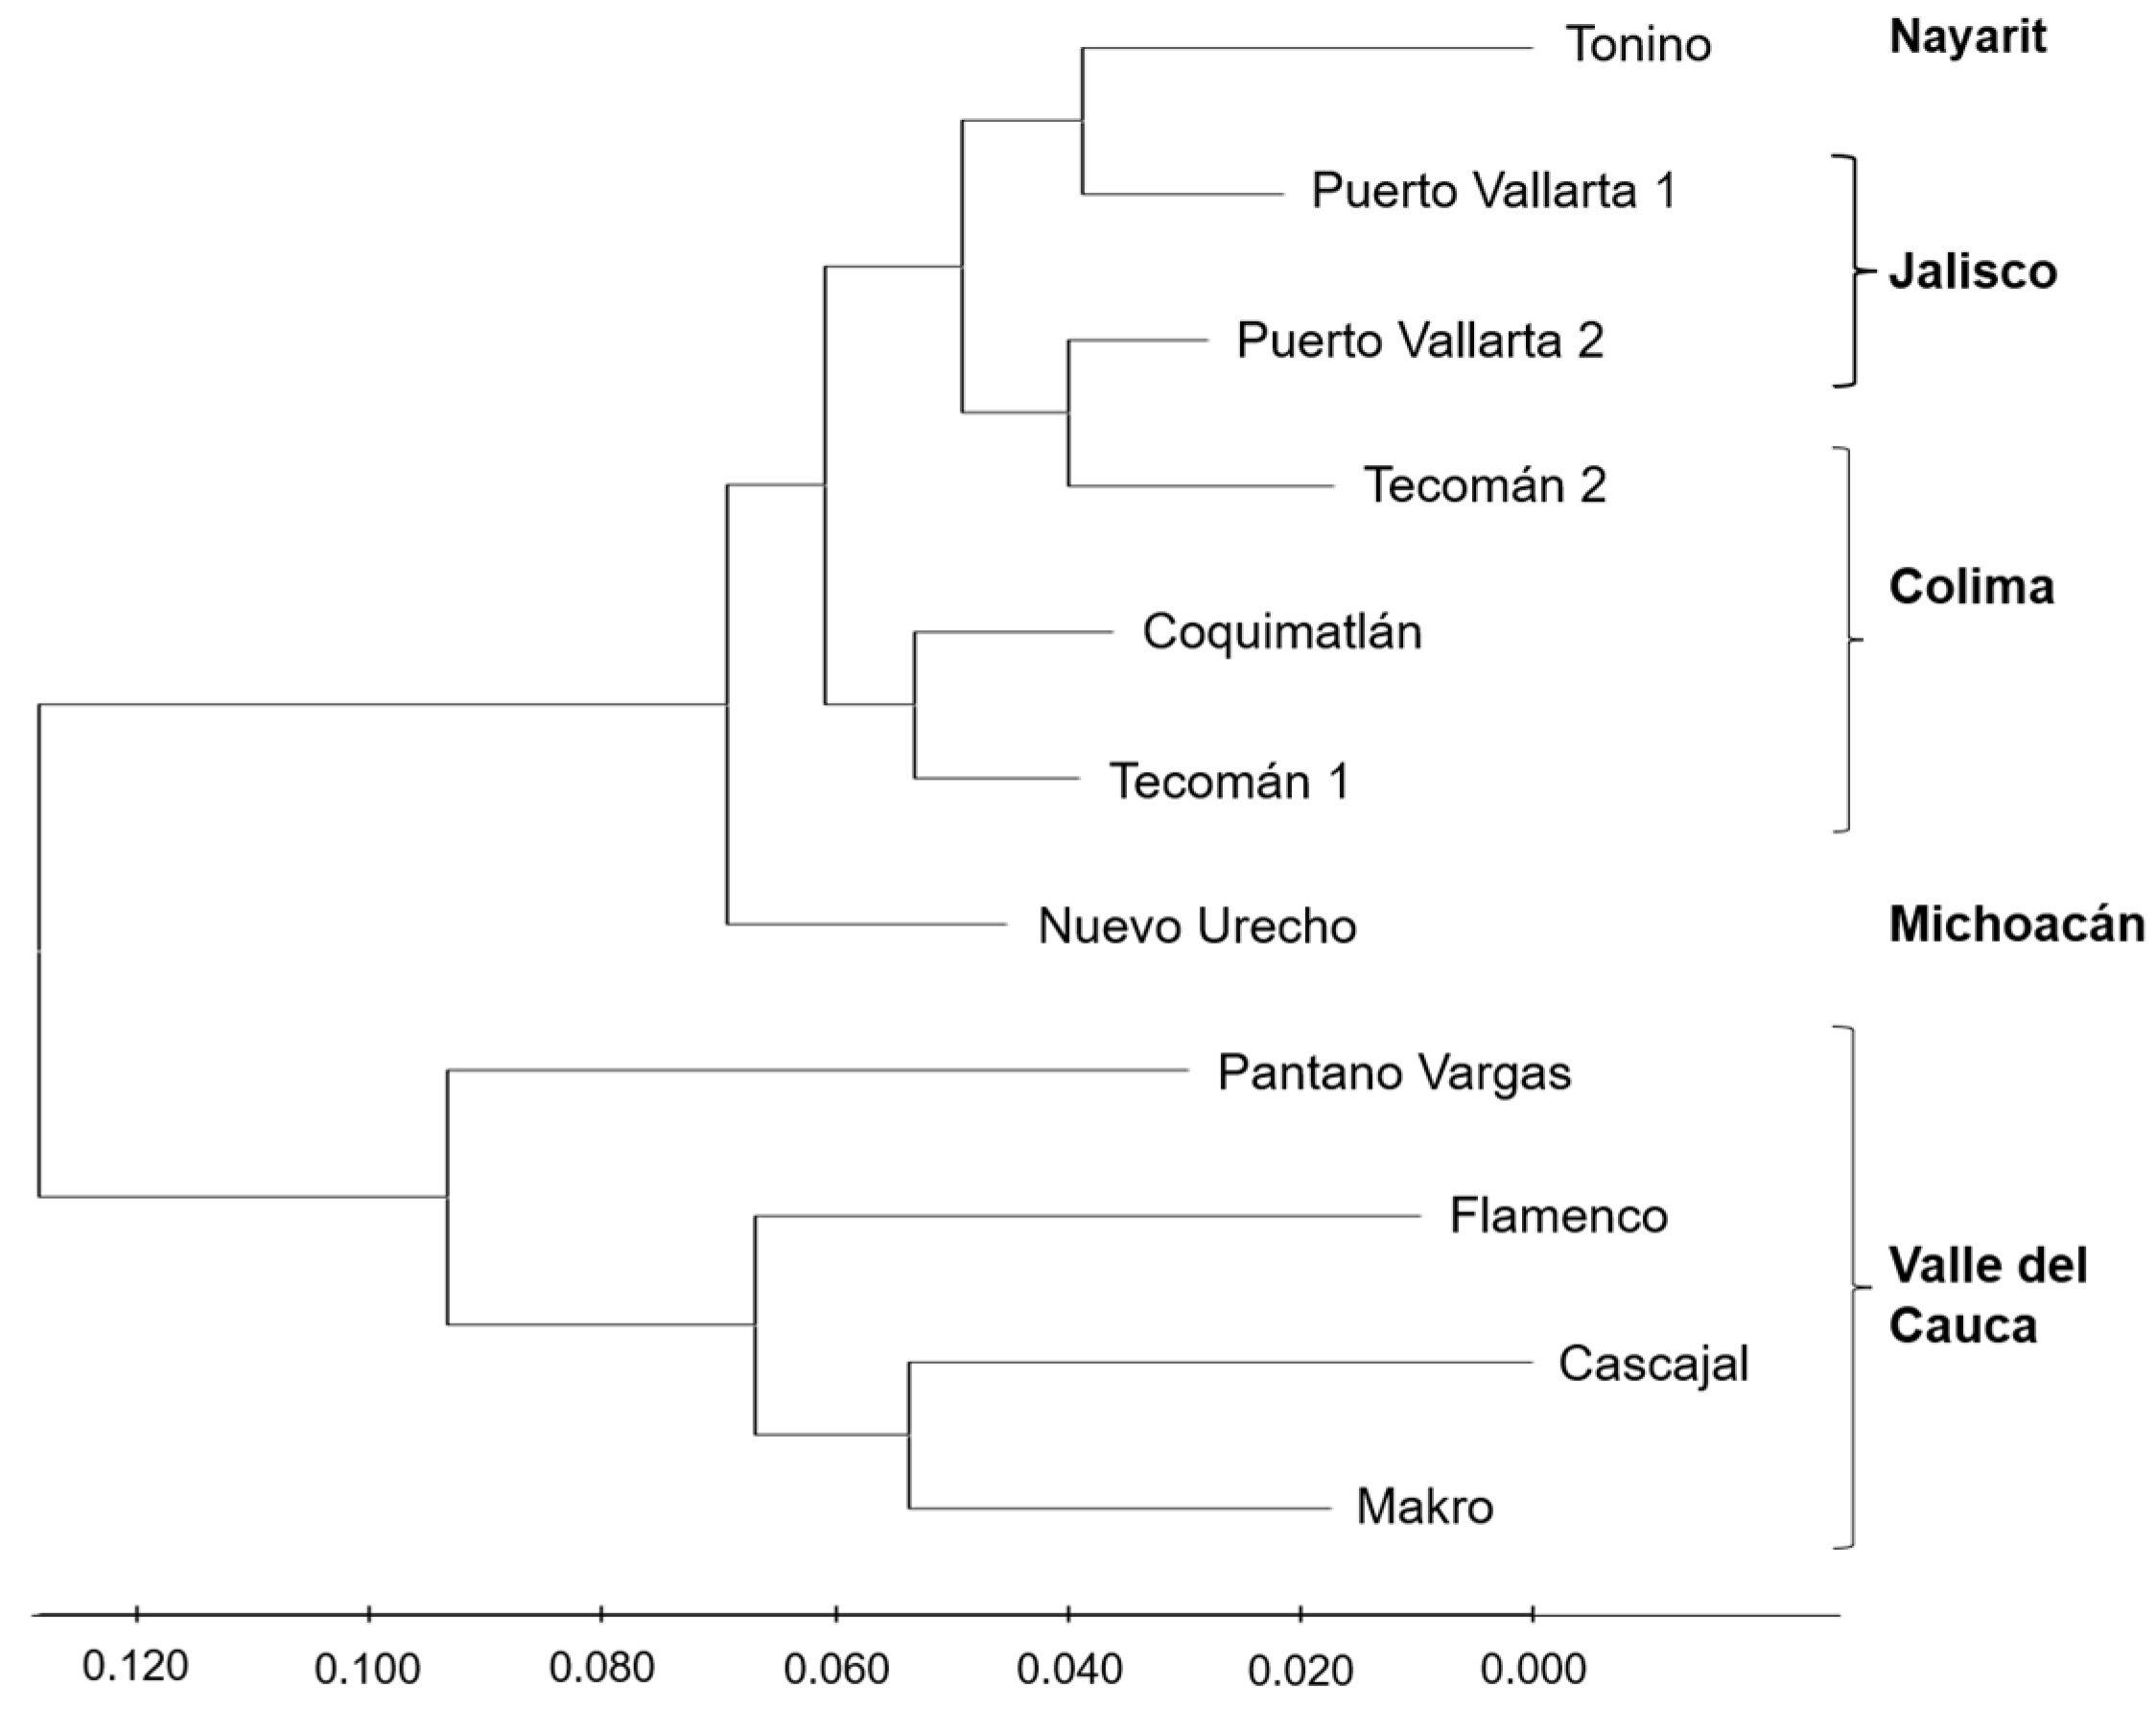
Figure 2: UPGMA dendrogram based on genetic distances derived from SRAP markers among 11 soursop accessions from two regions.
On the other hand, PCoA analysis showed the formation of three groups. The accessions of R1 formed two groups. In the first, the accessions of Tecomán 2, Puerto Vallarta 1 and 2, and Tonino were grouped, and in the second, the accessions of Coquimatlán, and Tecomán 1. Finally, the third group delimits the accessions of R2, which coincides with the results obtained by the dendrogram, observing the separation of the two regions and the existing subdivision within the R1 region (Fig. 3).
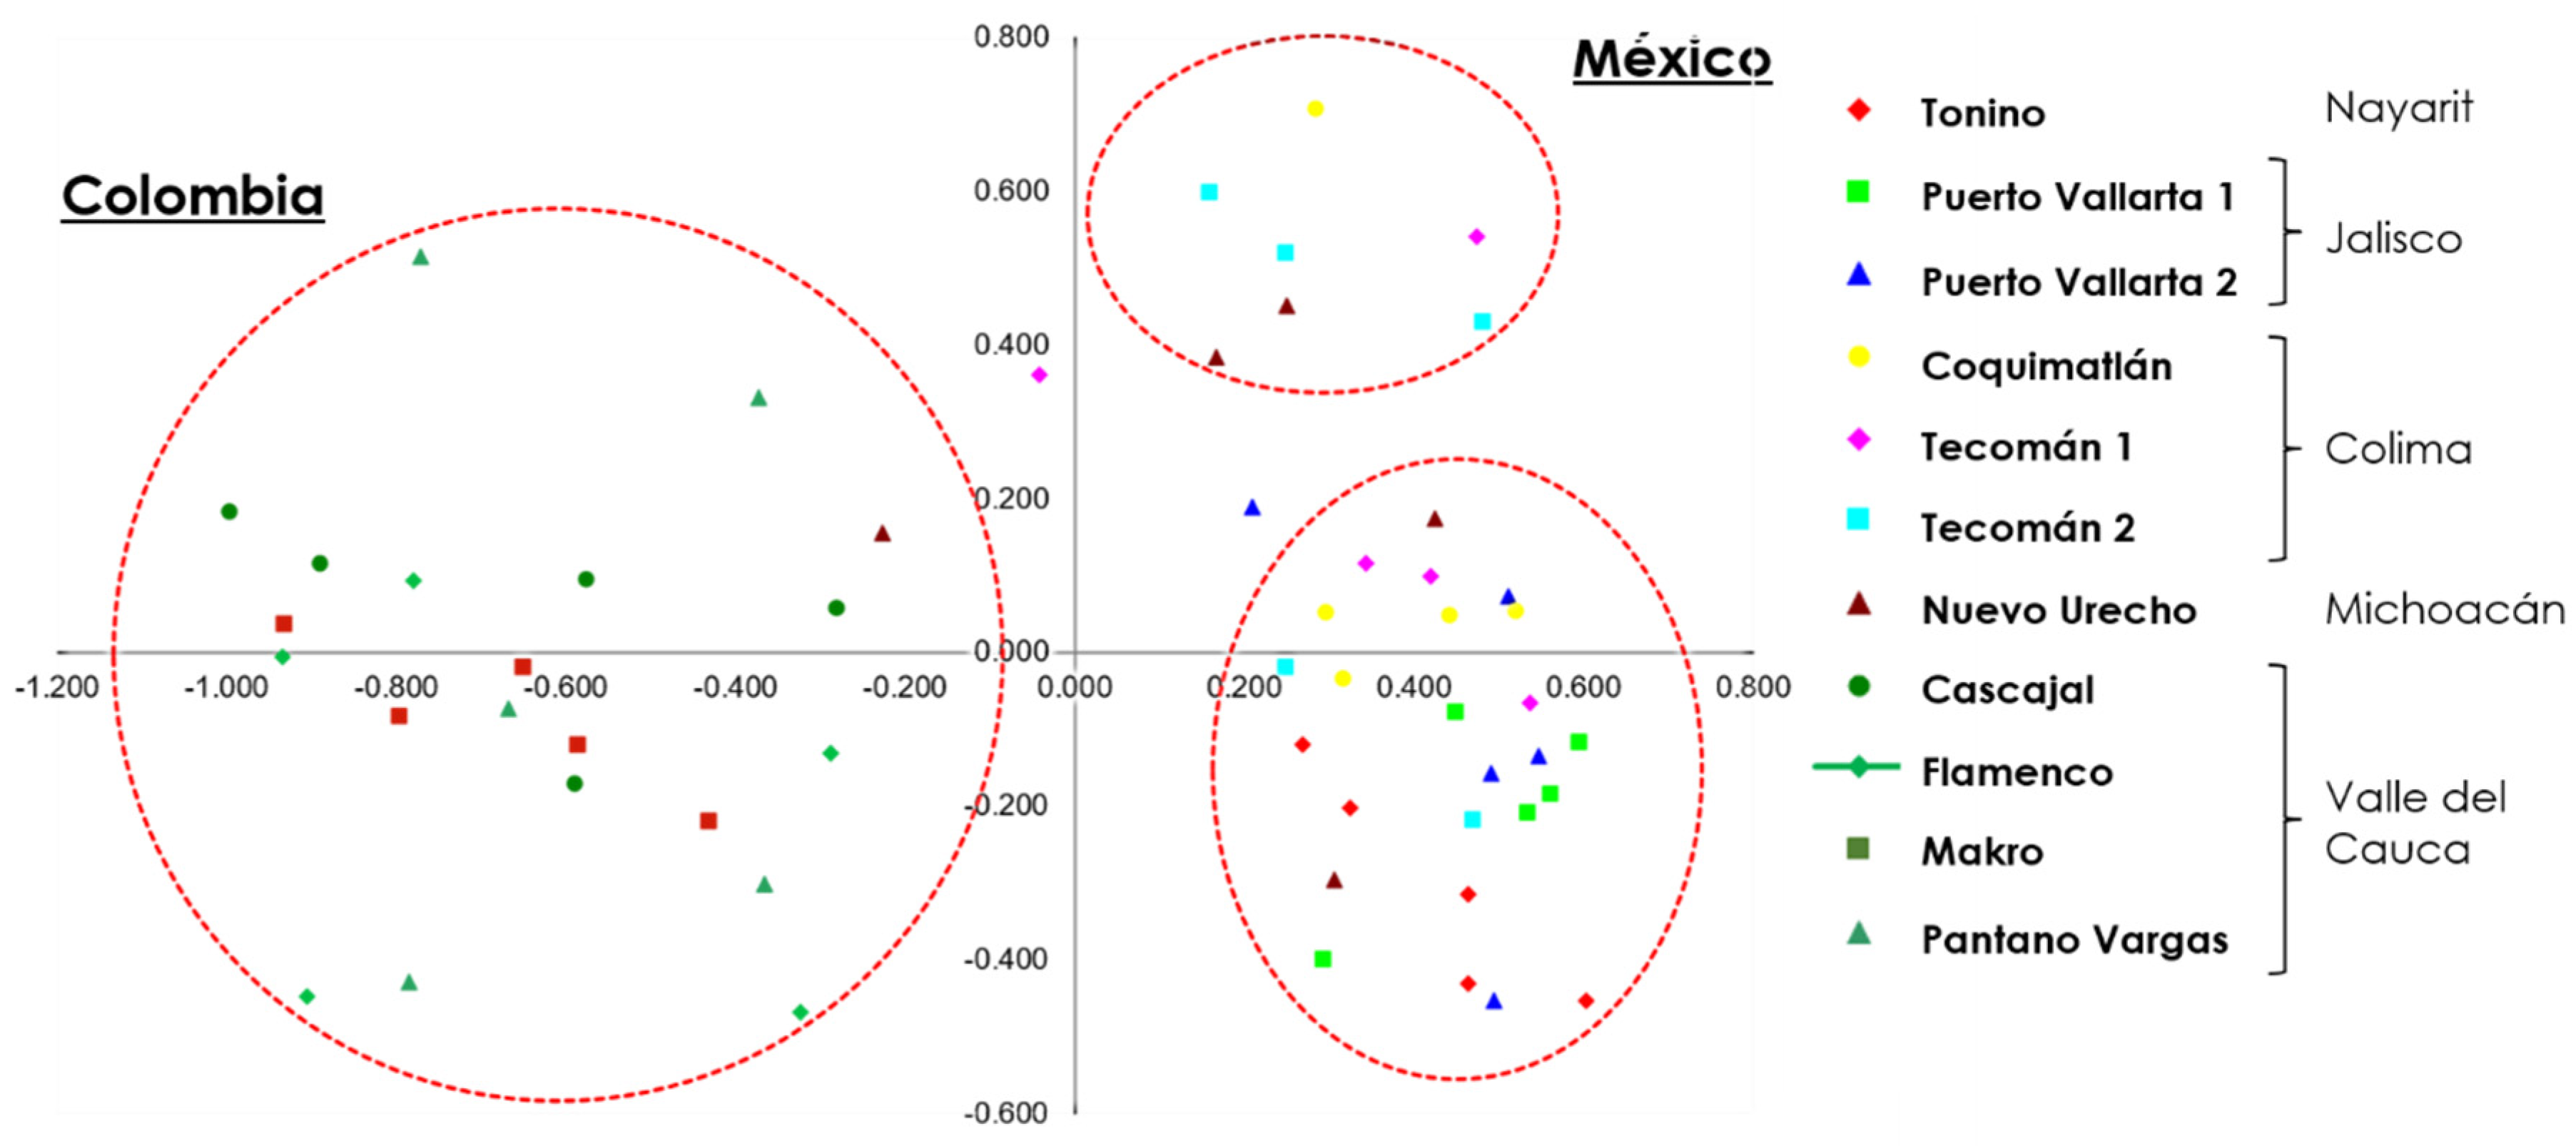
Figure 3: PCoA of 11 soursop accessions of R1 (México) and R2 (Colombia).
The most likely number of genetic clusters was inferred using the ΔK method implemented in STRUCTURE v. 2.3.4, identifying the highest ΔK value at K = 2. This result indicates the presence of two major genetic groups within the dataset. However, since the ΔK method cannot detect K = 1 and identifies the uppermost hierarchical level of genetic structure, this result should be interpreted within the limitations of the method. Higher values of K were also explored, but did not provide a clearer biological interpretation. Therefore, K = 2 was considered the most informative clustering level for describing the genetic structure of the analyzed soursop accessions. These results suggest that soursop accessions are distributed in two populations (Fig. 4), showing R1 in green and R2 in red, coinciding with the results of the dendrogram. Likewise, the influence of R2 on R1 is observed, explaining the most plausible population structure (Fig. 4).
These clusters were inferred directly from the multi-locus genotypic data. Interestingly, the clustering pattern corresponded closely with the geographic distribution of the accessions, suggesting potential genetic differentiation between accessions from Mexico (R1) and those from Colombia (R2).
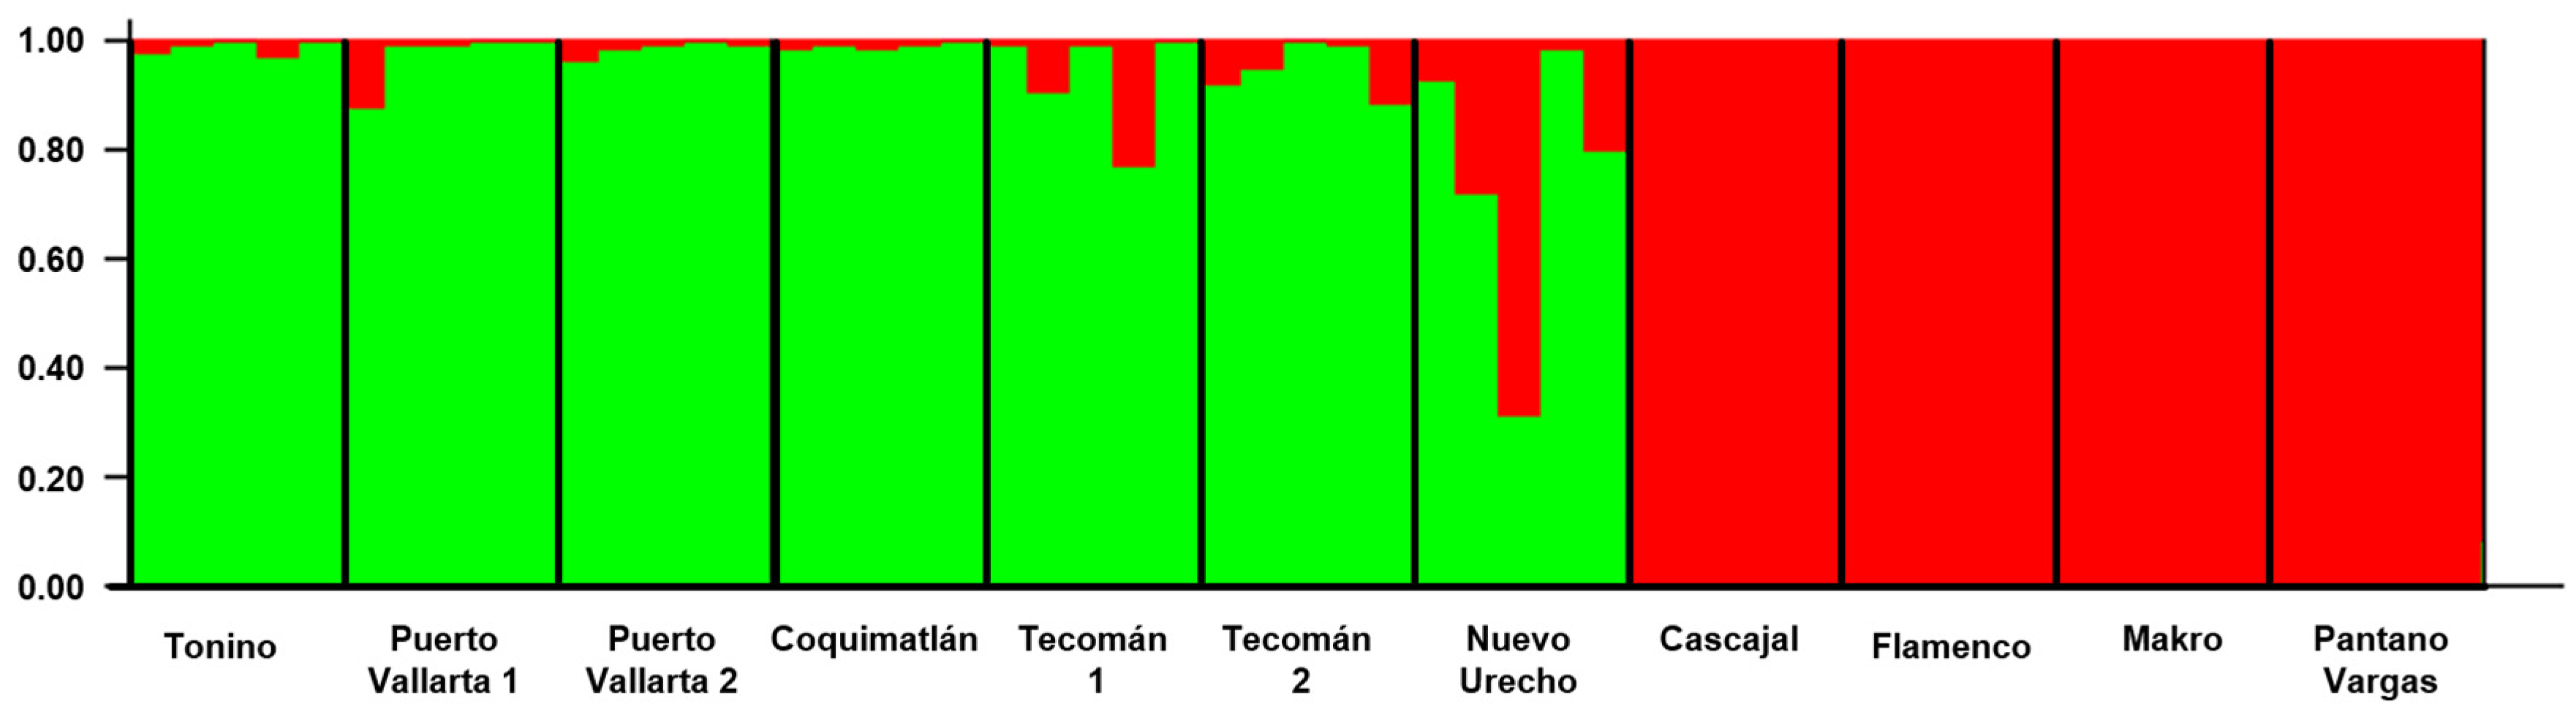
Figure 4: Genetic structure of 11 soursop accessions of R1 (green color) and R2 (red color). The most likely number of clusters was K = 2.
In the last five years, the soursop genome and transcriptome were published [23,24]. Nevertheless, there is still a lack of sequence information availability to design specific primers. Therefore, the number and type of primers were selected based on the significant markers used for Annonaceae species, as well as being easy to assay, cost-effective, reproducible, and having the ability to identify between heterozygotes and homozygotes [16,17,18]. In this regard, a total of six primers (SSR and SRAP markers) were screened for their capacity to generate amplified band patterns and calculate the level of polymorphism between the different soursop accessions.
SSR markers are commonly used to assess genetic diversity in plant populations due to their co-dominant nature and high discriminatory power. In this regard, research has been carried out on custard apple (Annona cherimola Mill.), evaluating SSR molecular markers [6,16] as well as on different species of the Annonaceae family, including soursop [25]. In this study, SSR markers (LMCH36, LMCH43, and LMCH79) showed predominantly monomorphic patterns among the 11 soursop accessions, limiting their usefulness for genetic diversity assessment. Similar low levels of polymorphism using these markers have been reported in other soursop populations from Nayarit, México [17]. Likewise, Anuragi et al., [25] reported genetic polymorphism, using the molecular markers LMCH43 and LMCH79 in accessions of Annona cherimola, Annona reticulata, Annona atemoya, Annona squamosa, and Annona muricata, finding fragments of 210–375 bp (LMCH43) and 212–384 bp (LMCH79) with 100% polymorphic loci. On the other hand, with the LMCH43 marker, the accessions of Coquimatlán, Tecomán 1, and Nuevo Urecho showed a polymorphic behavior, this may be related to environmental factors, mainly temperature and relative humidity that directly affect the function of pollinators, which leads to low pollination of the inflorescences [26] since the incidence of environmental factors affects the abundance, diversity, and activity of pollinators. During the pollination stage, synchrony is required between the life cycle of the pollinators and the flowering of the species [27]. In Annona muricata L. the inflorescences begin to open in the morning (separation of the petals that open at the apex) initiating anthesis, taking approximately six to eight hours, depending on environmental conditions, the pistils are receptive to white stigmas and bright (even without pollination), so this is carried out by beetles or by the wind with pollen from other inflorescences when the petals are fully open. The result of this can lead to poor fertilization since, when pollination occurs, the stigmas can be withered, and on many occasions, fertilization is not carried out, which results in the formation of small and asymmetrical fruits. Otherwise, SRAP markers provided more informative results and were more appropriate for evaluating genetic diversity and population structure in the studied accessions.
The SRAP molecular markers are dominant and highly polymorphic, it has been used to determine the diversity of plant species for breeding purposes. In this research, high values were obtained in the genetic diversity parameters (P, I, He) in the Nuevo Urecho (R1) and Makro (R2) accessions. In this regard, the genetic diversity of soursop accessions has been determined using the SRAP markers, from the main producing municipalities of Nayarit (Compostela, San Blas, and Tepic), Mexico; whose results showed a percentage of polymorphism of 76.67% in Compostela using the combination of primers me3+em1, me3+em15, and me4+em15, as well as 69.84% of P for Tonino [12]. On the other hand, Lira-Ortiz et al., [17] using the combination of markers: me3+em12, me3+em13, and me4+em15, found 31.90% P of Tonino accession, while for the producing areas of San Blas, Tepic, and Compostela, it was 29.55%. In this investigation, the combination of molecular markers: me3 + em1, me3 + em15, and me4 + em15, obtained values of 25.45% of P, for the Tonino accession (Nayarit), a similar result to those found by the authors previously mentioned. The difference between the results obtained in Tonino may be due to the capacity of each of the primers to amplify different regions of the genome of an organism, as well as the method to separate nucleic acids, since the previously mentioned works used polyacrylamide gels, and in this study agarose gels, which leads to a lower resolving power, while polyacrylamide allows greater visibility of bands within the gel, as reported by [28]. In other investigations, values from 40 to 81.82% of P have been reported in Indonesia [29] and 82% P in Venezuela and Brazil [13] using RAPs markers. In this context, the values of I were obtained for the accessions of R2 Makro (0.42) and Flamenco (0.32), and accessions of R1 Nuevo Urecho (0.27) and Tonino (0.12).
In R2, He values between 0.21 and 0.28 were obtained, results above those reported by [12,17]. In Annona squamosa, a value of 0.40 for He is reported using isoenzyme markers [26]. The variation of these parameters is influenced by self-fertilization since it has been shown that asexual plants have fewer alleles per locus, showing low levels of genetic diversity within their populations [30]. Plants have plasticity, so it is important to maintain genetic variability between populations and between species since it increases the possibilities of adaptation to environmental conditions. The results obtained through the AMOVA, the accessions of R1 present variations of 82% and those of R2 of 97%, between both regions the variation was 73%; results that coincide with those reported by [12]. The high WG variance (82–97%) found in our study reflects a pronounced level of genetic diversity retained at the local scale, particularly in the R2 accessions, which appear to represent elite germplasm with strong potential for selection within local breeding programs. This pattern is consistent with recent findings in soursop cultivated in family orchards in southeastern Mexico, where moderate genetic diversity and distinct genetic groups were similarly detected despite the absence of clear geographic structuring, underscoring the role of human management and localized selection pressures in shaping genetic variation in the species [3]. The genetic differentiation among populations (ΦST ≈ 0.27) suggests limited gene flow between regions, aligning with expectations for clonal or semi-domesticated fruit tree crops where seed exchange and propagation practices vary by community. The 27% inter-regional BG variance highlights opportunities for hybrid breeding to boost R1 diversity, addressing low polymorphism seen in prior SRAP analysis. These patterns support germplasm conservation strategies, prioritizing in situ protection of R2 and targeted introgression into Mexican populations for resilience and yield gains. The results from the PCoA, dendrogram, and Bayesian analyses showed a differentiation among the evaluated regions and accessions, suggesting that environmental factors play a key role in shaping population structure, promoting either the conservation or loss of genetic diversity, as well as habitat fragmentation among populations [31]. In the R1 accessions, sexual reproduction, flowering occurs throughout the year, being more noticeable and important from October to December, coinciding with low temperatures and low rainfall, factors that negatively influence pollination, resulting in a diversity from 25.45% to 56.38% in the evaluated accessions, the insects use the soursop inflorescences as a mating site, since they do not seek nectar or pollen [26,32]. The flowering of the R2 accessions occurs throughout the year, being more important in the months of November to January, sometimes until May, which coincides with the season of rainfall and high relative humidity [33]. Additionally, favorable environmental conditions promote the proliferation of effective pollinating agents, such as the Cyclocephala species, which are known pollinators of soursop, allowing cross-pollination. This process contributes to greater genetic stability and diversity (from 74.55 to 86.46%). It should be noted that not all insects contribute to pollination, as the nectar of soursop inflorescences is not generally attractive to a wide range of insects [32].
The SSR marker LMCH43 was the only one to detect polymorphisms, highlighting the need for future studies to employ multiple primers for enhanced resolution. SRAP markers revealed low genetic diversity in soursop accessions from the Pacific-Occident Region (R1), with polymorphic loci ranging from 25.45% to 58.86%, whereas accessions from Valle del Cauca, Colombia (R2), exhibited higher diversity, with values from 74.55 to 86.46%. Population structure and clustering analysis divided the 11 accessions into two populations and three distinct groups. These findings provide a basis for the development of targeted breeding and conservation strategies for soursop.
Acknowledgement:
Funding Statement: This research was funded by the project “Caracterización morfológica, bioquímica y genética de guanábana (Annona muricata L.)” number 242718 (Fondo sectorial de Investigación para la Educación, SEP-CONACYT).
Author Contributions: The authors confirm contribution to the paper as follows: Rosalba Lira-Ortiz: data curation, formal analysis, writing—original draft; Juan Esteban Bello-Lara: data acquisition, validation; Verónica Alhelí Ochoa-Jiménez: data curation, validation; José Orlando Jiménez-Zurita: methodology, validation, writing—review and editing; Rosendo Balois-Morales: data acquisition, methodology, funding acquisition, resources; Guillermo Berumen-Varela: conceptualization, data analysis, funding acquisition, writing—review and editing. All authors reviewed and approved the final version of the manuscript.
Availability of Data and Materials: The data of this manuscript is available upon request.
Ethics Approval: Not applicable.
Conflicts of Interest: The authors declare no conflicts of interest.
References
1. Santos IL , da Cruz Rodrigues AM , Amante ER , da Silva LHM . Soursop (Annona muricata) properties and perspectives for integral valorization. Foods. 2023; 12( 7): 1448. doi:10.3390/foods12071448. [Google Scholar] [CrossRef]
2. Hernandez-Fuentes GA , Delgado-Enciso OG , Larios-Cedeño EG , Sánchez-Galindo JM , Ceballos-Magaña SG , Pineda-Urbina K , et al. Comparative analysis of infusions and ethanolic extracts of Annona muricata leaves from Colima, Mexico: phytochemical profile and antioxidant activity. Life. 2024; 14( 12): 1702. doi:10.3390/life14121702. [Google Scholar] [CrossRef]
3. Montejo-Mendez HB , Lesher-Gordillo JM , Hormaza JI , Lobato-Garcia CE , Gomez-Rivera A , Machkour-M’Rabet S , et al. Genetic analysis and phytochemical profile of soursop (Annona muricata L.) cultivated in family orchards in southeastern Mexico. PLoS One. 2025; 20( 5): e0321846. doi:10.1371/journal.pone.0321846. [Google Scholar] [CrossRef]
4. Ali Zafar S , Aslam M , Zaman Khan H , Sarwar S , Saad Rehman R , Hassan M , et al. Estimation of genetic divergence and character association studies in local and exotic diversity panels of soybean (Glycine max L.) genotypes. Phyton. 2023; 92( 6): 1887– 906. doi:10.32604/phyton.2023.027679. [Google Scholar] [CrossRef]
5. Fiore MC , Marchese A , Mauceri A , Digangi I , Scialabba A . Diversity assessment and DNA-based fingerprinting of Sicilian hazelnut (Corylus avellana L.) germplasm. Plants. 2022; 11( 5): 631. doi:10.3390/plants11050631. [Google Scholar] [CrossRef]
6. van Zonneveld M , Scheldeman X , Escribano P , Viruel MA , Van Damme P , Garcia W , et al. Mapping genetic diversity of cherimoya (Annona cherimola Mill.): application of spatial analysis for conservation and use of plant genetic resources. PLoS One. 2012; 7( 1): e29845. doi:10.1371/journal.pone.0029845. [Google Scholar] [CrossRef]
7. Nadeem MA , Nawaz MA , Shahid MQ , Doğan Y , Comertpay G , Yıldız M , et al. DNA molecular markers in plant breeding: current status and recent advancements in genomic selection and genome editing. Biotechnol Biotechnol Equip. 2018; 32( 2): 261– 85. doi:10.1080/13102818.2017.1400401. [Google Scholar] [CrossRef]
8. Robarts DWH , Wolfe AD . Sequence-related amplified polymorphism (SRAP) markers: a potential resource for studies in plant molecular biology1. Appl Plant Sci. 2014; 2( 7): 1– 13. doi:10.3732/apps.1400017. [Google Scholar] [CrossRef]
9. Amiteye S . Basic concepts and methodologies of DNA marker systems in plant molecular breeding. Heliyon. 2021; 7( 10): e08093. doi:10.1016/j.heliyon.2021.e08093. [Google Scholar] [CrossRef]
10. Alzahib RH , Migdadi HM , Al Ghamdi AA , Alwahibi MS , Afzal M , Elharty EH , et al. Exploring genetic variability among and within hail tomato landraces based on sequence-related amplified polymorphism markers. Diversity. 2021; 13( 3): 135. doi:10.3390/d13030135. [Google Scholar] [CrossRef]
11. Bhatt J , Kumar S , Patel S , Solanki R . Sequence-related amplified polymorphism (SRAP) markers based genetic diversity analysis of cumin genotypes. Ann Agrar Sci. 2017; 15( 4): 434– 8. doi:10.1016/j.aasci.2017.09.001. [Google Scholar] [CrossRef]
12. Talamantes-Sandoval CA , Cortés-Cruz M , Balois-Morales R , López-Guzmán GG , Palomino-Hermosillo YA . Análisis molecular de la diversidad genética en guanábana (Annona muricata L.) mediante marcadores SRAP. Rev Fitotec Mex. 2019; 42( 3): 209– 14. doi:10.35196/rfm.2019.3.209-214. [Google Scholar] [CrossRef]
13. Brown J , Laurentín H , Dávila M . Genetic relationships between nine Annona muricata L. accessions using RAPD markers. Fruits. 2003; 58( 5): 255– 9. doi:10.1051/fruits:2003013. [Google Scholar] [CrossRef]
14. Sánchez CFB , Lopes BE , Teodoro PE , Garcia ADP , Peixoto LDA , Silva LA , et al. Genetic diversity among soursop genotypes based on fruit production. Biosci J. 2018: 122– 8. doi:10.14393/BJ-v34n1a2018-37421. [Google Scholar] [CrossRef]
15. Lira-Ortiz R , Cortés-Cruz MA , Amaro-González BA , López-Guzmán GG , Palomino-Hermosillo YA , Balois-Morales R , et al. Comparison of three genomic DNA extraction methods from soursop leaves (Annona muricata L.). Mex J Biotechnol. 2020; 5( 2): 106– 19. doi:10.29267/mxjb.2020.5.2.106. [Google Scholar] [CrossRef]
16. Escribano P , Viruel MA , Hormaza JI . PERMANENT GENETIC RESOURCES: development of 52 new polymorphic SSR markers from cherimoya (Annona cherimola Mill.): transferability to related taxa and selection of a reduced set for DNA fingerprinting and diversity studies. Mol Ecol Resour. 2008; 8( 2): 317– 21. doi:10.1111/j.1471-8286.2007.01941.x. [Google Scholar] [CrossRef]
17. Lira-Ortiz R , Cortés-Cruz MA , López-Guzmán GG , Palomino-Hermosillo YA , Sandoval-Padilla I , Ochoa-Jiménez VA , et al. Diversidad génetica de poblaciones de guanábana (Annona muricata L.) en Nayarit, México mediante marcadores SSR y SRAP. Acta Biol Colomb. 2022; 27( 1): 104– 12. doi:10.15446/abc.v27n1.88241. [Google Scholar] [CrossRef]
18. Li G , Quiros CF . Sequence-related amplified polymorphism (SRAP), a new marker system based on a simple PCR reaction: its application to mapping and gene tagging in Brassica. Theor Appl Genet. 2001; 103( 2): 455– 61. doi:10.1007/s001220100570. [Google Scholar] [CrossRef]
19. Nei M . Estimation of average heterozygosity and genetic distance from a small number of individuals. Genetics. 1978; 89( 3): 583– 90. doi:10.1093/genetics/89.3.583. [Google Scholar] [CrossRef]
20. Nei M , Feldman MW . Identity of genes by descent within and between populations under mutation and migration pressures. Theor Popul Biol. 1972; 3( 4): 460– 5. doi:10.1016/0040-5809(72)90017-2. [Google Scholar] [CrossRef]
21. Evanno G , Regnaut S , Goudet J . Detecting the number of clusters of individuals using the software STRUCTURE: a simulation study. Mol Ecol. 2005; 14( 8): 2611– 20. doi:10.1111/j.1365-294X.2005.02553.x. [Google Scholar] [CrossRef]
22. Azofeifa-Delgado Á . Uso de marcadores moleculares en plantas; aplicaciones en frutales del trópico. Agron Mesoam. 2006; 17( 2): 221. doi:10.15517/am.v17i2.5163. [Google Scholar] [CrossRef]
23. Strijk JS , Hinsinger DD , Roeder MM , Chatrou LW , Couvreur TLP , Erkens RHJ , et al. Chromosome-level reference genome of the soursop (Annona muricata): a new resource for Magnoliid research and tropical pomology. Mol Ecol Resour. 2021; 21( 5): 1608– 19. doi:10.1111/1755-0998.13353. [Google Scholar] [CrossRef]
24. Palomino-Hermosillo YA , Berumen-Varela G , Ochoa-Jiménez VA , Balois-Morales R , Jiménez-Zurita JO , Bautista-Rosales PU , et al. Transcriptome analysis of soursop (Annona muricata L.) fruit under postharvest storage identifies genes families involved in ripening. Plants. 2022; 11( 14): 1798. doi:10.3390/plants11141798. [Google Scholar] [CrossRef]
25. Anuragi H , Dhaduk HL , Kumar S , Dhruve JJ , Parekh MJ , Sakure AA . Molecular diversity of Annona species and proximate fruit composition of selected genotypes. 3 Biotech. 2016; 6( 2): 204. doi:10.1007/s13205-016-0520-9. [Google Scholar] [CrossRef]
26. Salazar C , Vargas-Mendoza CF , Flores JS . Estructura y diversidad genética de Annona squamosa en huertos familiares mayas de la península de Yucatán. Rev Mex De Biodivers. 2010; 81( 3): 759– 70. doi:10.22201/ib.20078706e.2010.003.647. [Google Scholar] [CrossRef]
27. Sosenski P , Dominguez CA . The value and risks of pollination as an ecosystem service. Rev Mex De Biodivers. 2018; 89( 3): 961– 70. doi:10.22201/ib.20078706e.2018.3.2168. [Google Scholar] [CrossRef]
28. Mesapogu S , Jillepalli CM , Arora DK . Agarose gel electrophoresis and polyacrylamide gel electrophoresis: methods and principles. In: Analyzing microbes. Berlin/Heidelberg, Germany: Springer; 2012. p. 73– 91. doi:10.1007/978-3-642-34410-7_5. [Google Scholar] [CrossRef]
29. Hasan A , Bermawie N , Julistiono H , Riyanti E , Hasim , Artika I , et al. Genetic diversity analysis of soursop (Annona muricata L.) in West Java Region of Indonesia using RAPD markers. Annu Res Rev Biol. 2017; 14: 1– 7. doi:10.9734/ARRB/2017/34354. [Google Scholar] [CrossRef]
30. van Ginkel M , Flipphi RCH . Why self-fertilizing plants still exist in wild populations: diversity assurance through stress-induced male sterility may promote selective outcrossing and recombination. Agronomy. 2020; 10( 3): 349. doi:10.3390/agronomy10030349. [Google Scholar] [CrossRef]
31. González AV , Gómez-Silva V , Ramírez MJ , Fontúrbel FE . Meta-analysis of the differential effects of habitat fragmentation and degradation on plant genetic diversity. Conserv Biol. 2020; 34( 3): 711– 20. doi:10.1111/cobi.13422. [Google Scholar] [CrossRef]
32. Suratman S , Pitoyo A , Mulyani S , Suranto S . Assessment of genetic diversity among soursop (Annona muricata) populations from Java, Indonesia using RAPD markers. Biodiversitas. 2016; 16( 2): 247– 53. doi:10.13057/biodiv/d160220. [Google Scholar] [CrossRef]
33. Parizotto DR , Grossi PC . Revisiting pollinating Cyclocephala scarab beetles (Coleoptera: Melolonthidae: Dynastinae) associated with the soursop (Annona muricata, Annonaceae). Neotrop Entomol. 2019; 48( 3): 415– 21. doi:10.1007/s13744-018-0647-y. [Google Scholar] [CrossRef]
Cite This Article
 Copyright © 2026 The Author(s). Published by Tech Science Press.
This work is licensed under a Creative Commons Attribution 4.0 International License , which permits unrestricted use, distribution, and reproduction in any medium, provided the original work is properly cited.
 Downloads
 Citation Tools