
 Login
Login Register
 Submit a Paper
 Propose a Special lssue
 Open Access
ARTICLE
Genetic Diversity of the 4th-Cycle Breeding Population of Cunninghamia lanceolata (Lamb.) Hook. Using SSR Markers
1 Nanjing Forestry University, Nanjing, China
2 Fujian Academy of Forestry, Fuzhou, China
3 Yangkou State-Owned Forest Farm of Fujian Province, Nanping, China
4 Jiangle State-Owned Forest Farm of Fujian Province, Sanming, China
5 Guanzhuang State-Owned Forest Farm of Fujian Province, Sanming, China
6 Huaqiao Guangze State-Owned Forest Farm of Fujian Province, Guangze, China
* Corresponding Authors: Shunde Su. Email: ; Renhua Zheng. Email:
Phyton-International Journal of Experimental Botany 2026, 95(9), 18 https://doi.org/10.32604/phyton.2026.089247
Received 16 July 2026; Accepted 31 August 2026; Issue published 24 September 2026
 View Full Text
 Download PDF
Abstract
Cunninghamia lanceolata (Lamb.) Hook., a fast-growing timber species endemic to China, has been constrained in genetic improvement and marker-assisted breeding programs by the paucity of molecular-level genetic diversity information. In this study, 22 pairs of highly polymorphic SSR molecular markers were designed and developed based on transcriptome sequencing and public data, and subsequently employed for genetic diversity analysis of 258 germplasm accessions. These primers amplified 235 alleles across all accessions, averaging 10.682 alleles per marker. The mean observed heterozygosity (Ho) and expected heterozygosity (He) were 0.543 and 0.668, respectively, and the polymorphic information content (PIC) values ranged from 0.237 to 0.947, with a mean of 0.627, indicating substantial genetic diversity within the tested germplasm panel. Bayesian population structure analysis resolved the 258 accessions into 11 distinct genetic groups, with group 11 comprising 155 individuals and exhibiting the most complex provenance composition—a pattern independently corroborated by phylogenetic reconstruction and Principal Coordinate Analysis (PCoA). Among 11% of the genetic variation originated between populations and 89% from within populations. Pairwise estimates of Nei’s genetic distance and pairwise FST indicated frequent historical gene flow and close genetic relatedness among most groups. These findings provide a valuable empirical reference for germplasm evaluation and marker-assisted breeding in C. lanceolata.Keywords
Supplementary Material
Supplementary Material FileAll references Cunninghamia lanceolata (Lamb.) Hook. (C. lanceolata), a fast-growing timber species of the Cupressaceae family endemic to subtropical southern China, is cultivated across 17 provinces and regions south of the Yangtze River [1]. As one of the country’s most economically important conifers, it boasts the largest plantation area among all tree species in China. Its wood is prized for light weight, soft texture, straight grain, and notable decay resistance, making it widely used in construction, furniture manufacturing, and papermaking [2]. With a long cultivation history and abundant germplasm resources, breeding programs for C. lanceolata have progressed through four generations of seed orchards since the 1950s [3,4]. Despite considerable advances in conventional breeding targeting growth rate and wood quality, the genetic architecture underlying its phenotypic and biological traits remains poorly characterized. This limited understanding severely hampers the efficiency of genetic improvement and the development of marker-assisted selection for this species [5].
Since DNA molecular markers enable direct characterization of genomic genetic variations, independent of environmental conditions and plant developmental stages [6], they have been extensively applied in genetic map construction, quantitative trait locus (QTL) mapping, and germplasm genetic diversity assessment, substantially enhancing the efficiency and accuracy of forest tree breeding programs [7]. The continuous development and iterative renewal of marker technologies—from early RFLP (Restriction Fragment Length Polymorphism), RAPD (Random Amplified Polymorphic DNA), and AFLP (Amplified Fragment Length Polymorphism) to modern SSR and SNP (Single Nucleotide Polymorphism) markers—have provided robust technical support for the advancement of molecular breeding in woody species [8,9]. Among the various molecular marker systems, simple sequence repeats (SSRs) have become indispensable tools for species-level genetic diversity evaluation and germplasm characterization, by virtue of their pronounced codominance, high polymorphism, robust reproducibility, minimal DNA requirement, and extensive genomic distribution [10]. In recent years, SSR markers have been widely adopted for various genetic studies, including kinship identification [11,12,13], genetic diversity analysis [14,15], and germplasm fingerprinting [16,17].
Current genetic studies on C. lanceolata have largely focused on seed orchards from individual regions or single-generation population, while systematic evaluations across multi-germplasm collections and hierarchical repositories remain scarce [18]. Moreover, few investigations have comprehensively addressed how the generation-based ex situ conservation strategy implemented in 4th-Cycle Breeding Population influences stratified population genetic structure, mediates breeding differences among successive generations, and facilitates the refinement of germplasm management practices. Long-term regionalized preservation has led to pronounced genetic divergence between early-selected second-generation materials and the improved third- and fourth-generation breeding stocks. However, the underlying mechanisms driving this stratified differentiation, as well as its implications for long-term genetic improvement, remain elusive and warrant systematic exploration. In this study, we therefore used the 4th-generation germplasm repository of C. lanceolata as experimental material. Employing species-specific SSR markers developed for this species, we systematically assessed the genetic diversity, population structure, and pairwise genetic relatedness of the fourth-generation resources. Our aims were to clarify the causes of genetic differentiation among germplasms from different breeding generations and to reveal the intrinsic mechanisms underlying stratified genetic divergence under multigeneration isolated conservation regimes.
A total of 258 accessions were analyzed in this study, and 6 samples were selected for the development of simple sequence repeat (SSR) markers. All experimental materials were sourced from the 4th-generation germplasm repository of C. lanceolata, maintained at the National Improved-Variety Base of Yangkou State Forest Farm, Fujian Province. Comprising 9 accessions of the 1st generation, 21 of the 2nd, 180 of the 3rd, and 48 of the 4th-generation. (The 1st-generation germplasm of C. lanceolata was derived from plus trees in natural stands or elite individuals in plantations. The 2nd generation was developed via reselection among progeny from crosses of 1st-generation plus trees and open-pollinated seed-orchard progeny. The 3rd generation was obtained from elite offspring of 2nd-generation populations subjected to systematic combining-ability designs, including diallel crosses, polycrosses, and regional trials. The 4th generation was formed by integrating elite offspring from the 3rd-generation breeding population with newly supplemented wild or natural germplasm resources).
2.2 Transcriptome Data Assembly and SSR Locus Identification
Needle tissue samples were collected from the 4th-generation germplasm repository of C. lanceolata and used for transcriptome sequencing, which was performed by Tsingke Biotechnology Co., Ltd. (Beijing, China) on the DNBSEQ-T7 high-throughput platform to generate raw reads. Adapter sequences and low-quality reads were removed according to the following criteria: reads with >10% ambiguous N bases, or with >50% of bases having a quality score (Q) ≤10, were discarded. This filtering yielded 39,863,163 clean reads, which were then assembled into 73,784 unigenes using Trinity software (version 2.15.2; https://github.com/trinityrnaseq/trinityrnaseq). SSR loci were subsequently screened from the unigenes via the MISA web server (https://webblast.ipk-gatersleben.de/misa/), with the minimum number of tandem repeats set to 10 for mononucleotide, 6 for dinucleotide, and 5 for tri-, tetra-, penta-, and hexanucleotide motifs.
2.3 SSR Primer Design and Synthesis
Based on transcriptome sequencing data and previously reported SSR sequences retrieved from public databases and the published literature, a total of 272 primer pairs were initially designed for C. lanceolata. Of these, 89 pairs were derived from public databases, while the remainder were designed using Primer3 (http://sourceforge.net/projects/primer3/files/primer3/) based on the transcriptome SSR loci analysis. The design parameters were as follows: primer length 18–27 bp, annealing temperature (Tm) 57–63°C, amplicon size 100–500 bp, and GC content 40%–60%. After rigorous quality filtering, 182 high-quality primer pairs were selected and commercially synthesized by Tsingke Biotechnology Co., Ltd. (Beijing, China) and Sangon Biotech (Shanghai) Co., Ltd.
2.4 DNA Extraction and Detection
Total genomic DNA was isolated from 258 C. lanceolata accessions using the Plant Genomic DNA Extraction Kit (Tiangen Biotech Co., Ltd., Beijing, China; Cat. No. DP321), following the manufacturer’s protocol. The concentration and purity of the extracted DNA were quantified using a NanoDrop One spectrophotometer (Thermo Fisher Scientific, Waltham, MA, USA). DNA integrity was further evaluated by electrophoresis on 1% (w/v) agarose gels.
PCR was performed in a 20-μL reaction mixture containing 2.0 μL of 10× PCR buffer, 2.0 μL of template DNA, 0.4 μL of dNTPs, 0.3 μL each of forward (5′-FAM labeled) and reverse primers, 0.2 μL (1 U) of Taq DNA polymerase (5 U/μL), and 14.8 μL of sterile deionized water. The thermal cycling protocol consisted of an initial denaturation at 94°C for 5 min, followed by 35 cycles of 94°C for 30 s, 54°C for 35 s, and 72°C for 40 s, with a final extension at 72°C for 3 min. All reactions were carried out in a Veriti 96-well thermal cycler (Applied Biosystems, Foster City, CA, USA). The amplified products were then subjected to capillary electrophoresis on an ABI 3730xl Genetic Analyzer (Applied Biosystems, Foster City, CA, USA) with ROX500 as the internal size standard. An analytical threshold (AT) of 200 relative fluorescence units (RFU) was applied for allele calling.
Raw electropherogram data were analyzed using the Fragment Analysis module of GeneMarker v2.2.0. Allele sizes were determined by co-migration with the internal size standard, with automated binning followed by manual verification to ensure accuracy (https://www.biogene.com/genemarker.html). Population genetic parameters and analysis of molecular variance (AMOVA) were calculated using GenAlEx 6.501 [19]. Polymorphic information content (PIC), Nei’s genetic distances among individuals, and a preliminary UPGMA dendrogram were obtained using PowerMarker v3.25 [20]. Population structure was inferred with Structure v2.3.4 under the admixture model [21], with a burn-in period of 200,000 iterations followed by 200,000 Markov chain Monte Carlo (MCMC) replicates. The number of genetic clusters (K) was tested from 2 to 15, with 10 independent runs per K value. The resulting output files were submitted to the Structure Selector web server (https://lmme.ac.cn/StructureSelector/) to determine the optimal K using the ΔK method. For phylogenetic analysis, a UPGMA (Unweighted Pair Group Method with Arithmetic mean) tree with 1000 bootstrap replicates was reconstructed using MEGA 11 [22], and the final tree was visualized and annotated with iTOL (https://itol.embl.de/).
3.1 SSR Locus Identification and the Distribution of SSRs
A total of 8011 SSR loci were identified among 73,784 unigenes derived from transcriptome sequencing, which were distributed across 7403 unigenes. The frequency of SSR loci was 10.86%, and the frequency of SSR-containing unigenes reached 10.03%, with an average interval of 8.61 kb between adjacent SSR loci (Table S1). As illustrated in Fig. 1, the number of SSR loci exhibited a negative correlation with repeat motif length. Among all detected SSR loci, mononucleotide repeats dominated with a pro-portion of 65.85%, followed by dinucleotide (17.05%) and trinucleotide repeats (15.22%). Tetranucleotide, pentanucleotide, and hexanucleotide repeats accounted for relatively small proportions, at 0.87%, 0.25% and 0.76%, respectively.
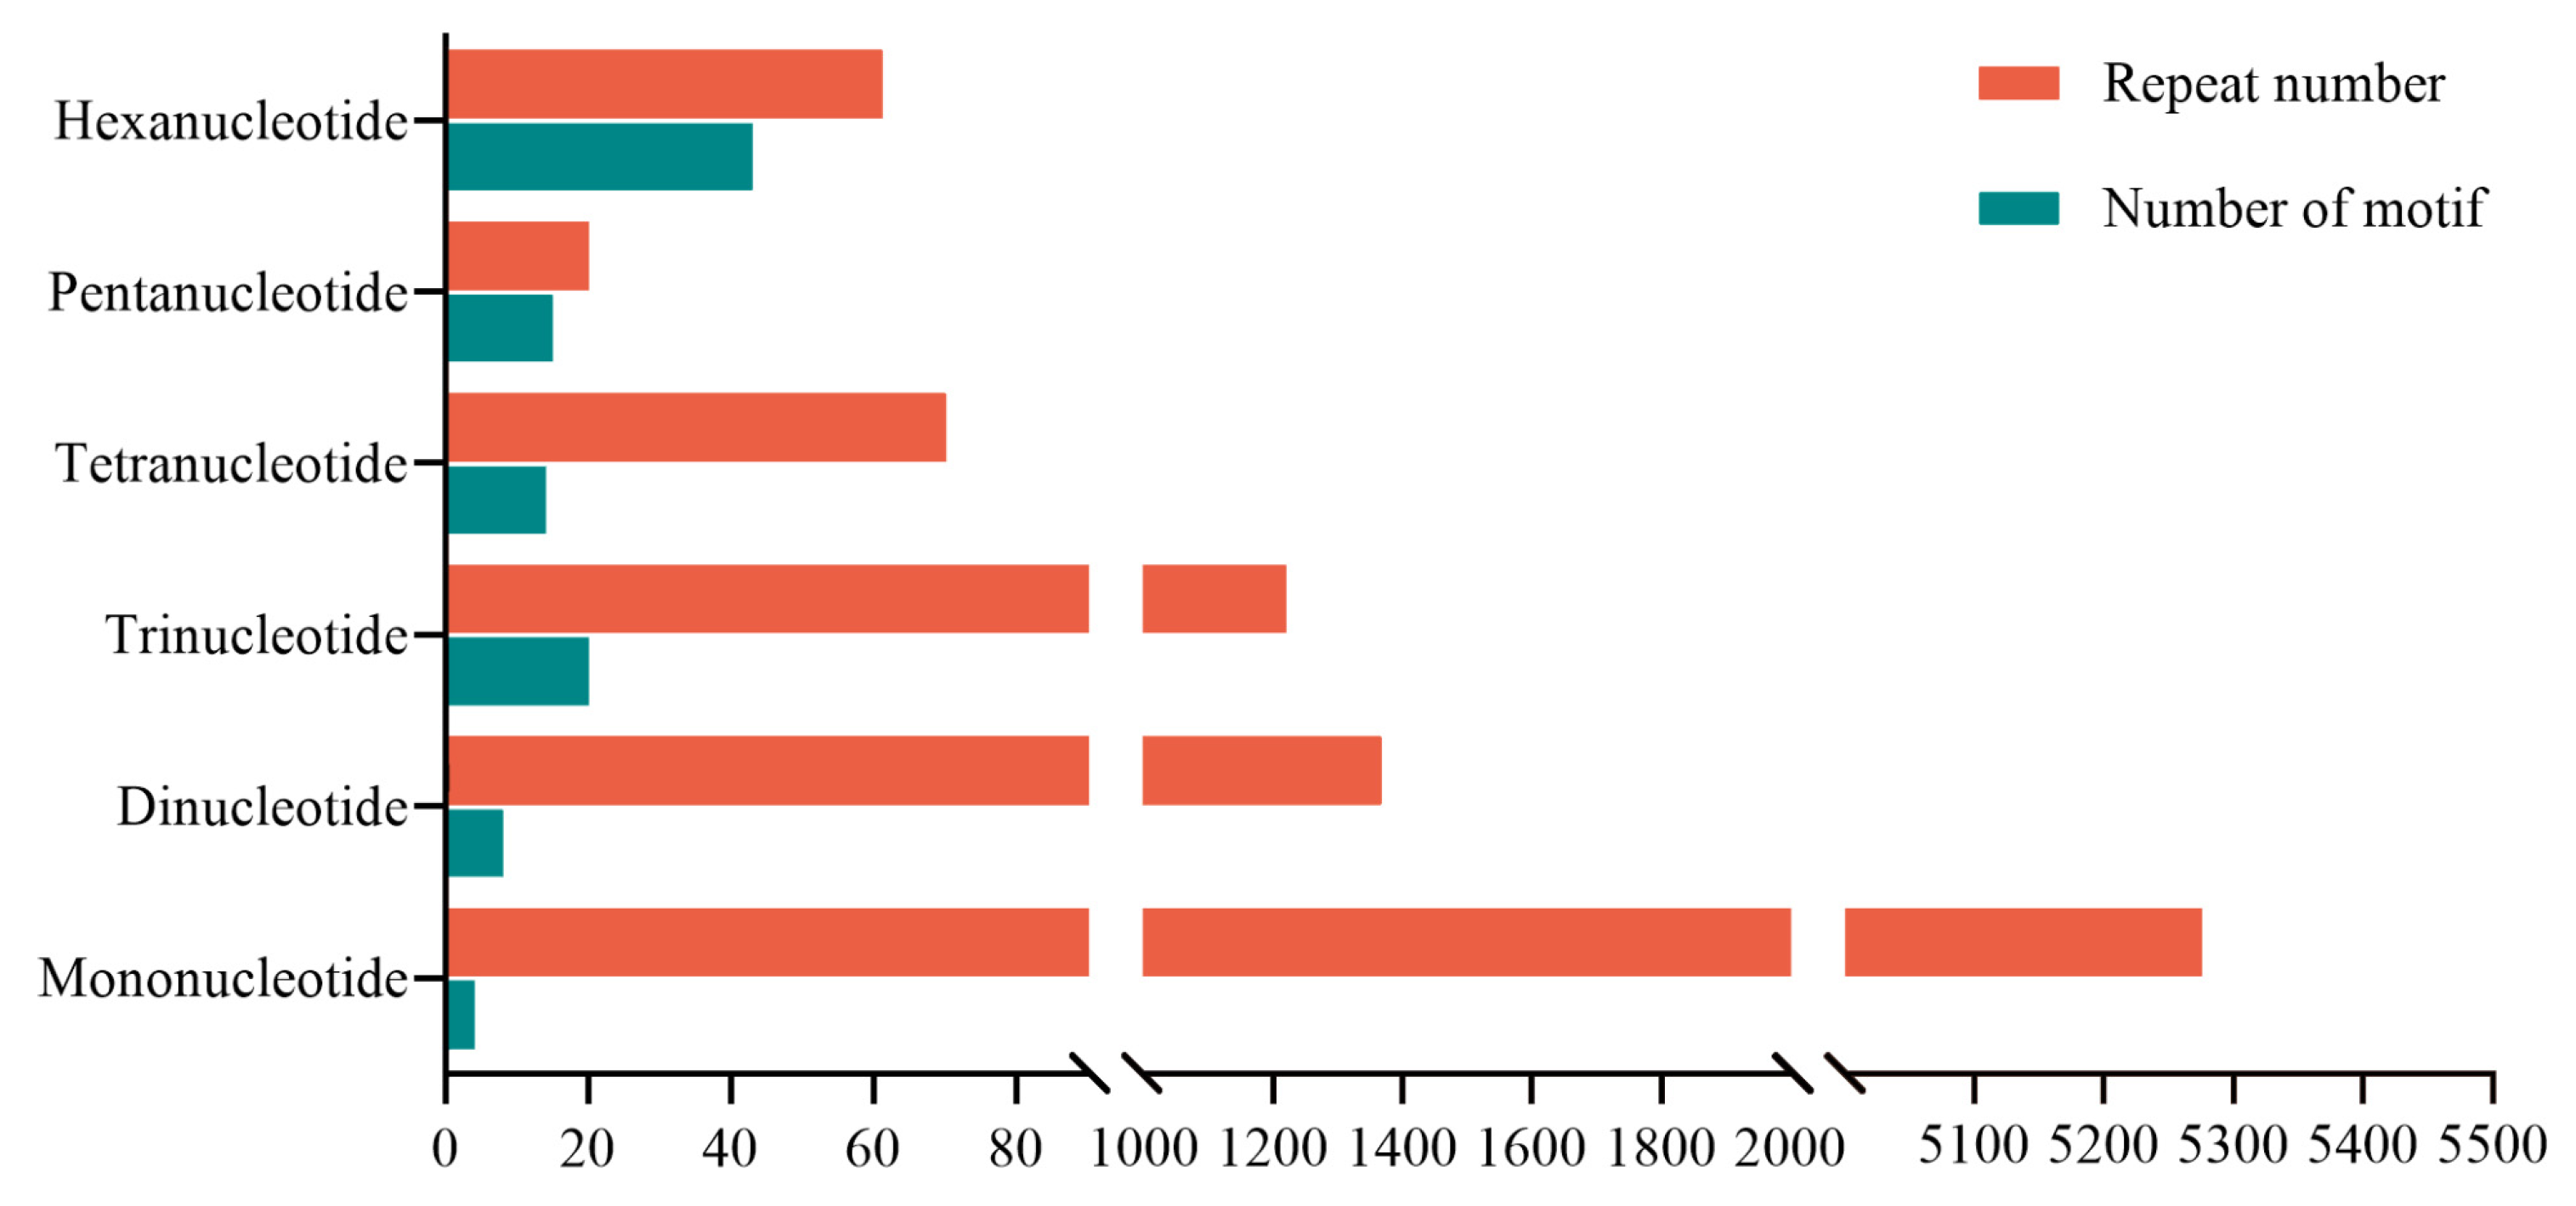
Figure 1: Distributions of SSR repeat types with different repeat numbers in the assembled Unigene sequences of C. lanceolata.
Further analysis was performed to characterize SSR repeat motifs, and the results are presented in Fig. 2. Four types of mononucleotide motifs were detected, namely A/T and C/G. The A/T motif was the most abundant, with 5220 occurrences (65.16% of all SSR loci), whereas the C/G motif only occupied 0.69% (Table S2). A total of eight dinucleotide repeat motifs were identified. Among them, AT/AT was the predominant type with 664 occurrences (8.29%), followed by AG/CT (379 occurrences, 4.73%) and AC/GT (321 occurrences, 4.00%). By contrast, CG/CG was extremely rare, appearing merely twice and making up only 0.02%. Twenty trinucleotide repeat motifs were discovered. AAG/CTT was the most frequent motif (299 occurrences, 3.73%), followed by AGG/CCT (187 occurrences, 2.33%), AGC/CTG (182 occurrences, 2.27%), and AAT/ATT (165 occurrences, 2.06%). Although abundant motif types existed in tetranucleotide, pentanucleotide and hexanucleotide repeats, each individual type represented a relatively low proportion. Collectively, these longer repeat motifs accounted for only 1.88% of the total SSR loci.
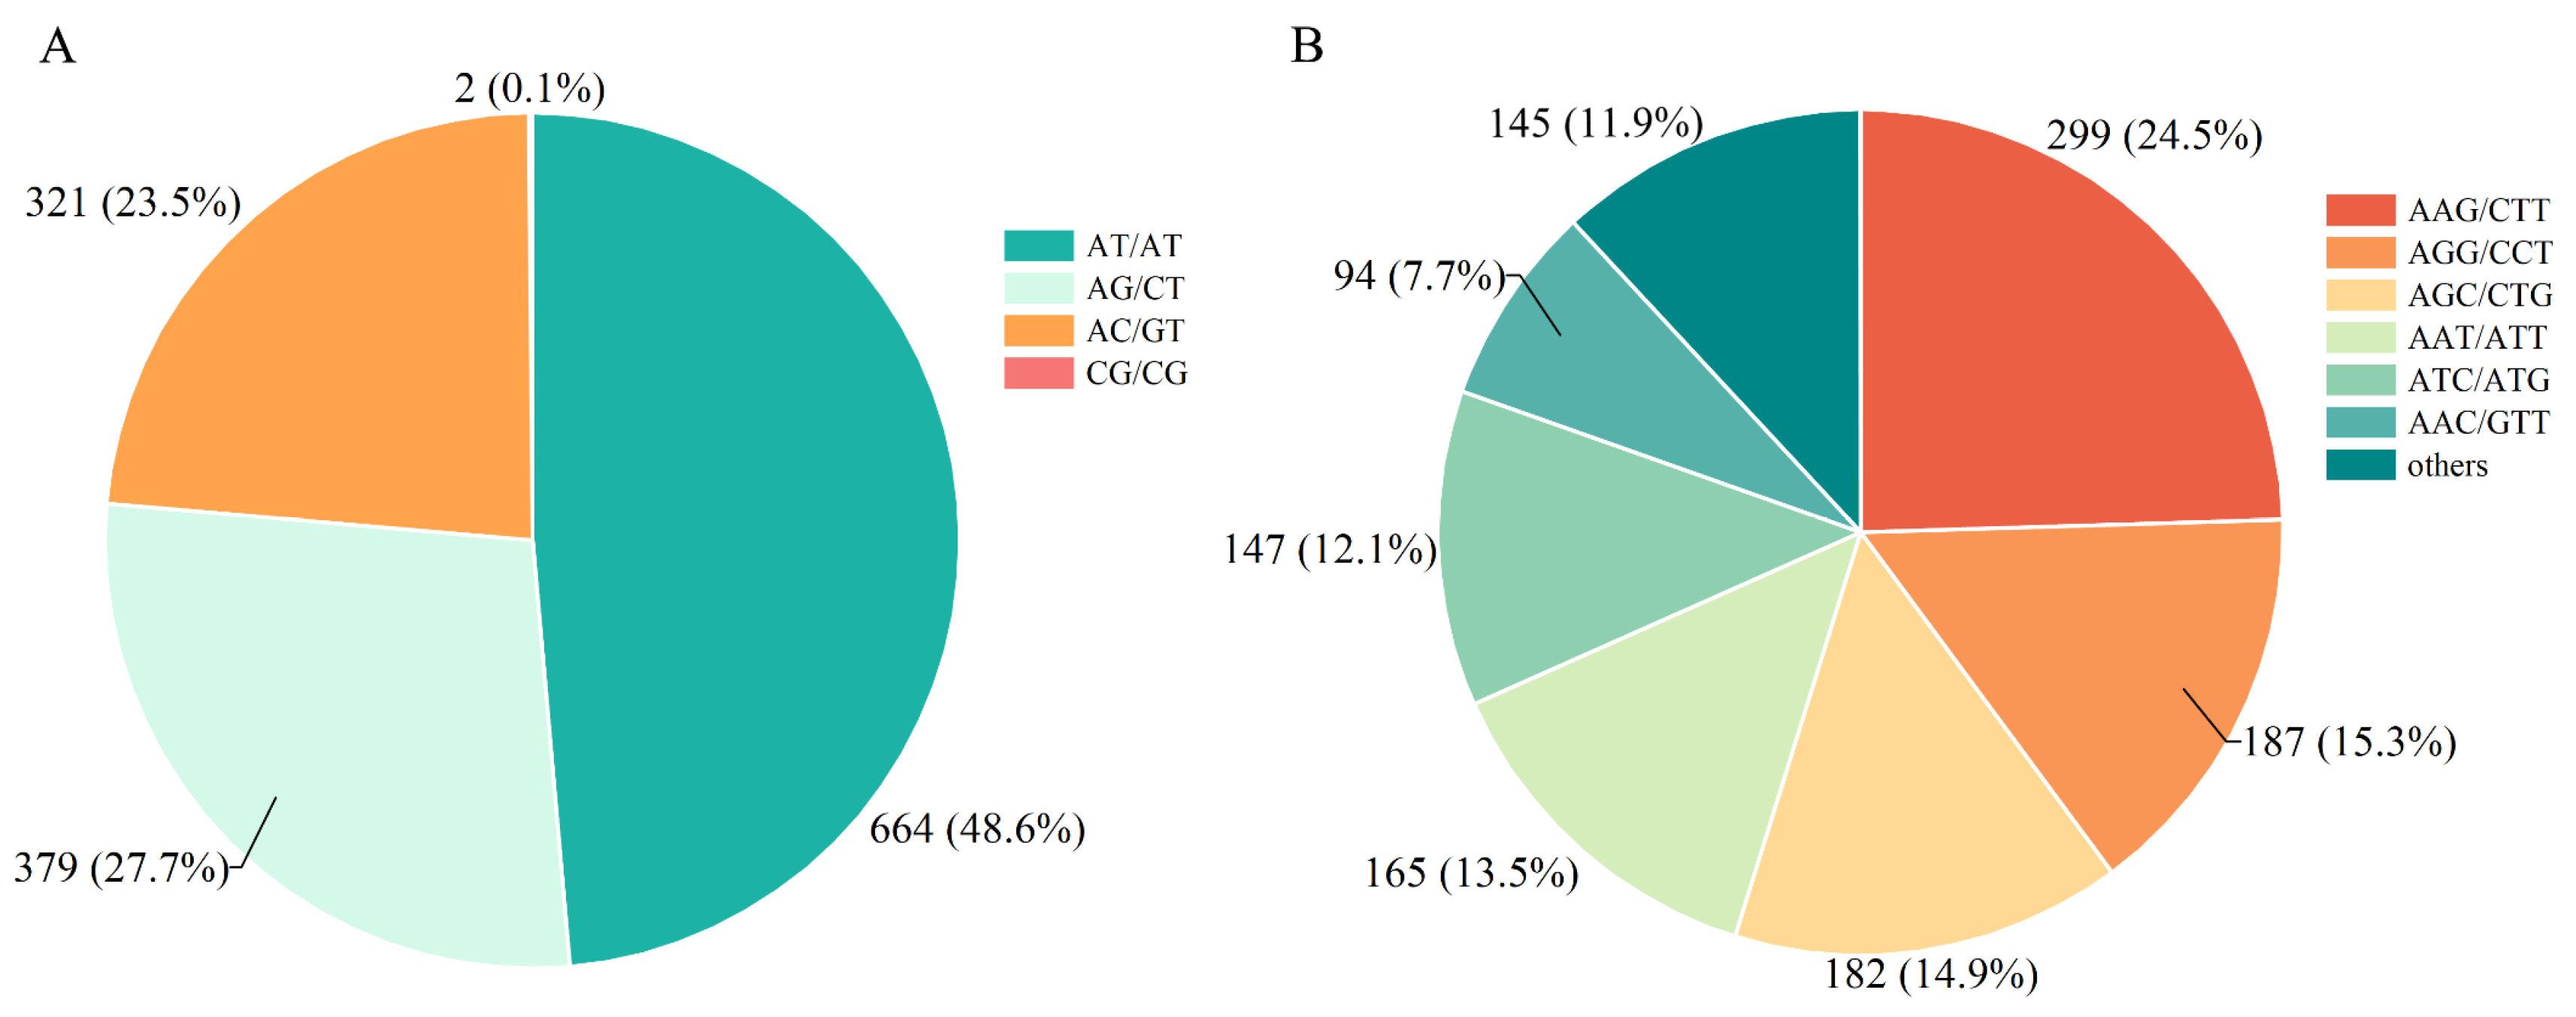
Figure 2: Characterization of repeat motif frequencies in assembled C. lanceolata Unigenes. (A) Dinucleotide repeat motif frequency distribution; (B) Trinucleotide repeat motif frequency distribution.
A total of 272 SSR primer pairs were designed and synthesized based on transcriptome derived loci and published references. Their amplification efficiency and polymorphism were validated using genomic DNA templates from 6 C. lanceolata individuals. Among these 153 primer pairs (56.25%) produced clear and scorable amplicons, of which 76 pairs (27.94%) exhibited polymorphic bands. The 76 polymorphic primer pairs were subsequently genotyped by capillary electrophoresis. Based on multiple criteria including peak resolution, amplification stability and number of alleles etc. a core set of 22 primer pairs was selected (Table S3). Representative capillary electrophoretic profiles of primer P32 across the tested germplasms are shown in Fig. 3.
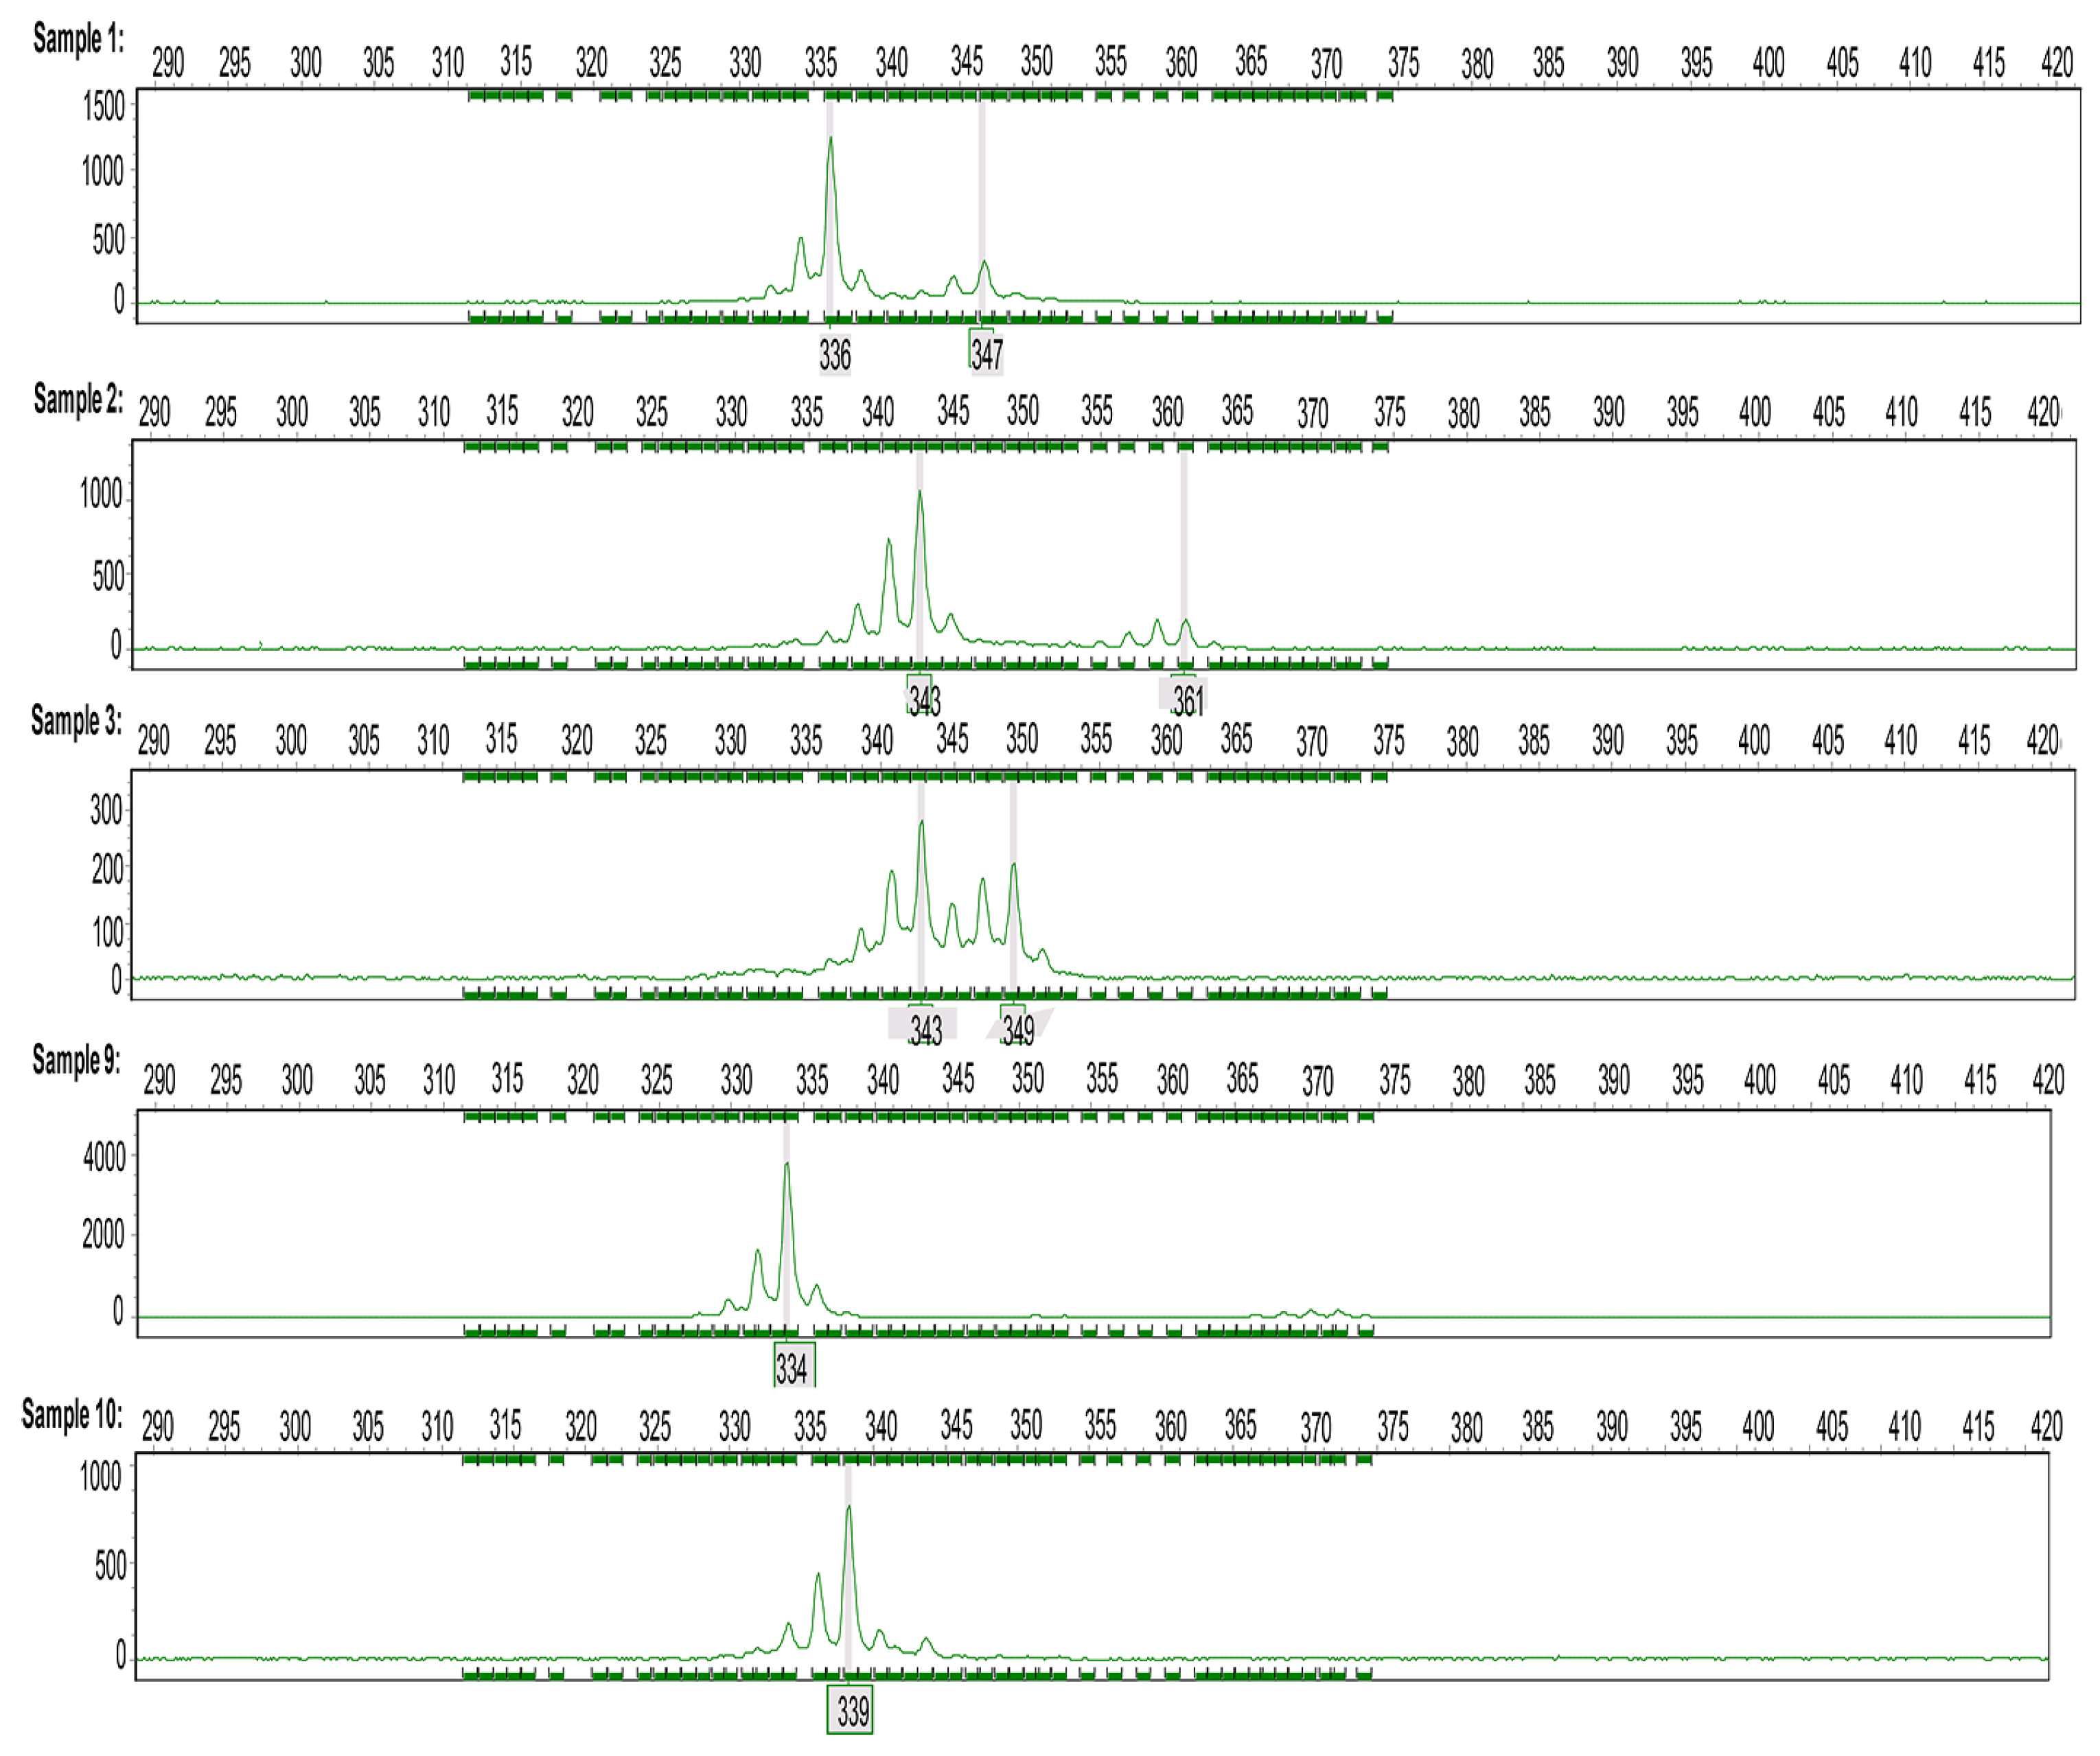
Figure 3: Capillary electrophoresis chromatograms of primer P32 in a subset of C. lanceolata accessions.
Genetic diversity of 258 C. lanceolata germplasm accessions was evaluated using the 22 core SSR primer pairs identified in this study (Table 1). A total of 235 alleles (Na) were amplified across all accessions, averaging 10.682 alleles per locus. Mean Ho and He were 0.543 and 0.668, respectively. PIC values varied from 0.237 to 0.947, with an average of 0.627, and the mean Shannon’s diversity index (I) was 1.477. Collectively, these results indicate that the examined germplasm possesses substantial genetic diversity.
Table 1: Genetic diversity parameters of 22 SSR markers.
| Locus | Na | Ne | I | Ho | He | PIC |
|---|---|---|---|---|---|---|
| P13 | 7 | 1.922 | 1.036 | 0.446 | 0.481 | 0.454 |
| P32 | 32 | 19.686 | 3.171 | 0.309 | 0.951 | 0.947 |
| P38 | 8 | 3.274 | 1.442 | 0.624 | 0.696 | 0.652 |
| P40 | 10 | 3.185 | 1.534 | 0.69 | 0.687 | 0.655 |
| P41 | 8 | 3.613 | 1.55 | 0.736 | 0.725 | 0.685 |
| P43 | 8 | 4.185 | 1.575 | 0.740 | 0.763 | 0.721 |
| P61 | 5 | 2.641 | 1.142 | 0.585 | 0.623 | 0.562 |
| P81 | 2 | 1.380 | 0.447 | 0.283 | 0.276 | 0.237 |
| P115 | 8 | 2.093 | 1.108 | 0.498 | 0.523 | 0.482 |
| P130 | 6 | 3.190 | 1.277 | 0.712 | 0.688 | 0.629 |
| P132 | 8 | 2.771 | 1.314 | 0.665 | 0.640 | 0.600 |
| P176 | 15 | 3.877 | 1.723 | 0.591 | 0.744 | 0.717 |
| P190 | 6 | 2.205 | 0.900 | 0.556 | 0.548 | 0.443 |
| P194 | 19 | 2.424 | 1.396 | 0.523 | 0.589 | 0.550 |
| P197 | 12 | 4.197 | 1.734 | 0.518 | 0.763 | 0.731 |
| P223 | 20 | 7.740 | 2.352 | 0.146 | 0.873 | 0.858 |
| P230 | 18 | 7.110 | 2.267 | 0.386 | 0.861 | 0.847 |
| P240 | 11 | 3.516 | 1.479 | 0.593 | 0.717 | 0.672 |
| P243 | 10 | 2.294 | 1.162 | 0.585 | 0.565 | 0.522 |
| P245 | 10 | 2.684 | 1.328 | 0.461 | 0.629 | 0.591 |
| P250 | 6 | 3.034 | 1.279 | 0.628 | 0.672 | 0.617 |
| P258 | 6 | 3.108 | 1.288 | 0.663 | 0.680 | 0.623 |
| Mean | 10.682 | 4.097 | 1.477 | 0.543 | 0.668 | 0.627 |
3.4 Population Genetic Structure and Genetic Variation
Bayesian inference of population structure was implemented to delineate the genetic architecture of C. lanceolata accessions, with the most likely cluster number (K) estimated according to the ΔK criterion proposed by Evanno et al. [21]. The ΔK statistic exhibited a distinct peak at K = 11 (Fig. 4A,B), partitioning the 258 accessions into 11 genetic groups (Fig. 4C). Group 1 and group 2 contained the fewest accessions (1 and 2), whereas Group 11 comprised the largest number (155) with diverse origins. Accessions from generations 1–4 were labeled for comparative analysis. As shown in Fig. 5A, individuals from each generation were distributed across multiple genetic groups in varying proportions. Specifically, 3rd generation accessions predominated in Group 11; 1st generation materials were detected in Groups 6, 8, and 11; and 2nd generation accessions occurred in Groups 1, 3, and others; Groups 4, 8, 9, 10, and 11 were mainly composed of 3rd and 4th generation germplasms.
Principal Coordinate Analysis (PCoA) revealed that the first two principal coordinates explained 4.28% and 3.83% of the total molecular variance, respectively, with a cumulatively accounting for 8.11% of the variation (Fig. 5B). The vast majority of C. lanceolata accessions formed a central core cluster dominated by individuals assigned to Group 11, with accessions from all other genetic groups extensively admixed within this central cluster. No discrete, genetically distinct partitioning was detected across the 11 inferred groups, confirming weak population genetic differentiation—a pattern fully congruent with Bayesian STRUCTURE outputs.
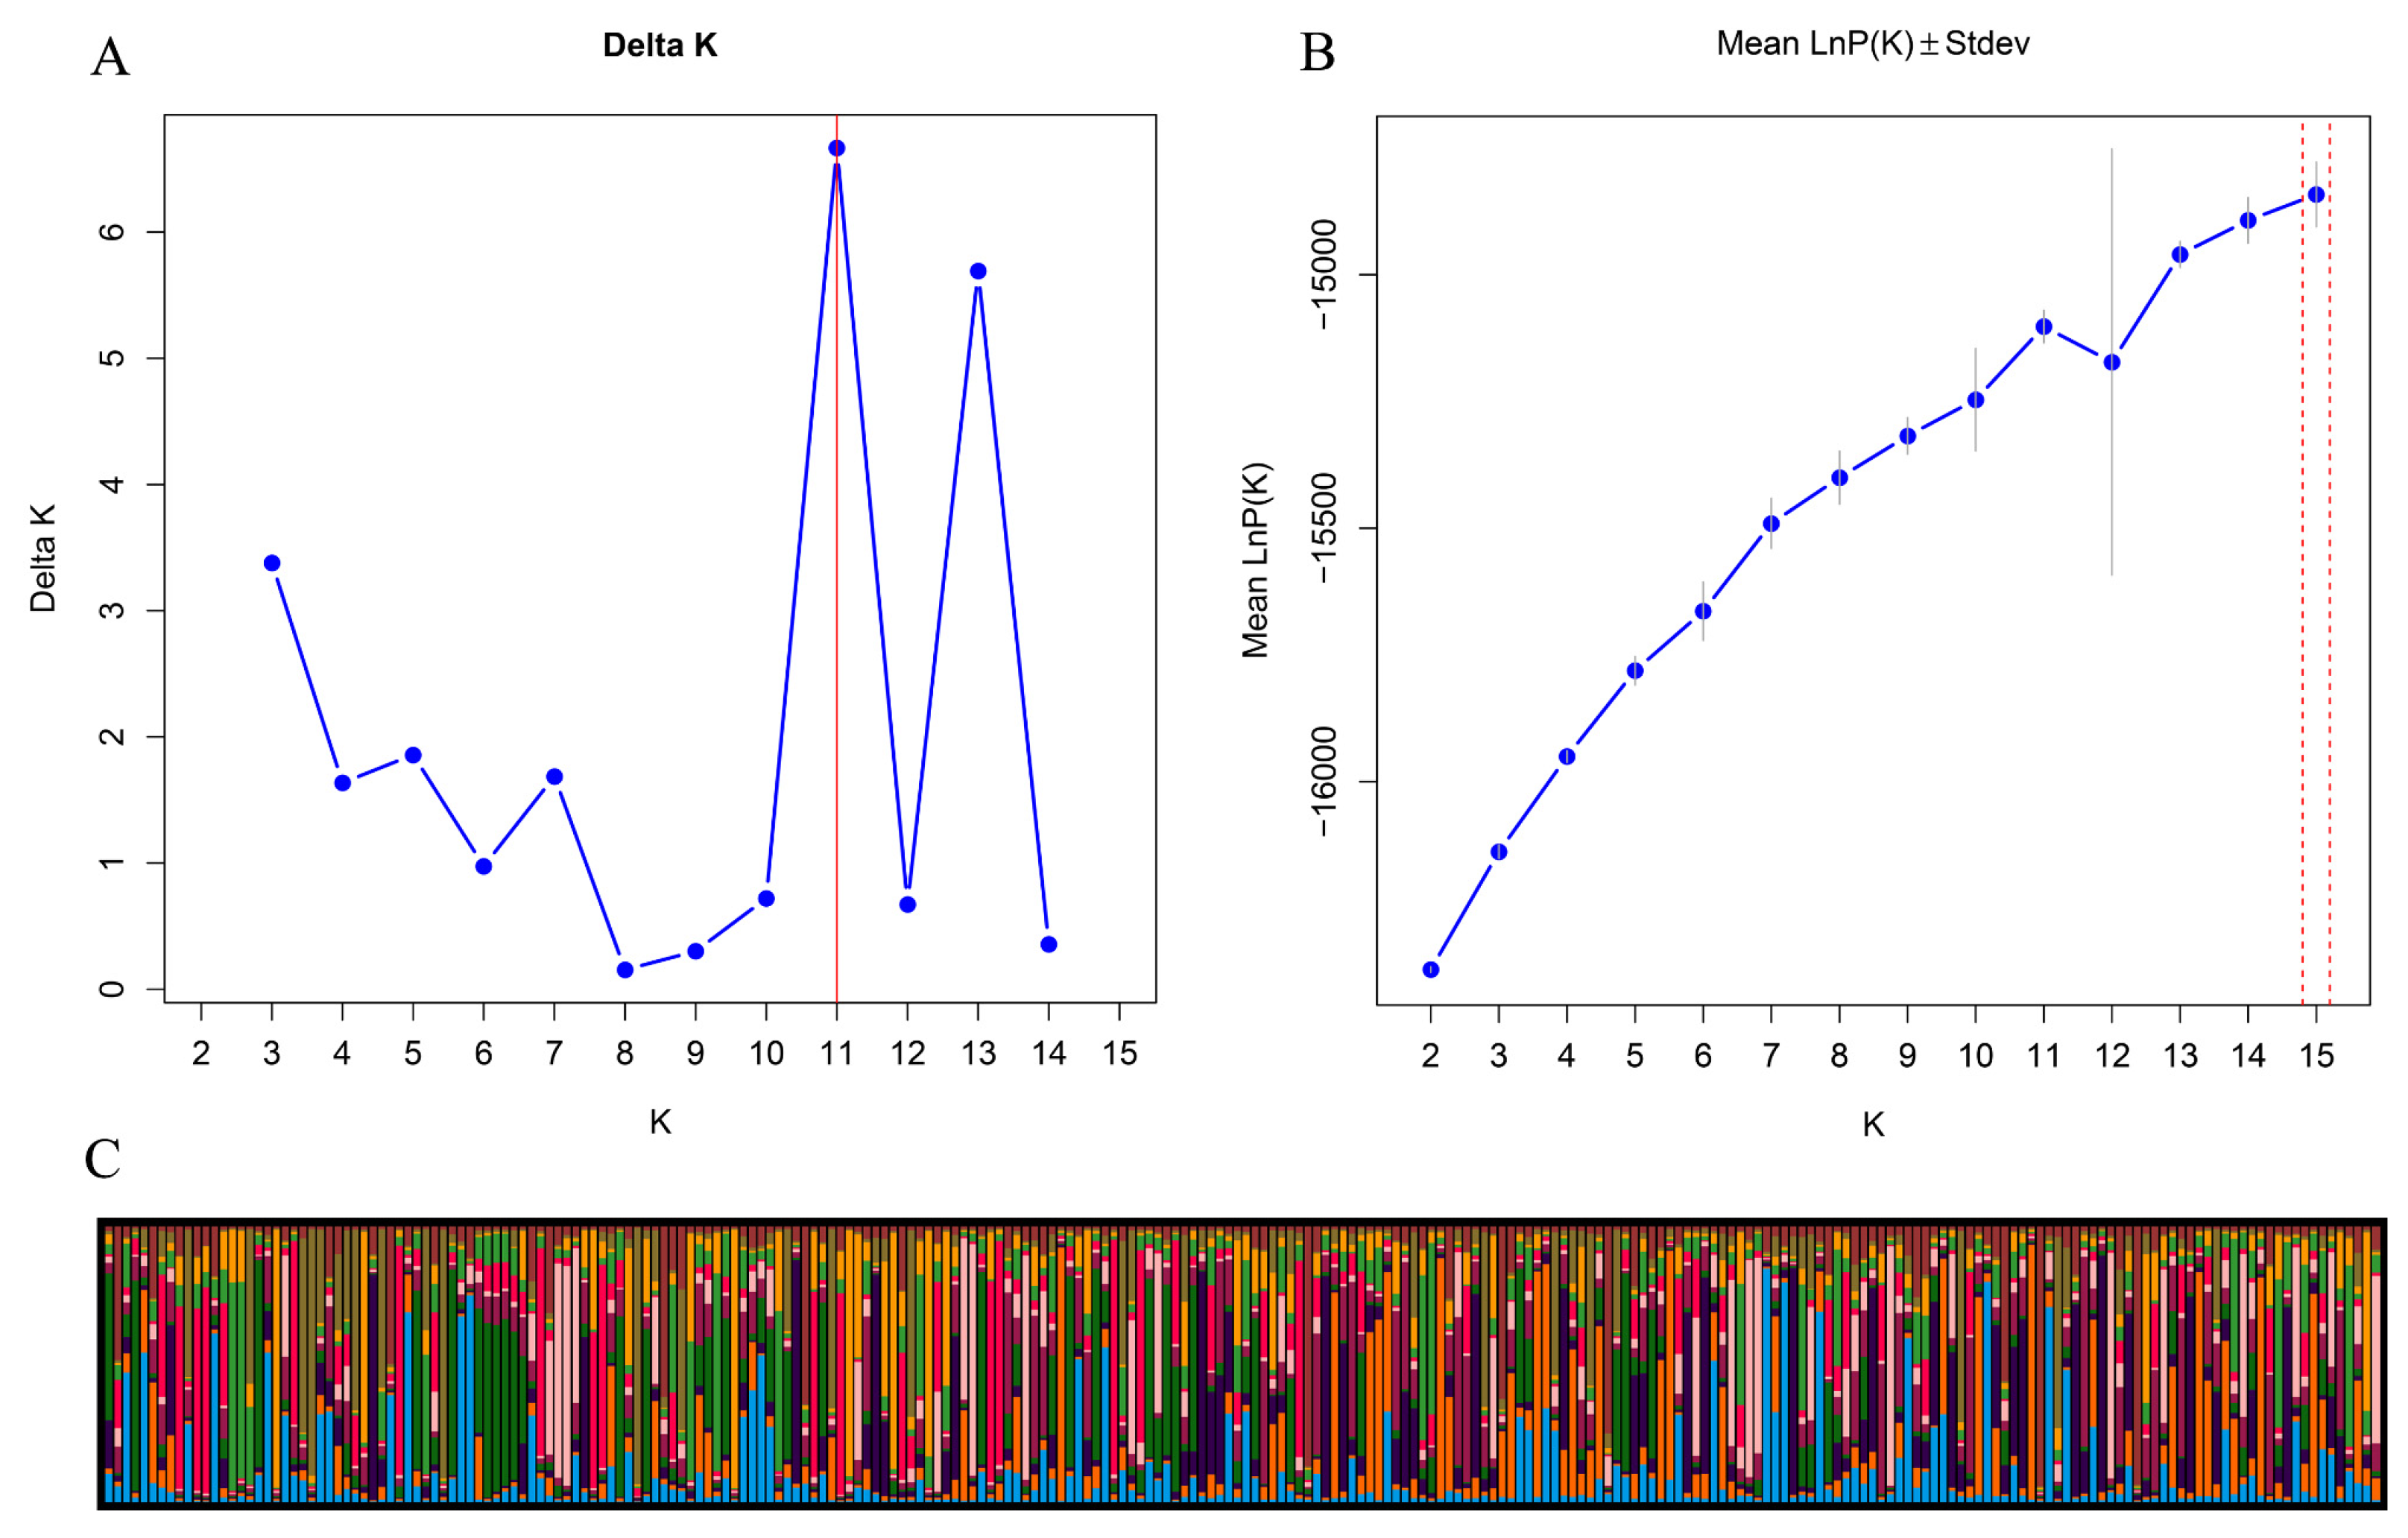
Figure 4: (A) The relation between the selectable cluster number K and ΔK. (B) Population structure estimation using the mean Ln P(K) statistic. (C) The population genetic structure pattern.
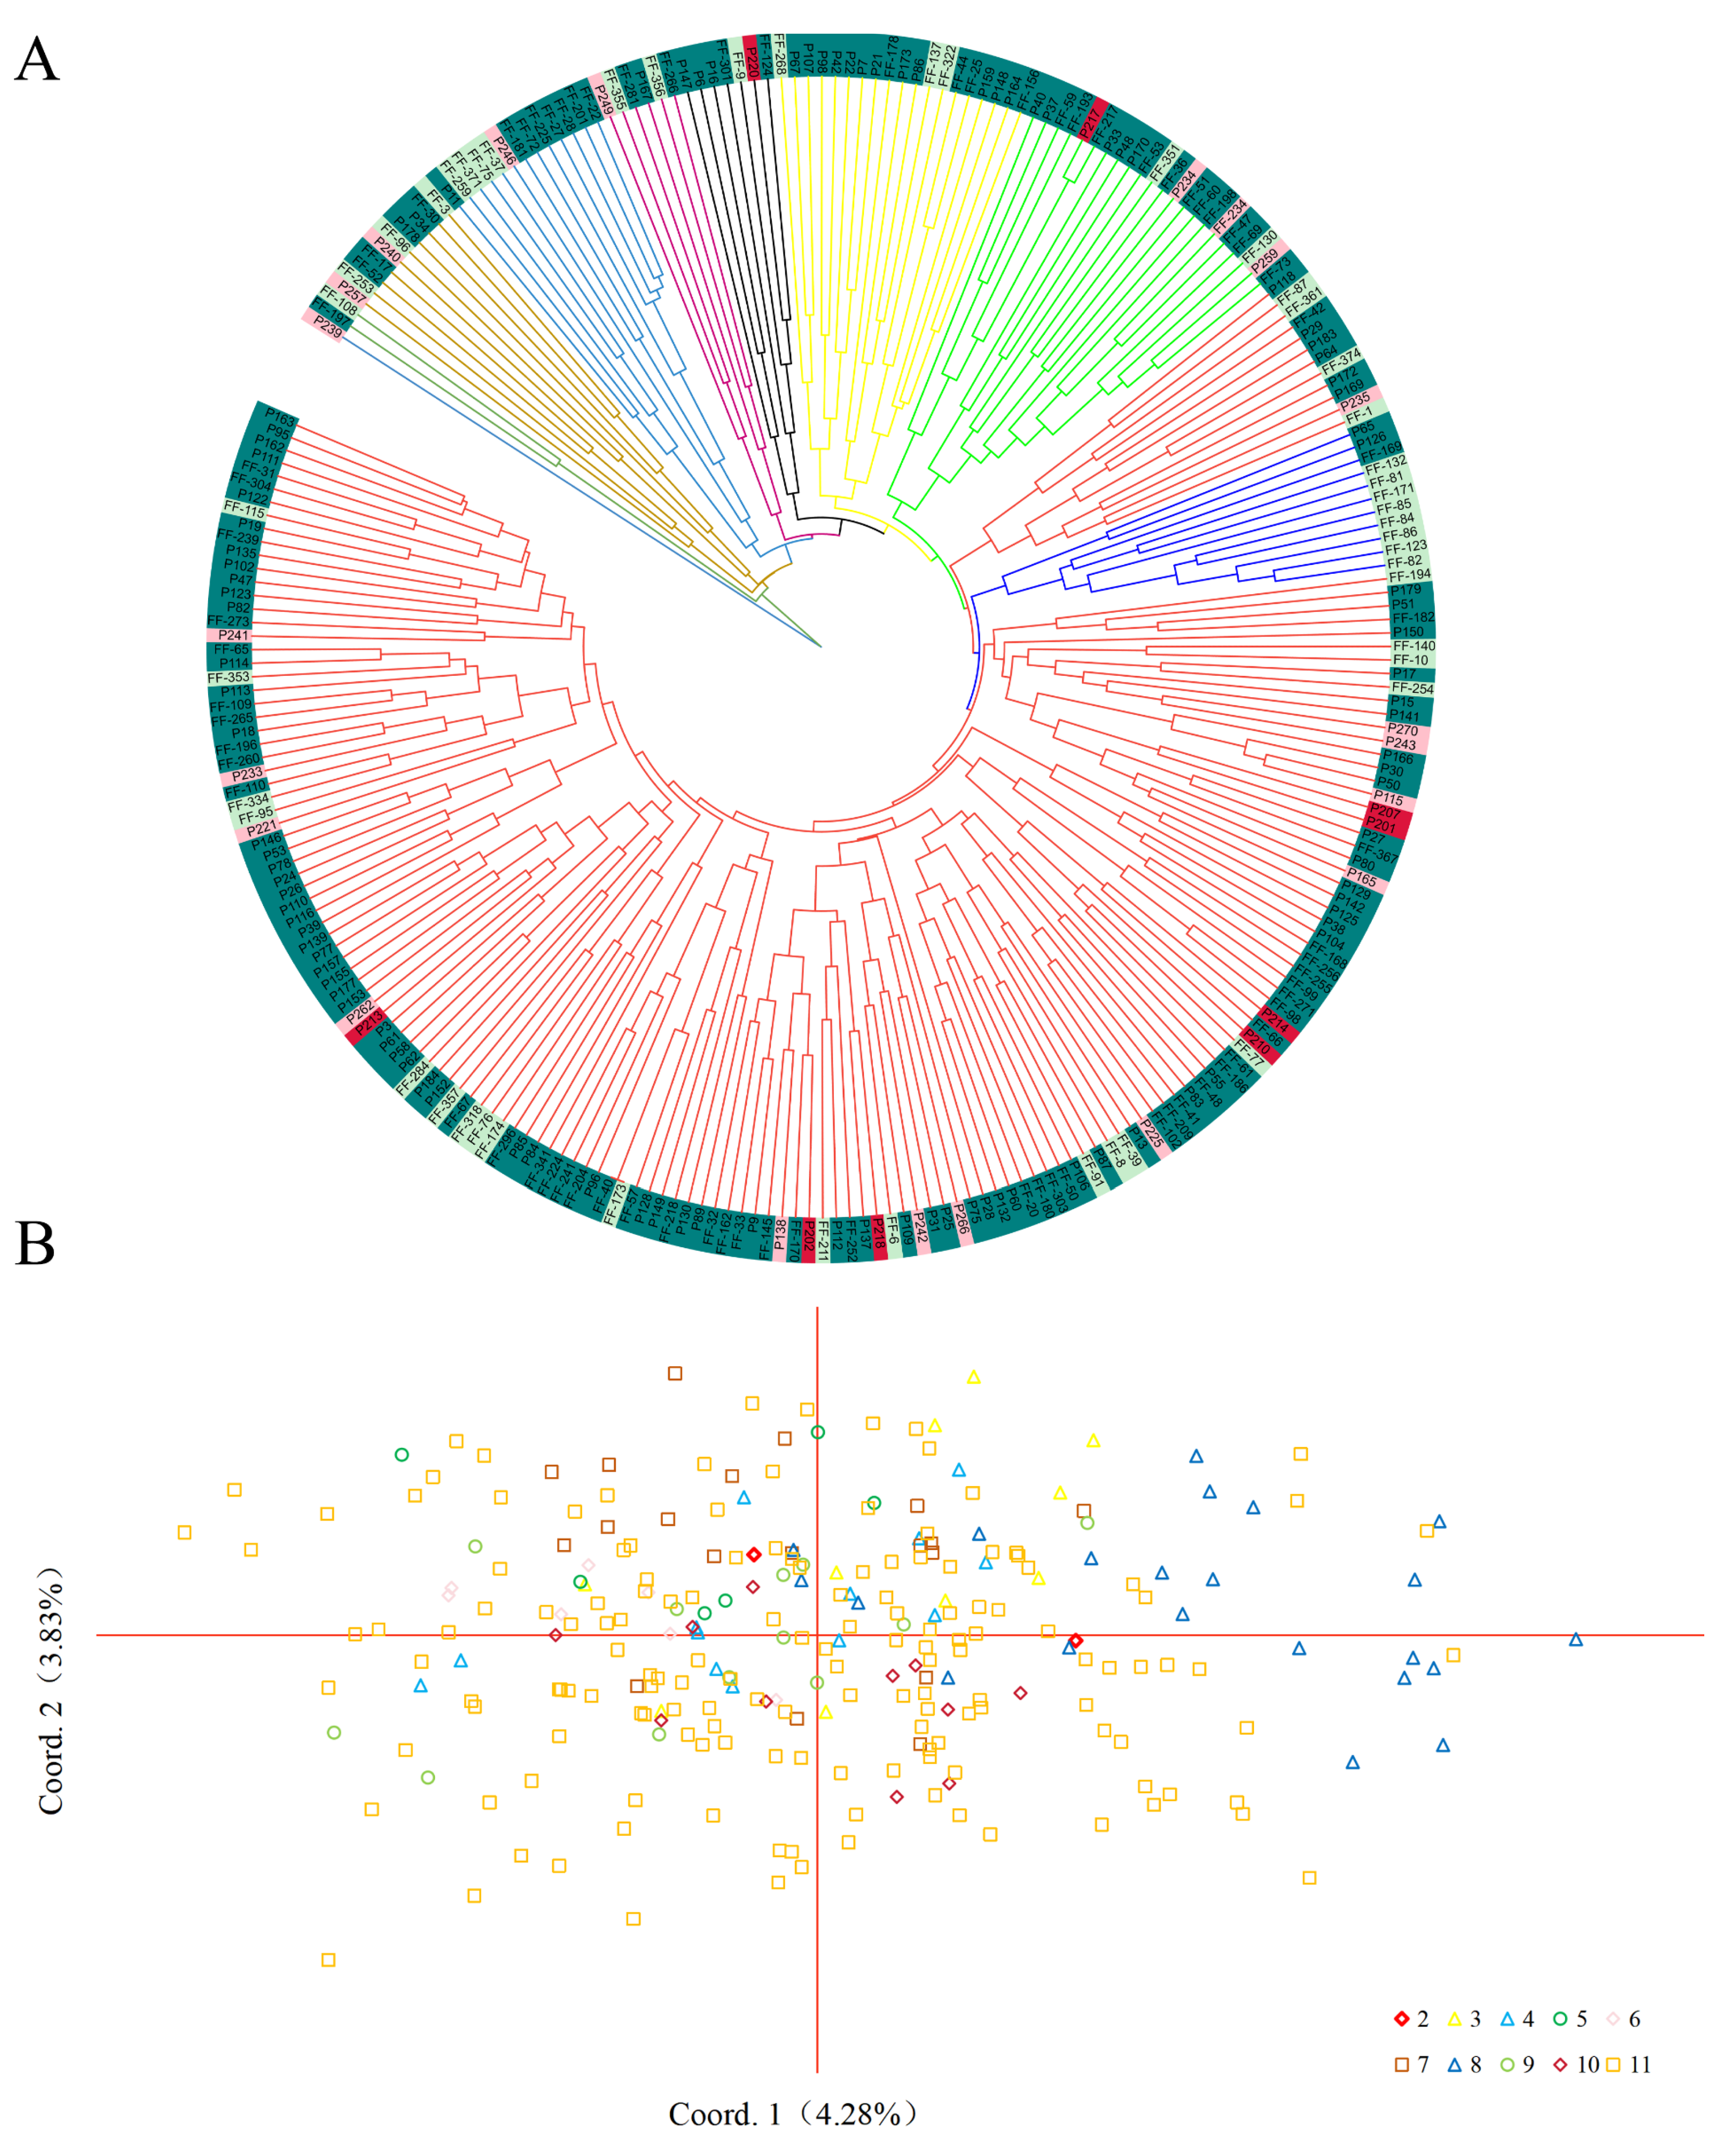
Figure 5: (A) UPGMA tree of 258 C. lanceolata accessions based on Nei’s genetic distances. Notes: red blocks represent 1st generation germplasm (9 accessions); pink blocks represent 2nd generation germplasm (21 accessions); green blocks represent 3rd generation germplasm (180 accessions); and cyan blocks represent 4th generation germplasm (48 accessions). (B) Principal Coordinate Analysis (PCoA) of C. lanceolata accessions based on SSR markers. Notes: Different colors and shapes denote distinct genetic groups (Groups 2–11) as defined by the clustering analysis.
AMOVA demonstrated that within-population variation accounted for 89% of the total genetic diversity, merely 11% partitioned among populations (Table 2), indicating that genetic diversity in C. lanceolata populations resided predominantly within populations. The studied populations exhibited weak genetic divergence and frequent gene flow (Nm = 2.216).
Table 2: Analysis of molecular variance (AMOVA) based on genetic distance-based population clustering.
| Source | df | SS | MS | Est. Var. | Genetic Variation Rate (%) |
|---|---|---|---|---|---|
| Among populations | 9 | 451.710 | 50.190 | 1.928 | 11% |
| Within populations | 247 | 4048.520 | 16.391 | 16.391 | 89% |
| Total | 256 | 4500.230 | 18.318 | 100% |
3.5 Genetic Diversity and Genetic Variation across Breeding Generations
Analysis of genetic diversity across the four generations of C. lanceolata breeding populations showed a moderate overall diversity, mean He = 0.665 (Table 3). Na increased from G1 to G3, peaked at G3 (Na = 10.000), and decreased marginally in G4 (Na = 7.955). The effective number of Ne was relatively stable across generations (mean = 3.766) and was consistently lower than Na for each generation, suggesting the presence of low-frequency alleles within the populations.
Table 3: Genetic diversity parameters in different generations of breeding populations based on SSR.
| Generations | Na | Ne | I | Ho | He | F |
|---|---|---|---|---|---|---|
| G1 | 5.273 | 3.641 | 1.368 | 0.552 | 0.673 | 0.145 |
| G2 | 6.091 | 3.805 | 1.418 | 0.608 | 0.692 | 0.104 |
| G3 | 10.000 | 3.989 | 1.449 | 0.537 | 0.658 | 0.147 |
| G4 | 7.955 | 3.627 | 1.374 | 0.534 | 0.638 | 0.120 |
| Mean | 7.330 | 3.766 | 1.403 | 0.558 | 0.665 | 0.129 |
AMOVA revealed that only 2% of the total genetic variation resided among populations, while 98% resided within populations (Table 4). Inter-generational genetic differentiation was remarkably low, and gene flow was extremely abundant Nm = 11.895.
Table 4: Analysis of molecular variance in different generations of C. lanceolata breeding populations.
| Source | df | SS | MS | Est. Var. | Genetic Variation Rate (%) |
|---|---|---|---|---|---|
| Among populations | 3 | 96.805 | 32.268 | 0.366 | 2% |
| Within populations | 254 | 4428.013 | 17.433 | 17.433 | 98% |
| Total | 257 | 4524.818 | 17.800 | 100% |
Pairwise genetic relatedness among the 11 inferred groups was quantified using Nei’s unbiased genetic distance (Fig. 6A). The genetic distances between groups ranged from 0.117 to 1.125, with the largest distance (1.125) observed between Group 1 and Group 2. Notably, the genetic distances between Group 1 and all other groups exceeded 0.600, indicating substantial genetic differentiation and distant genetic relatedness of Group 1 from the remaining groups, thereby highlighting its unique genetic background. Group 2 also exhibited a relatively high level of genetic differentiation, whereas the pairwise genetic distances among the other groups were generally low and relatively evenly distributed.
Based on SSR markers, pairwise fixation indices (FST) among the 11 groups were further calculated (Fig. 6B), with values ranging from 0.030 to 0.408. According to Wright’s [23] criterion, FST < 0.25 denotes low genetic differentiation. Our results showed that all FST values between Group 1 and the other groups exceeded 0.25, confirming extremely strong genetic differentiation between Group 1 and the rest. The FST values between Group 2 and other groups ranged from 0.150 to 0.196, corresponding to low-to-moderate genetic differentiation. For all other pairwise comparisons, FST values ranged from 0.030 to 0.104, indicating only weak genetic differentiation.
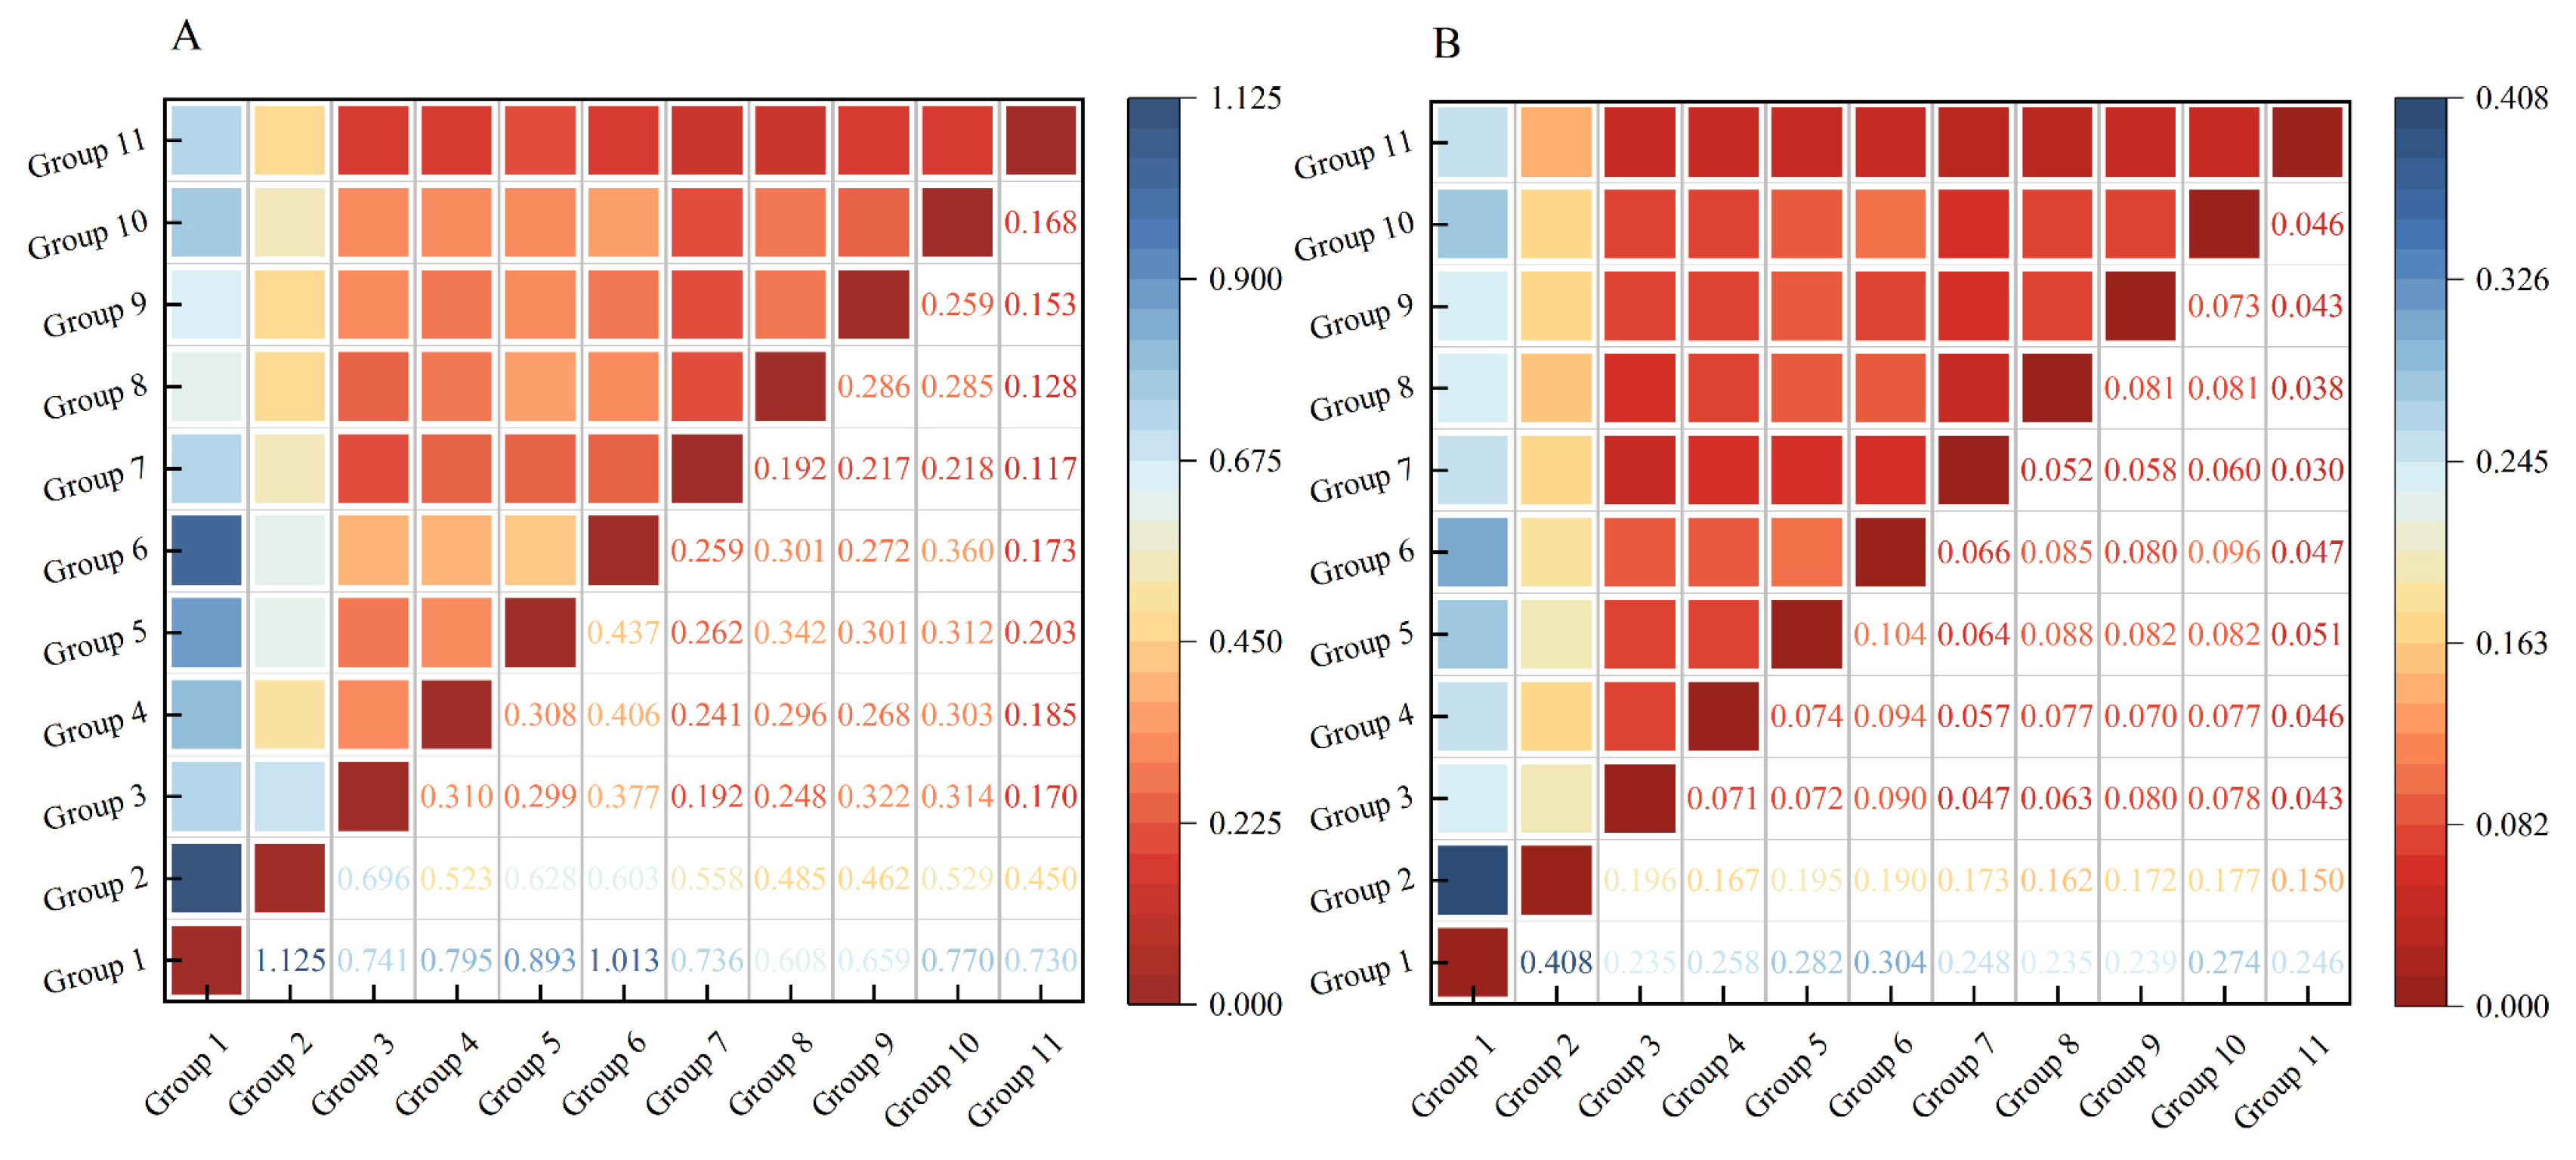
Figure 6: Genetic relatedness among the 11 groups of C. lanceolata: (A) Correlation of Nei’s genetic distances between groups. (B) Fixation index (FST) among groups.
This study identified 8011 SSR loci from the transcriptome sequencing data of 258 C. lanceolata accessions, corresponding to an SSR frequency of 10.86%. This frequency is higher than those reported for Korean pine (Pinus koraiensis, 4.24%) [24], slash pine (Pinus elliottii, 4.80%) [25], and Casuarina (Casuarina equisetifolia, 8.7%) [26]. Interspecific variation in SSR frequency distribution is likely correlated with genome size, repetitive sequence amplification efficiency, and inherent genomic nucleotide composition C. lanceolata genome contains abundant simple sequence repeat (SSR) loci with substantial heterogeneity among distinct nucleotide repeat classes [27]. Mononucleotide repeats predominate, occupying 65.85% of all SSRs; this proportion is comparable to the 67.49% mononucleotide content documented in C. lanceolata (Iron-Heart) by Liu et al. [28]. Dinucleotide and trinucleotide repeats rank second and third, accounting for 17.05% and 15.22%, respectively, and overall SSR abundance declines with increasing motif length. In total, 104 unique repeat motifs were detected within the C. lanceolata genomic SSR pool, among which hexanucleotide motifs exhibited the highest motif diversity, whereas mononucleotide motifs showed the lowest diversity. The A/T mononucleotide motif was overwhelmingly prevalent, while C/G motifs occurred at a much lower frequency, revealing a strong base composition bias. The comprehensive SSR landscape characterized herein lays a solid empirical basis for downstream primer design, genetic diversity assessment, and marker-assisted breeding of C. lanceolata.
Genetic diversity underpins species adaptation to environmental change and long-term survival, and thus constitutes a critical resource for breeding and genetic improvement [29,30]. In this study, 22 polymorphic SSR markers were employed to assess the genetic diversity of 258 C. lanceolata accessions. The mean observed heterozygosity (Ho = 0.543), expected heterozygosity (He = 0.668), and Shannon’s information index (I = 1.477) collectively indicated a high level of genetic diversity, reflecting a broad genetic base within this breeding population. These values are in agreement with a previous RAD-seq-based assessment of the fourth-generation population, jointly confirming that high genetic diversity has been maintained despite intensive selection [31]. Comparative analysis with earlier generations revealed superior diversity metrics in the current cohort: Leng et al. [32] reported mean Ho = 0.486, He = 0.511, and I = 0.925 for a second-generation seed orchard, whereas Zhang et al. documented Ho = 0.541 and He = 0.630 across three generations in Hunan [33]. Notably, the He (0.668) and I (1.477) obtained in this study exceed both previous reports, indicating that prolonged multi-generation selection has not caused significant genetic erosion but has instead preserved or even enhanced genetic variation. However, across generations G1–G4, allelic (Na) increased initially then declined: Na rose from G1 to G3 (peak 10.000) and fell to 7.955 at G4; He followed a similar trajectory. From G3 to G4, Na decreased by 20.5%, suggesting a mild genetic bottleneck effect during this selection stage. However, both Na remained higher than those in G1 and G2, indicating that the 4th-generation population still retains a relatively rich genetic foundation, which is consistent with the findings of this study on population genetic diversity. This observation is corroborated by the study of Li et al. [34] on two C. lanceolata seed bases in Youxian County (Hunan Province) and Lechang (Guangdong Province), where the average number of alleles decreased from 9.612 in F1 to 8.750 in F2, as well as by the reports of Xu et al. [35]. On different generations of C. lanceolata breeding populations. Notably, Ho was consistently lower than He across all generations, with heterozygote deficiency evident (F = 0.104–0.147), consistent with Hunan populations [33]. This likely reflects directional selection for superior traits, leading to allele fixation loss and reduced heterozygosity, with inbreeding and artificial selection across generations also contributing [36].
Population structure inferred by Structure analysis partitioned the 258 accessions into 11 groups, a configuration highly concordant with UPGMA clustering and PCoA ordination. Consistent outcomes from these three distinct analytical methods mutually verify the reliability of the resolved population genetic structure [37]. Marked disparities in sample size were observed among genetic clusters: Group 1 and Group 2 merely harbored 1 and 2 germplasm accessions, while Group 11 encompassed 155 individuals featuring extensive mixed provenance origins. Such uneven clustering distribution presumably arises from pervasive genetic admixture driven by prolonged artificial se-lection and frequent germplasm exchange in C. lanceolata. Successive parental replacement and intercrossing during recurrent multi-cycle breeding further promoted genetic homogenization of materials derived from geographically isolated regions within the same genetic cluster. This admixture pattern coincides with previous documentation of widespread genetic introgression in multiple forest tree species, including oak (Quercus chungii) [38] and Cultivated chestnut (Castanea sativa Mill) [39].
Analysis of molecular variance (AMOVA) based on grouping by different generations revealed that only 2% of the total genetic variation resided among populations, while 98% resided within populations. Similarly, AMOVA based on K = 11 genetic structure grouping showed that 11% of the variation was partitioned among populations and 89% within populations. Both grouping strategies consistently indicated that the genetic variation of C. lanceolata is predominantly distributed within populations rather than among them. This pattern is underpinned by high gene flow (Nm = 2.216), which facilitates extensive interpopulation genetic exchange and effectively constrains population divergence—a hallmark of coniferous species wherein genetic diversity is predominantly retained intrapopulationally, this conclusion is robustly supported by convergent evidence from prior studies [37]. Yang et al. [40] (EST-SSR) documented 9.42% interpopulation variation across six geographic populations; Duan et al. [41] (700 clonal accessions from six southern provinces) found interpopulation variation to be as low as 1%; and analyses of ancient germplasm revealed 73.16% of variation localized within seed sources [42]. Collectively, these findings affirm that C. lanceolata maintains its genetic diversity at the local population level, with minimal genetic differentiation across its range.
Pairwise Nei’s genetic distances and fixation indices (FST) further quantified intergroup genetic relatedness among the 11 inferred genetic groups. Both parameters yielded consistent non-uniform genetic differentiation patterns, presenting a clear three-tiered genetic architecture rather than a continuous and homogeneous relatedness gradient. Specifically, Group 1 exhibited distinct genetic isolation, Group 2 dis-played moderate genetic differentiation, and the remaining nine groups clustered into a single genetically closely related assemblage. The maximum Nei’s genetic distance (1.125) and value (0.408) were observed between Group 1 and Group 2. Furthermore, all pairwise genetic distance and estimates between Group 1 and other groups were higher than those of all other group pairs, indicating substantial genetic divergence of Group 1 from the remaining groups in terms of evolutionary history and germplasm provenance. Group 2 functioned as an intermediate genetic cluster with a differentiation level be-tween Group 1 and the other groups. The remaining nine groups showed limited genetic differentiation, accompanied by high levels of ongoing gene flow across populations. This result is consistent with prior reports on multiple coniferous taxa, including Pinus strobus [43], and Pinus densiflora [44], a suite of species known to typically exhibit weak genetic structuring among natural populations. Further analyses revealed that Group 1 consisted exclusively of 2nd-generation germplasm, Group 2 comprised 3rd- and 4th-generation materials, and the remaining nine groups were predominantly com-posed of 3rd- and 4th-generation accessions. The generation-dependent germplasm distribution was highly congruent with the three-tiered genetic differentiation pattern identified via Nei’s genetic distance, demonstrating that breeding generation serves as a critical intrinsic factor shaping the genetic structure of the studied germplasm panel. This result is highly consistent with a previous study on multi-generation C. lanceolata breeding populations in Hunan Province by Zhang et al. [33], although extremely weak genetic differentiation was detected across different breeding generations (FST = 0.010–0.014), cumulative selection effects over successive breeding generations could exert persistent impacts on the modulation of population genetic structure.
In this study, 22 polymorphic and reproducible SSR markers, identified from transcriptome sequencing and public databases, were employed to assess the genetic diversity of 258 C. lanceolata accessions. Substantial genetic variation was detected within the sampled population. Structure analysis assigned the accessions to 11 groups, with Group 1 and group 2 containing the fewest individuals and Group 11 comprising the largest number and most diverse origins, a result corroborated by phylogenetic and PCoA clustering. AMOVA revealed that 89% of the total genetic variation was attributable to differences within populations, whereas 11% resided among populations. Genetic differentiation was highest in Group 1, intermediate in Group 2, and low among the remaining 9 groups, which exhibited high gene flow and close genetic relatedness. Collectively, these findings clarify the divergence patterns across breeding generations and reveal the genetic structure under a multigenerational conservation framework, providing a solid foundation for germplasm evaluation, diversity characterization, and marker assisted breeding in C. lanceolata.
Acknowledgement:
Funding Statement: This research was funded by the project “Mining Full-Sib Germplasm from the 4th-Generation Open-Pollinated Progeny of C. lanceolata Based on EST-SSR Markers” (No.2023R1052) from the Competitive Public-Benefit Research Grant, the 2020 Fujian Provincial Young Top-notch Talent of the Eagle Program, the “Characterization of Genetic Diversity and Population Structure in the 4th-Generation C. lanceolata Breeding Population via SSR Markers” (No.2023J05058) from 2023 Provincial Natural Science Foundation Grant, and the “Research and Application of Chinese 4th-Generation Breeding” (ZMGG-0801) of Fujian Forestry Seedling Science and Technology Tackling Project.
Author Contributions: The authors confirm contribution to the paper as follows: Conceptualization: Renhua Zheng and Shunde Su. Methodology: Ziyi Wang, Liming Zhu and Zezhong Lin. Software: Ziyi Wang and Yuting Wei. Validation: Ziyi Wang and LingYe. Formal analysis: Ziyi Wang and Liming Bian. Investigation: Long Zhang, Xiaoli Jiang, Biaoqiang Zhang and YuchengXu. Resources: Renhua Zheng, Shunde Su and Hui Xiao. Writing—original draft preparation: Ziyi Wang. Writing—review and editing: Ziyi Wang, Renhua Zheng and Shunde Su. Visualization: Yuhan Zhang and Liming Zhu. Supervision: Linfeng Yu and Hui Xiao. Project administration: Linfeng Yu, Hui Xiao, Renhua Zheng, Ling Ye, Youcheng Xu and Shunde Su. Funding acquisition: Renhua Zheng and Shunde Su. All authors reviewed and approved the final version of the manuscript.
Availability of Data and Materials: The data that support the findings of this study are available from the Corresponding Authors upon reasonable request. The original data generated by this research analysis has been submitted to the (National Genomics Data Center) NGDC. The submission number is subCRA078513.
Ethics Approval: Not applicable.
Conflicts of Interest: The authors declare no conflicts of interest.
Supplementary Materials: The supplementary material is available online at https://www.techscience.com/doi/10.32604/phyton.2026.089247/s1. Table S1: Transcriptome sequencing data information; Table S2: Distribution characteristics of SSR repeat motif types; Table S3: Sequence information of the 22 SSR primers.
References
1. Da TB , Ha LTN . A review of Cunninghamia lanceolata (Lamb.) hook: a recent update and potential application in Vietnam. Vietnam J Agric Sci. 2021; 3( 4): 892– 902. doi:10.31817/vjas.2020.3.4.12. [Google Scholar] [CrossRef]
2. Li Y , Li C , Song Y , Guo Y , Yao L . Anatomical, physical, and mechanical parameters of clone plantation tree, Cunninghamia lanceolata. BioResources. 2021; 16( 2): 3494– 519. doi:10.15376/biores.16.2.3494-3519. [Google Scholar] [CrossRef]
3. Wu H , Duan A , Wang X , Chen Z , Zhang X , He G , et al. Construction of a core collection of germplasms from Chinese fir seed orchards. Forests. 2023; 14( 2): 305. doi:10.3390/f14020305. [Google Scholar] [CrossRef]
4. Zhou B , Peng D , Zhao Q , Yangnan S , Yang S , Yang F , et al. Improvements in timber production of Chinese fir (Cunninghamia lanceolata) per unit forest area in China via tree breeding: status and challenges. Dendrobiology. 2020; 83: 43– 51. doi:10.12657/denbio.083.004. [Google Scholar] [CrossRef]
5. Zheng H , Duan H , Hu D , Wei R , Li Y . Sequence-related amplified polymorphism primer screening on Chinese fir (Cunninghamia lanceolata (Lamb.) Hook). J For Res. 2015; 26( 1): 101– 6. doi:10.1007/s11676-015-0025-0. [Google Scholar] [CrossRef]
6. Filippi CV , Aguirre N , Rivas JG , Zubrzycki J , Puebla A , Cordes D , et al. Population structure and genetic diversity characterization of a sunflower association mapping population using SSR and SNP markers. BMC Plant Biol. 2015; 15( 1): 52. doi:10.1186/s12870-014-0360-x. [Google Scholar] [CrossRef]
7. Yan J , Zheng B , Wang S , Xu W , Qian M , Ma X , et al. Genetic diversity and fingerprinting of 231 mango germplasm using genome SSR markers. Int J Mol Sci. 2024; 25( 24): 13625. doi:10.3390/ijms252413625. [Google Scholar] [CrossRef]
8. Yuan H , Niu S , El-Kassaby YA , Li Y , Li W . Simple genetic distance-optimized field deployments for clonal seed orchards based on microsatellite markers: as a case of Chinese pine seed orchard. PLoS One. 2016; 11( 6): e0157646. doi:10.1371/journal.pone.0157646. [Google Scholar] [CrossRef]
9. Arif IA , Bakir MA , Khan HA , Al Farhan AH , Al Homaidan AA , Bahkali AH , et al. A brief review of molecular techniques to assess plant diversity. Int J Mol Sci. 2010; 11( 5): 2079– 96. doi:10.3390/ijms11052079. [Google Scholar] [CrossRef]
10. Choudhury DR , Kumar R , Maurya A , Semwal DP , Rathi RS , Gautam RK , et al. SSR and SNP marker-based investigation of Indian rice landraces in relation to their genetic diversity, population structure, and geographical isolation. Agriculture. 2023; 13( 4): 823. doi:10.3390/agriculture13040823. [Google Scholar] [CrossRef]
11. Yang Q , Dai J , He L , Qiu Y , Zhang N , Hua K , et al. Research on genetic diversity and mating patterns of Toona fargesii populations based on SSR markers. BMC Plant Biol. 2026; 26( 1): 399. doi:10.1186/s12870-026-08157-x. [Google Scholar] [CrossRef]
12. Zhang C , Lin P , Yao X , Ren H , Wang K . Genome-wide development of genomic SSR markers, polymorphism analysis, and dosage-aware SSR fingerprinting in hexaploid Camellia Oleifera. BMC Plant Biol. 2025; 25( 1): 1627. doi:10.1186/s12870-025-07601-8. [Google Scholar] [CrossRef]
13. Yan H , Qi H , Li Y , Wu Y , Wang Y , Chen J , et al. Assessment of the genetic relationship and population structure in oil-tea Camellia Species using simple sequence repeat (SSR) markers. Genes. 2022; 13( 11): 2162. doi:10.3390/genes13112162. [Google Scholar] [CrossRef]
14. Lu H , Liang X , Wang J , Xiong T , Xu ZF , Bai T , et al. Genetic diversity, core collection construction and genotype–environment associations of Eucalyptus cloeziana germplasm based on EST-SSR markers. Eur J For Res. 2025; 144( 5): 1003– 21. doi:10.1007/s10342-025-01792-3. [Google Scholar] [CrossRef]
15. Pu G , Zhou L , Xiang Q , Ma Y . Genetic diversity and genetic relationship of Jatropha curcas L. in Sichuan and Yunnan evaluated by cpSSR markers. China J Chin Mater Medica. 2012; 37( 1): 23– 31. doi:10.4268/cjcmm20120106. [Google Scholar] [CrossRef]
16. Wu H , Duan A , Wang X , Chen Z , Zhang X , He G , et al. Effects of generation improvement of Cunninghamia lanceolata (Lamb.) Hook on genetic diversity and genetic structure in seed orchards. Ind Crops Prod. 2026; 239: 122455. doi:10.1016/j.indcrop.2025.122455. [Google Scholar] [CrossRef]
17. Tian Y , Ma P , Wang L , Song B , Yang J , Qian D , et al. Integrated dual-molecular marker analysis with SSR and UPLC-Q-TOF/MS fingerprints technology reveal the interrelation of the molecule-metabolite in Morus alba L. leaves. J Pharm Biomed Anal. 2026; 272: 117359. doi:10.1016/j.jpba.2026.117359. [Google Scholar] [CrossRef]
18. Zeng W , Su Y , Huang R , Hu D , Huang S , Zheng H . Insight into the complex genetic relationship of Chinese fir (Cunninghamia lanceolata (Lamb.) Hook.) advanced parent trees based on SSR and SNP datasets. Forests. 2023; 14( 2): 347. doi:10.3390/f14020347. [Google Scholar] [CrossRef]
19. Peakall R , Smouse PE . GenAlEx 6.5: genetic analysis in Excel. Population genetic software for teaching and research—an update. Bioinformatics. 2012; 28( 19): 2537– 9. doi:10.1093/bioinformatics/bts460. [Google Scholar] [CrossRef]
20. Liu K , Muse SV . PowerMarker: an integrated analysis environment for genetic marker analysis. Bioinformatics. 2005; 21( 9): 2128– 9. doi:10.1093/bioinformatics/bti282. [Google Scholar] [CrossRef]
21. Evanno G , Regnaut S , Goudet J . Detecting the number of clusters of individuals using the software STRUCTURE: a simulation study. Mol Ecol. 2005; 14( 8): 2611– 20. doi:10.1111/j.1365-294x.2005.02553.x. [Google Scholar] [CrossRef]
22. Tamura K , Stecher G , Kumar S . MEGA11: molecular evolutionary genetics analysis version 11. Mol Biol Evol. 2021; 38( 7): 3022– 7. doi:10.1093/molbev/msab120. [Google Scholar] [CrossRef]
23. Wright S . The interpretation of population structure by f-statistics with special regard to systems of mating. Evolution. 1965; 19( 3): 395– 420. doi:10.1111/j.1558-5646.1965.tb01731.x. [Google Scholar] [CrossRef]
24. Du J , Zhang Z , Zhang H , Tang J . EST–SSR marker development and transcriptome sequencing analysis of different tissues of Korean pine (Pinus koraiensis Sieb. et Zucc.). Biotechnol Biotechnol Equip. 2017; 31( 4): 679– 89. doi:10.1080/13102818.2017.1331755. [Google Scholar] [CrossRef]
25. Yi M , Zhang L , Lei L , Cheng Z , Sun S , Lai M . Analysis of SSR information in transcriptome and development of EST-SSR molecular markers in Pinus elliottii Engelm. J Nanjing For Univ Nat Sci Ed. 2020; 44( 2): 75– 83. doi:10.3969/j.issn.1000-2006.201907017. [Google Scholar] [CrossRef]
26. Li N , Zheng YQ , Ding HM , Li HP , Peng HZ , Jiang B , et al. Development and validation of SSR markers based on transcriptome sequencing of Casuarina equisetifolia. Trees. 2018; 32( 1): 41– 9. doi:10.1007/s00468-017-1607-6. [Google Scholar] [CrossRef]
27. Lin E , Zhuang H , Yu J , Liu X , Huang H , Zhu M , et al. Genome survey of Chinese fir (Cunninghamia lanceolata): identification of genomic SSRs and demonstration of their utility in genetic diversity analysis. Sci Rep. 2020; 10: 4698. doi:10.1038/s41598-020-61611-0. [Google Scholar] [CrossRef]
28. Liu S , He G , Xie G , Gong Y , Zhu N , Xiao C . De novo assembly of Iron-Heart Cunninghamia lanceolata transcriptome and EST-SSR marker development for genetic diversity analysis. PLoS One. 2023; 18( 11): e0293245. doi:10.1371/journal.pone.0293245. [Google Scholar] [CrossRef]
29. Gaudeul M , Taberlet P , Till-Bottraud I . Genetic diversity in an endangered alpine plant, Eryngium alpinum L. (Apiaceae), inferred from amplified fragment length polymorphism markers. Mol Ecol. 2000; 9( 10): 1625– 37. doi:10.1046/j.1365-294x.2000.01063.x. [Google Scholar] [CrossRef]
30. Hellmann JJ , Pineda-Krch M . Constraints and reinforcement on adaptation under climate change: selection of genetically correlated traits. Biol Conserv. 2007; 137( 4): 599– 609. doi:10.1016/j.biocon.2007.03.018. [Google Scholar] [CrossRef]
31. Jing Y , Bian L , Zhang X , Zhao B , Zheng R , Su S , et al. Genetic diversity and structure of the 4th cycle breeding population of Chinese fir (Cunninghamia lanceolata (lamb.) hook). Front Plant Sci. 2023; 14: 1106615. doi:10.3389/fpls.2023.1106615. [Google Scholar] [CrossRef]
32. Leng CH , Lou YF , Xie SX , Zhu KF , Song XC , Xiao FM . Genetic diversity analysis of 2-generation seed orchard of Cunninghamia lanceolata based on phenotypic cone and seed traits and SSR marker. J Cent South Univ For Technol. 2024; 44( 4): 159– 68. doi:10.14067/j.cnki.1673-923x.2024.04.017. [Google Scholar] [CrossRef]
33. Zhang X , Wu HB , Cheng Y , Zhang CY , Wang X , Jiang HC , et al. The evaluation of the genetic diversity of breeding populations and construction of a core collection of Cunninghamia lanceolata. J Cent South Univ For Technol. 2024; 44( 9): 118– 26. doi:10.14067/j.cnki.1673-923x.2024.09.012. [Google Scholar] [CrossRef]
34. Li X , Wang LB , Wen YF , Lin J , Wu XT , Yuan ML , et al. Genetic diversity of Chinese fir (Cunninghamia lanceolata) breeding populations among different generations. Sci Silvae Sin. 2020; 56( 11): 53– 61. doi:10.11707/j.1001-7488.20201106. [Google Scholar] [CrossRef]
35. Xu KQ , Yu LH , Zhang HC , He P , Sun JJ , Li FQ , et al. Genetic diversity retrospective analysis and core collection construction for different generations of Cunninghamia lanceolata breeding population. J Cent South Univ For Technol. 2025; 45( 9): 39– 49. doi:10.14067/j.cnki.1673-923x.2025.09.005. [Google Scholar] [CrossRef]
36. Huang R , Zeng W , Deng H , Hu D , Wang R , Zheng H . Inbreeding in Chinese fir: insight into the rare self-fertilizing event from a genetic view. Genes. 2022; 13( 11): 2105. doi:10.3390/genes13112105. [Google Scholar] [CrossRef]
37. Yi M , Hu R , Huang W , Chen T , Xie W , Xie H , et al. Genetic diversity and population structure analysis of Pinus elliottii germplasm resources in Jiangxi Province. Life. 2024; 14( 11): 1401. doi:10.3390/life14111401. [Google Scholar] [CrossRef]
38. Jiang XL , Xu G , Deng M . Spatial genetic patterns and distribution dynamics of the rare oak Quercus chungii: implications for biodiversity conservation in southeast China. Forests. 2019; 10( 9): 821. doi:10.3390/f10090821. [Google Scholar] [CrossRef]
39. Bouffartigue C , Debille S , Fabreguettes O , Cabrer AR , Pereira-Lorenzo S , Flutre T , et al. Two main genetic clusters with high admixture between forest and cultivated chestnut (Castanea sativa Mill.) in France. Ann For Sci. 2020; 77( 3): 74. doi:10.1007/s13595-020-00982-w. [Google Scholar] [CrossRef]
40. Yang S , Bian L , Chen Z , Zheng R , Su S , Zhang L , et al. Development of EST-SSR markers and their use in assessing genetic diversity in Chinese fir infusion populations. Silvae Genet. 2025; 74( 1): 165– 77. doi:10.2478/sg-2025-0015. [Google Scholar] [CrossRef]
41. Duan H , Cao S , Zheng H , Hu D , Lin J , Cui B , et al. Genetic characterization of Chinese fir from six provinces in Southern China and construction of a core collection. Sci Rep. 2017; 7: 13814. doi:10.1038/s41598-017-13219-0. [Google Scholar] [CrossRef]
42. Li M , Chen X , Huang M , Wu P , Ma X . Genetic diversity and relationships of ancient Chinese fir (Cunninghamia lanceolata) genotypes revealed by sequence-related amplified polymorphism markers. Genet Resour Crop Evol. 2017; 64( 5): 1087– 99. doi:10.1007/s10722-016-0428-6. [Google Scholar] [CrossRef]
43. Mandák B , Hadincová V , Mahelka V , Wildová R . European invasion of North American Pinus strobus at large and fine scales: high genetic diversity and fine-scale genetic clustering over time in the adventive range. PLoS One. 2013; 8( 7): e68514. doi:10.1371/journal.pone.0068514. [Google Scholar] [CrossRef]
44. Iwaizumi MG , Tsuda Y , Ohtani M , Tsumura Y , Takahashi M . Recent distribution changes affect geographic clines in genetic diversity and structure of Pinus densiflora natural populations in Japan. For Ecol Manag. 2013; 304: 407– 16. doi:10.1016/j.foreco.2013.05.026. [Google Scholar] [CrossRef]
Cite This Article
 Copyright © 2026 The Author(s). Published by Tech Science Press.
This work is licensed under a Creative Commons Attribution 4.0 International License , which permits unrestricted use, distribution, and reproduction in any medium, provided the original work is properly cited.
 Downloads
 Citation Tools
