
 Submit a Paper
 Propose a Special lssue
 Open Access
ARTICLE
An Artificial Intelligence-Based Scheme for Structural Health Monitoring in CFRE Laminated Composite Plates under Spectrum Fatigue Loading
Department of Mechanical Engineering, Faculty of Engineering, Alexandria University, Alexandria, 21544, Egypt
* Corresponding Author: Wael A. Altabey. Email:
Structural Durability & Health Monitoring 2025, 19(5), 1145-1165. https://doi.org/10.32604/sdhm.2025.068922
Received 10 June 2025; Accepted 10 July 2025; Issue published 05 September 2025
 View Full Text
 Download PDF
Abstract
In the fabrication and monitoring of parts in composite structures, which are being used more and more in a variety of engineering applications, the prediction and fatigue failure detection in composite materials is a difficult problem. This difficulty arises from several factors, such as the lack of a comprehensive investigation of the fatigue failure phenomena, the lack of a well-defined fatigue damage theory used for fatigue damage prediction, and the inhomogeneity of composites because of their multiple internal borders. This study investigates the fatigue behavior of carbon fiber reinforced with epoxy (CFRE) laminated composite plates under spectrum loading utilizing a unique Deep Learning Network consisting of a convolutional neural network (CNN). The method includes establishing Finite Element Model (FEM) in a plate model under a spectrum fatigue loading. Then, a CNN is trained for fatigue behavior prediction. The training phase produces promising results, showing the model’s performance with 94.21% accuracy, 92.63% regression, and 91.55% F-score. To evaluate the model’s reliability, a comparison is made between fatigue data from the CNN and the FEM. It was found that the error band for this comparison is less than 0.3878 MPa, affirming the accuracy and reliability of the proposed technique. The proposed method results converge with available experimental results in the literature, thus, the study suggests the broad applicability of this method to other different composite structures.Graphic Abstract
Keywords
Recently, there has been a significant surge in composite materials, driven by their unique benefits. These materials offer improved damage tolerance capability, involving specific strength, stiffness, and fatigue resistance. The unique composite materials’ properties have led to their widespread application across various structural domains, such as automotive, aerospace, and marine industries. The growing utilization of composite materials highlights their adaptability and efficiency in meeting the demanding requirements of diverse structural applications.
The availability of an efficient Structural Health Monitoring (SHM) system is of paramount importance, particularly for structures where failure could lead to catastrophic loss of life. The key role of an SHM system is to continually detect structural state and assess safety, predict remaining life based on data from installed sensors, and detect damage in its early stages. This proactive approach purposes to prevent potential failures and avert catastrophic accidents [1]. Despite the several advantages associated with reliable SHM systems, numerous challenges hamper their implementation in the operating environment, particularly in the initial stages. Addressing these issues is critical because they often necessitate extensive computational efforts and continuing system maintenance. Researchers have widely discussed these issues in implementing SHM systems, as mentioned in the most current review paper by Hassani et al. [2]. This highlights the need for continued efforts to overcome difficulties and ensure the effective use of SHM systems in operational environments.
Lately, deep learning (DL) has emerged as the most promising method within the artificial intelligence realm and has garnered substantial attention [3]. An improvement in hardware performance has eased the application of DL models to address complex problems, ranging from semantic understanding and face recognition to big data classification. Over the last few years, various DL models have been developed, such as CNN [4], recurrent neural networks [5], and Generative Adversarial Networks [6]. These models show the adaptability and versatility of DL in addressing different challenges across various domains.
The damage identification-based conventional deep learning models need to provide a series of data as features for input to classify the SHM responses [7]. The features extracted are considered the main cause of the suitable detection of structural damage. The structural characteristics such as geometry, boundary conditions, and types of damage are considered the main reasons for extracting the sensitive features, which may change with time. Also, the other more sensitive features that affect the damage-sensitive are the operational and environmental effects of structures [8].
In addition, the complexity in the fatigue damage identification may be affected by uncertain sources when structures are affected by outside noise such as fatigue loading, environmental noise, and boundaries. This may be changed by the fatigue damage intensity, and sensors measuring signals, which hinders the fatigue damage identification. Therefore, artificial intelligence (AI) algorithms came to solve these problems such as a convolutional neural network (CNN),
Deep learning is really taking off, and CNN has become super popular for computer vision stuff [9]. Lately, a lot of researchers have been focusing on using CNN to spot damage in buildings and machines. For instance, Cha et al. [10] worked on crack detection using a cool mix of sliding window techniques and CNN. Then, Dorafshan et al. [11] kept a database of crack images from 2018 and used CNN to identify them. They even came up with a hybrid method that combines CNN with edge detection, and it seems to work better [12]. Ni et al. [13] took it a step further by using a CNN framework to automatically classify cracks in images down to the pixel level.
In recent years, the studies of structural dynamic analysis in literature have reported in a few applications including: using CNN for fatigue crack evaluation of a lap joint structure with the Guided Wave–Convolutional [14], predict structural seismic response [15], natural frequency prediction of basalt fiber reinforced polymer (BFRP) Variable Thickness Plates with Intermediate Elastic Support [16], fatigue crack identification for steel pipelines [17], predict structural seismic random responses [18] and carry out a probabilistic assessment based on DL’s dynamic response of the structure [19].
It is good to adopt an AI technique to investigate the fatigue behavior of composites. However, it should discuss the necessity of using AI for investigating fatigue behavior. Besides, for AI models, their complex structures and numerous parameters often make them challenging to interpret. This inherent difficulty in understanding the information and decisions generated by AI systems raises concerns regarding their reliability and trustworthiness, especially in critical applications. To address this limitation, interpretable Artificial Intelligence has been extensively studied [20,21].
With the continuous advancement of DL technology, CNN has been widely used in the SHM of composite structures [22–24]. Also, several other academics have attempted to extract apparent fatigue behavior from composite structures using CNN such as El-Kadi and Al-Assaf [25] employed strain energy as input for an artificial neural network (ANN) to forecast the fatigue life of glass fiber/epoxy (GFRE) composites. They compared the outcomes with those attained using inputs such as fiber orientation angle, maximum applied stress, and stress ratio in the ANN. Similarly, Choi et al. [26] investigated fatigue damage prediction in composite laminates has notches using an ANN. Their model was developed to characterize crack growth in notched AS4/3501-6 epoxy/graphite quasi-isotropic laminates under fatigue load with constant amplitude. These studies highlight the Anns’ versatility, particularly CNN, in capturing complex fatigue behaviors in composite materials.
There have been a bunch of studies showing how good ANN models can be. For example, Zhang and Friedrich [27] worked on using them to predict how fiber-reinforced polymer (FRP) and other materials behave under stress and fatigue. They found that with the right training and testing, these models fit the data pretty well. They even suggested stopping the learning process early if the model starts to make things worse, like if the validation error goes up after a certain point, and that we should minimize the weight biases. Then there’s the research by Jia and Davalos [28], where they looked at how stress ratios affect the fatigue in interfaces between phenolic FRP and red maple wood. They developed an ANN using various inputs like maximum and minimum strain energy release rates and loads. The output from their model was the crack-front spread rate, which showed just how adaptable ANNs can be in tackling complex fatigue issues. They used a multi-layer ANN with a hidden layer that had 25 neurons and found its predictions lined up really well with theoretical results. Another study by Vassilopoulos et al. [29] created an ANN to estimate how long multidirectional glass fiber reinforced polymer (GFRP) would last under different loading patterns like tension-tension and compression-compression. They showed that ANNs could effectively simulate fatigue life and confirmed their modeling accuracy. Their model included eight hidden neurons and took into account factors like fiber orientation and stress levels, with the output being the number of cycles to fatigue. This really shows how useful ANNs can be for predicting fatigue life in different situations.
So, it looks like the suggested neural networks matched up pretty well with the experimental results. Instead of the usual feed-forward type, Freire et al. [30] used two different kinds of Modular Neural Networks (MNN), with or without a gating network, to predict how fiberglass composites would hold up under stress. They set up both MNN versions using multilayered perceptrons, with one hidden layer. They played around with how many neurons were in that layer, ranging from 4 to 30, depending on the load on the material. The inputs for their network were the number of cycles until failure and the alternating stress, while the mean stress came out as the output. They showed that their MNN did a better job overall, especially the one that took the load into account. Then Bezazi et al. [31] put together a bunch of ANN structures using Bayesian training methods and maximum probability to predict the fatigue life of these GFRP laminated PVC foam core sandwich samples. They crafted an MLP structure, using the loading value and the cycle count until failure as the inputs, with the reduced force as the output. When they compared everything, it looked like there was a solid agreement between their ANN and what the experiments showed.
In the studies mentioned, the authors used neural networks to figure out how long FRP composites last, focusing on just one type of composite material. Some research looked into predicting how long materials would last based on either a specific composite or by using data from other types of laminates when fatigue data wasn’t available. El-Kadi [32] started this line of research, and then El-Kadi and Al-Assaf [33] trained a multi-layer neural network to predict the fatigue life across four different composite materials. They considered factors like strength, modulus, fiber orientation, and the stress applied. For their results, they looked at performance measures like mean square error (MSE) and mean absolute error (MAE), and found that the MAE for the Log (
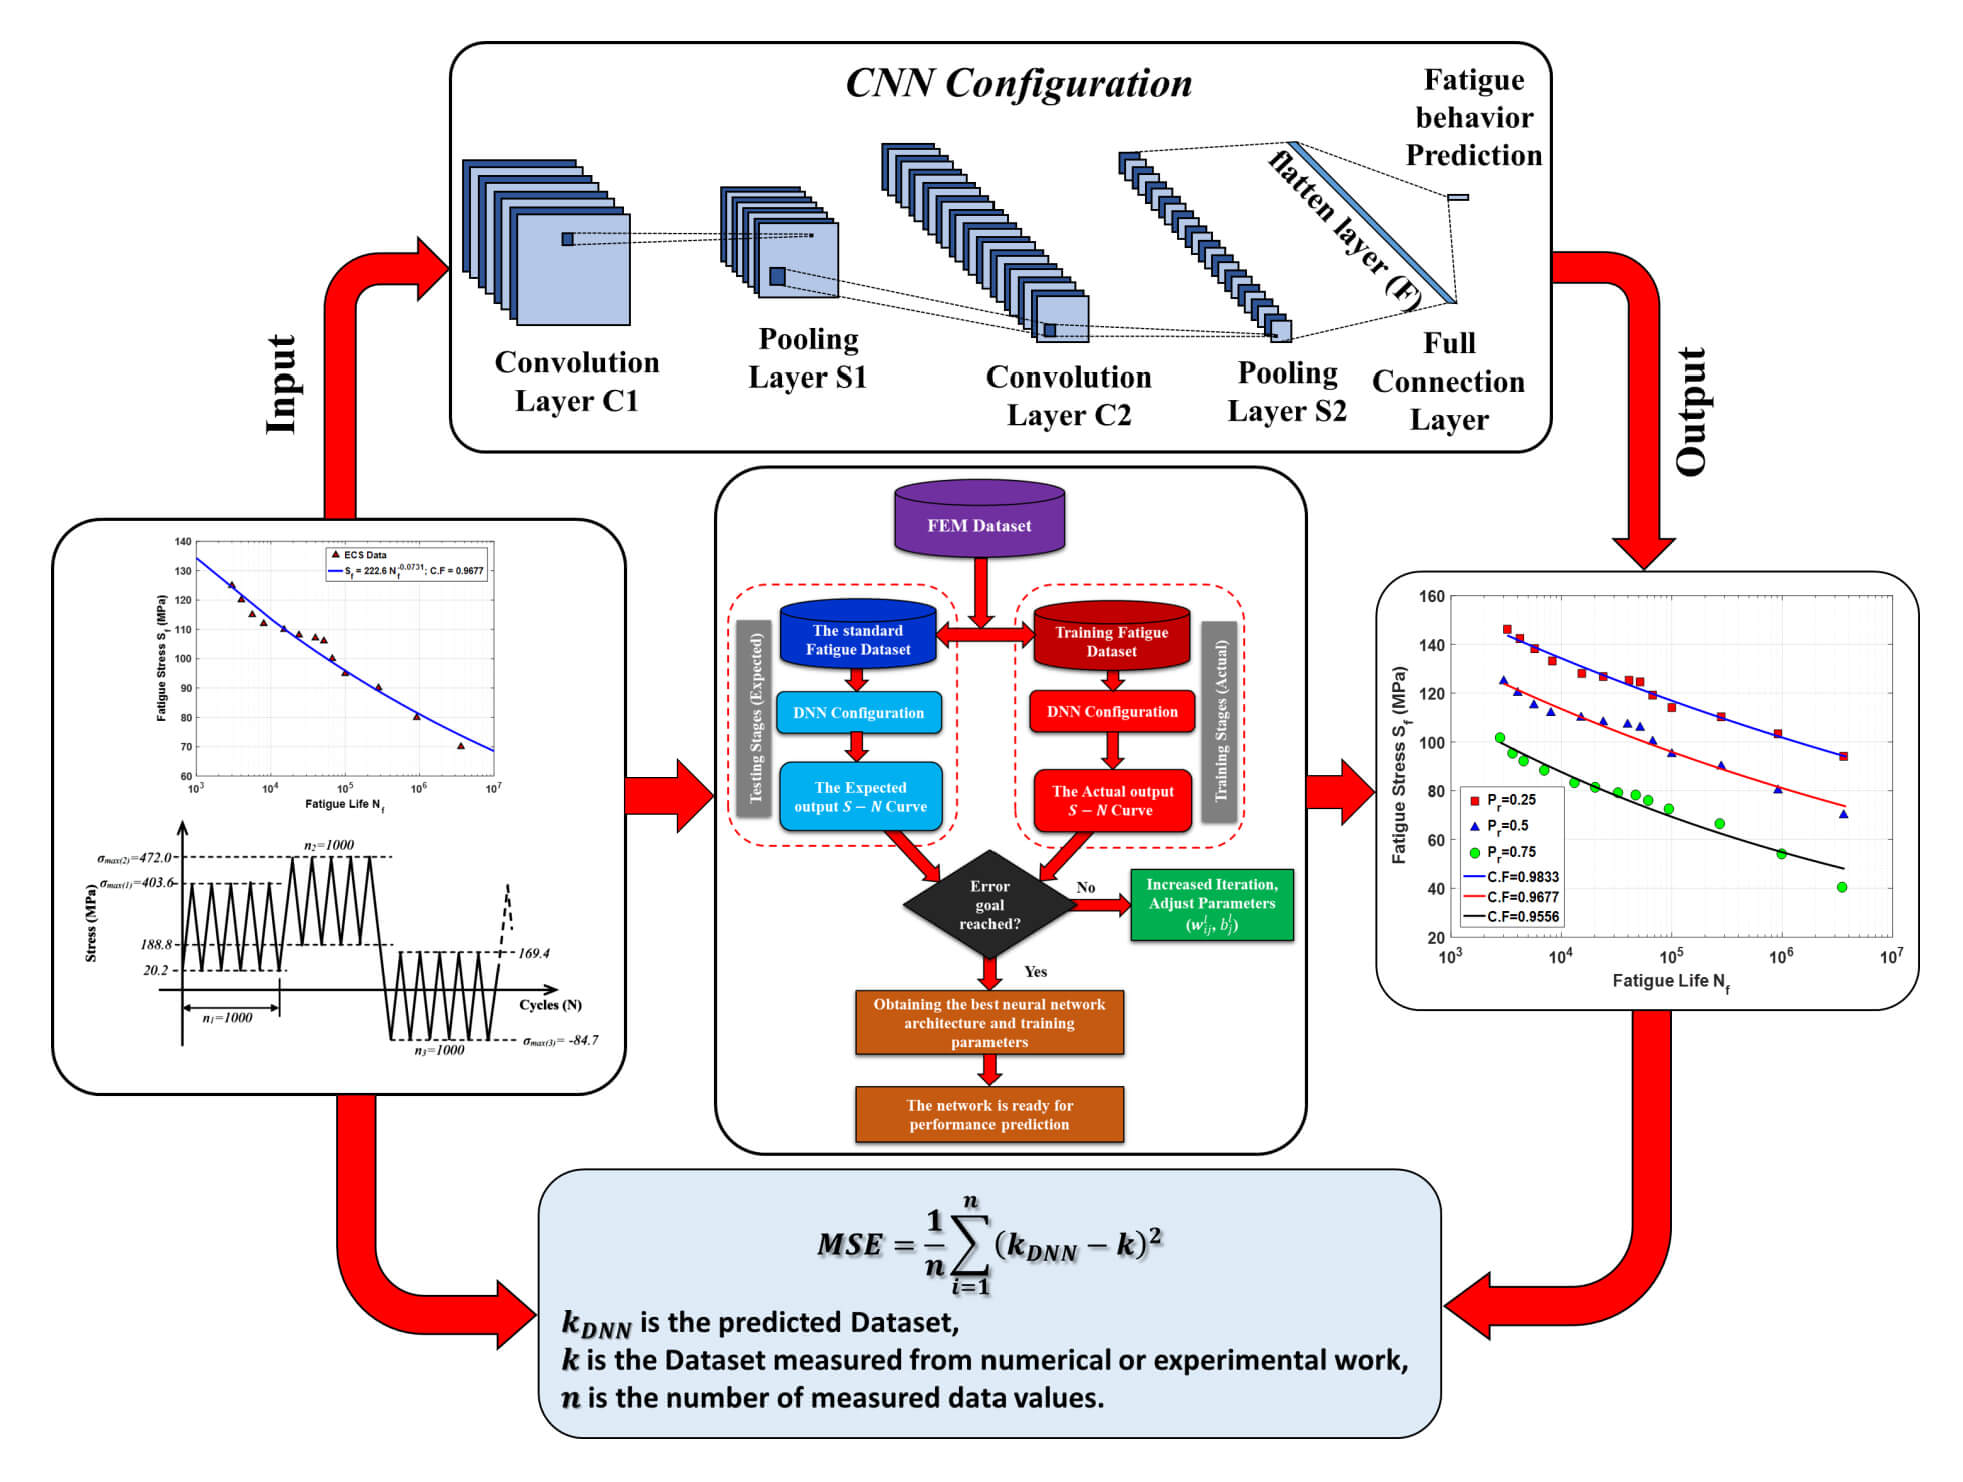
This research presents the CFRE composite plate fatigue behavior prediction under spectrum fatigue loading using a novel CNN group-based deep learning technique. The evaluation metrics of accuracy rate (
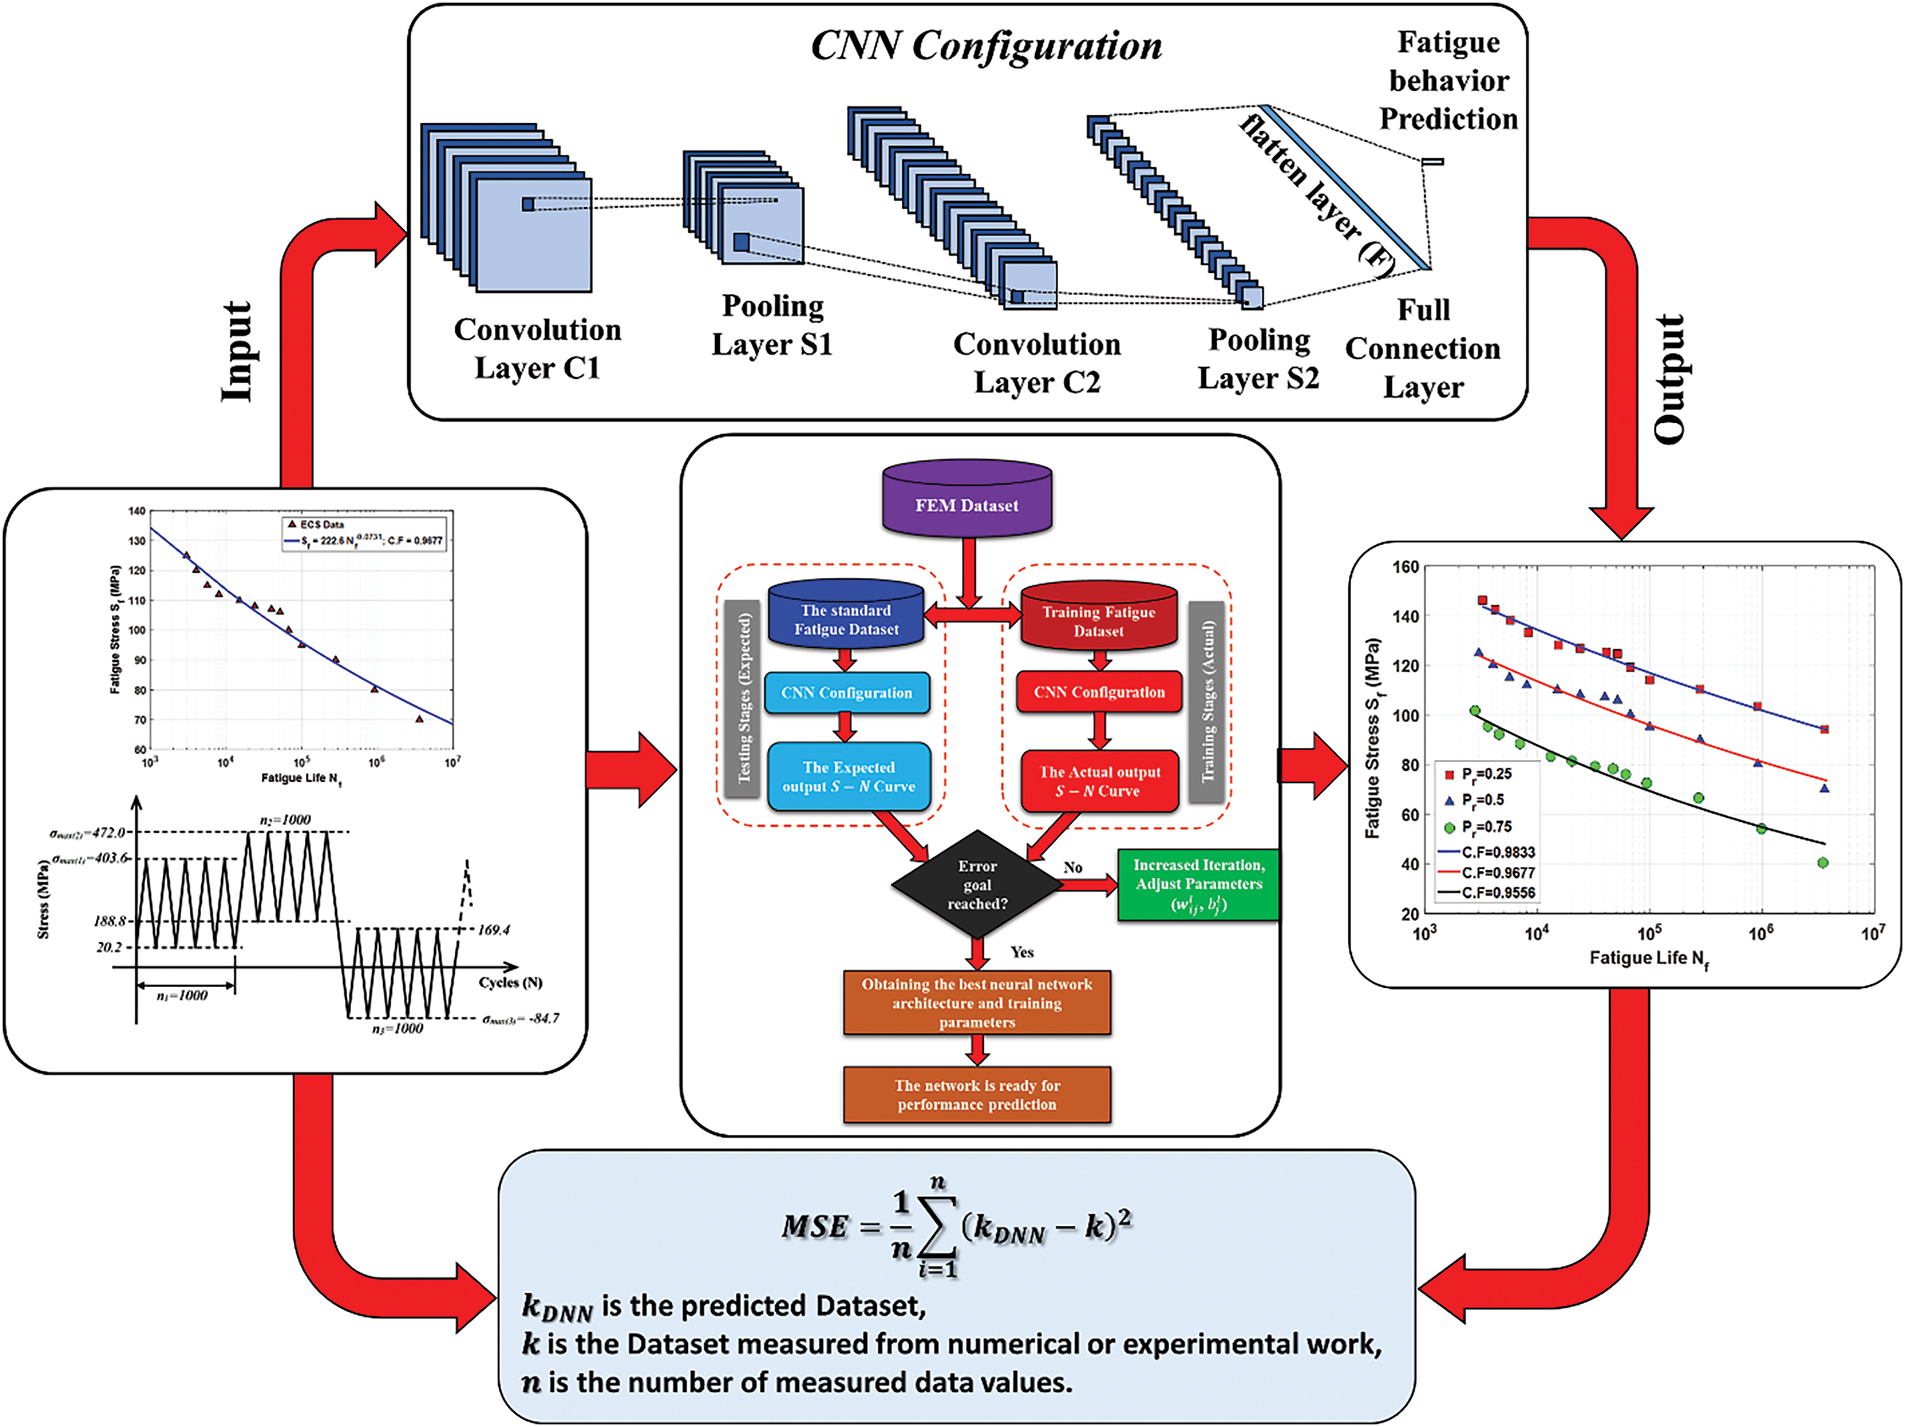
Figure 1: The proposed method block diagram
2.1 Fatigue Damage Mechanism for FRP Composite Laminates
Fig. 2 presents the damage behaviour during the fatigue cycles. As shown in the Figure, a three Regions in total must be happened until failure occurs from the first Region I of micro-cracks appear inside the matrix through Region II of developing the matrix cracks during increasing of the fatigue cycles until the fiber breakage occurs in the third region, and then the failure occurs due to the fatigue damage accumulation [34].
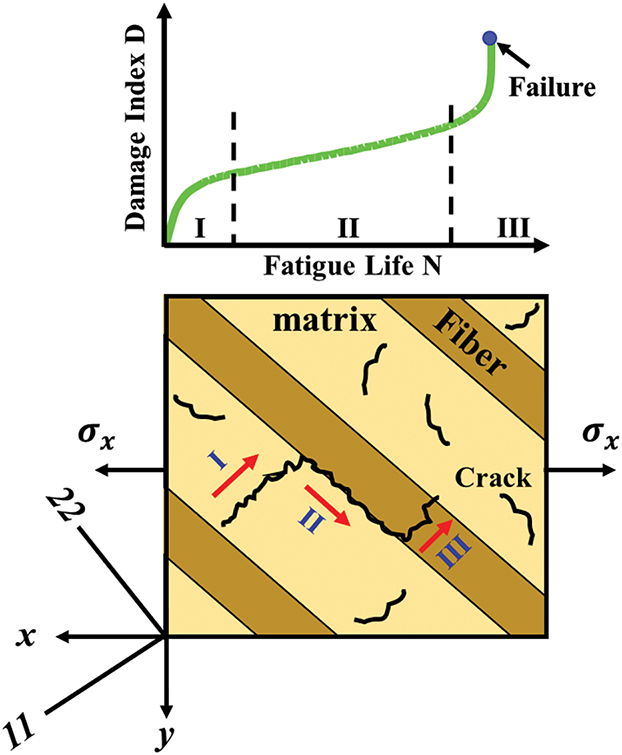
Figure 2: Crack progression mechanism in unidirectional composites
2.2 The CFRE Plate’s Material Model
The plate was fabricated utilizing three layers of CFRE arranged in a stacking sequence of
Figs. 3 and 4 depict the geometric model of the plate structure, showcasing fully fixed supports (CCCC) at each of the four ends, highlighted in blue. The element type is a rectangular 4-node, the total number of nodes and elements at each ply are 441 and 400, respectively.
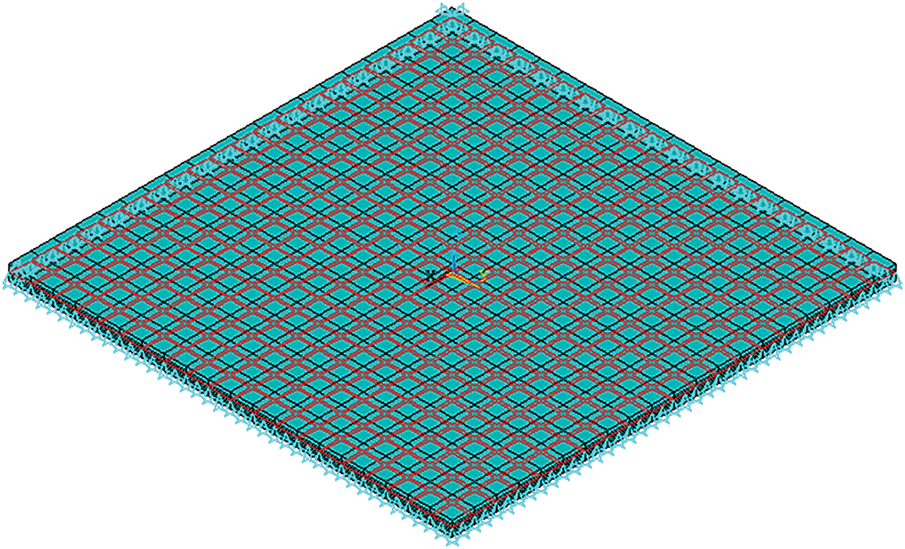
Figure 3: Boundary conditions
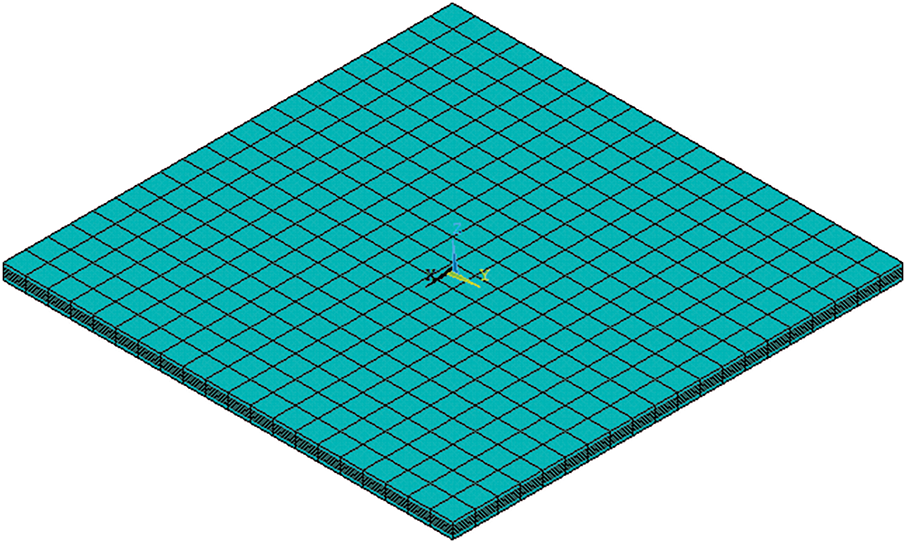
Figure 4: Finite element model
The plates are exposed to variable amplitude block loadings that are applied in the middle of the plate, usually known as spectrum loading, through a sequence of sequential block tests. Each test involved series blocks with varying positive and negative stress ratios
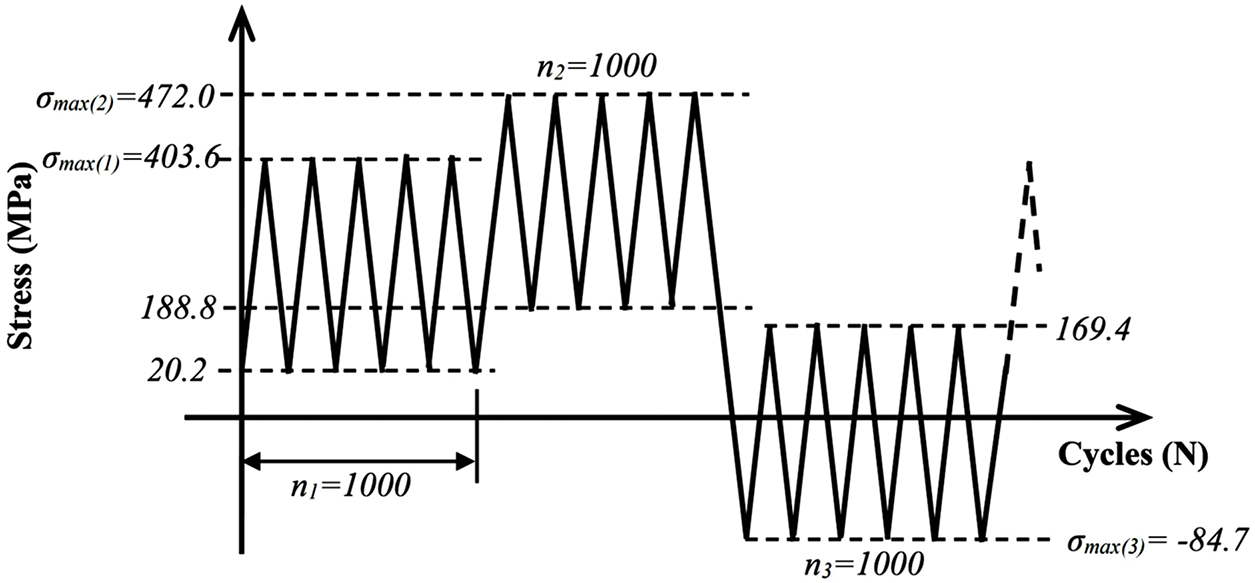
Figure 5: Schematic of loading spectrum as a function of cycles
The distribution of the Weibull probability density can be used for determining residual strength. Where
Also, the residual strength
where
The laminate composite plate was subjected to spectrum fatigue loading as shown in Figs. 5–7 show Von Mises stress and Displacement distributions, respectively. From the figure, we can see that the values of the maximum stress and displacement are
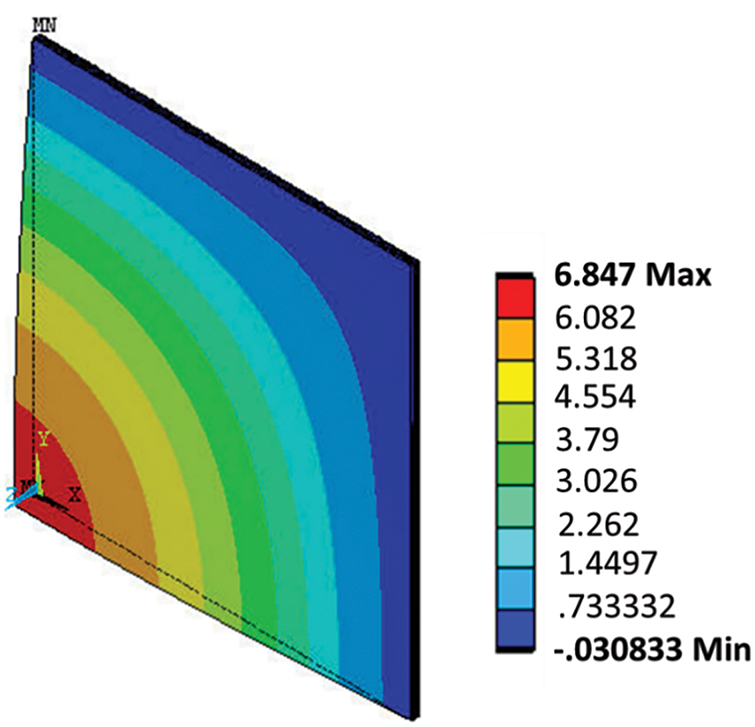
Figure 6: Z-component of displacement
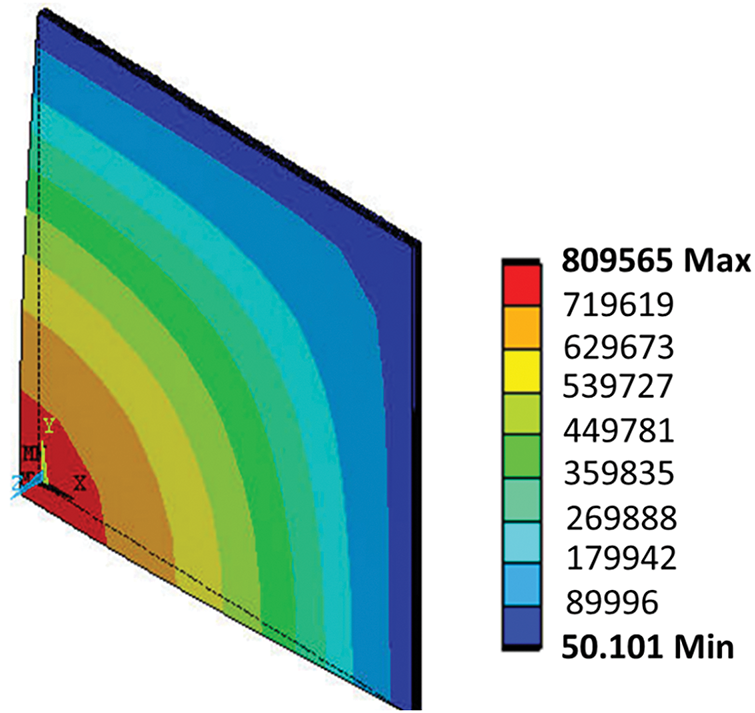
Figure 7: Von mises stress
2.4 The Fatigue Behavior of CFRE Composite Plate (S-N)
To obtain an S-N curve from FEM, its need to perform a series of fatigue simulations on a plate, varying the applied stress amplitude and recording the number of cycles to failure. These data points (stress amplitude vs. cycles to failure) are then plotted on a graph, often on a log-log scale, to generate the S-N curve. Here’s a more detailed breakdown:
Define the FE Model: Create a finite element model of the plate you’re analyzing. Then define the material properties, including Young’s modulus, Poisson’s ratio.
Define Fatigue Events: In your simulation software (ANSYS), set up a fatigue study under spectrum loading, and apply different load levels to the model in separate simulations. For each load level, define the corresponding stress amplitude.
Run Fatigue Simulations: Run a series of simulations, each with a different stress amplitude. The goal is to determine how many cycles the material can withstand before failure at each stress level. The ANSYS will calculate the stress distribution within the model for each load case and estimate the fatigue life (number of cycles to failure).
Extract and Plot Data: After each simulation, extract the number of cycles to failure at multiple locations in the model. Plot the extracted data points (stress amplitude vs. cycles to failure) on a graph. Typically, this is done on a log-log scale, as fatigue behavior often follows a power law relationship. The resulting curve represents the S-N curve for the material under the specific loading conditions.
Refine and Validate: You can refine the S-N curve by performing more simulations at intermediate stress levels. The S-N curve can be validated by comparing it with experimental data or with S-N curves from other sources.
The S-N curve of the relationship between the fatigue life
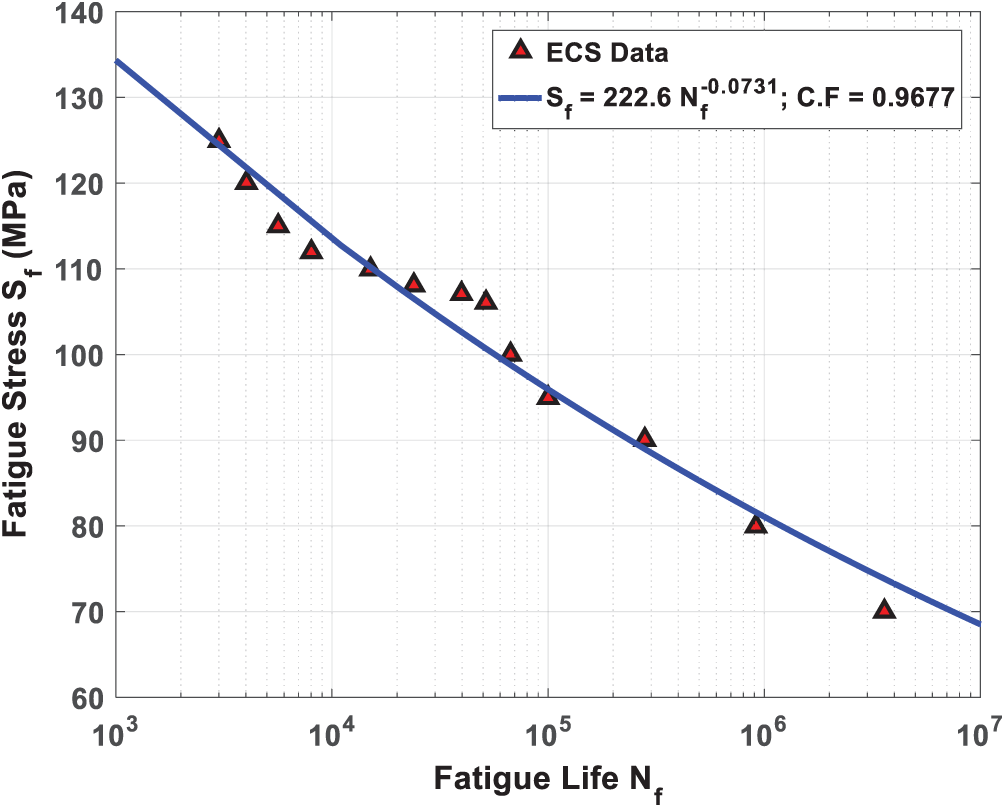
Figure 8: S-N curve of BFRP composite plate for stress ratio
The fatigue life response (S-N curve) of presented case study can be fitted as power formula
2.5 The Fatigue Damage Model D-N Curve for the Case Study Material
So, the fatigue damage models like the Philippidis Model and the Ramkrishnan-Jayaraman Model have a few general terms, but they kind of overlook the whole temperature thing. They mainly focus on two big areas: material and structure, and they also look at a few key factors like Young’s modulus
When we talk about composite materials, the damage index we come up with is often tied to failure criteria like Tsai-Wu and Hashin, which you can see in Table 1. These help predict when damage starts and how it spreads, and the damage index gives a number that shows how bad the damage.
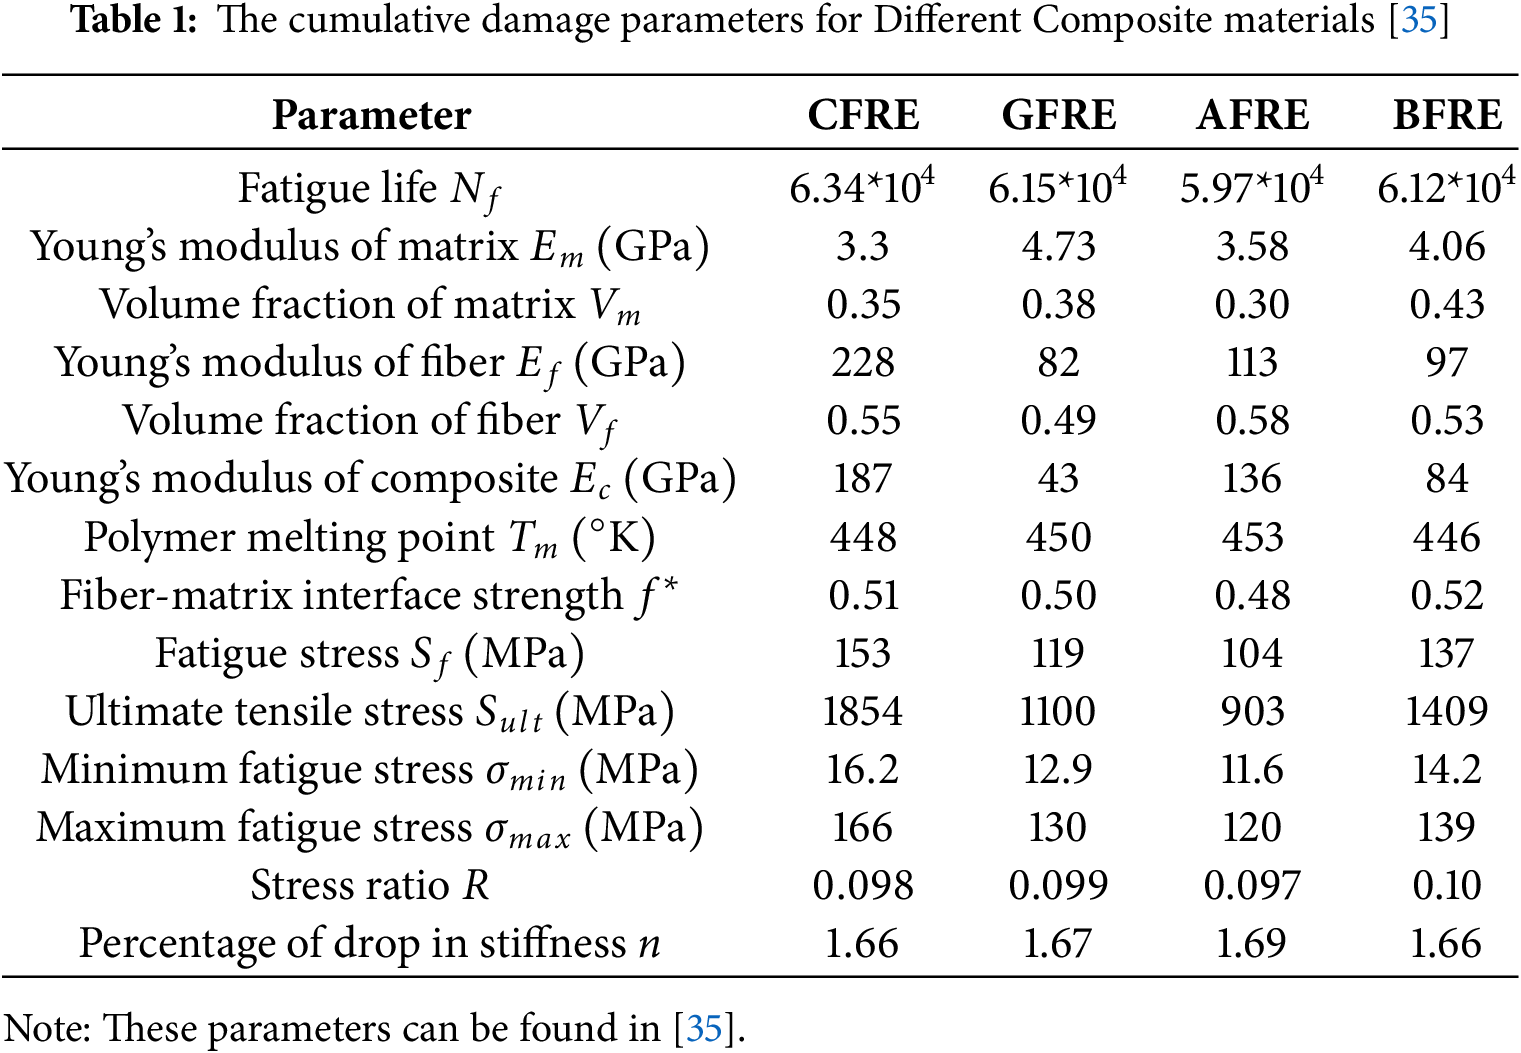
We figured out that three main factors—Young’s modulus of the composite
The parameters of the D-N curve for four different types of composite materials (CFRE, GFRE, AFRE, and BFRE) are presented in Table 1. The D-N curves of CFRE, GFRE, AFRE, and BFRE are plotted in Fig. 9, The cumulative fatigue damage index is suitable for the rule in the Formula (4) for the failure mode of the presented case study.
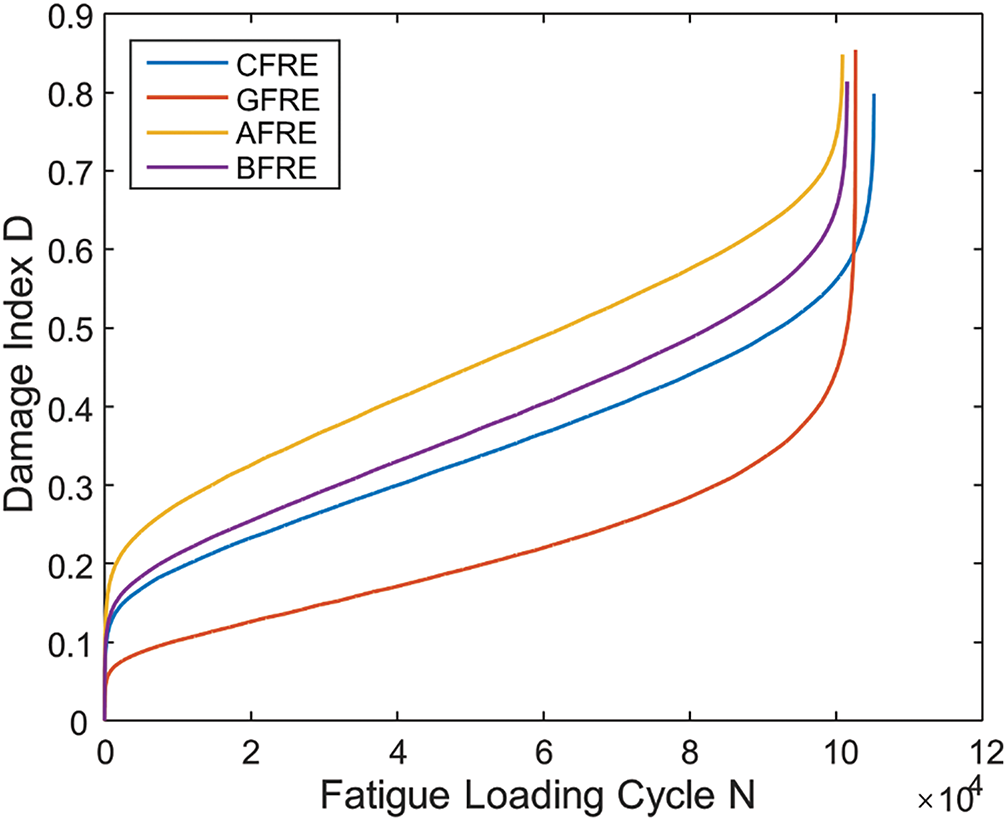
Figure 9: D-N curve for different materials (CFRE, GFRE, AFRE, and BFRE)
3 Convolutional Neural Network (CNN)
To build a CNN pattern that can forecast fatigue behavior from FEM datasets of the CFRE composite plate, a multilayer CNN is set up. To locate the promising CNN architecture, the network is systematically developed and trained to generalize the suggested CNN model. The structure of the suggested CNN layers in the current work is presented in Fig. 10 includes a convolution layer (
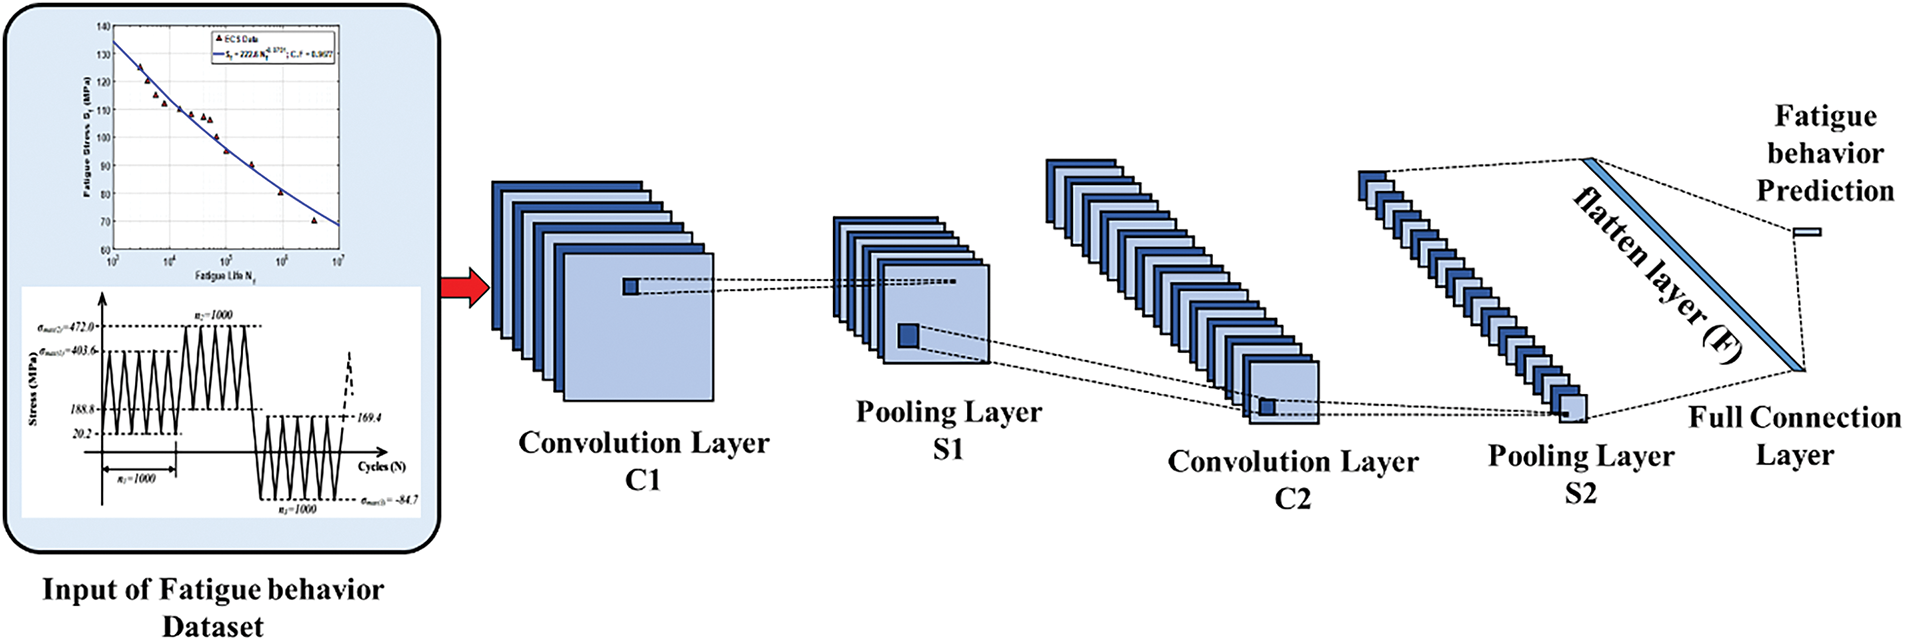
Figure 10: The layers connection of the proposed CNN model for fatigue behavior identification in the CFRE composite plate
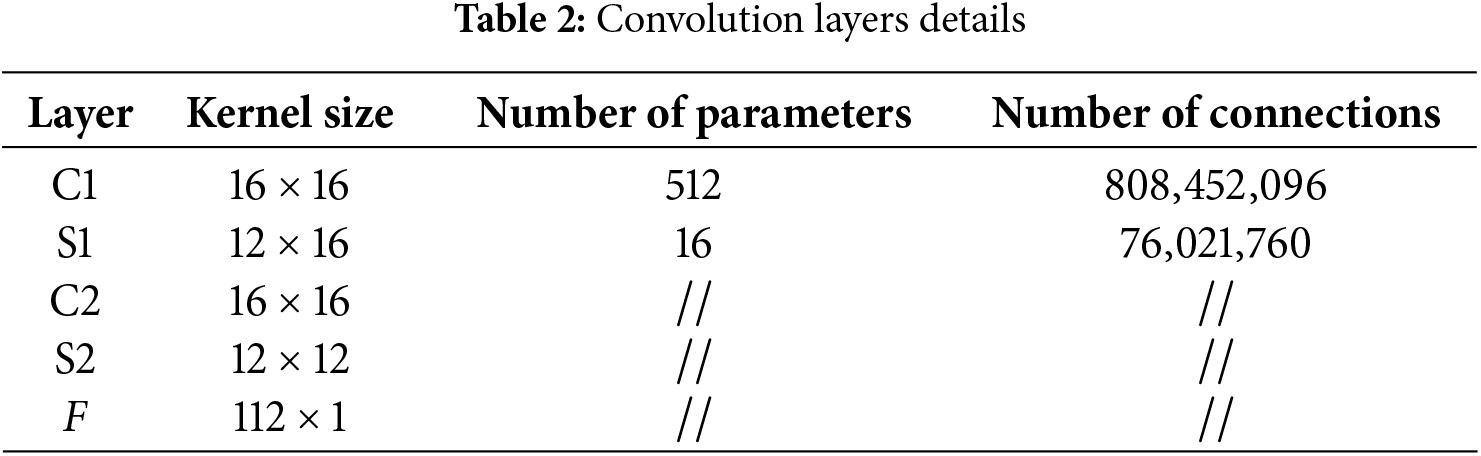
Table 2 presents the details convolution layers components, The
So, Fig. 11 shows this 1D fully connected layer sitting between the input layer, which has all the feature datasets, and the output layer that gives us the target response. The CNN is trained to pick up on this really valuable nonlinear info using weights
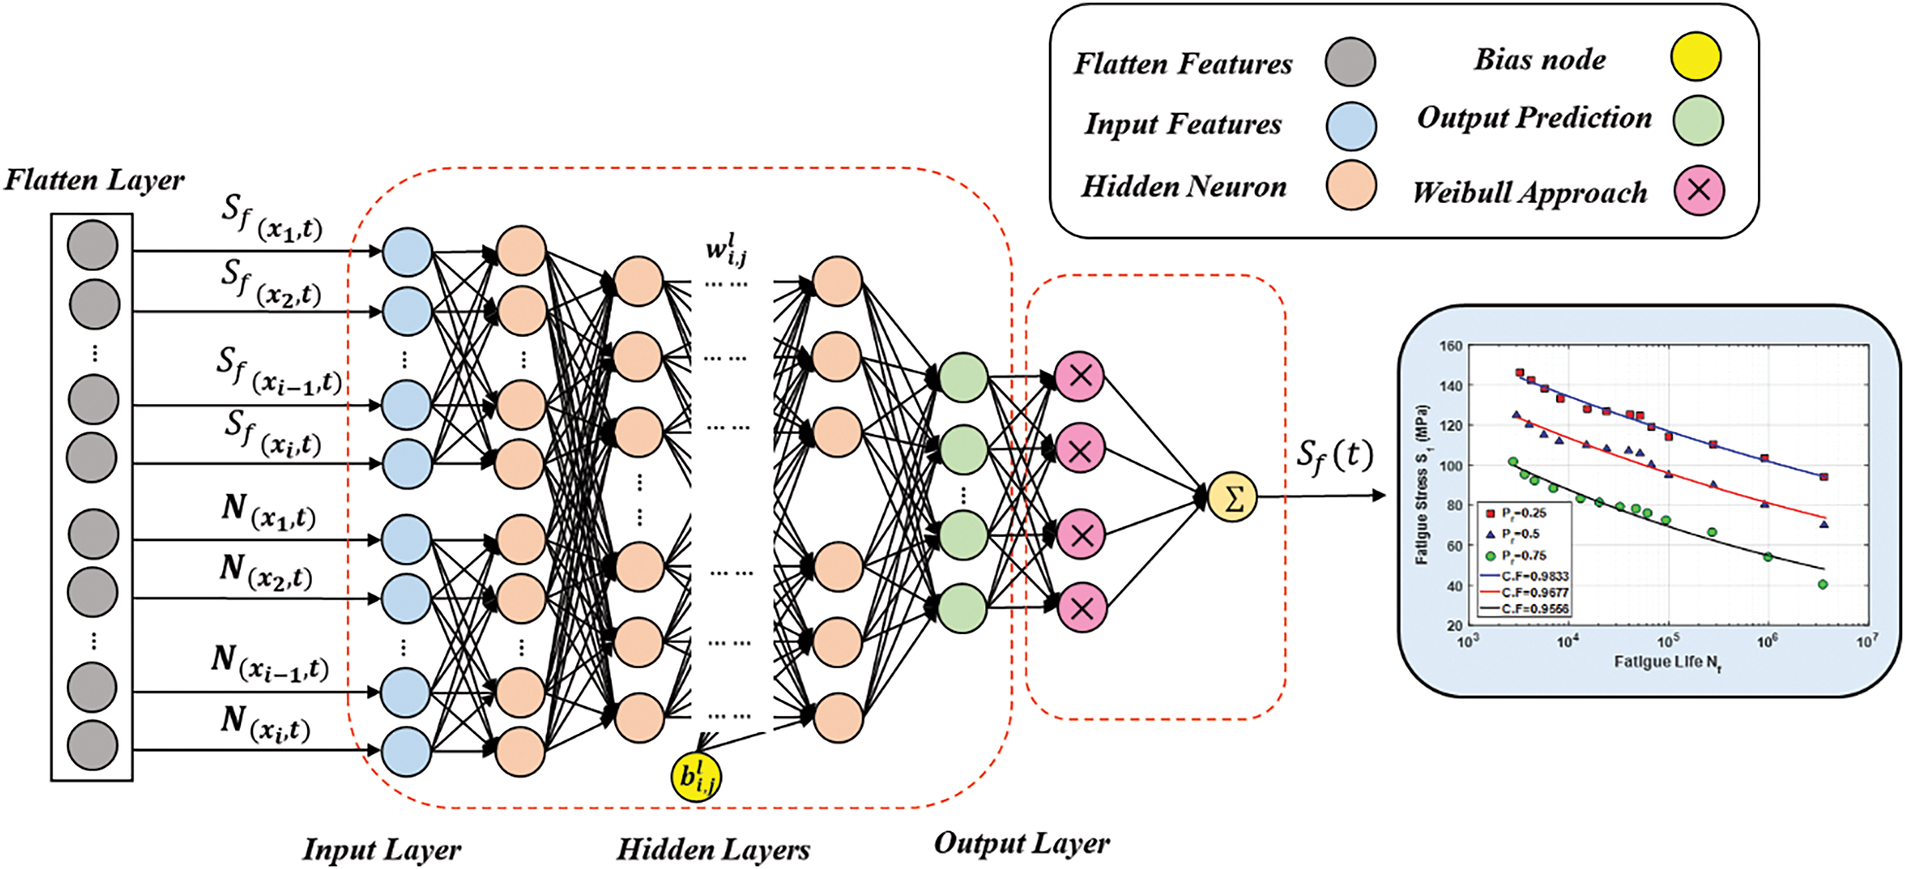
Figure 11: The fully-connected layers-type architecture of the proposed CNN
Utilizing mean pooling and one-dimensional convolution, the features are extracted from the FEM data. Six hidden layers make up the fully linked NN; the total number of neurons in the first three layers is 1024 each, while the latter three layers have 502 neurons. This process is defined as:
where
To obtain training data and forecast fatigue behavior for various stress ratios (
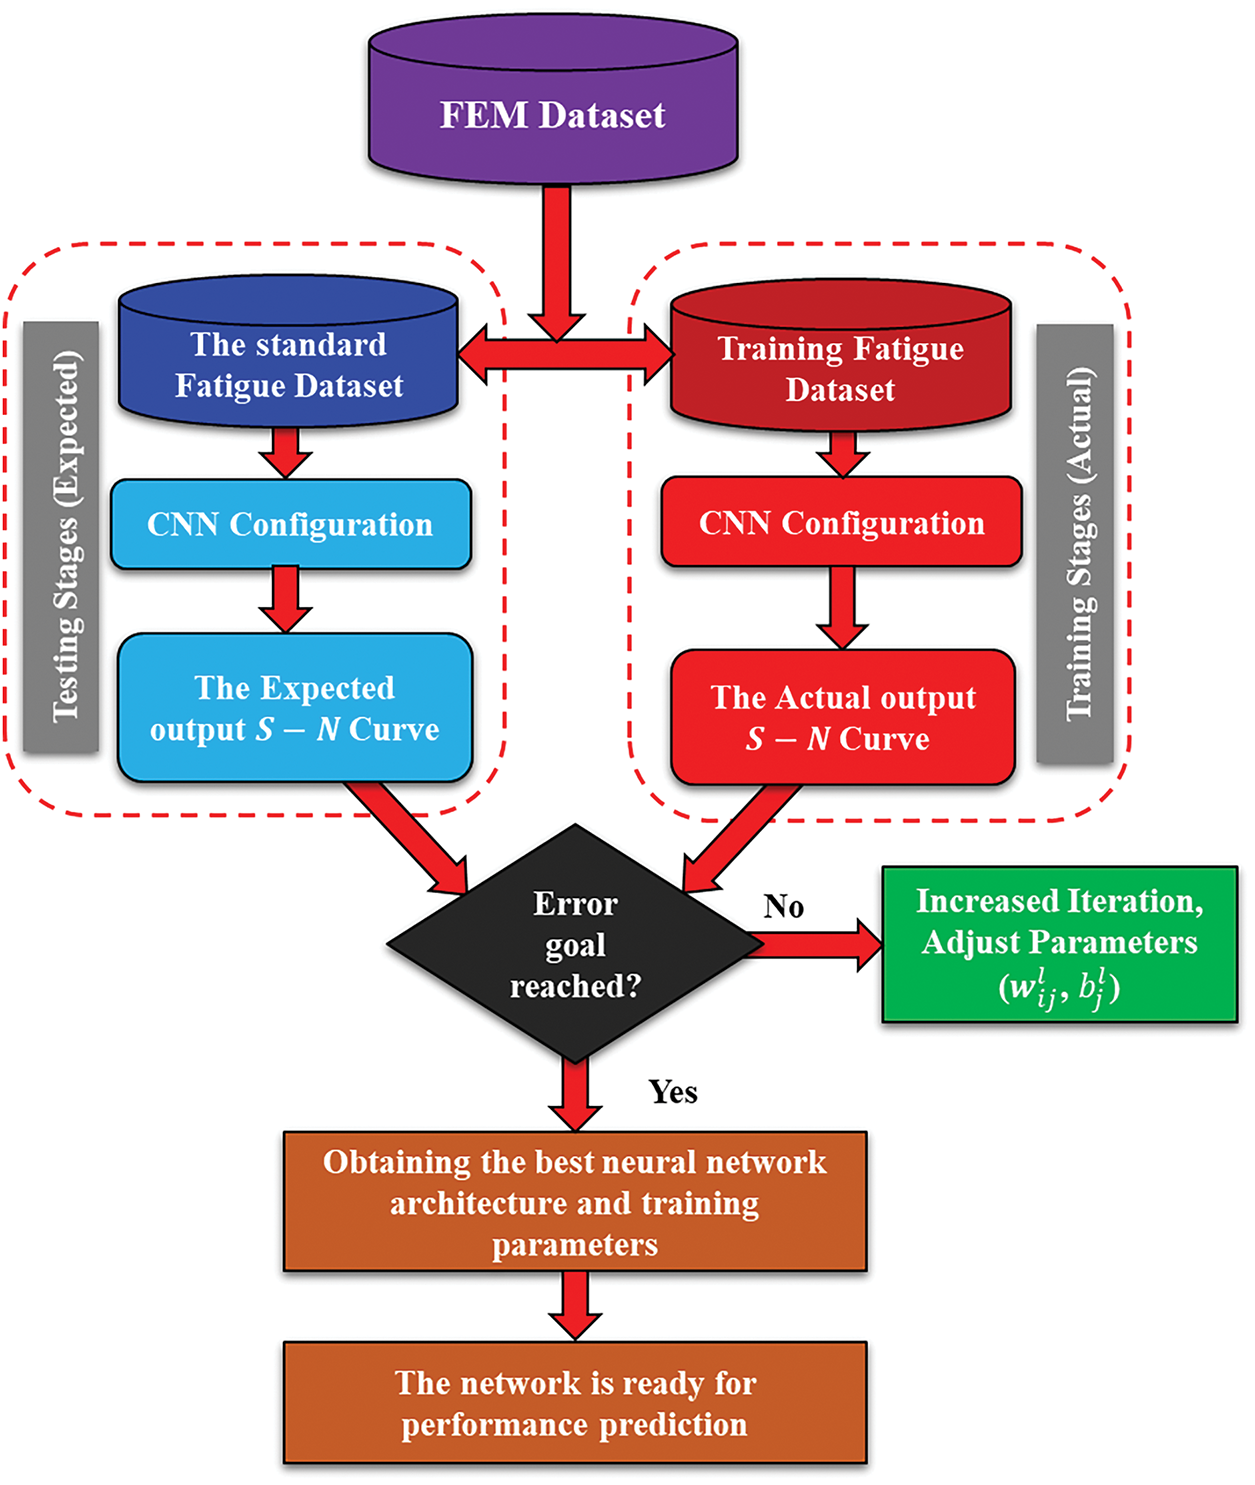
Figure 12: The architecture of the proposed CNN model for fatigue behavior identification
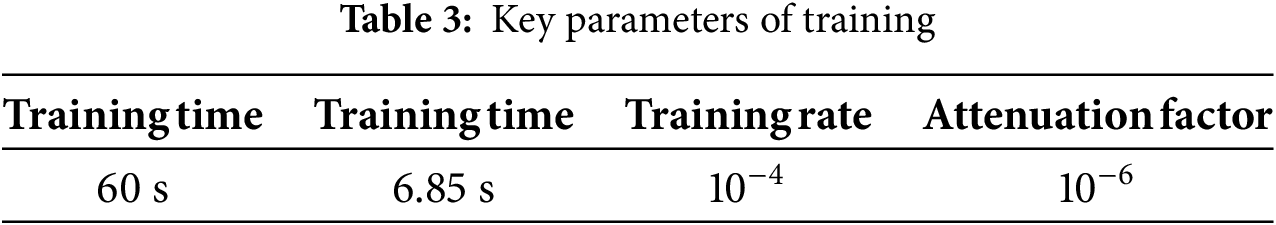
The real data is collected after processing the expected findings multiple times and repeating testing with CNN until acceptable results are achieved; these results are covered in the following section. Fig. 13 shows the CNN setup, training, and testing model procedures. The training and test MSE loss in supervised mode is shown in Fig. 14. It is evident that as the epoch increases, the MSE decreases to low values, and after ten epochs, the losses linked to tiredness behavior show small values and gradually decline. Furthermore, the test MSE might achieve a stable state earlier and exhibit greater values than the training MSE. Overall, the created deep learning model performs better during training and testing when it comes to the fatigue behavior of CFRE composite plates. Table 3 displays the important CNN training parameters.
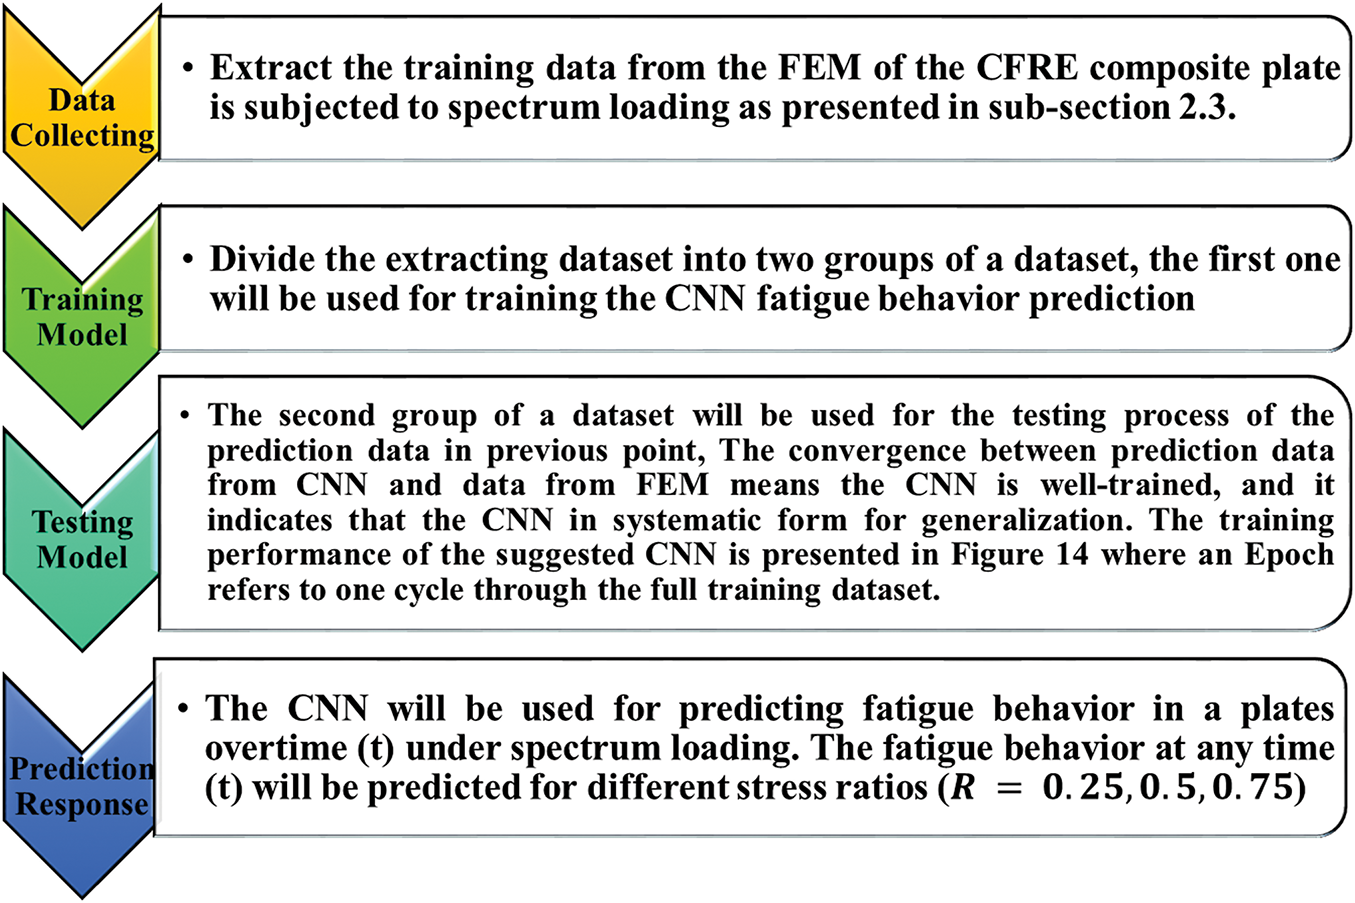
Figure 13: The steps of CNN training to predict fatigue behavior for different stress ratios (R)
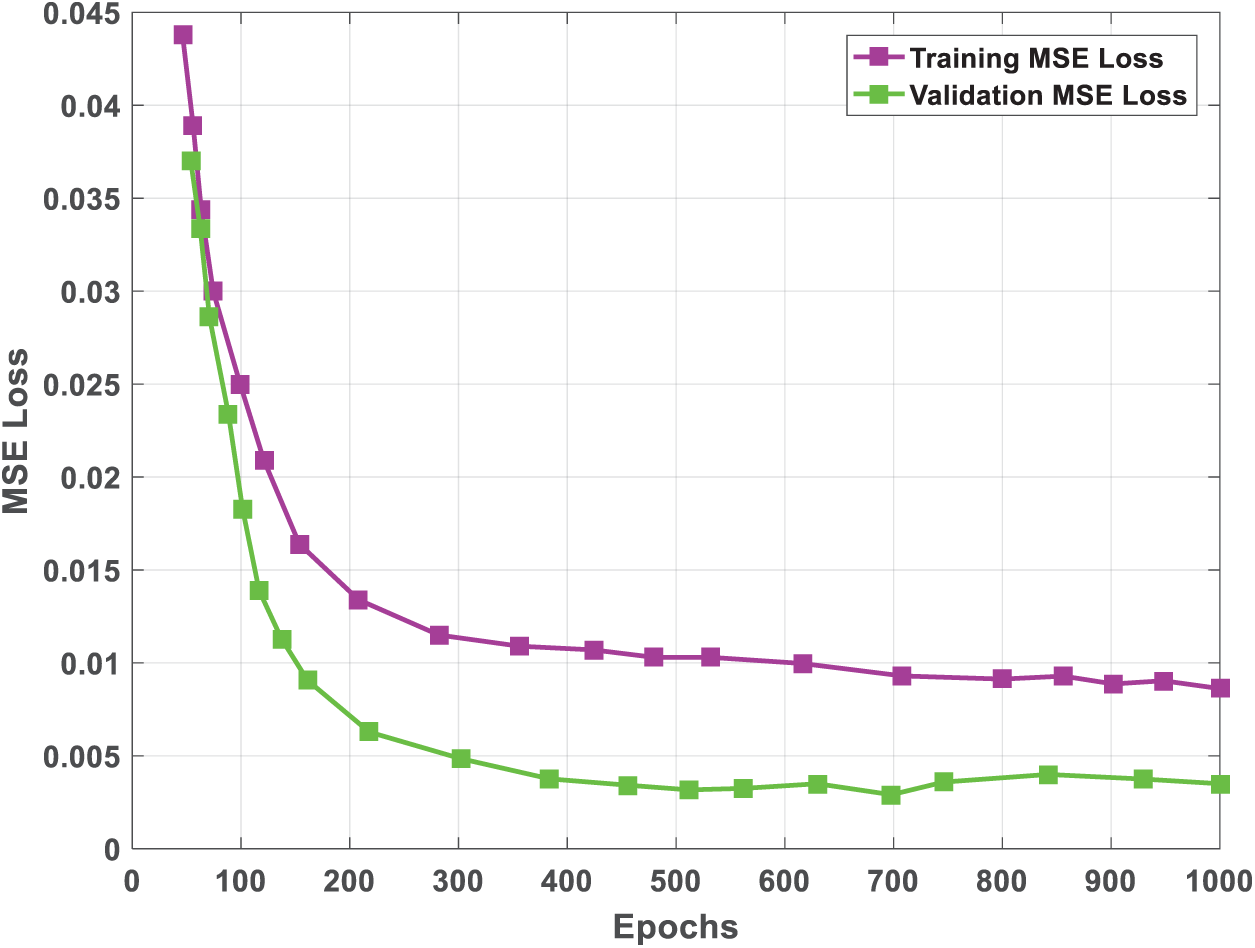
Figure 14: Training and testing MSE loss of the suggested CNN
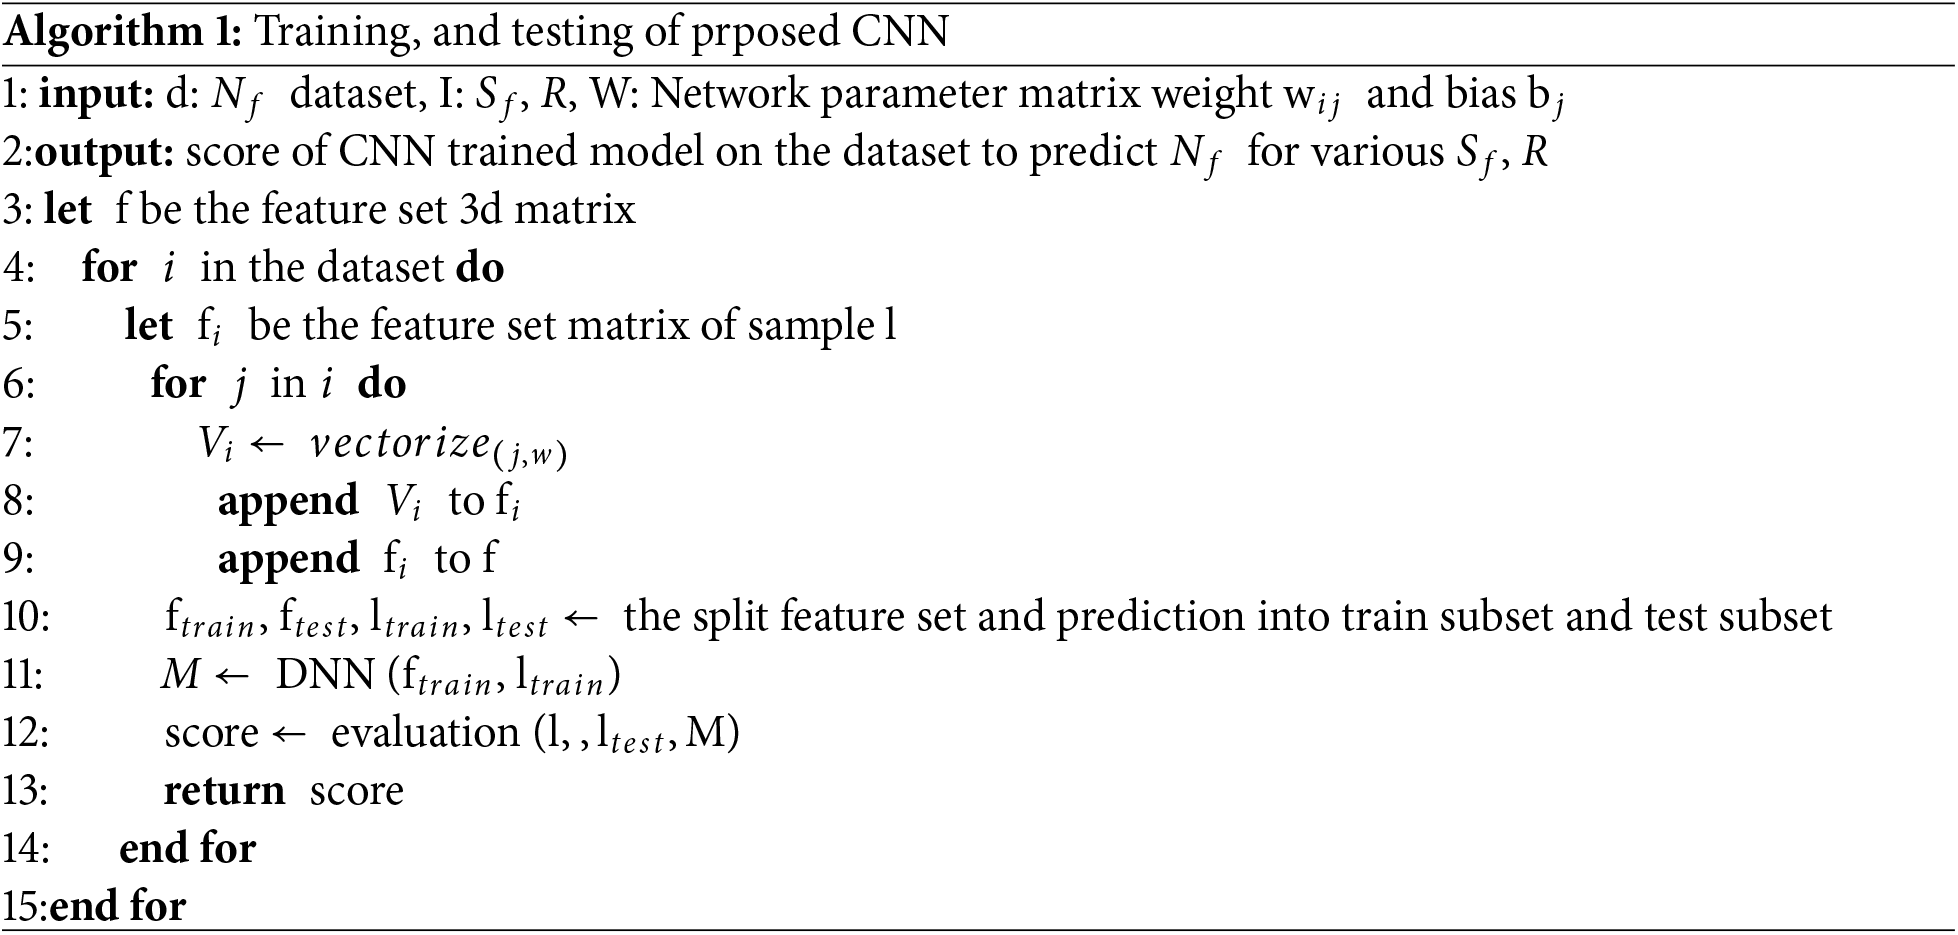
3.2 MATLAB Algorithm of Proposed CNN
The MATLAB algorithm code for designing, training, and testing of suggested CNN is listed in Algorithm 1 below.
4.1 The Fatigue Behavior Prediction of the CFRE Composite Plate
The
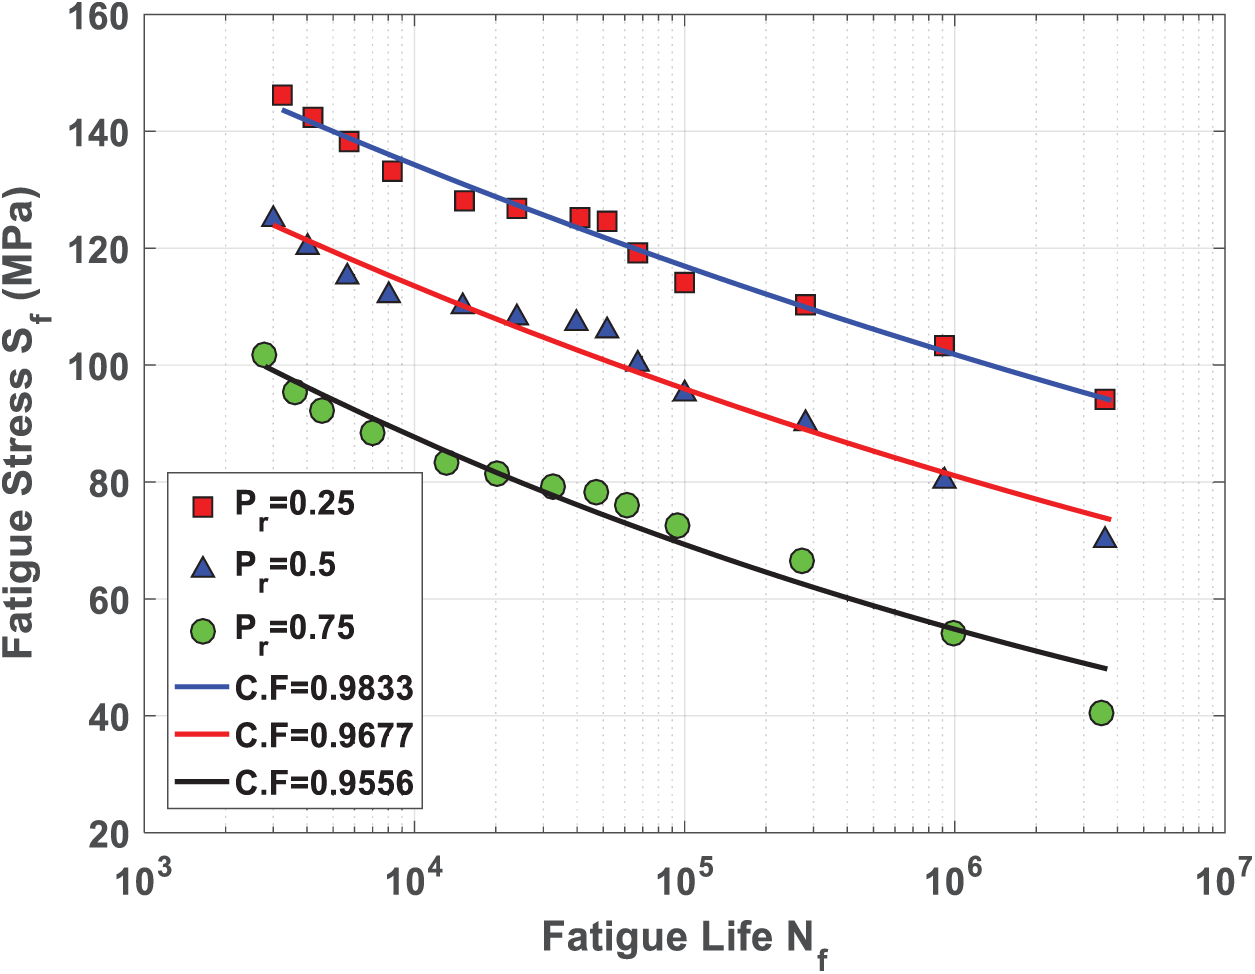
Figure 15: The prediction data of S-N curves of the CFRE plate for
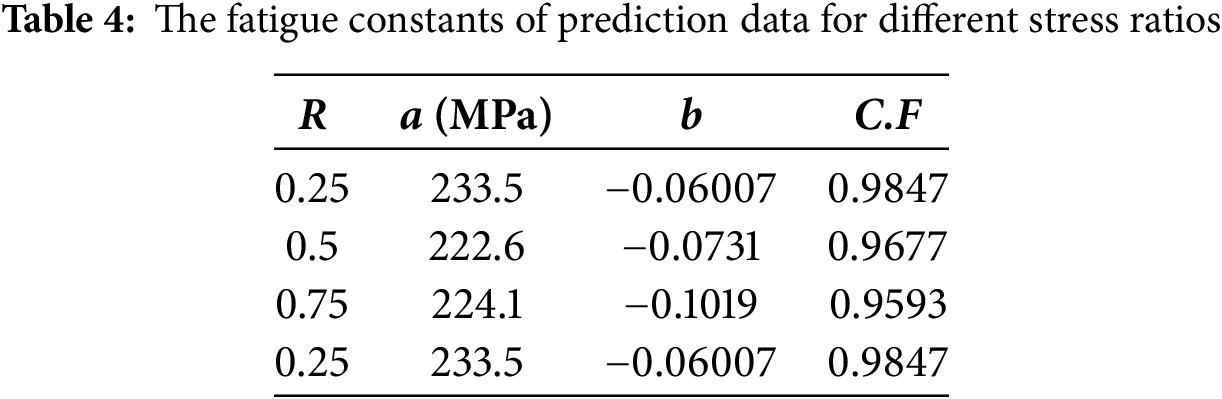
Fig. 16 shows a comparison to evaluate the error between predicted data of CNN and data results of FEM for
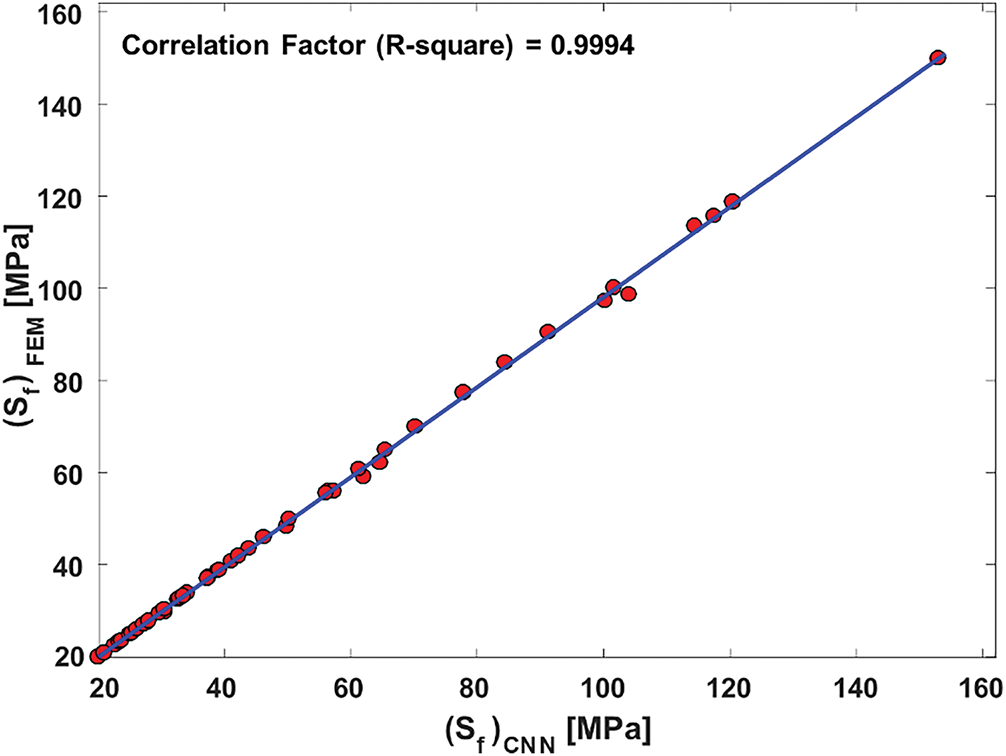
Figure 16: A comparison between fatigue data from the CNN and the FEM
4.2 Validity of the Proposed Technique
In this part of the present work, the available test dataset adapted dataset by Kumar and Swamy [36] to study the GFRE laminated composites fatigue behavior is used to verify the present technique.
As shown in Fig. 17, the specimens (
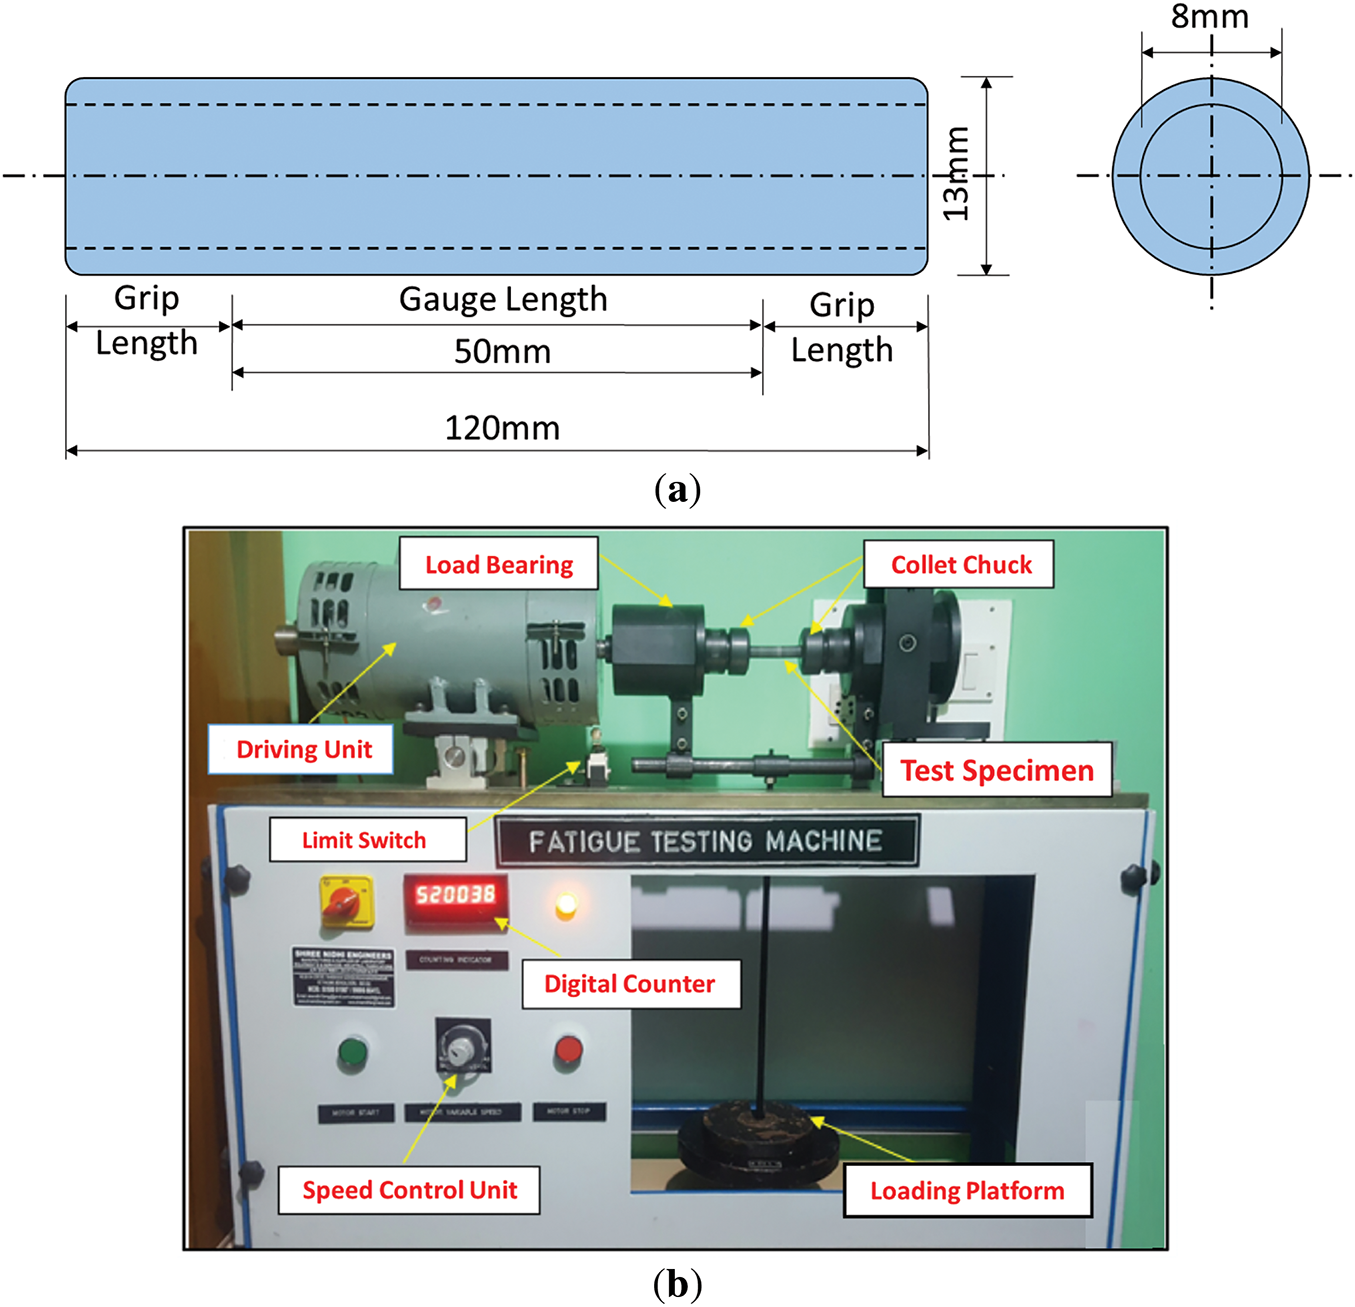
Figure 17: (a) The specimens geometrical (b) The fatigue testing machine components [36]
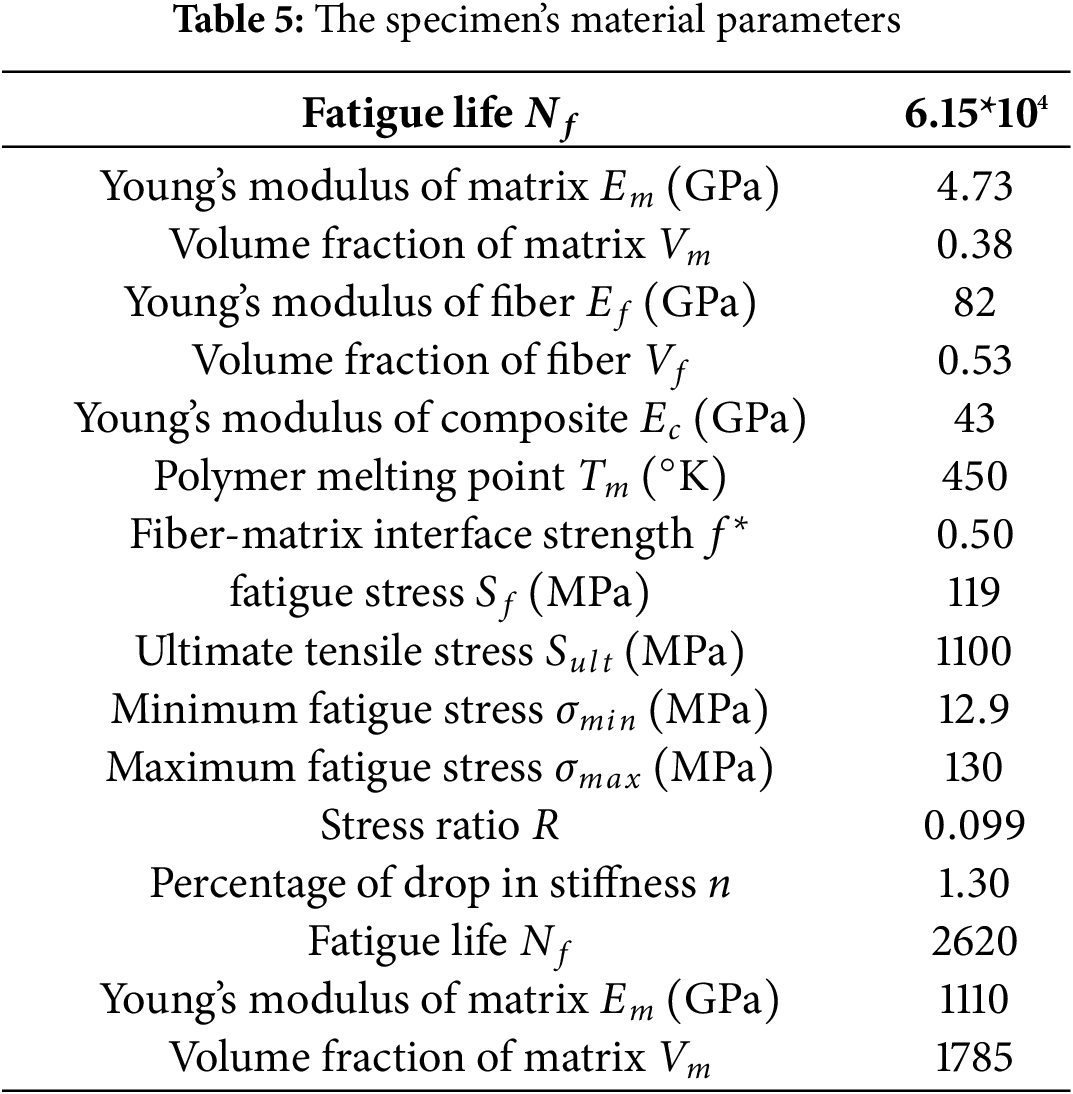
The Fatigue life of GFRE composites was estimated experimentally under stress ratio
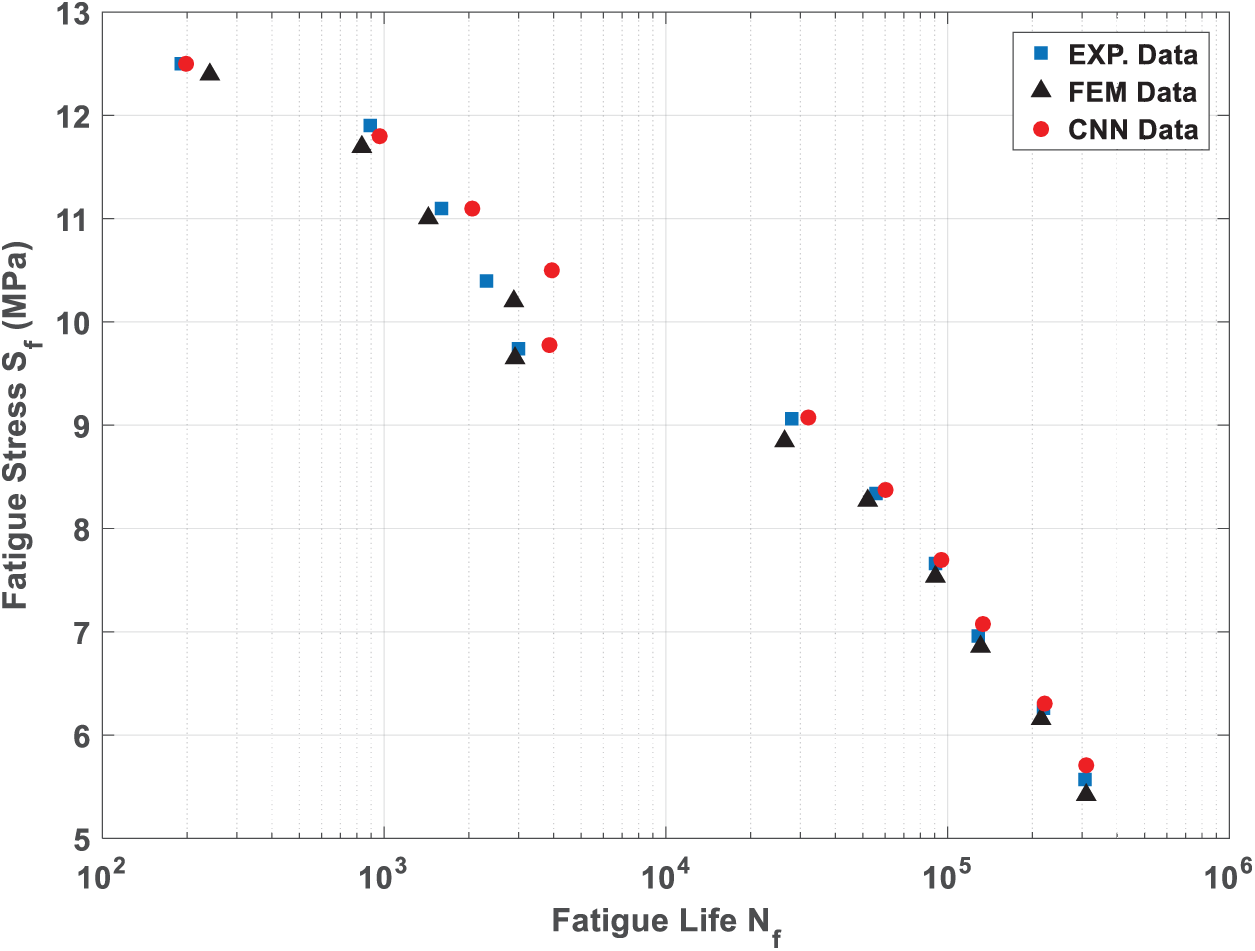
Figure 18: A comparison between the proposed method and experimental datasets adapted by Kumar and Swamy [36] of the S-N curve for GFRE composites
4.2.2 Present Algorithm Accuracy and Reliability Evaluation
Accuracy rate (
where false negative rate
In this study,
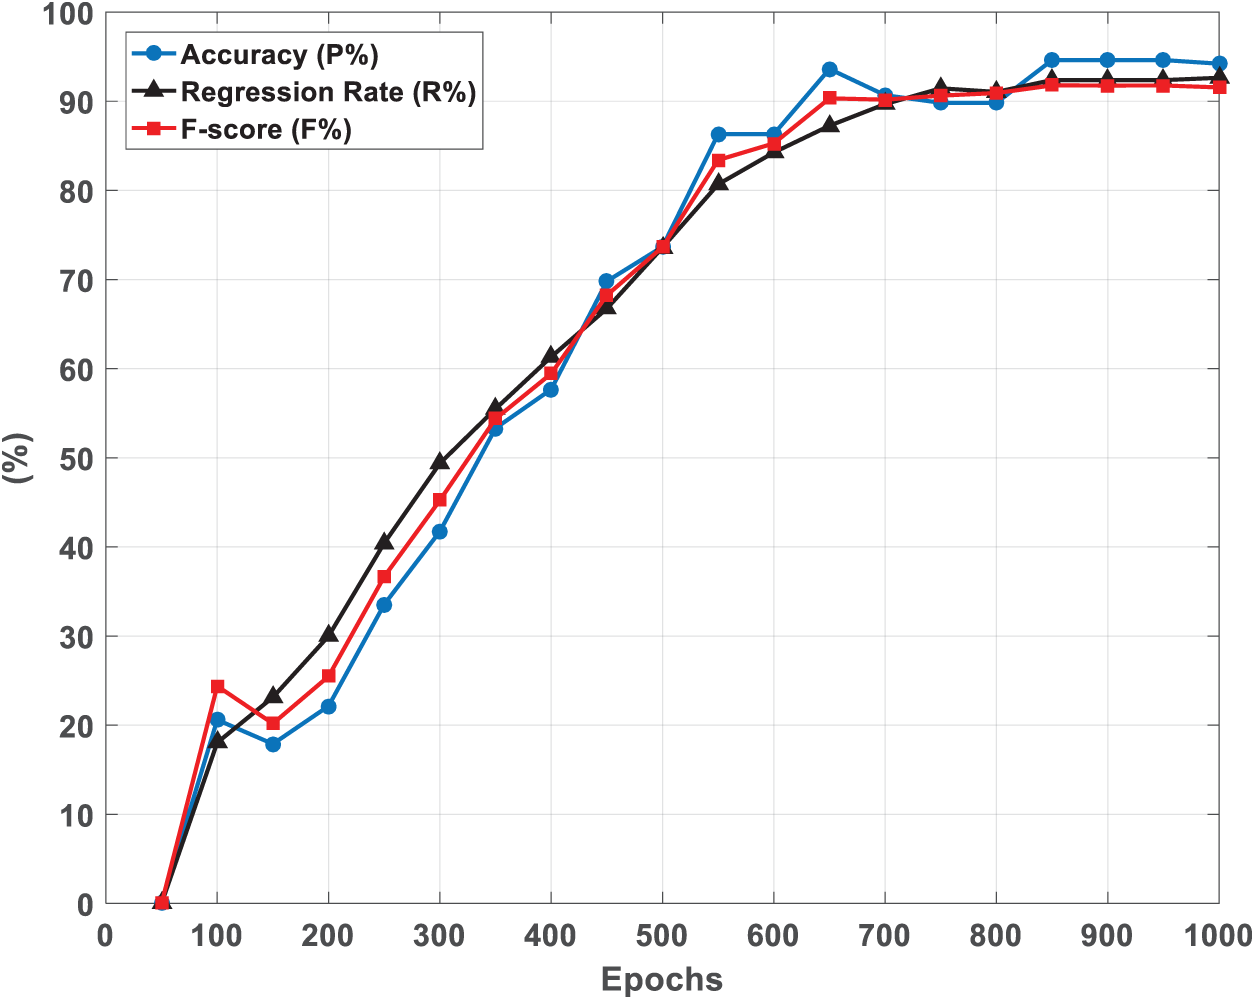
Figure 19: The training proceeded with a comparison based on the plate fatigue life
In this work, the carbon fiber reinforced with epoxy laminate composite plates’ fatigue behavior was predicted under spectrum fatigue loading using a novel convolutional neural network group-based deep learning technique. We found that the convolutional neural network can effectively be trained to model the fatigue behavior of carbon fiber reinforced with epoxy laminate composite plates exposed to variable amplitude block loading. It has been experimentally verified that the suggested method has accuracy and reliability, and applicability to other various composite structures through applying the proposed approach to experimental datasets adapted from available literature. The maximum evaluation error band for fatigue behavior between the CNN and FEM dataset is less than
In FEM the actual materials have slightly different behavior for large scale structures. It will be difficult to tune the FEA model for large-scale structures. Because all the different damage levels have different nonlinear relationships between these two. In the future work we will be used the new digital twins model based on deep learning model to updating the FEM in Large-Scaled Structures to eliminate the different behavior between FEM and actual materials.
Acknowledgement: Not applicable.
Funding Statement: The author received no specific funding for this study.
Availability of Data and Materials: Not applicable.
Ethics Approval: Not applicable.
Conflicts of Interest: The author declares no conflicts of interest to report regarding the present study.
References
1. Altabey WA. A novel framework to identify delamination location/size in BFRP pipe based on convolutional neural network (CNN) algorithm hybrid with capacitive sensors. Int J Light Mater Manuf. 2025;8(3):393–401. doi:10.1016/j.ijlmm.2024.12.002. [Google Scholar] [CrossRef]
2. Hassani S, Mousavi M, Gandomi AH. Structural health monitoring in composite structures: a comprehensive review. Sensors. 2021;22(1):153. doi:10.3390/s22010153. [Google Scholar] [PubMed] [CrossRef]
3. Altabey WA. The laminated pipeline material delamination identification based on artificial intelligence schemes. In: Advances in machinery, materials science and engineering application. Vol. 58. Amsterdam, Netherlands: IOS Press; 2024. p. 827–34. doi:10.3233/atde240713. [Google Scholar] [CrossRef]
4. Wang X, Ni L, Zhang C, Xu Q, Ye S. Using a one-dimensional convolutional neural network on FTIR spectroscopy to measure the thickness of composite plastic films. Infrared Phys Technol. 2025;147(8):105777. doi:10.1016/j.infrared.2025.105777. [Google Scholar] [CrossRef]
5. El Said B. Predicting the non-linear response of composite materials using deep recurrent convolutional neural networks. Int J Solids Struct. 2023;276(1):112334. doi:10.1016/j.ijsolstr.2023.112334. [Google Scholar] [CrossRef]
6. Goodfellow IJ, Pouget-Abadie J, Mirza M. Generative adversarial networks. arXiv:1406.2661. 2014. [Google Scholar]
7. Nguyen VH, Golinval JC. Fault detection based on kernel principal component analysis. Eng Struct. 2010;32(11):3683–91. doi:10.1016/j.engstruct.2010.08.012. [Google Scholar] [CrossRef]
8. Worden K, Farrar CR, Manson G, Park G. The fundamental axioms of structural health monitoring. Proc R Soc A. 2007;463(2082):1639–64. doi:10.1098/rspa.2007.1834. [Google Scholar] [CrossRef]
9. Moghadam KY, Noori M, Silik A, Altabey WA. Damage detection in structures by using imbalanced classification algorithms. Mathematics. 2024;12(3):432. doi:10.3390/math12030432. [Google Scholar] [CrossRef]
10. Cha YJ, Choi W, Büyüköztürk O. Deep learning-based crack damage detection using convolutional neural networks. Computer Aided Civil Eng. 2017;32(5):361–78. doi:10.1111/mice.12263. [Google Scholar] [CrossRef]
11. Dorafshan S, Thomas RJ, Maguire M. Comparison of deep convolutional neural networks and edge detectors for image-based crack detection in concrete. Constr Build Mater. 2018;186(3):1031–45. doi:10.1016/j.conbuildmat.2018.08.011. [Google Scholar] [CrossRef]
12. Dorafshan S, Thomas RJ, Maguire M. SDNET2018: an annotated image dataset for non-contact concrete crack detection using deep convolutional neural networks. Data Brief. 2018;21:1664–8. doi:10.1016/j.dib.2018.11.015. [Google Scholar] [PubMed] [CrossRef]
13. Ni F, Zhang J, Chen Z. Pixel-level crack delineation in images with convolutional feature fusion. Struct Control Health Monit. 2019;26(1):e2286. doi:10.1002/stc.2286. [Google Scholar] [CrossRef]
14. Chen J, Wu W, Ren Y, Yuan S. Fatigue crack evaluation with the guided wave-convolutional neural network ensemble and differential wavelet spectrogram. Sensors. 2021;22(1):307. doi:10.3390/s22010307. [Google Scholar] [PubMed] [CrossRef]
15. Zhang R, Chen Z, Chen S, Zheng J, Büyüköztürk O, Sun H. Deep long short-term memory networks for nonlinear structural seismic response prediction. Comput Struct. 2019;220(3):55–68. doi:10.1016/j.compstruc.2019.05.006. [Google Scholar] [CrossRef]
Altabey WA. Prediction of natural frequency of basalt fiber reinforced polymer (FRP) laminated variable thic-kness plates with intermediate elastic support using artificial neural networks (ANNs) method. J Vibroeng. 2017;19(5):3668–78. [Google Scholar]
17. Bao Y, Tang Z, Li H, Zhang Y. Computer vision and deep learning-based data anomaly detection method for structural health monitoring. Struct Health Monit. 2019;18(2):401–21. doi:10.1177/1475921718757405. [Google Scholar] [CrossRef]
18. Kim T, Kwon OS, Song J. Response prediction of nonlinear hysteretic systems by deep neural networks. Neural Netw. 2019;111(3–4):1–10. doi:10.1016/j.neunet.2018.12.005. [Google Scholar] [PubMed] [CrossRef]
19. Kim T, Song J, Kwon OS. Probabilistic evaluation of seismic responses using deep learning method. Struct Saf. 2020;84(4):101913. doi:10.1016/j.strusafe.2019.101913. [Google Scholar] [CrossRef]
20. Li Q, Li H, Hu W, Sun S, Qin Z, Chu F. Transparent operator network: a fully interpretable network incorporating learnable wavelet operator for intelligent fault diagnosis. IEEE Trans Ind Inform. 2024;20(6):8628–38. doi:10.1109/TII.2024.3366993. [Google Scholar] [CrossRef]
21. Li Q, Liu Y, Sun S, Qin Z, Chu F. Deep expert network: a unified method toward knowledge-informed fault diagnosis via fully interpretable neuro-symbolic AI. J Manuf Syst. 2024;77(9):652–61. doi:10.1016/j.jmsy.2024.10.007. [Google Scholar] [CrossRef]
22. Altabey WA, Wu Z, Noori M, Fathnejat H. Structural health monitoring of composite pipelines utilizing fiber optic sensors and an AI-based algorithm-a comprehensive numerical study. Sensors. 2023;23(8):3887. doi:10.3390/s23083887. [Google Scholar] [PubMed] [CrossRef]
23. Altabey WA, Noori M, Wu Z, Al-Moghazy MA, Kouritem SA. Studying acoustic behavior of BFRP laminated composite in dual-chamber muffler application using deep learning algorithm. Materials. 2022;15(22):8071. doi:10.3390/ma15228071. [Google Scholar] [PubMed] [CrossRef]
24. Wang T, Li H, Noori M, Ghiasi R, Kuok SC, Altabey WA. Seismic response prediction of structures based on Runge-Kutta recurrent neural network with prior knowledge. Eng Struct. 2023;279(1):115576. doi:10.1016/j.engstruct.2022.115576. [Google Scholar] [CrossRef]
25. El Kadi H, Al-Assaf Y. Energy-based fatigue life prediction of fiberglass/epoxy composites using modular neural networks. Compos Struct. 2002;57(1–4):85–9. doi:10.1016/s0263-8223(02)00071-5. [Google Scholar] [CrossRef]
26. Choi SW, Song EJ, Hahn HT. Prediction of fatigue damage growth in notched composite laminates using an artificial neural network. Compos Sci Technol. 2003;63(5):661–75. doi:10.1016/s0266-3538(02)00261-0. [Google Scholar] [CrossRef]
27. Zhang Z, Friedrich K. Artificial neural networks applied to polymer composites: a review. Compos Sci Technol. 2003;63(14):2029–44. doi:10.1016/s0266-3538(03)00106-4. [Google Scholar] [CrossRef]
28. Jia J, Davalos JF. An artificial neural network for the fatigue study of bonded FRP-wood interfaces. Compos Struct. 2006;74(1):106–14. doi:10.1016/j.compstruct.2005.03.012. [Google Scholar] [CrossRef]
29. Vassilopoulos AP, Georgopoulos EF, Dionysopoulos V. Artificial neural networks in spectrum fatigue life prediction of composite materials. Int J Fatigue. 2007;29(1):20–9. doi:10.1016/j.ijfatigue.2006.03.004. [Google Scholar] [CrossRef]
30. Freire RCS, Neto ADD, de Aquino EMF. Use of modular networks in the building of constant life diagrams. Int J Fatigue. 2007;29(3):389–96. doi:10.1016/j.ijfatigue.2006.06.005. [Google Scholar] [CrossRef]
31. Bezazi A, Pierce SG, Worden K, Harkati EH. Fatigue life prediction of sandwich composite materials under flexural tests using a Bayesian trained artificial neural network. Int J Fatigue. 2007;29(4):738–47. doi:10.1016/j.ijfatigue.2006.06.013. [Google Scholar] [CrossRef]
32. El Kadi H. Modeling the mechanical behavior of fiber-reinforced polymeric composite materials using artificial neural networks—a review. Compos Struct. 2006;73(1):1–23. doi:10.1016/j.compstruct.2005.01.020. [Google Scholar] [CrossRef]
33. El-Kadi H, Al-Assaf Y. The use of neural networks in the prediction of the fatigue life of different composite materials. In: 16th International Conference on Composite Materials; 2007 Jul 8–13; Kyoto, Japan. p. 1–9. [Google Scholar]
34. Plumtree A, Shi L. Fatigue damage evolution in off-axis unidirectional CFRP. Int J Fatigue. 2002;24(2–4):155–9. doi:10.1016/S0142-1123(01)00068-8. [Google Scholar] [CrossRef]
35. Zhao Y, Noori M, Altabey WA, Ghiasi R, Wu Z. A fatigue damage model for FRP composite laminate systems based on stiffness reduction. Struct Durab Health Monit. 2019;13(1):85–103. doi:10.32604/sdhm.2019.04695. [Google Scholar] [CrossRef]
36. Kumar CH, Swamy RP. Fatigue life prediction of glass fiber reinforced epoxy composites using artificial neural networks. Compos Commun. 2021;26(2):100812. doi:10.1016/j.coco.2021.100812. [Google Scholar] [CrossRef]
37. Davis J, Goadrich M. The relationship between precision-recall and ROC curves. In: Proceedings of the 23rd International Conference on Machine Learning—ICML ‘06; 2006 Jun 25–29; Pittsburgh, PA, USA. p. 233–40. doi:10.1145/1143844.1143874. [Google Scholar] [CrossRef]
38. Fawcett T. An introduction to ROC analysis. Pattern Recognit Lett. 2006;27(8):861–74. doi:10.1016/j.patrec.2005.10.010. [Google Scholar] [CrossRef]
Cite This Article
 Copyright © 2025 The Author(s). Published by Tech Science Press.
This work is licensed under a Creative Commons Attribution 4.0 International License , which permits unrestricted use, distribution, and reproduction in any medium, provided the original work is properly cited.
 Downloads
 Citation Tools