
 Submit a Paper
 Propose a Special lssue
 Open Access
ARTICLE

STPEIC: A Swin Transformer-Based Framework for Interpretable Post-Earthquake Structural Classification
School of Highway, Chang’an University, Xi’an, 710064, China
* Corresponding Author: Shizhi Chen. Email:
(This article belongs to the Special Issue: Resilient and Sustainable Infrastructure: Monitoring, Safety, and Durability)
Structural Durability & Health Monitoring 2025, 19(6), 1745-1767. https://doi.org/10.32604/sdhm.2025.071148
Received 01 August 2025; Accepted 26 August 2025; Issue published 17 November 2025
 View Full Text
 Download PDF
Abstract
The rapid and accurate assessment of structural damage following an earthquake is crucial for effective emergency response and post-disaster recovery. Traditional manual inspection methods are often slow, labor-intensive, and prone to human error. To address these challenges, this study proposes STPEIC (Swin Transformer-based Framework for Interpretable Post-Earthquake Structural Classification), an automated deep learning framework designed for analyzing post-earthquake images. STPEIC performs two key tasks: structural components classification and damage level classification. By leveraging the hierarchical attention mechanisms of the Swin Transformer (Shifted Window Transformer), the model achieves 85.4% accuracy in structural component classification and 85.1% accuracy in damage level classification. To enhance model interpretability, visual explanation heatmaps are incorporated, highlighting semantically relevant regions that the model uses for decision-making. These heatmaps closely align with real-world structural and damage features, confirming that STPEIC learns meaningful representations rather than relying on spurious correlations. Additionally, a graphical user interface (GUI) has been developed to streamline image input, classification, and interpretability visualization, improving the practical usability of the system. Overall, STPEIC provides a reliable, interpretable, and user-friendly solution for rapid post-earthquake structural evaluation.Keywords
Timely and accurate building damage assessment following an earthquake is critical for ensuring safety, coordinating emergency response, and guiding post-disaster recovery [1–4]. However, structural engineers often face the challenge of inspecting a large number of buildings within tight time constraints, making traditional manual inspection methods increasingly inadequate [5–8]. These methods are not only time-consuming and labor-intensive but also rely heavily on the expertise and subjective judgment of inspectors [9–12]. As urban areas become more densely populated and disaster-prone, the need for efficient, scalable, and reliable tools to assist in post-earthquake structural evaluation has become even more pressing [1,13–15].
With the growing availability of post-earthquake imagery and the widespread use of GPU technology [16–18], deep learning approaches, particularly Convolutional Neural Networks (CNNs), have increasingly been adopted for structural inspection tasks [19–22]. However, training task-specific CNN models from scratch often requires large volumes of labeled data, which are difficult to obtain in disaster scenarios. As a result, recent research has shifted toward utilizing pretrained models—initially trained on large-scale datasets like ImageNet [23,24]—and fine-tuning them on domain-specific post-earthquake images. This approach not only improves model performance but also reduces the need for extensive annotation. For instance, Feng et al. proposed a CNN-based method for rapid post-earthquake damage assessment, combining component type and damage level classification models with weighted calculations. This approach enabled a quantitative evaluation of building conditions, providing valuable insights for emergency response and resource allocation [19]. Dondi et al. developed a structural damage detection system that integrates a deep convolutional neural network (DCNN) with a semi-synthetic image enhancement strategy. This system, designed to analyze drone videos, improves recognition performance under data-scarce conditions by tracking multiple damage types [20]. Additionally, Wu et al. proposed a method for detecting and grading earthquake damage in wooden houses using multiple CNN models, alongside a supporting software system that aids on-site investigators in efficiently assessing damage and determining level [21]. Despite these advancements, early CNN-based approaches have shown limitations in complex real-world scenarios. CNNs often struggle to capture long-range spatial dependencies and hierarchical relationships within images, which are crucial for distinguishing structural components and assessing varying damage levels. Consequently, CNN-based models frequently exhibit suboptimal performance in such contexts [25–27].
The emergence of Transformer architectures, originally developed for natural language processing [28] and later adapted for vision tasks, has led to significant advancements in image representation learning [29,30]. Hierarchical models, such as the Swin Transformer, excel at capturing both local and global contexts through shifted window attention mechanisms [30,31], making them particularly well-suited for analyzing post-earthquake imagery, where understanding both fine-grained textures and large-scale structural layouts is essential. For example, Cui et al. proposed an enhanced Swin Transformer method to achieve high-precision segmentation and recognition of densely built areas in remote sensing images, even under challenging conditions such as complex backgrounds and weather interference [32]. Zhou et al. introduced a semantic segmentation algorithm using the Swin Transformer for tunnel lining crack detection, effectively combining local details with global semantic information, thus improving the accuracy and robustness of crack identification [33]. Despite these improvements in accuracy, many Transformer-based models remain “black boxes,” offering limited transparency into their decision-making processes. This lack of interpretability presents a significant barrier to trust, particularly in high-stakes applications like disaster response [34,35].
Moreover, most existing research has concentrated on developing advanced model architectures without providing practical, end-to-end solutions for real-world deployment. Specifically, the lack of intuitive graphical user interfaces (GUIs) limits the widespread adoption of these methods by engineers, inspectors, and emergency responders in the field [36].
To address these limitations, this paper introduces STPEIC (Swin Transformer-Based Framework for Interpretable Post Earthquake Image Classification), a novel framework designed for interpretable and deployable post-earthquake structural analysis. STPEIC consists of two independently trained Swin Transformer-based models: one for structural component classification (e.g., wall, column, beam) and another for damage level classification (e.g., minor, moderate, heavy). To enhance model interpretability, attention-based heatmaps are utilized to highlight the image regions that most influence the model’s predictions, ensuring clear alignment with meaningful structural and damage features. Additionally, to improve practical usability, we develop a lightweight graphical user interface (GUI) that supports real-time image input, classification, and interpretability visualization. This GUI bridges the gap between advanced deep learning methods and real-world deployment, making STPEIC a user-friendly tool for post-earthquake structural evaluation.
The remainder of this paper: Section 2 describes the overall structure of the STPEIC framework, including the dual-branch classification architecture for structural component and damage level assessment. Section 3 focuses on the development and training of two independent Swin Transformer models for structural component classification and damage level prediction in post-earthquake images. Section 4 compares the performance of the Swin Transformer model with the CNN-based EfficientNet model, highlighting the superior performance of the former in handling complex image classification tasks. Section 5 introduces a user-friendly graphical user interface (GUI) designed to facilitate post-earthquake image analysis, enabling real-time classification and visualization without technical expertise. Section 6 summarizes the contributions of the STPEIC framework, emphasizing its advantages in accuracy, interpretability, and practical deployment, while also outlining future research directions.
In response to the urgent need for automated and reliable structural assessment in post-earthquake scenarios, this study introduces the STPEIC framework. Combining cutting-edge vision transformers with a robust classification architecture, STPEIC is designed to identify structural components and assess damage level from raw post-disaster images. The framework is further enhanced with interpretability tools and a user-friendly graphical interface, making it suitable for both research and practical field deployment. The following sections provide a detailed overview of the STPEIC workflow, including its backbone network and training strategy.
2.1 Overview of Proposed STPEIC Framework
The overall workflow of the STPEIC framework is illustrated in Fig. 1. STPEIC begins with the input of a raw post-earthquake image, which is simultaneously processed by two Swin Transformer-based classifiers. The first classifier identifies the structural component type, categorizing the image into one of four categories: Beam, Column, Wall, or Others. The second classifier independently assesses the corresponding damage level, classifying it into one of four levels levels: Undamaged, Minor Damage, Moderate Damage, or Heavy Damage.
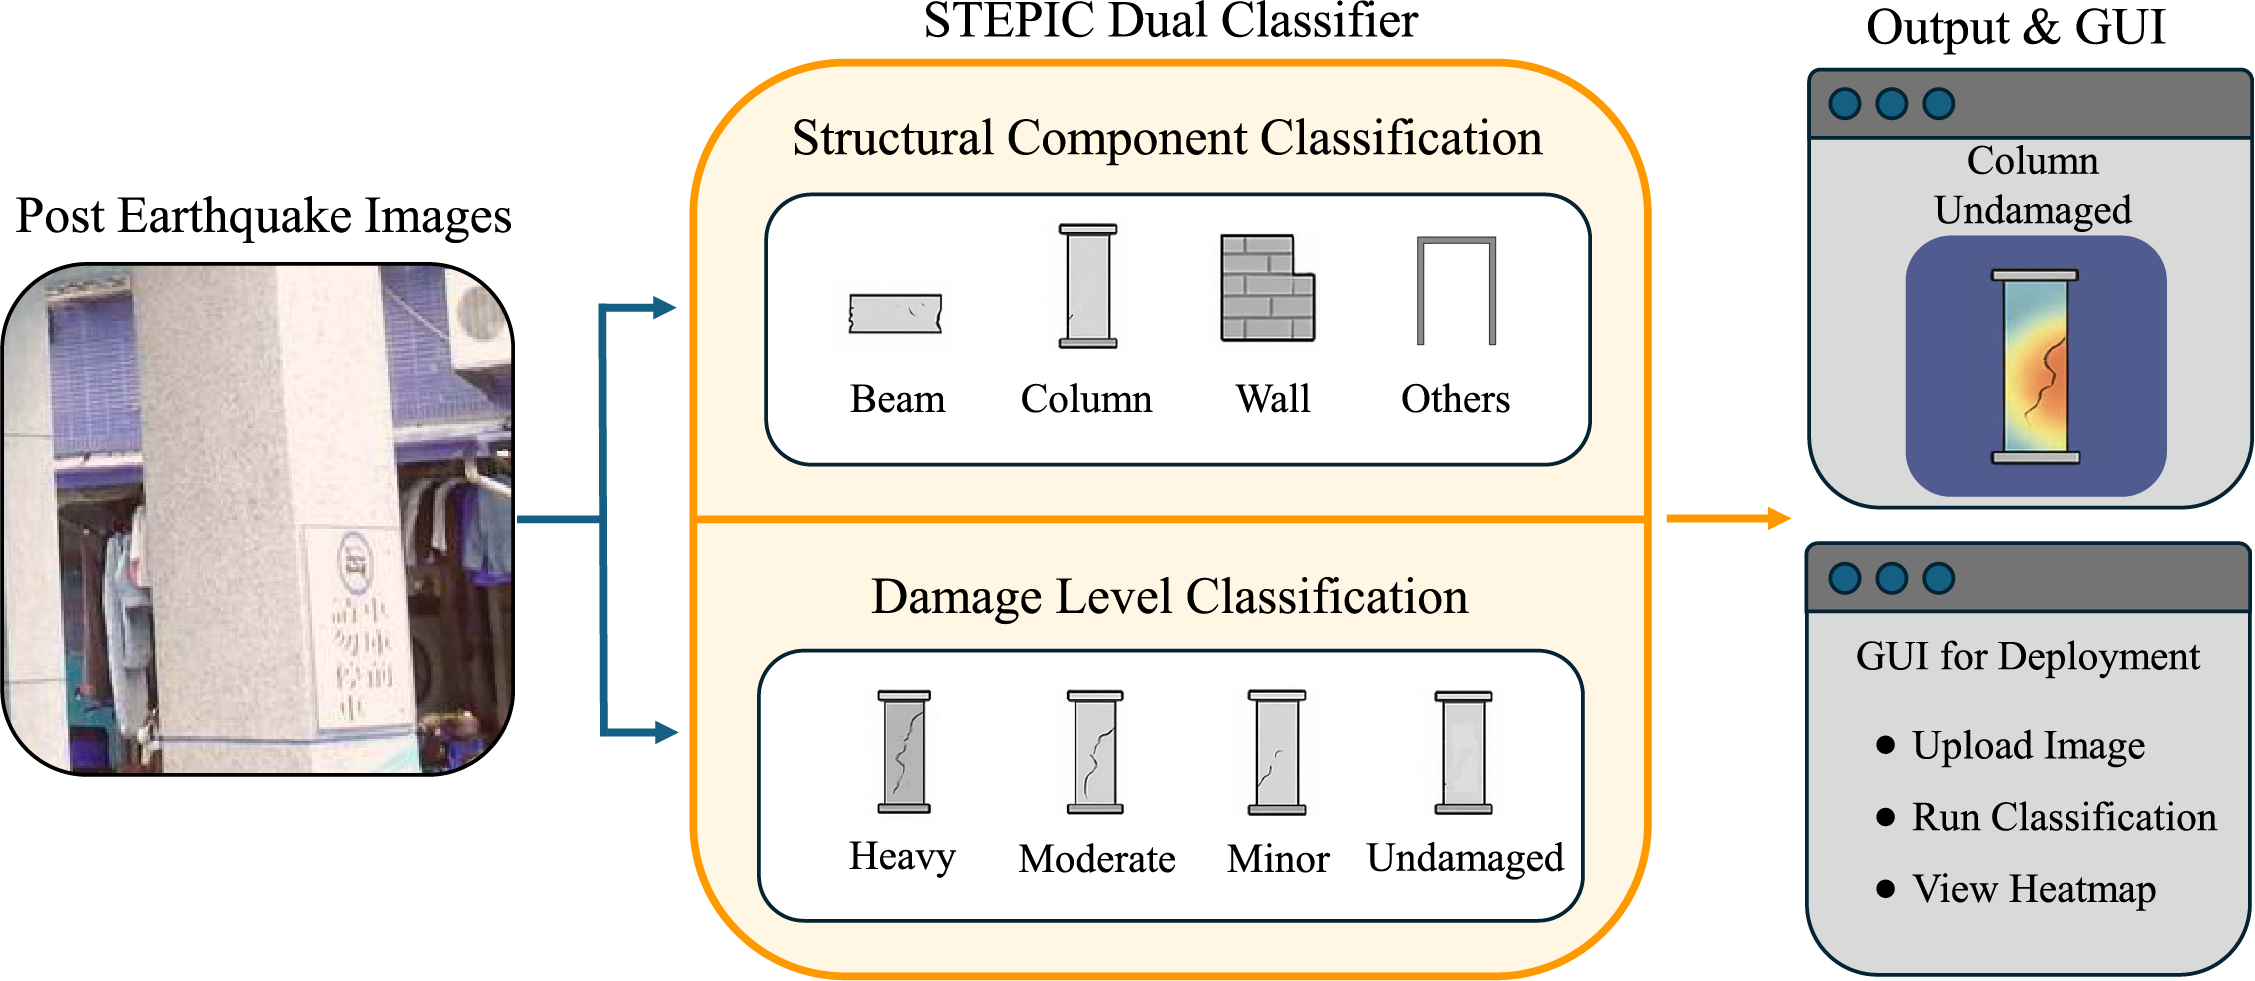
Figure 1: Workflow of proposed STPEIC framework
These two classification branches operate in parallel, utilizing the Swin Transformer’s representational power and locality-aware attention mechanisms to generate robust and interpretable predictions. This dual-classifier architecture enables a comprehensive evaluation of both structural identity and damage level within a unified framework.
The output predictions are seamlessly integrated into a lightweight graphical user interface (GUI), as shown on the right side of Fig. 1. The GUI allows users—especially engineers and field researchers without programming expertise—to easily upload images, run classification, and visualize Grad-CAM-based attention heatmaps that correspond to the predicted class labels. This design ensures transparent model interpretation and enhances field-level usability.
By combining advanced deep learning inference, interpretability visualization, and user-friendly interaction, STPEIC offers a practical and scalable tool for rapid post-disaster structural inspection and decision-making support.
2.2 Discussion of Swin Transformer
The Swin Transformer, illustrated in Fig. 2, serves as the core backbone of the proposed classification framework due to its ability to balance computational efficiency with hierarchical feature representation [37–39]. As shown in Fig. 2a, the input image
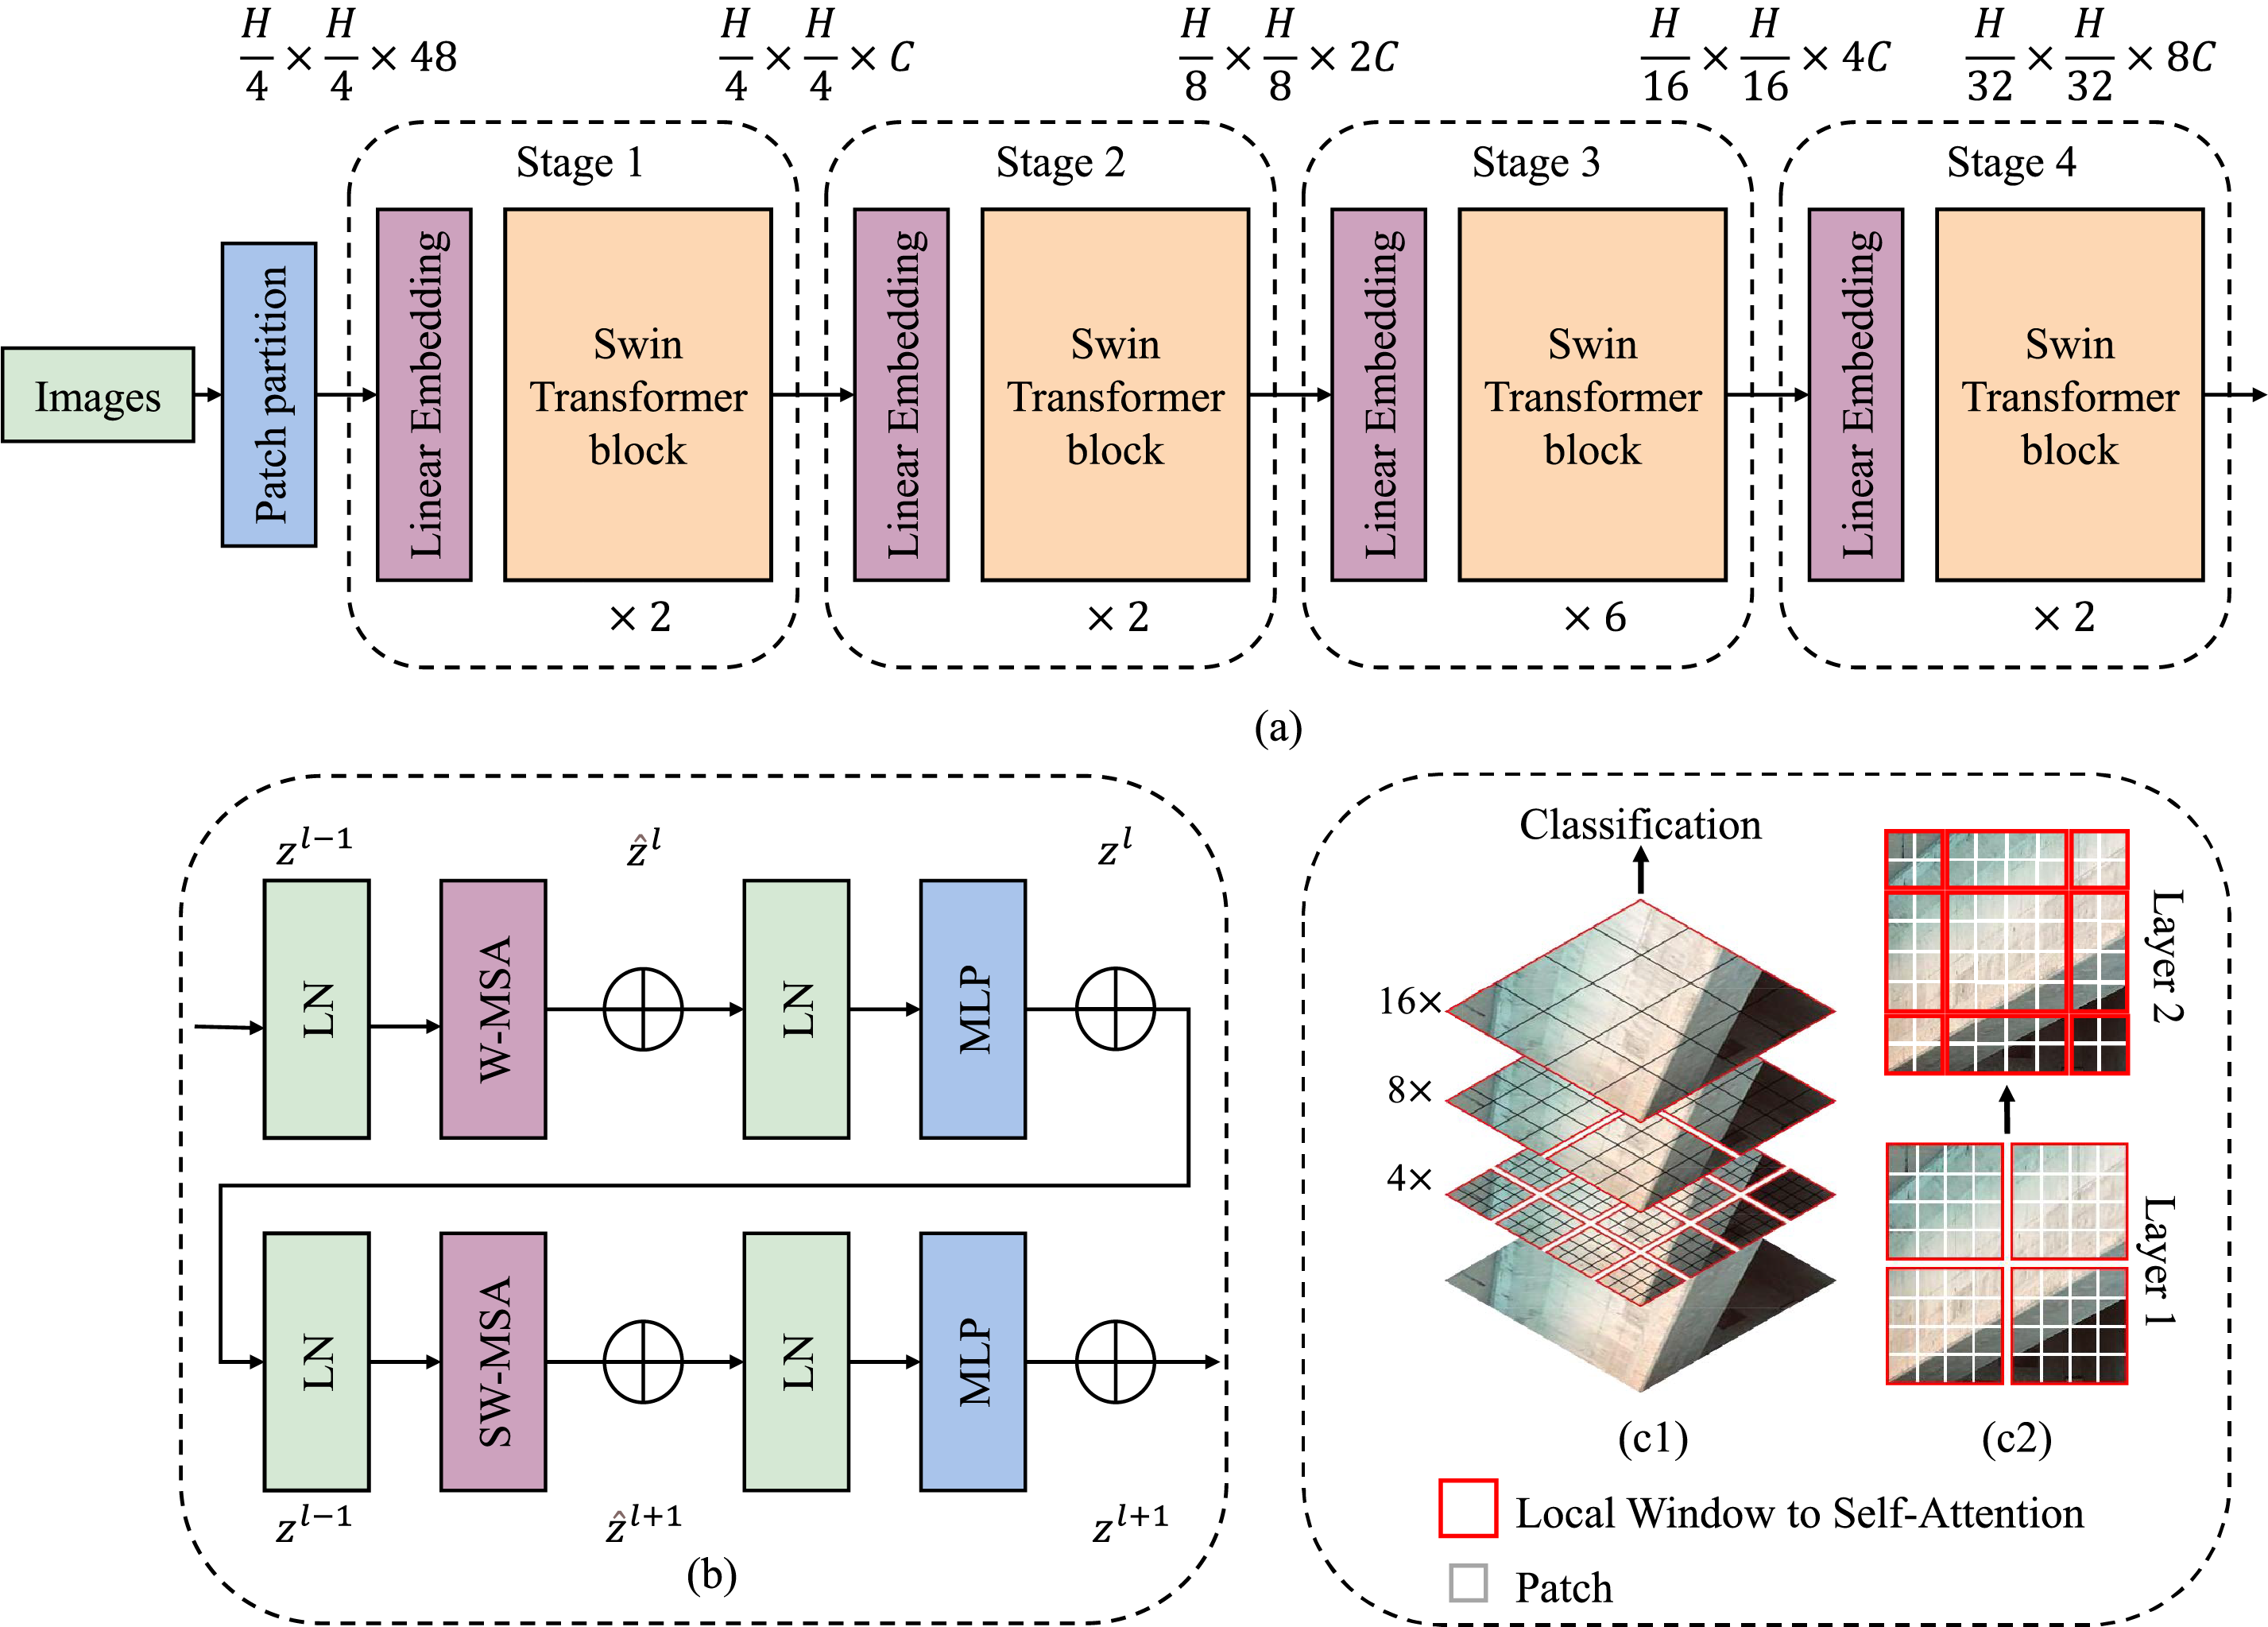
Figure 2: Fundamental architecture of Swin Transformer (a) overall model architecture, (b) SWin Transformer block, (c) shifted window attention mechanism
The architecture is composed of four hierarchical stages, each performing downsampling by merging neighboring patches and doubling the channel size. The output resolutions and dimensions at each stage are: Stage 1:
To enable information flow across windows, a shifted window mechanism (SW-MSA) is applied in alternating layers. As shown in Fig. 2b, this involves shifting the window partitioning by
Fig. 2c visually demonstrates the hierarchical nature of Swin Transformer, where the attention progressively expands its receptive field through window shifting. By integrating patch-level locality and hierarchical abstraction, the Swin Transformer achieves efficient representation learning, making it particularly effective for complex post-disaster visual analysis tasks.
By leveraging its hierarchical architecture, shifted window attention mechanism, and localized self-attention computation, the Swin Transformer effectively balances representational capacity and computational efficiency. These characteristics make it particularly well-suited for dense and complex visual recognition tasks, such as post-earthquake structural damage assessment.
The Swin Transformer’s ability to handle long-range dependencies efficiently, combined with its hierarchical feature extraction, gives it an advantage over traditional CNNs, which typically struggle with high computational costs and limited receptive fields. In CNNs, the receptive field increases gradually with deeper layers, but this process is often computationally expensive and slow to converge. In contrast, the Swin Transformer adopts a more efficient mechanism: it employs local self-attention within fixed windows and progressively expands the receptive field through window shifting. This strategy enables the model to capture both local and global features without incurring significant computational overhead. Furthermore, its hierarchical architecture processes visual information at multiple scales, allowing for more effective extraction of fine-grained details and contextual cues than conventional CNNs [41,42]. As a result, the Swin Transformer is particularly well-suited for tasks that require comprehensive spatial understanding, such as structural damage assessment.
Building upon these strengths, the proposed STPEIC framework adopts a dual-model architecture, in which two Swin Transformer models are trained independently for structural component classification and damage level prediction, respectively. This design choice is intentional and reflects the distinct nature of the two tasks: component classification primarily involves recognizing geometric forms (e.g., beams, columns, or walls), whereas damage assessment focuses on detecting fine-grained texture anomalies (e.g., cracks, spalling). Training separate models allows each to fully exploit the Swin Transformer’s capacity for task-specific feature learning, free from interference caused by competing objectives. Moreover, this modular design enhances training stability, simplifies optimization, and improves interpretability, as the attention maps generated by each model can be independently analyzed and validated.
Nevertheless, training such deep architectures from scratch often requires extensive labeled data, which is difficult to obtain in disaster-specific domains. To address this challenge, we adopt a transfer learning approach: pretrained Swin Transformer weights are fine-tuned on our domain-specific dataset, enabling efficient adaptation with limited annotated samples. The next section details this adaptation process, including the training pipeline, optimization strategy, and evaluation procedures.
2.3 Discussion of Transfer Learning
This paper correctly identifies transfer learning as a key strategy. However, it would be valuable to briefly explain the theoretical underpinnings of why it is effective in this context. Transfer learning is effective because it allows a model to leverage knowledge learned from a large-scale, general dataset (such as ImageNet [23]) and adapt it to a domain-specific task with limited labeled data. The model is initialized with pretrained weights
Mathematically, transfer learning involves minimizing a loss function
To effectively adapt the Swin Transformer for domain-specific post-earthquake image classification, a structured transfer learning strategy is employed, as illustrated in Fig. 3. The process begins with the initialization of model parameters using pretrained weights from large-scale datasets (e.g., ImageNet [23]), which provide a strong generalizable prior. In this study, the Swin Transformer base model is used.
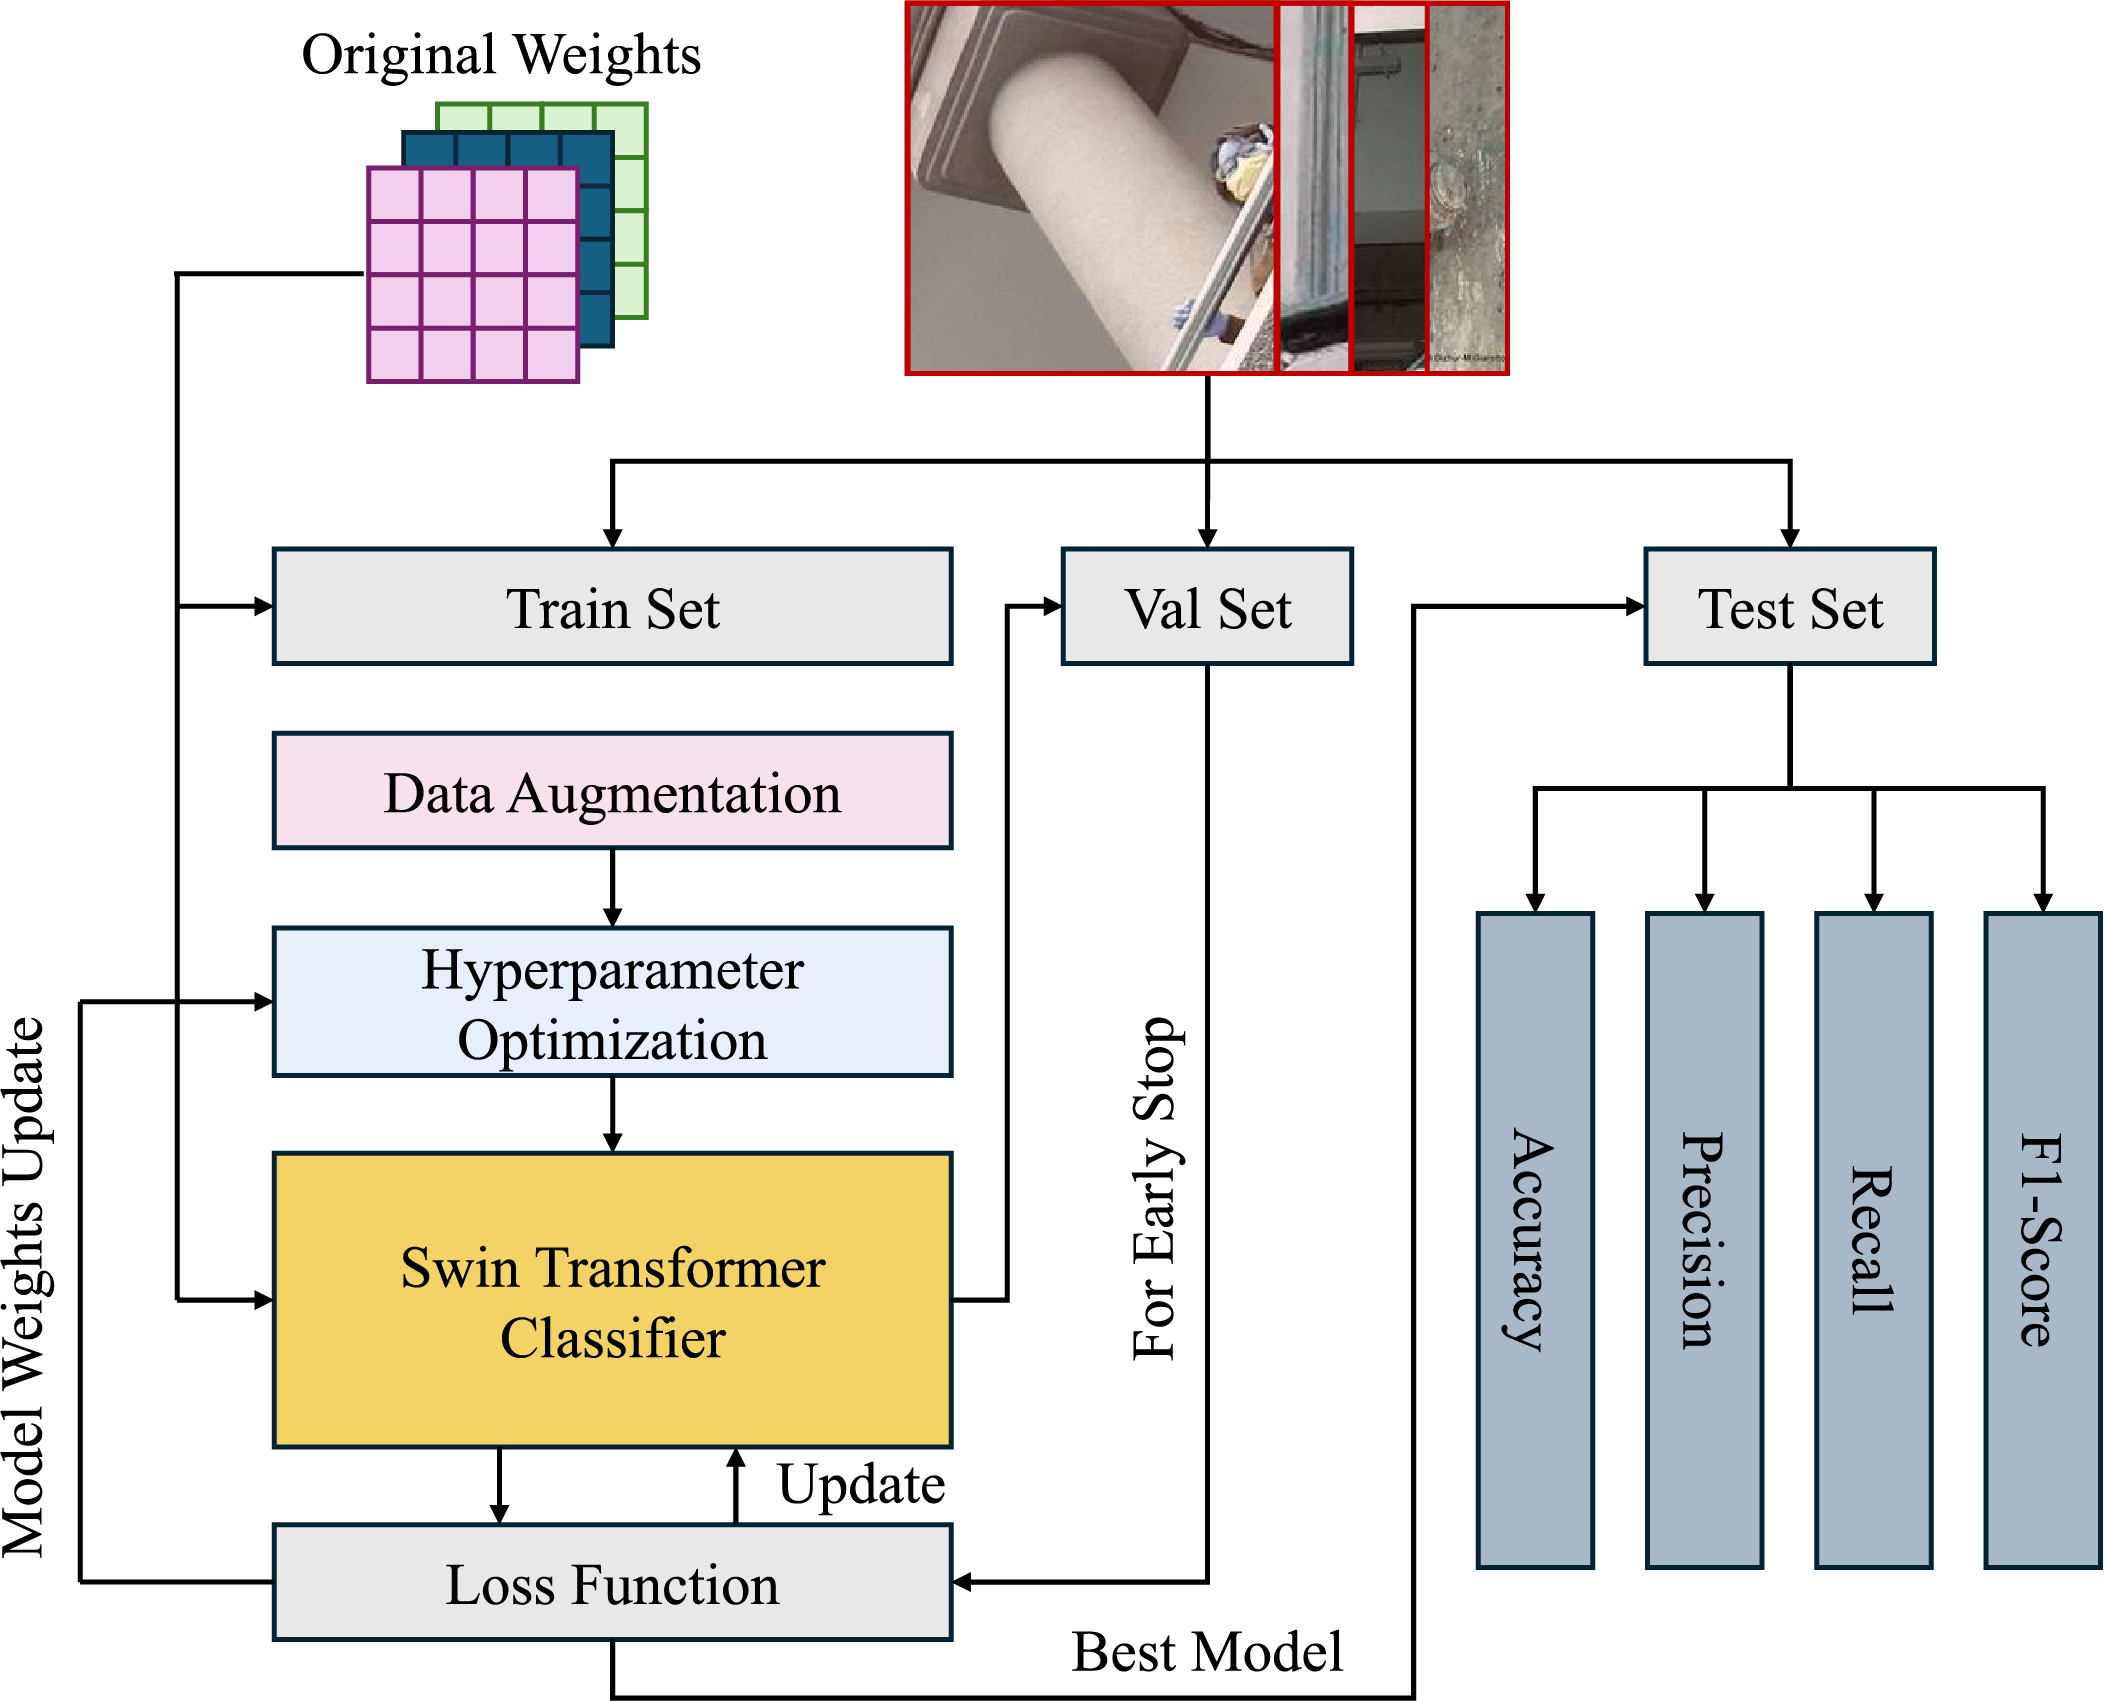
Figure 3: Architecture of transfer learning
The pipeline consists of three main stages: dataset preparation, full model fine-tuning, and performance optimization. First, the earthquake image dataset is split into training, validation, and test sets. To enhance model robustness and mitigate overfitting, data augmentation techniques such as random cropping, flipping, color jittering, and normalization are applied to the training set. These augmentations simulate real-world variations, ensuring that the model learns from diverse conditions.
Next, the augmented data is passed through the Swin Transformer backbone, where the entire model, including both low-level and high-level layers, is fine-tuned. This full fine-tuning approach enables the model to learn both general features from the pretrained weights and domain-specific patterns relevant to post-earthquake damage assessment. By fine-tuning all layers, the model adapts fully to the target domain, learning to capture complex visual cues and nuanced structural details.
To further optimize model performance, an automatic hyperparameter tuning module based on Optuna is integrated [43]. Optuna uses Bayesian optimization to intelligently search for the optimal hyperparameter combinations within a defined search space, leveraging algorithms like the Tree-structured Parzen Estimator (TPE). This framework optimizes key hyperparameters, such as learning rate, dropout, and batch size (as shown in Table 1), ensuring that the model configuration is well-suited for the classification task [44–46].
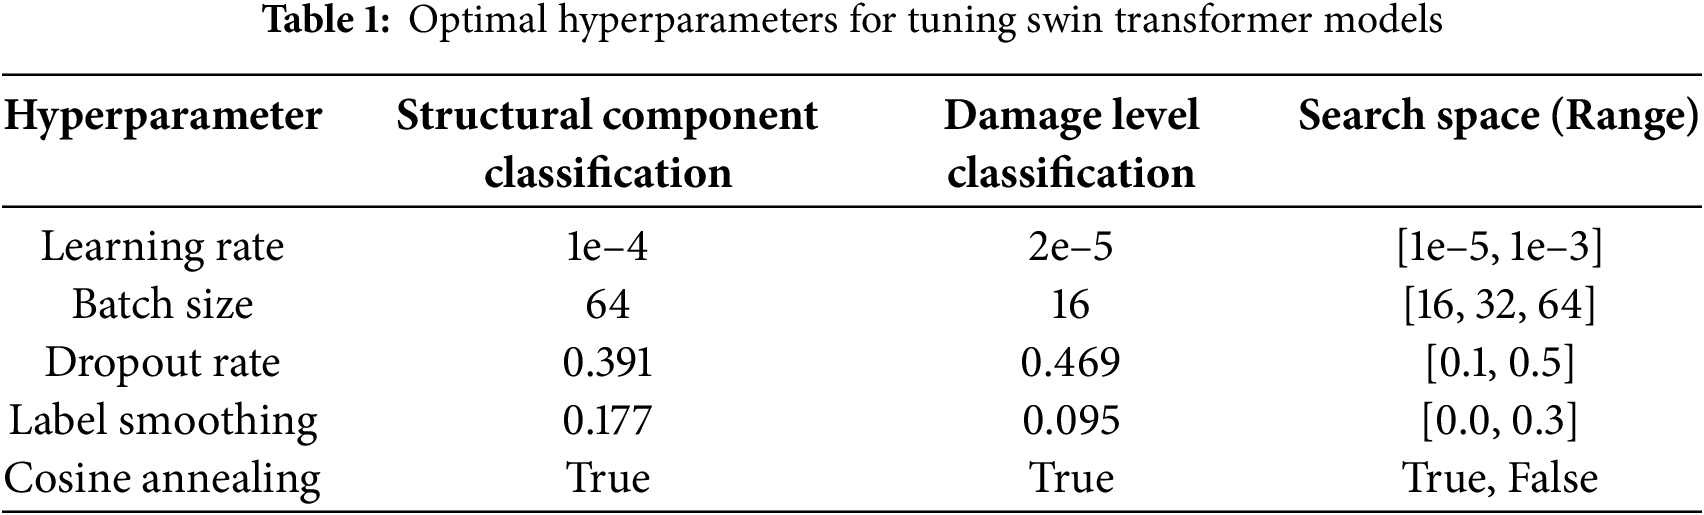
Among these hyperparameters, learning rate controls how quickly the model adapts during training, requiring careful optimization to achieve smooth convergence. The batch size influences computational efficiency and generalization, with smaller sizes often yielding better generalization at the cost of slower training. Dropout is used to prevent overfitting by forcing the model to generalize better, while label smoothing encourages the model to be less confident in its predictions, improving its ability to generalize. Finally, cosine annealing helps dynamically adjust the learning rate during training, enabling smoother and faster convergence.
The model is trained by minimizing the cross-entropy loss function, defined in Eq. (5), where C represents the number of target classes,
To prevent overfitting, model performance on the validation set is continuously monitored. An early stopping mechanism halts training once the validation performance no longer improves after a specified number of epochs. After training, the best-performing model is selected and evaluated on the test set using standard classification metrics, including accuracy, precision, recall, and F1-score, to assess its predictive power and generalization ability [47].
This full fine-tuning approach not only accelerates convergence but also minimizes the risk of overfitting in low-data settings. By fine-tuning the entire network on domain-specific post-earthquake imagery, the model effectively learns critical visual cues, making it highly suitable for structural damage assessment in real-world scenarios [48,49].
Building upon the discussion of architectural principles and the training pipeline, the next section explores the development and evaluation of two Swin Transformer-based classification models: one for structural component identification and the other for damage level prediction. This section presents their implementation, performance metrics, and interpretability results, offering a comprehensive discussion of their applicability and effectiveness in real-world post-disaster scenarios.
3 Development and Discussion of Swin Transformer Based PE Classification Model
Building on the architectural foundation and transfer learning strategy outlined above, this section details the implementation and evaluation of two Swin Transformer-based classifiers designed for post-earthquake (PE) structural image analysis. Specifically, two independent models within the STPEIC framework are fine-tuned in this section: one for structural component identification and the other for damage level classification. To ensure robust generalization, we first analyze the distribution of labeled datasets and then describe the data augmentation techniques employed to address class imbalance and enhance training diversity. Next, we outline the evaluation metrics used to assess model performance across different tasks. With the data distribution and evaluation framework in place, the remainder of this section provides a comprehensive assessment of the training dynamics, validation behavior, and final test performance of the proposed models.
3.1 Dataset Collection and Augmentation
In this study, a publicly available post-earthquake image dataset is used to develop a Swin Transformer-based classification framework for structural component and damage level classification [17]. The dataset includes a wide range of real-world images captured after seismic events, offering diverse visual representations of damaged structures under varying lighting conditions, angles, and backgrounds. Although the original dataset included class annotations, all labels were carefully reviewed and verified by civil engineering experts to ensure consistency and accuracy. The distribution of the datasets for the two classification tasks is shown in Fig. 4.
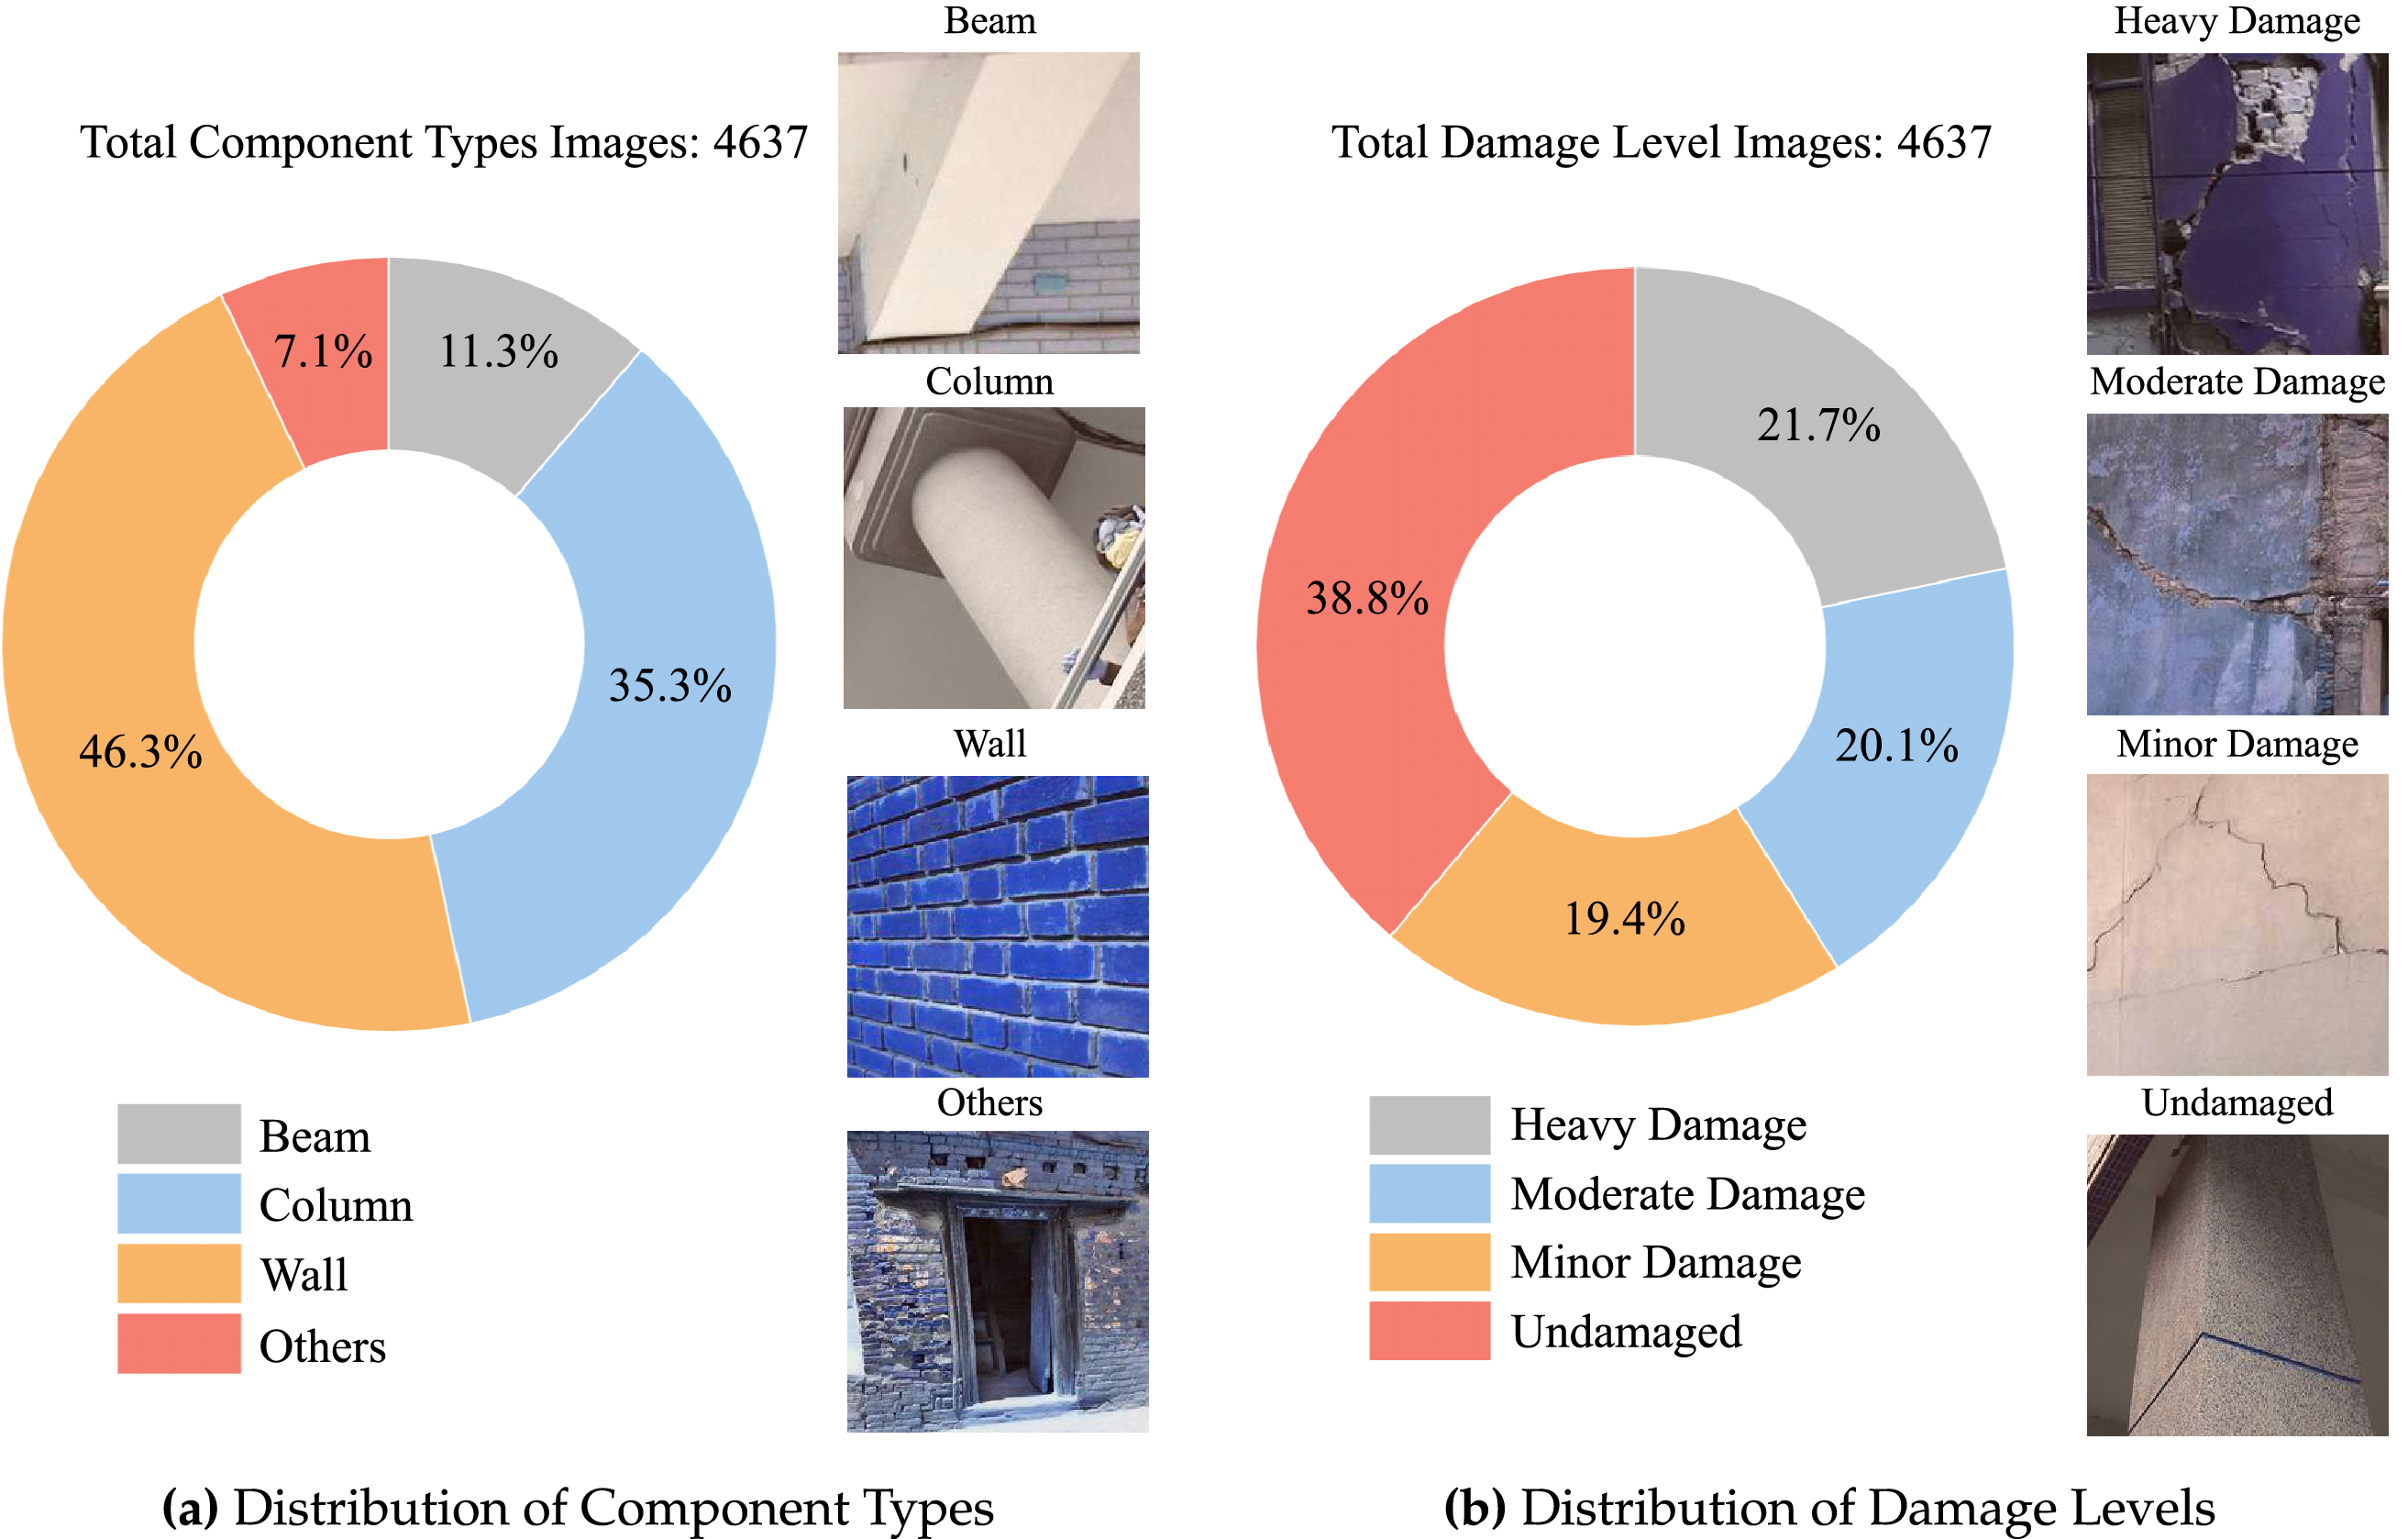
Figure 4: Distribution of component types and damage levels in image datasets
Fig. 4a illustrates the distribution of component types in the dataset. Among the four defined categories—Wall, Column, Beam, and Others—Wall components make up the largest proportion, accounting for 46.3% of the total images. Columns and Beams follow with 35.3% and 11.3%, respectively, while the remaining 7.1% are categorized as “Others,” which includes less common structural elements such as joints and slabs. Fig. 4b presents the distribution of damage levels. Undamaged samples constitute the largest share at 38.8%, followed by Heavy Damage (21.7%), Moderate Damage (20.1%), and Minor Damage (19.4%). This relatively balanced distribution ensures that the model is exposed to a broad range of damage levels during training, facilitating better generalization to real-world post-earthquake scenarios. The example images in Fig. 4 highlight the distinct visual features across different classes and the variation within each category, emphasizing the importance of developing robust classification models.
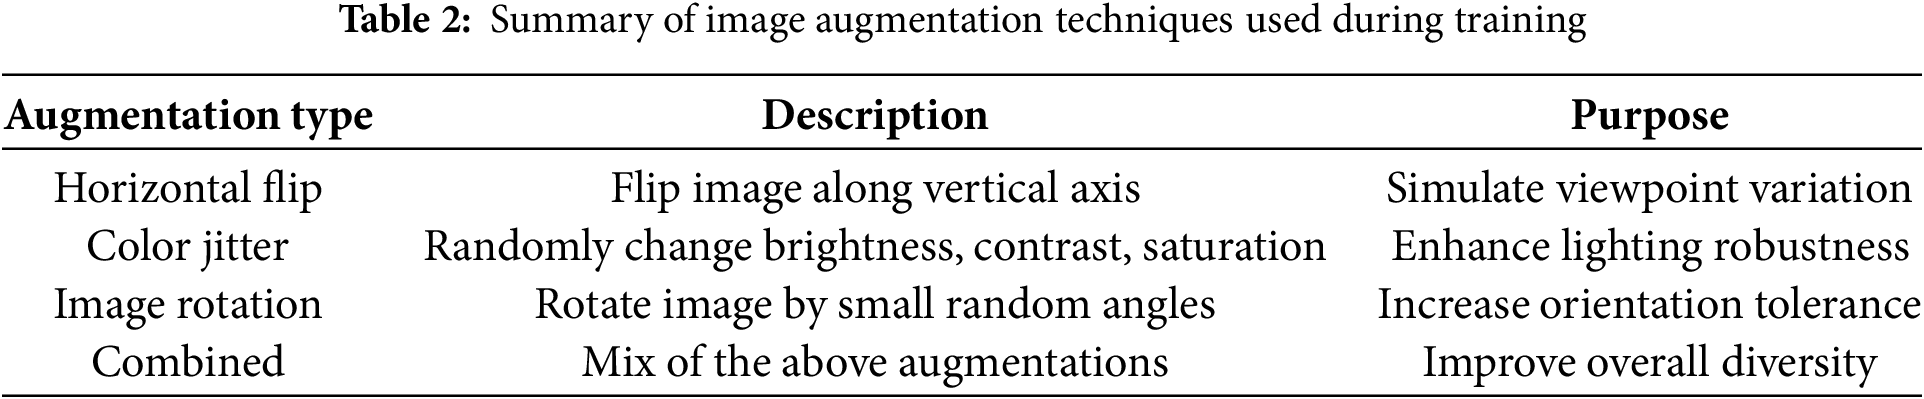
Although the dataset already covers a wide range of post-earthquake scenarios and structural conditions, additional data augmentation techniques are applied during training to further enhance the model’s generalization ability. As shown in Fig. 5, several common image augmentation strategies were utilized, as outlined in Table 2. These augmentations help the model become more resilient to variations commonly encountered in real-world scenarios, such as camera noise, inconsistent framing, and varying environmental conditions.
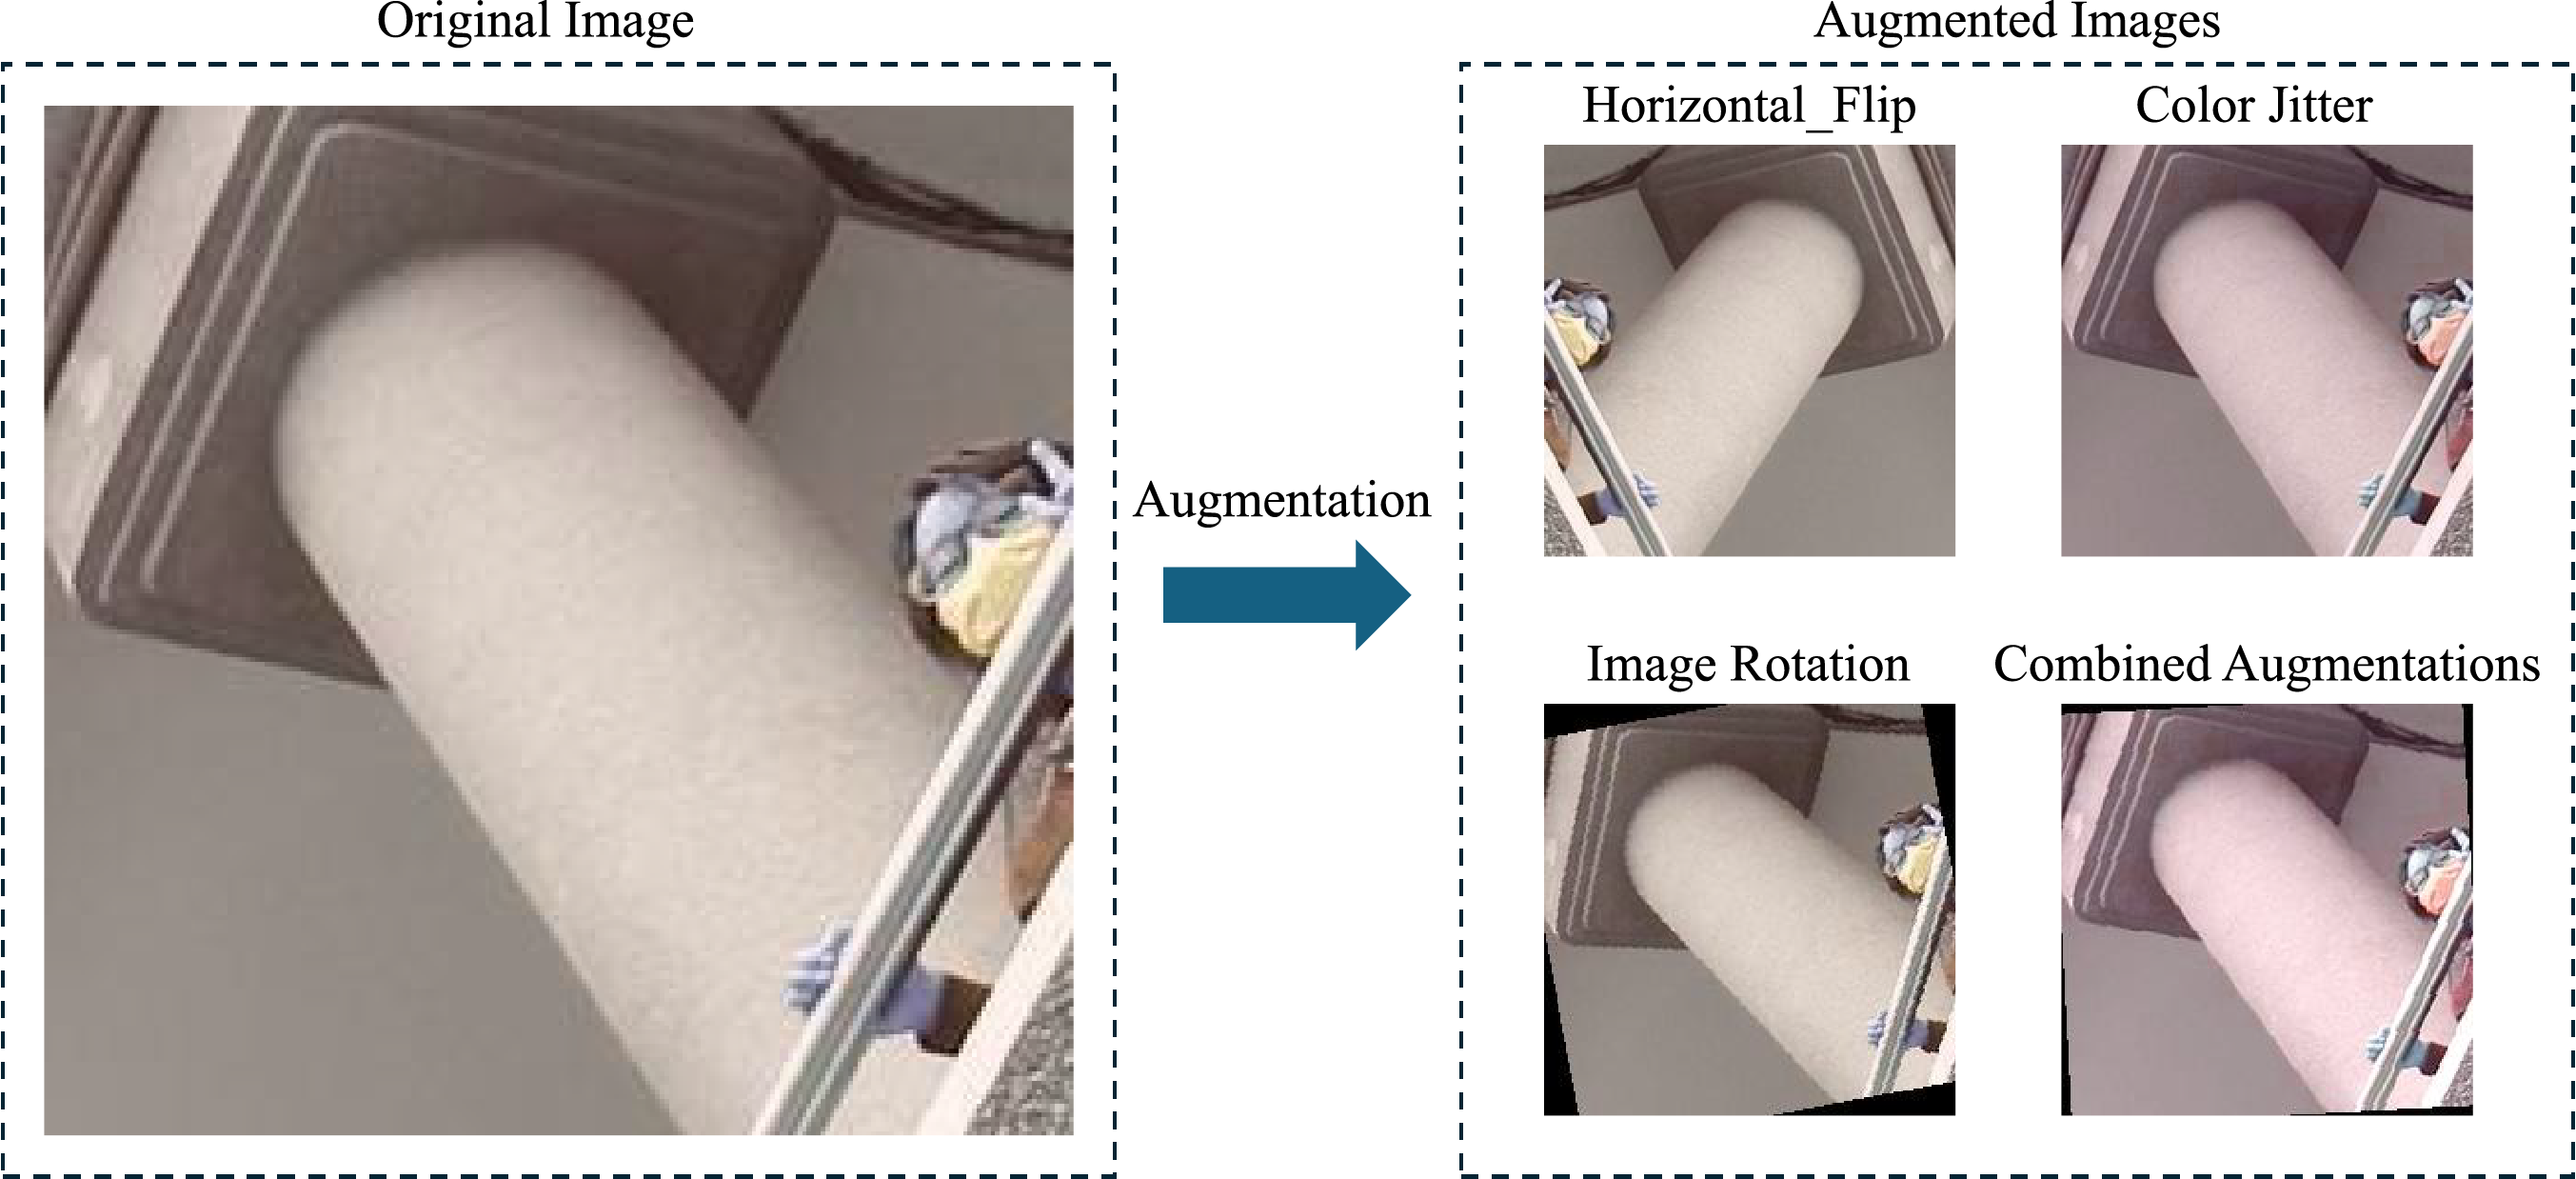
Figure 5: Augmentation process for image enhancement
In summary, this section lays a strong foundation for model development by introducing the data sources, analyzing class distributions, and implementing targeted data augmentation strategies. These steps ensure that the Swin Transformer models are trained on a diverse, well-balanced, and enriched dataset, enhancing their robustness and real-world applicability. With the dataset and augmentation pipeline established, the next step is to define the evaluation metrics used to quantify classification performance. This will be followed by a comprehensive assessment of the fine-tuned models, focusing on their accuracy, generalization capability, and predictive reliability on test sets.
3.2 Evaluation of Classification Model
Building on the data collection and model development phases, this section evaluates the performance of the proposed STPEIC framework. A comprehensive analysis of classification results is presented for both structural component types and damage levels.
First, standard evaluation metrics commonly used in image classification tasks are introduced, followed by a detailed discussion of the model’s quantitative performance. The evaluation of classification performance is based on commonly adopted metrics, including Accuracy, Precision, Recall, and F1-Score. These metrics are defined as shown in Table 3, where TP, FP, TN, and FN denote true positives, false positives, true negatives, and false negatives, respectively.
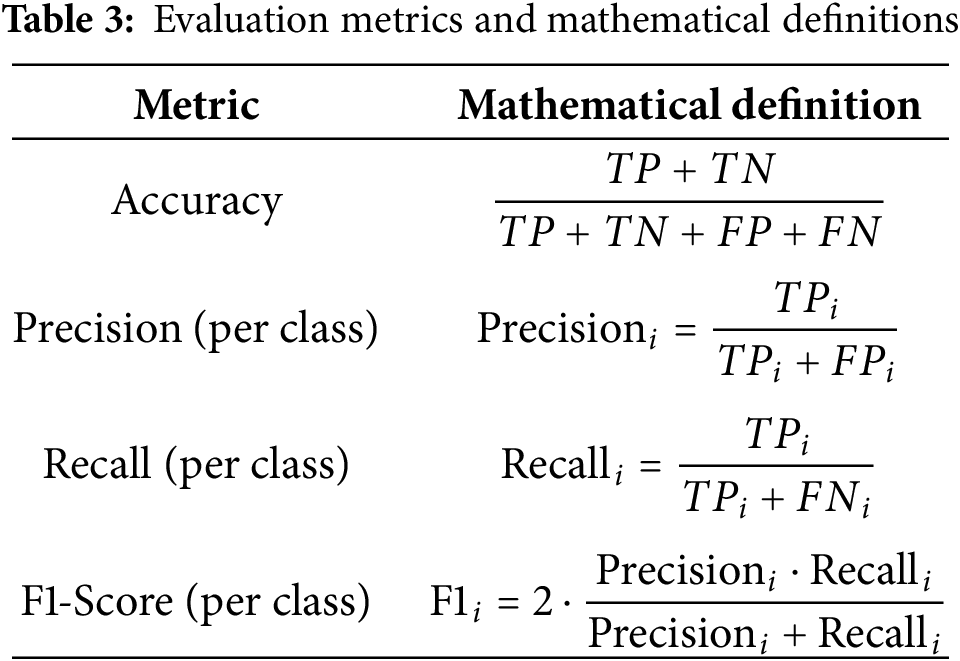
Each metric serves a distinct purpose in evaluating classification performance. Accuracy provides a general measure of correctness across all predictions but can be misleading in the presence of class imbalance. Precision evaluates the reliability of positive predictions, while Recall assesses the model’s ability to retrieve all relevant instances. F1-Score combines Precision and Recall into a single harmonic mean, offering a balanced view when both false positives and false negatives are of concern.
In addition to these scalar metrics, a confusion matrix is used to provide a more detailed view of classification outcomes. For a multi-class task, the confusion matrix is a square matrix where the element in row
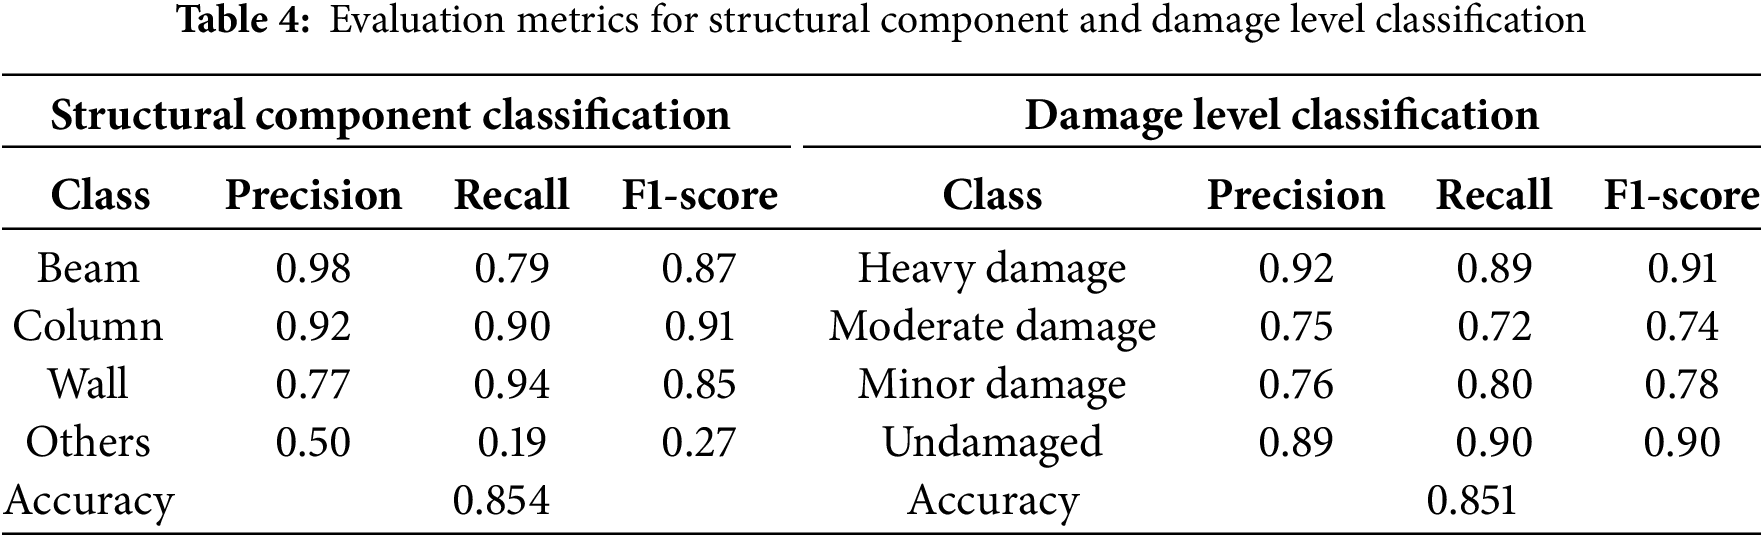
Table 4 summarizes the classification performance for both structural component and damage level prediction tasks. The model achieves high accuracy in both tasks, with 85.4% for structural component classification and 85.1% for damage level classification. The Swin Transformer demonstrates strong precision, recall, and F1-scores across most classes, highlighting its ability to learn discriminative features even under the challenging visual conditions typically encountered in post-earthquake scenarios.
The confusion matrices in Fig. 6 offer a more detailed view of class-wise performance. For structural component classification, the model performs consistently well on the Beam, Column, and Wall classes, with most columns and walls being correctly classified. Occasional confusion arises between similar vertical or planar elements. However, the performance for the Others class is notably lower. As shown in the matrix, a significant number of Others samples are misclassified as Wall or Column. This can be attributed to the heterogeneous nature of the Others category, which includes a wide range of small or ambiguous structural elements, such as joints, door frames, and edge components, that are difficult to define consistently.
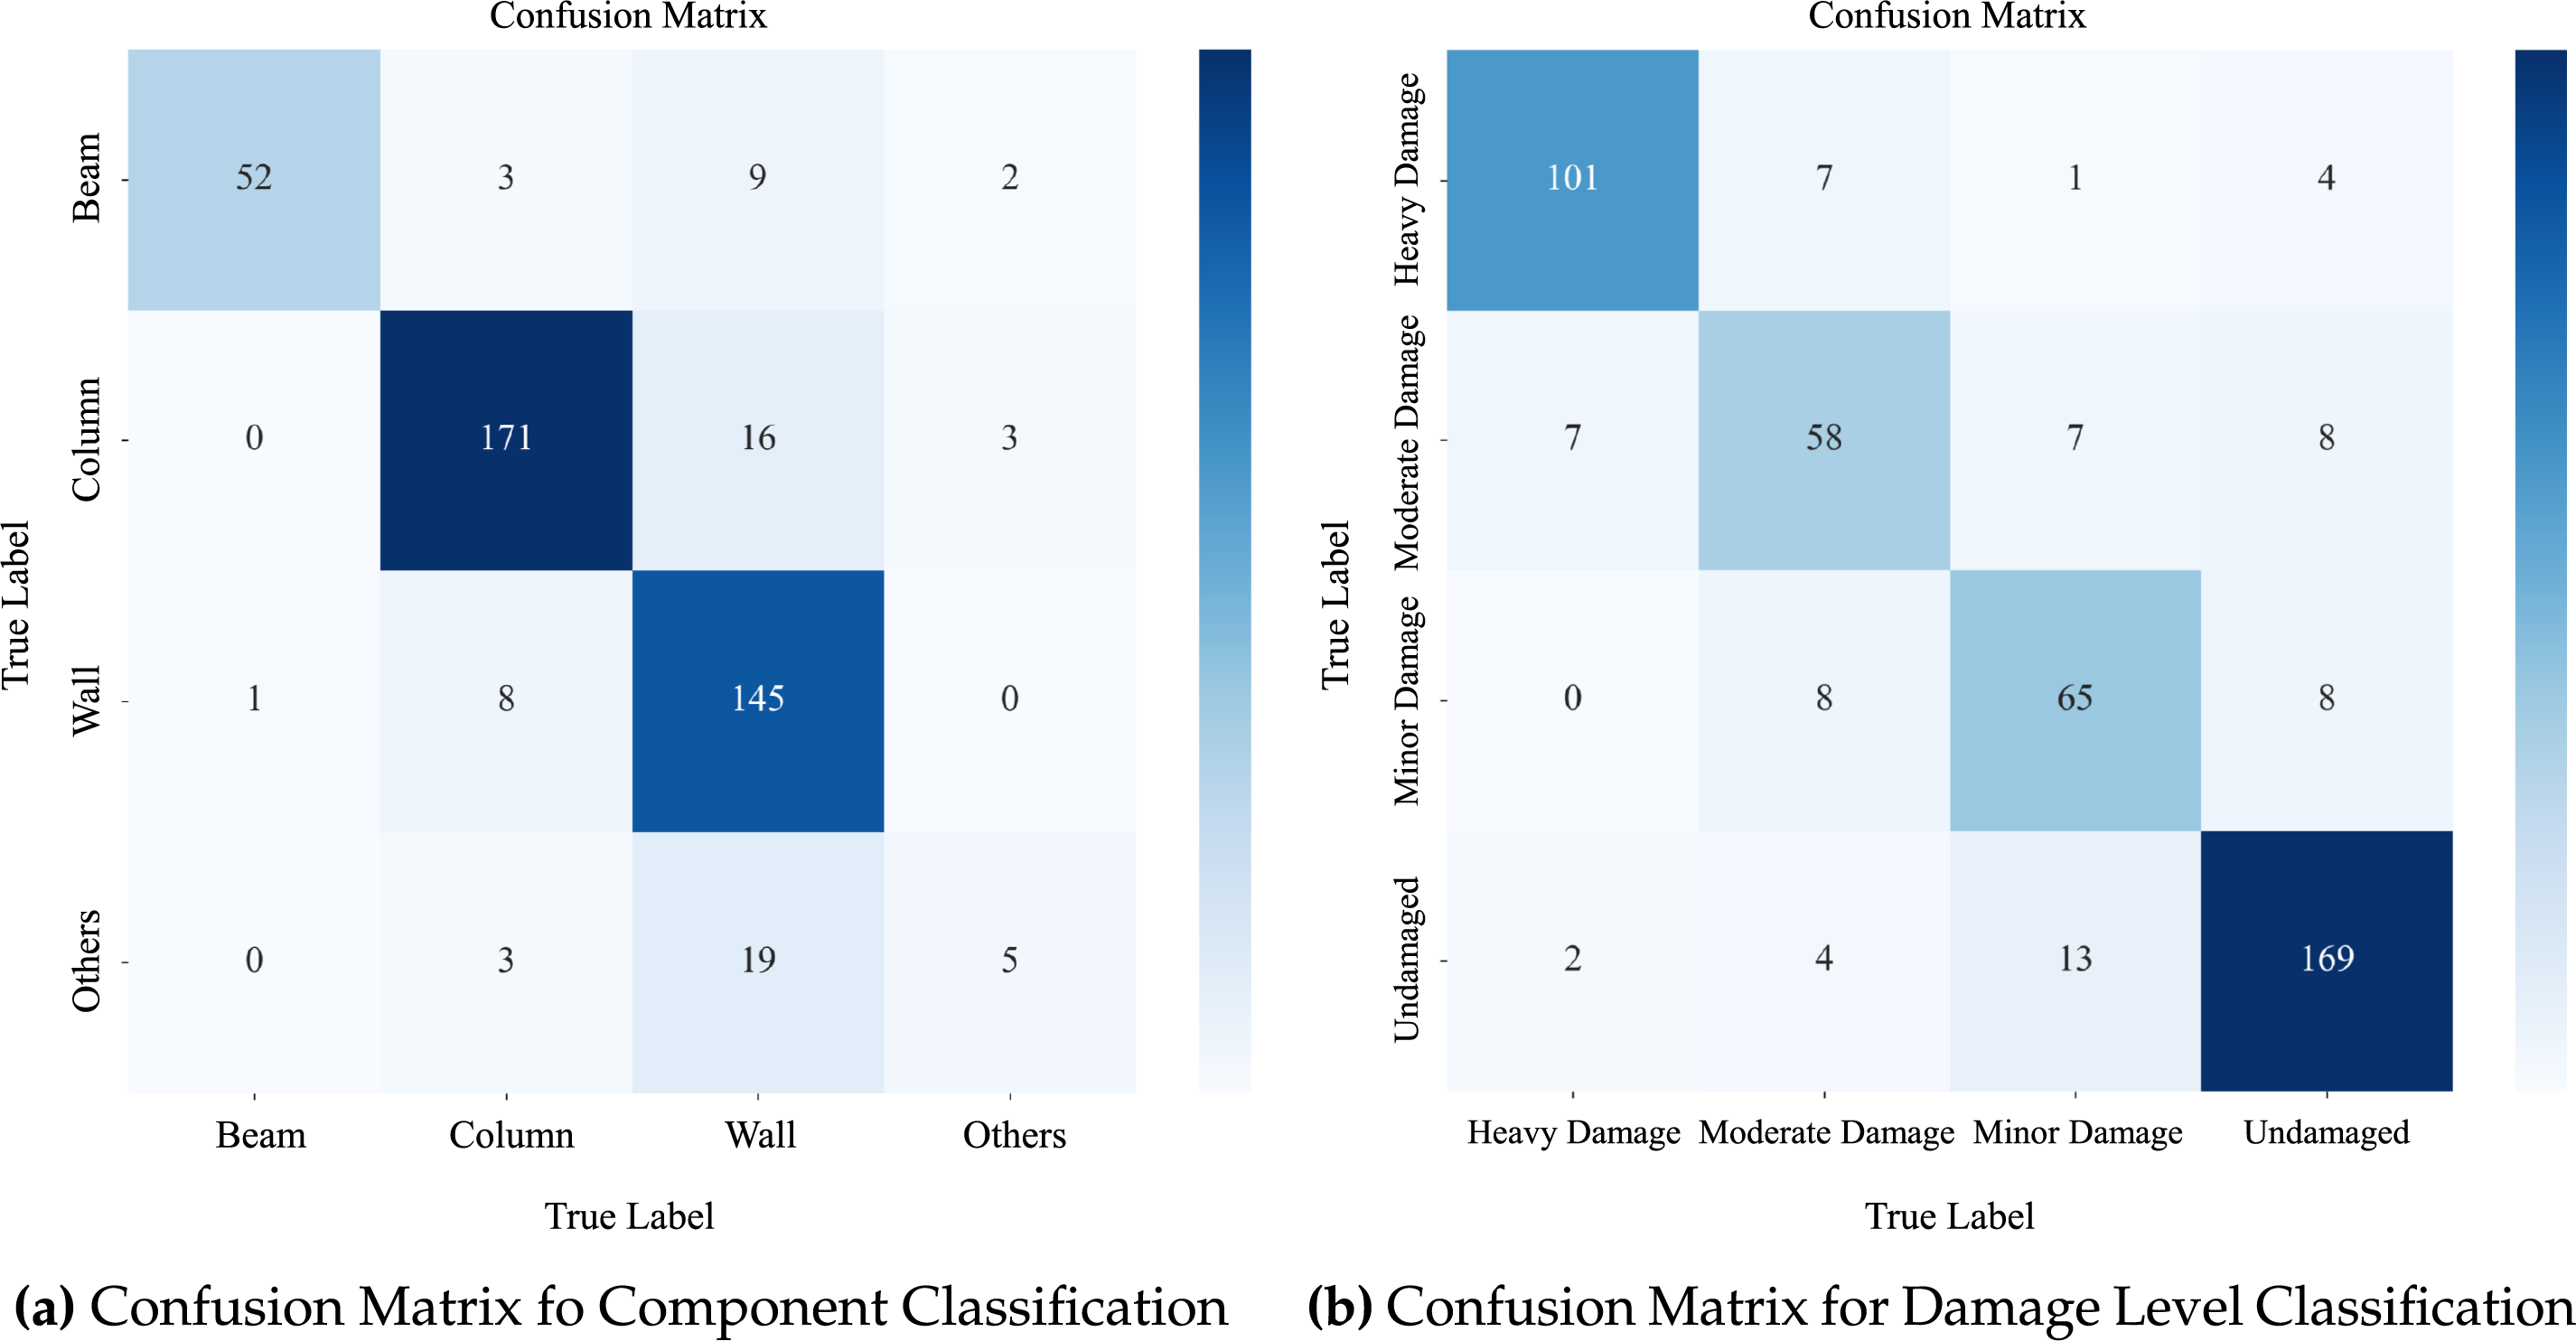
Figure 6: Confusion matrix for structural component classification and damage level classification
In contrast, damage level classification demonstrates uniformly high performance across all four categories. The model is particularly accurate in distinguishing heavy damage and undamaged conditions. Some overlap is observed between the moderate and minor damage levels, which is expected due to subtle visual transitions and the subjective nature of labeling in borderline cases.
In summary, the Swin Transformer-based classification framework exhibits strong and reliable performance in both structural component and damage level recognition tasks. To further explore the model’s decision-making process, the next section presents an interpretability analysis using gradient-weighted class activation mapping (Grad-CAM). This analysis aims to determine whether the model focuses on semantically meaningful structural features and damage cues during prediction, and to assess how well its attention patterns align with expert knowledge.
3.3 Discussion of Interpretability Analysis
While achieving high classification accuracy is essential, understanding how a model arrives at its predictions is equally important, especially in high-stakes domains like post-earthquake structural assessment. Deep learning models, particularly Transformer-based architectures, are often criticized as “black boxes,” which limits their trustworthiness and adoption in engineering practice. To address this challenge, this section explores the interpretability of the proposed STPEIC framework by analyzing the visual attention patterns of the trained Swin Transformer models. Specifically, attention-based heatmap techniques are employed to highlight the image regions that contribute most to the model’s decisions. These visual explanations help verify whether the model’s focus aligns with meaningful structural and damage features, thereby enhancing confidence in its predictions and supporting human-in-the-loop decision-making.
To improve transparency in model decisions and validate the semantic relevance of predictions, the Gradient-weighted Class Activation Mapping (Grad-CAM) method is employed for visual interpretability [50,51]. Grad-CAM generates a localization map that highlights the regions in an input image most influential for a specific class prediction. Given the score
The
As Transformer models rely on self-attention mechanisms rather than convolutions, Grad-CAM’s typical approach of identifying the most influential regions in convolutional feature maps requires adaptation. In this study, the adaptation was achieved by leveraging the attention weights from the final layers of the Swin Transformer, which reflect the importance of specific image regions for the prediction. This attention mechanism serves as a natural analog to feature maps in CNNs, allowing Grad-CAM to produce meaningful and interpretable heatmaps.
For structural component classification and damage level classification tasks, the attention maps and corresponding class probability distributions are shown in Figs. 7 and 8, respectively.
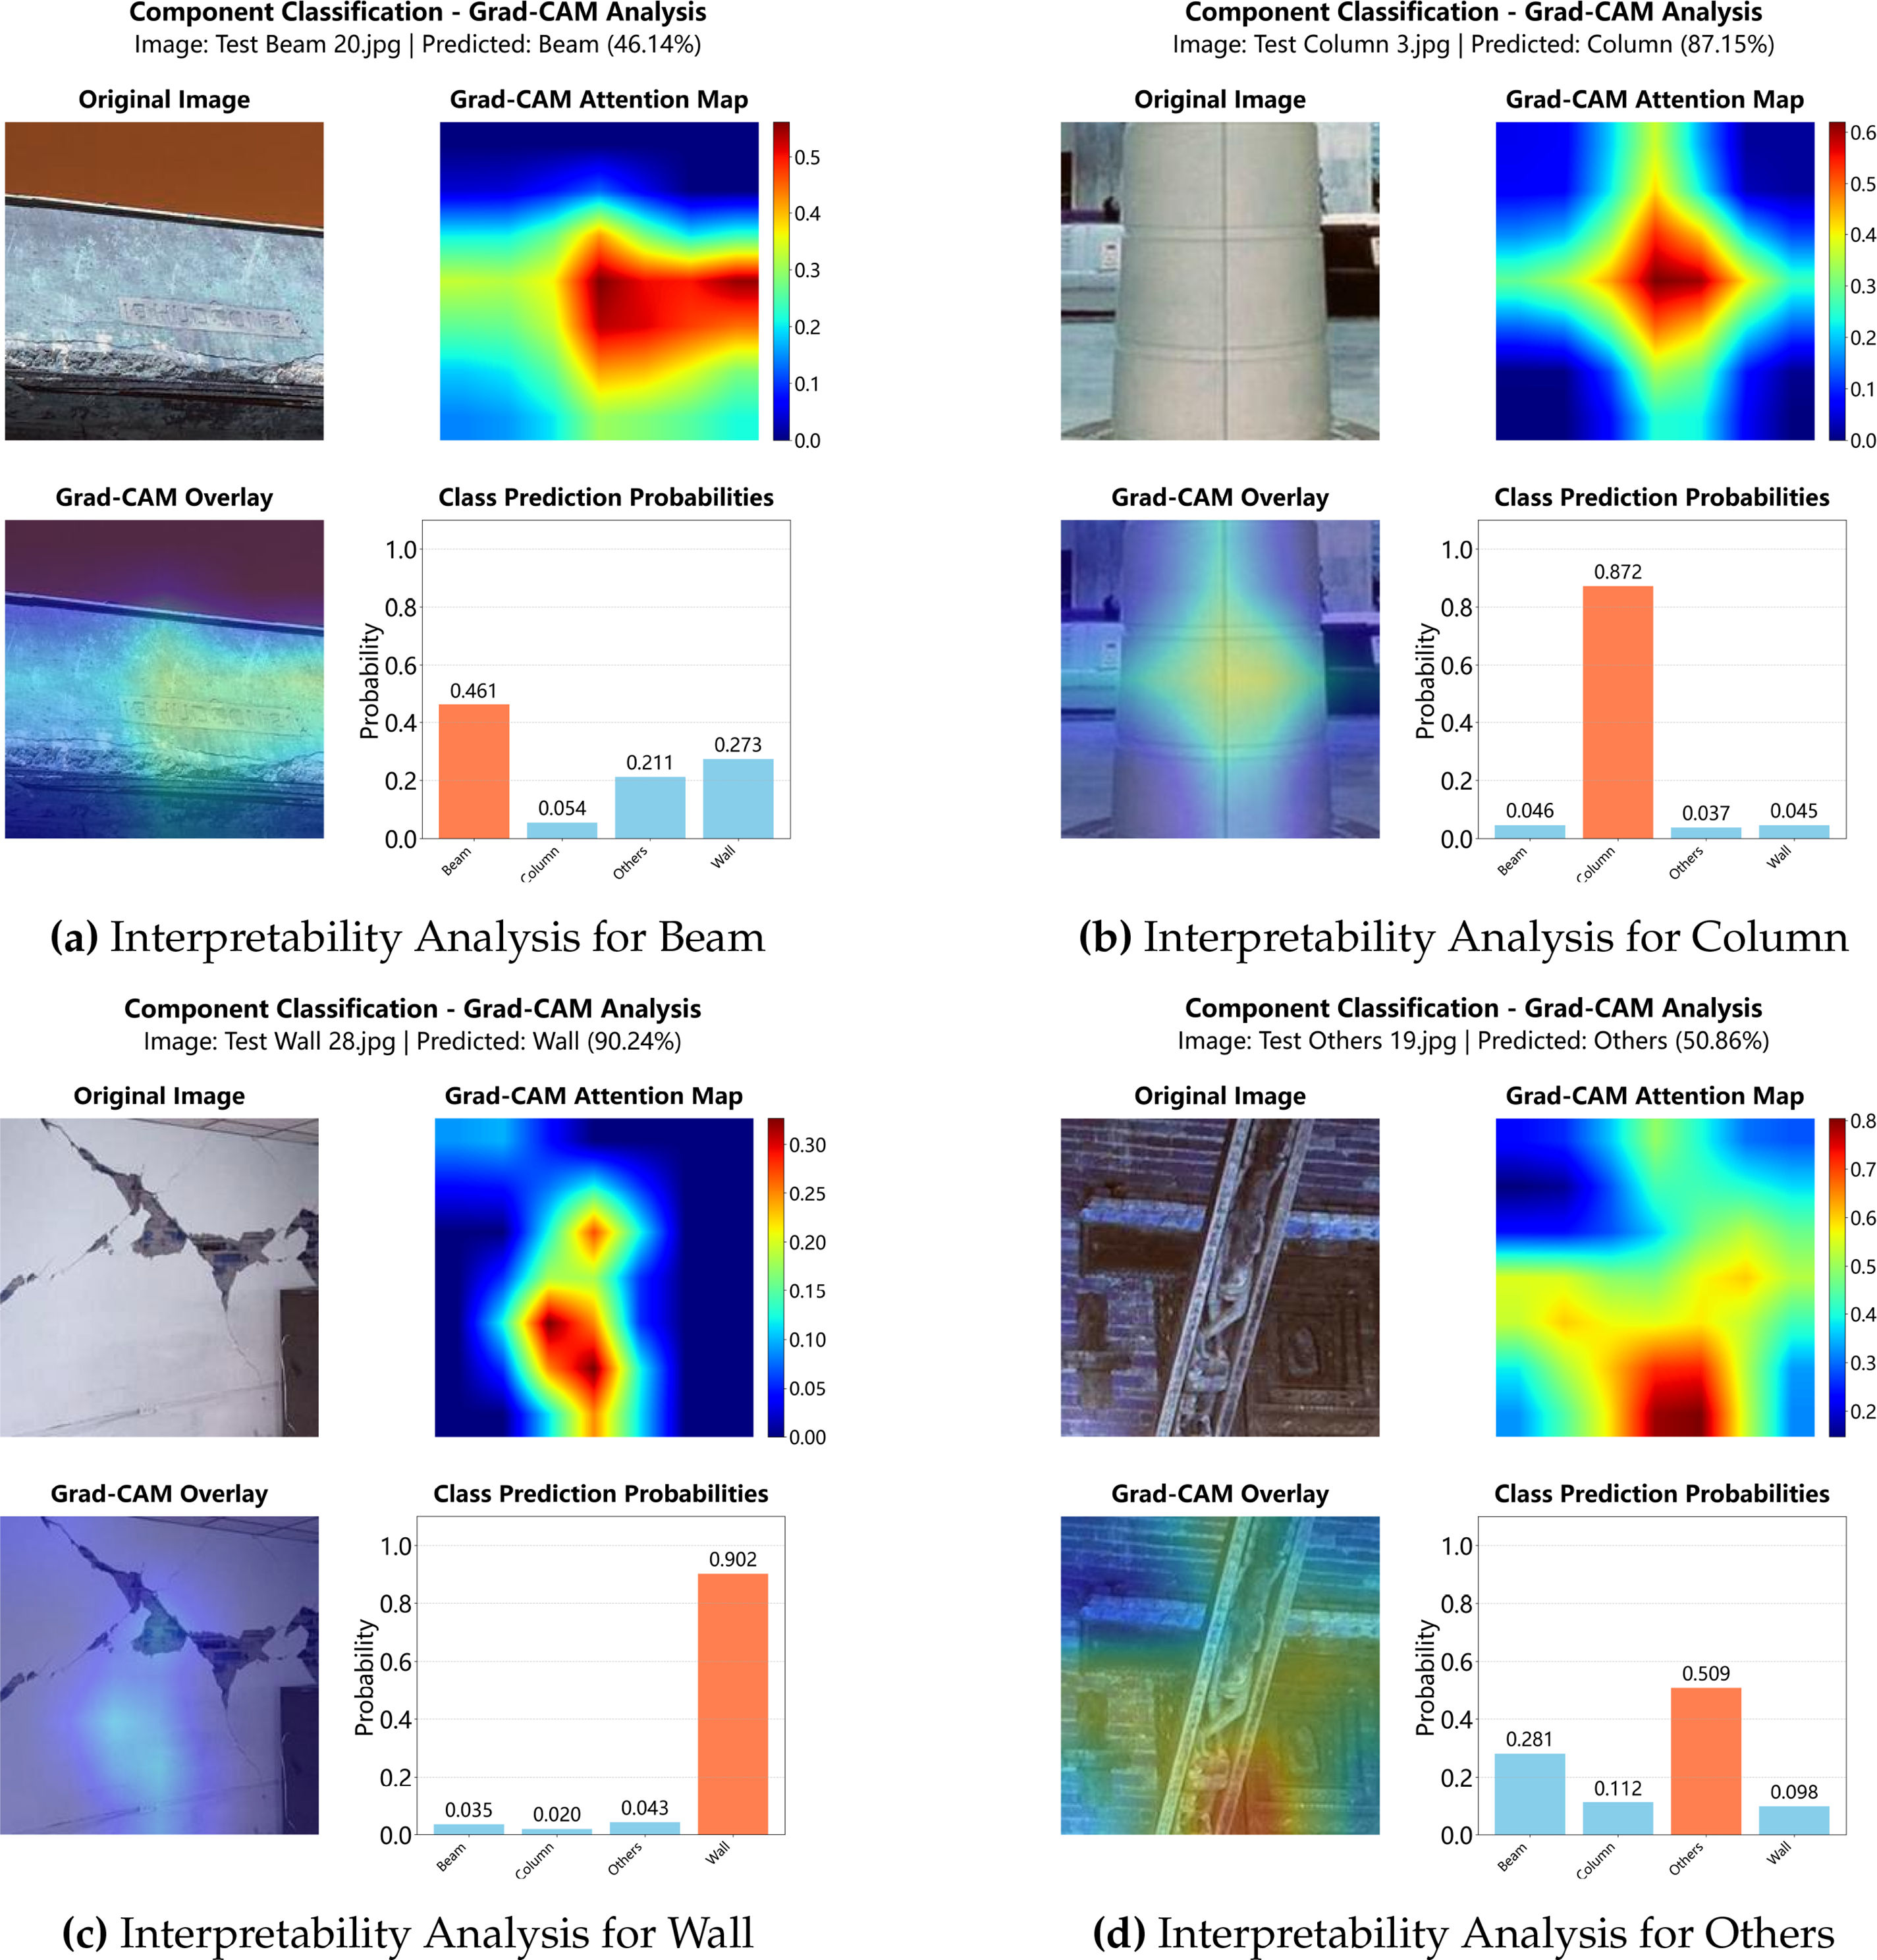
Figure 7: Interpretability analysis for structural component classification
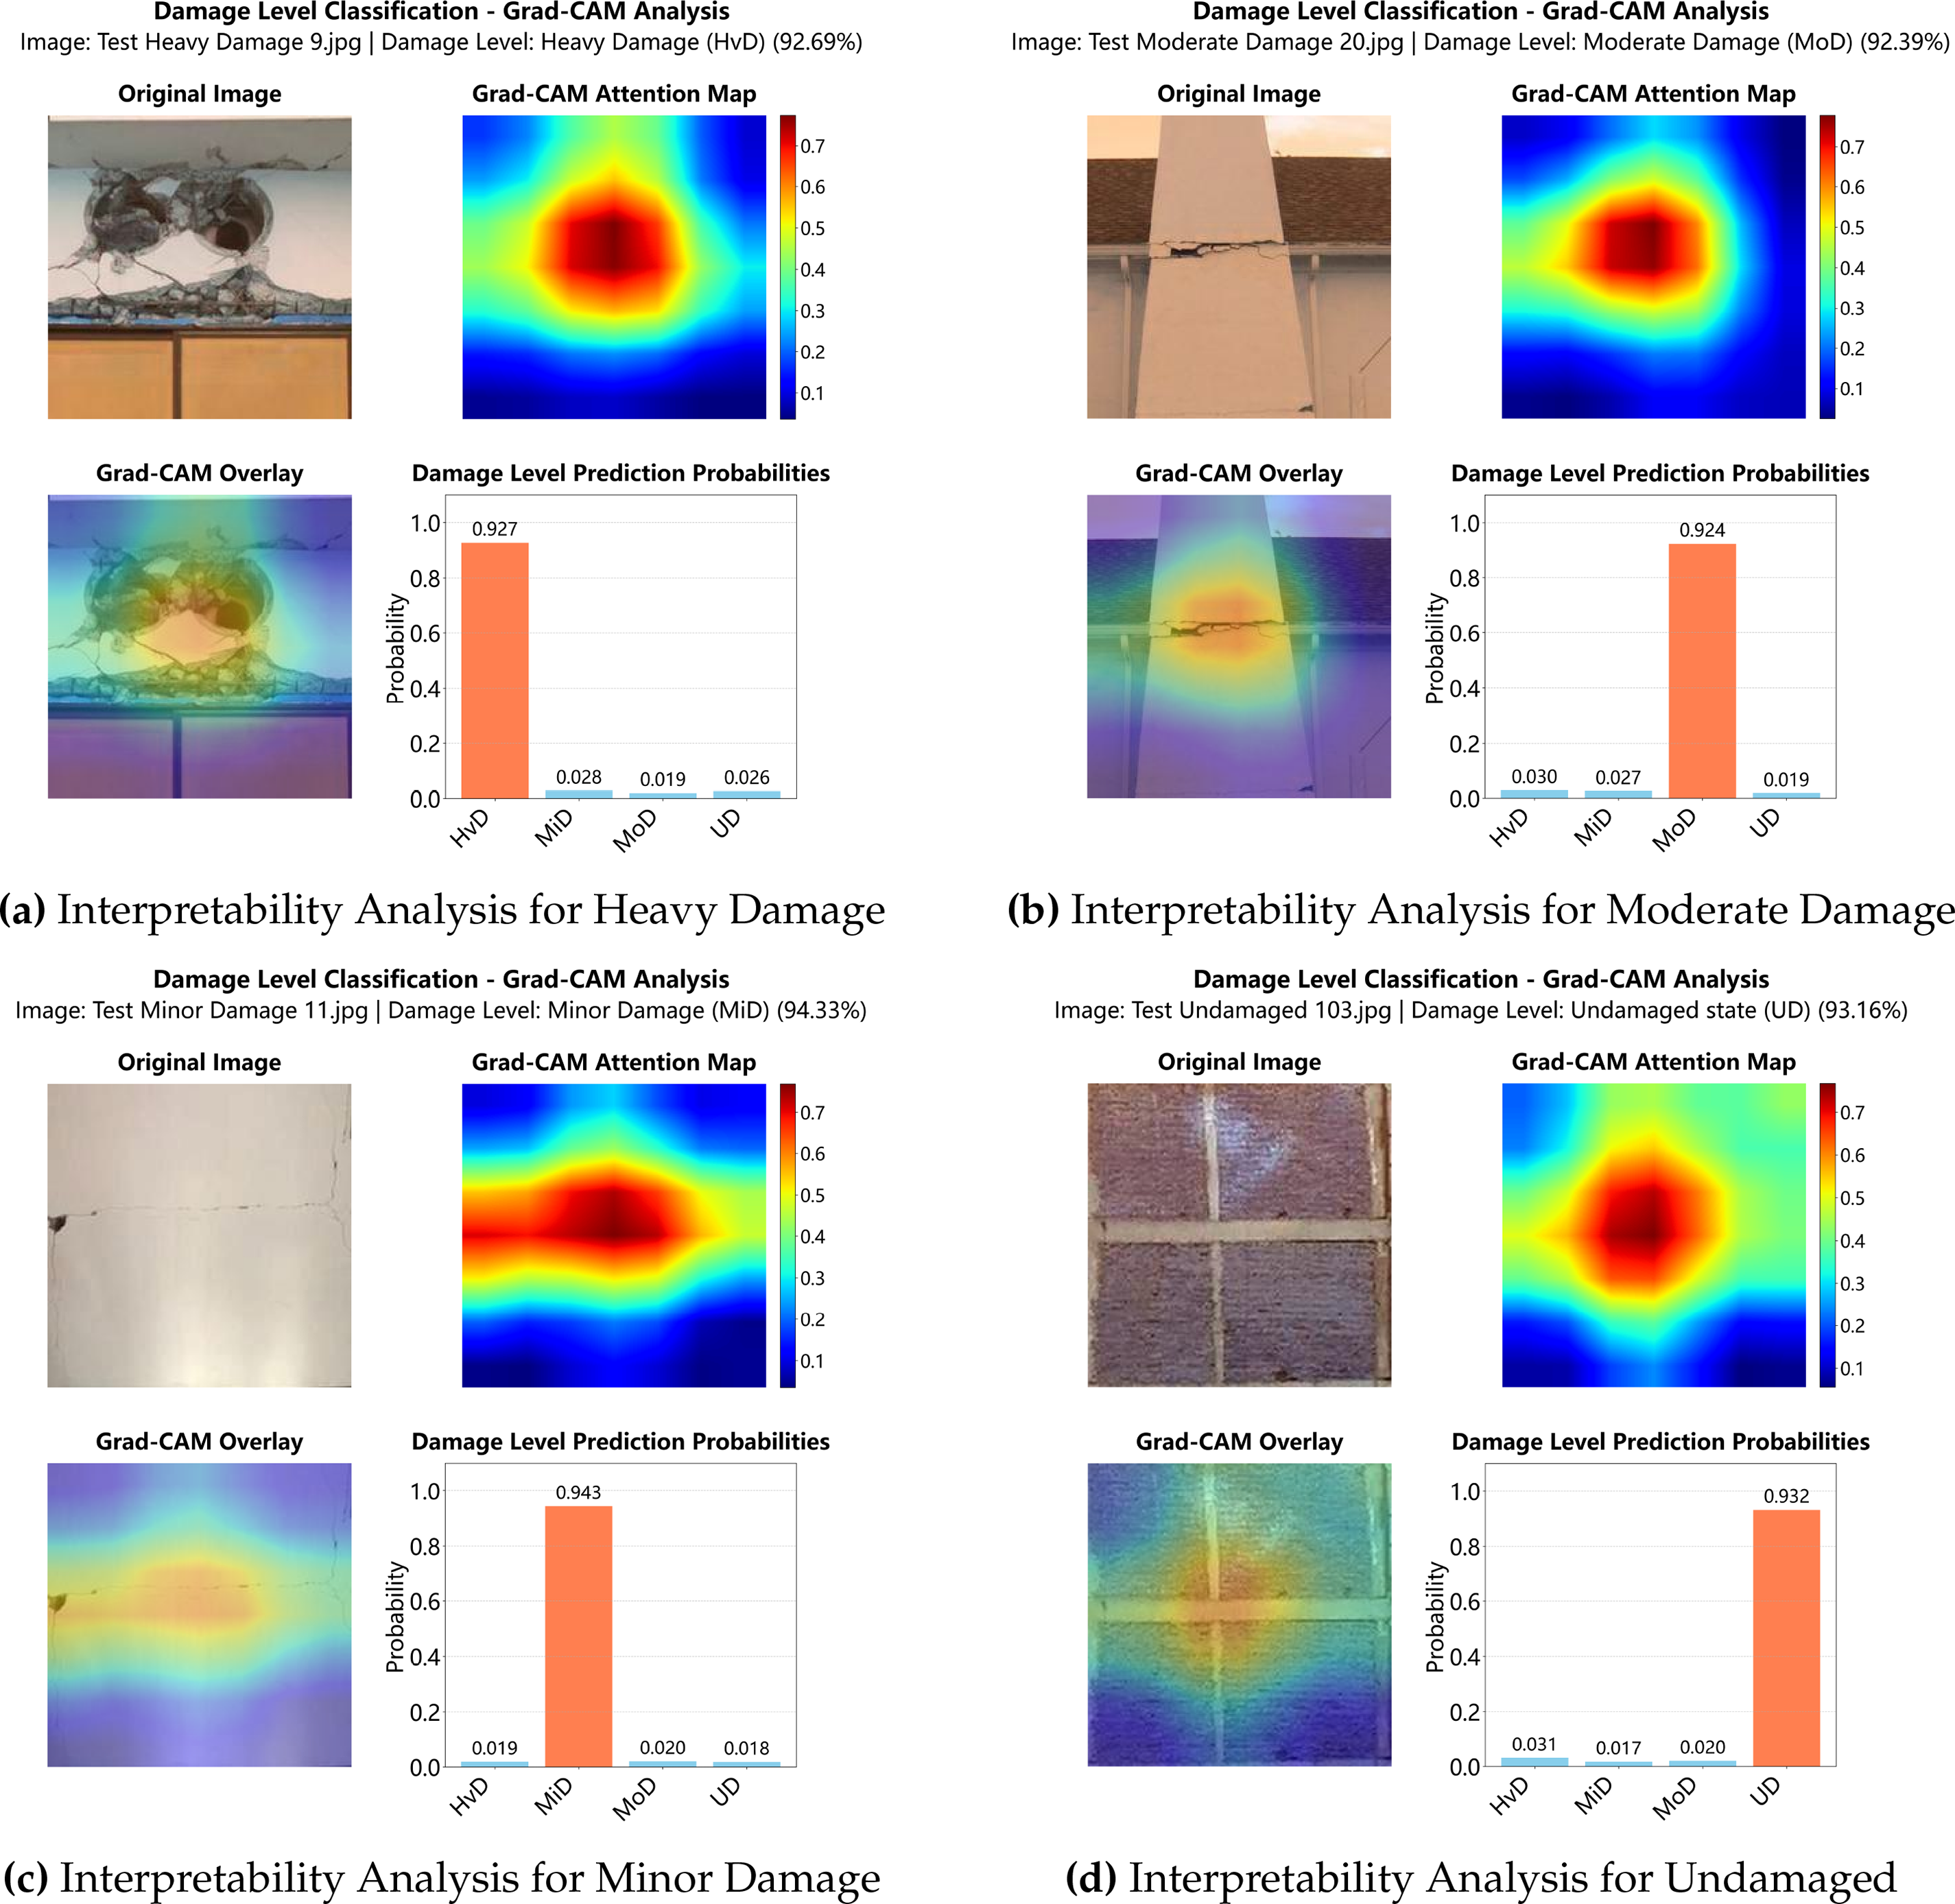
Figure 8: Interpretability analysis for damage level classification
As illustrated in Fig. 7, the Grad-CAM results for structural component classification show that the model successfully attends to the characteristic regions of each structural type. For example, the model identifies the tapering geometry of the beam (Fig. 7a), the cylindrical surface of the column (Fig. 7b), the flat wall panel with cracks (Fig. 7c), and the irregular geometry of miscellaneous components (Fig. 7d). The overlaid heatmaps clearly align with the physical boundaries and surface textures that distinguish each category.
Similarly, Fig. 8 demonstrates that the damage classification model accurately localizes the most informative areas related to structural distress. The model focuses on crack patterns and material ruptures for damaged samples (Fig. 8a–c), while attending to clean, undamaged surfaces in intact samples (Fig. 8d). The class prediction probabilities shown alongside each image further confirm the model’s confidence, often yielding sharply peaked distributions centered around the correct label.
In addition to achieving high classification accuracy, it is essential to evaluate the feasibility of real-time deployment in practical applications. On a system equipped with a 13th Gen Intel(R) Core(TM) i5-13490F processor, 32.0 GB of RAM, and an NVIDIA GeForce RTX 4060 GPU, a typical post-earthquake image prediction, along with its corresponding interpretability analysis using Grad-CAM, takes an average of 3.6 s. This time efficiency paves the way for deploying the STPEIC framework in real-world scenarios, where fast and accurate damage assessment is critical.
In summary, the interpretability analysis confirms that the proposed Swin Transformer-based models not only achieve high classification accuracy but also focus on semantically meaningful regions of the input images. The attention heatmaps generated via Grad-CAM highlight structurally relevant features and damage patterns, enhancing the transparency and trustworthiness of the framework. Building upon these insights, the next section presents a graphical user interface (GUI) designed to integrate the trained models into a user-friendly platform for practical deployment.
4 Comparison between Swin Transformer Based Model and CNN Based Model
To further validate the performance advantages of the proposed Swin Transformer-based framework, this section presents a comparative analysis against a CNN-based baseline model. This comparison helps assess the benefits of Transformer architectures in capturing structural and damage-related visual features. To understand the relative strengths and limitations of these two paradigms, this section first provides a brief overview of CNN principles, followed by a comparison of their performance across key evaluation metrics.
CNNs are widely used in image classification tasks due to their ability to learn hierarchical feature representations. They operate by applying convolutional filters to input images, capturing spatially localized patterns such as edges, corners, and textures. These local features are progressively combined through multiple layers to form high-level semantic understanding [50,53].
The output of a convolutional layer can be mathematically described in Eq. (7), where
After several convolution and pooling operations, the extracted features are passed through fully connected layers to perform classification. The final output is typically computed using the softmax function as shown in Eq. (8), where
However, in this classification task, the custom CNN model yields suboptimal performance, with relatively low accuracy and limited generalization capability. These limitations stem from the shallow architecture’s insufficient capacity to extract complex features, as well as the challenges of training from scratch on a modest-sized dataset. The model particularly struggles to differentiate subtle visual cues that are critical in post-earthquake structural assessment.
To overcome these issues, several previous studies have adopted transfer learning strategies using high-capacity convolutional backbones. Among them, EfficientNet has been widely favored due to its excellent trade-off between accuracy and computational efficiency [54]. By fine-tuning EfficientNet models pre-trained on large-scale datasets such as ImageNet, these studies have established stronger CNN-based baselines that serve as important references for further advancement [19].
In the following section, the performance of this CNN baselines with our proposed Swin Transformer-based framework is compared to highlight the improvements achieved in both classification accuracy and generalization capability.
As shown in Table 5 and Fig. 9, the Swin Transformer outperforms the EfficientNet baseline from the previous study [19] across nearly all metrics in both structural component and damage level classification tasks.
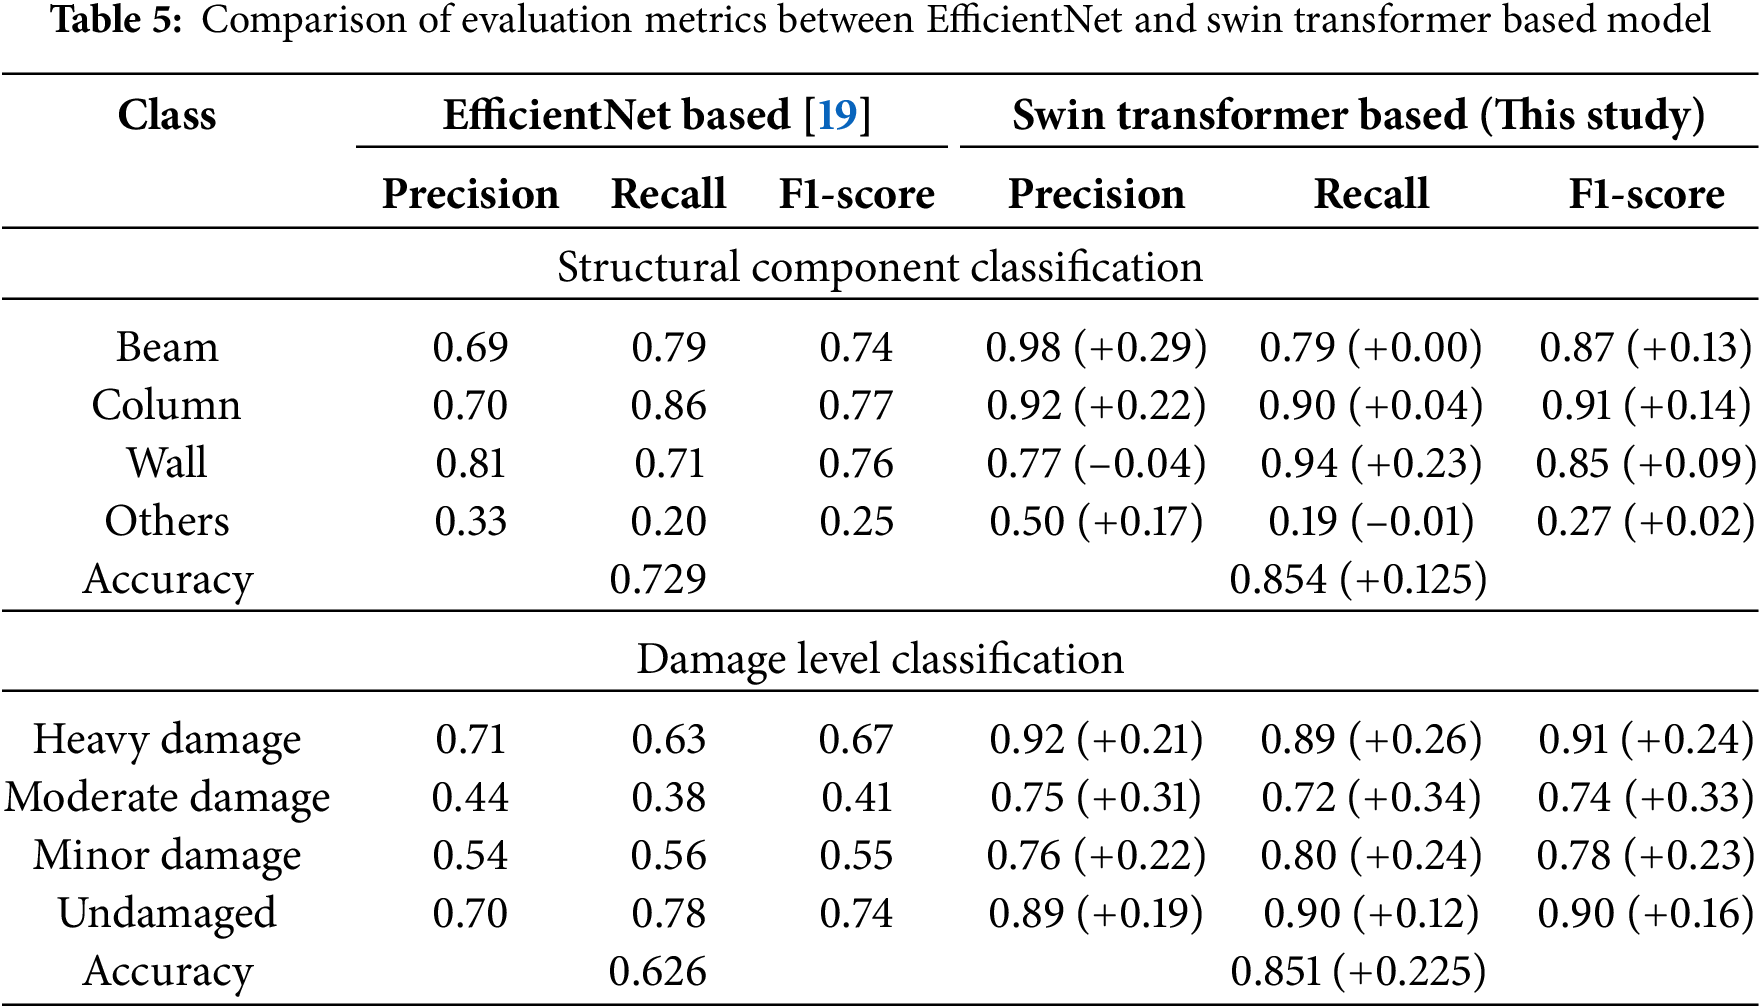
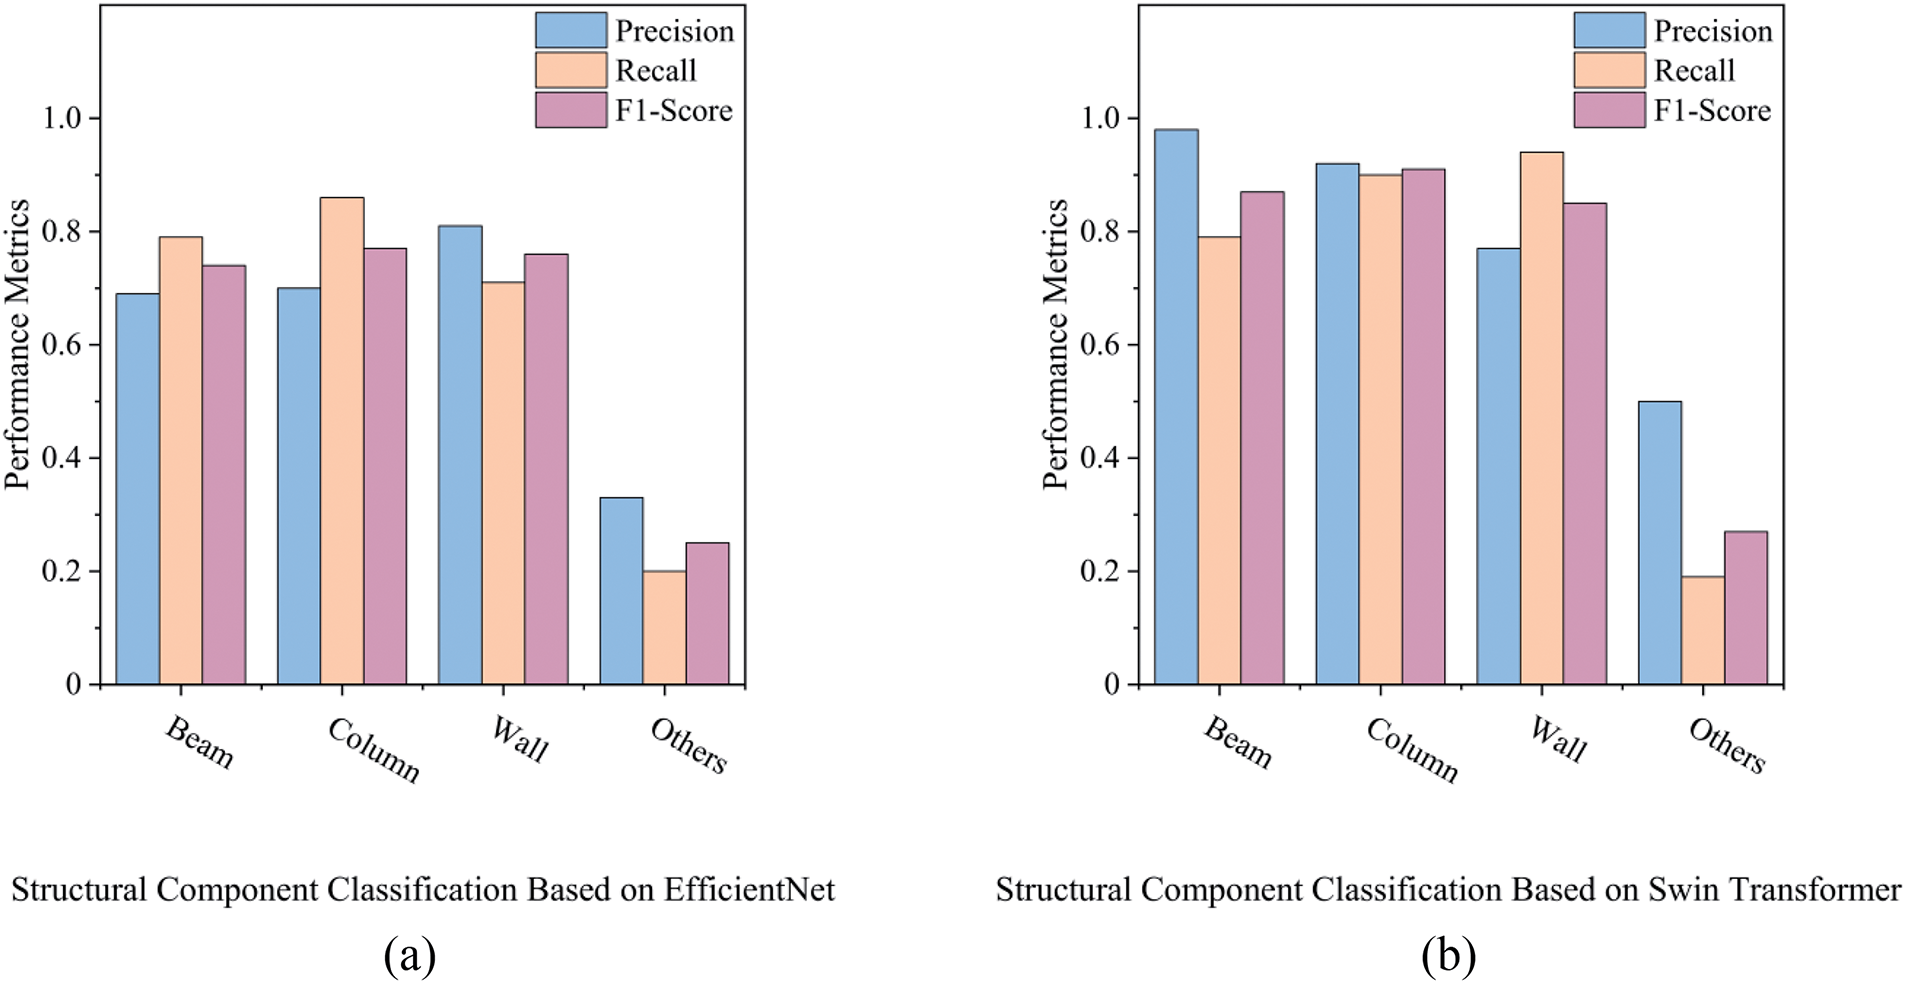
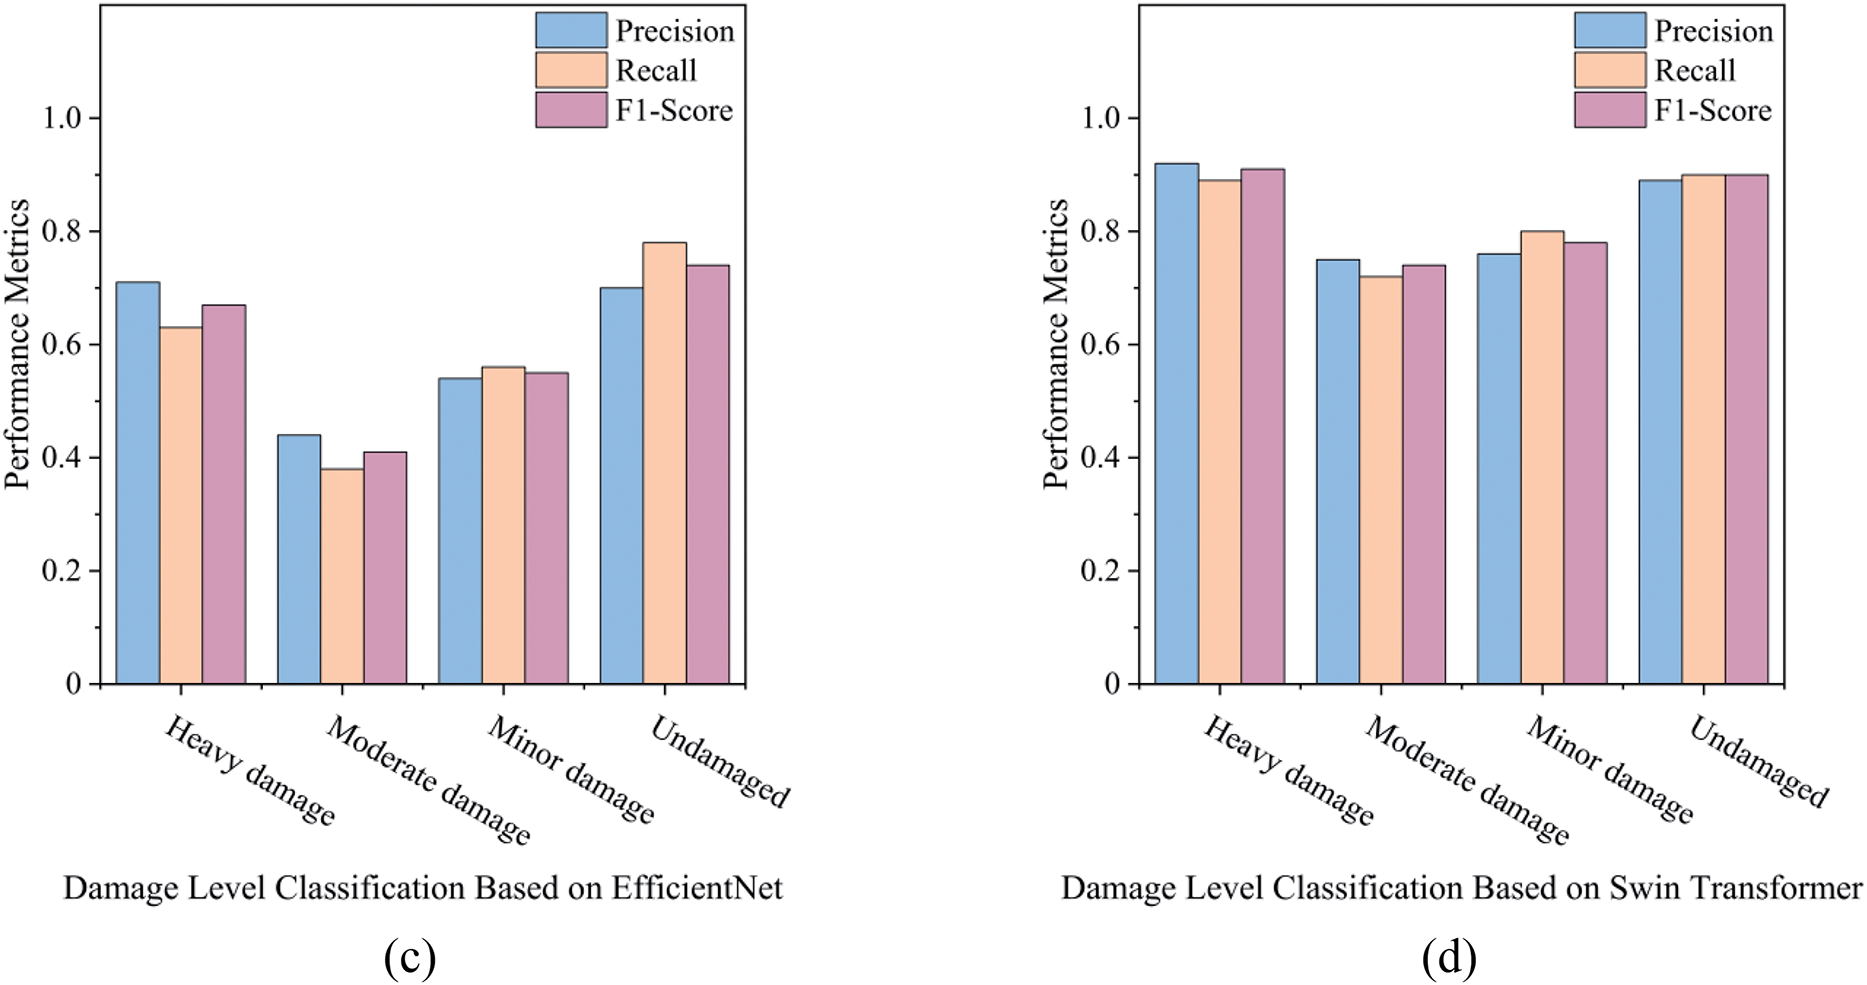
Figure 9: Histogram of model evaluation metrics for EfficientNet and Swin Transformer-based Models: (a) structural component classification based on EfficientNet, (b) structural component classification based on Swin Transformer, (c) damage level classification based on EfficientNet, (d) damage level classification based on Swin Transformer
For structural component classification, substantial improvements are observed in the Beam and Column classes, with F1-score increases of +0.13 and +0.14, respectively. These gains are attributed to the Swin Transformer’s ability to capture long-range spatial dependencies and contextual features, which are critical for identifying linear and vertical components in complex post-disaster environments. Although the Wall class experiences a slight drop in precision (−0.04), its recall improves significantly by +0.23, indicating that the model has become more sensitive in detecting wall-related features. The Others class, still the most challenging due to its heterogeneous nature, shows a modest F1-score improvement (+0.02), reflecting better generalization in ambiguous categories such as joints, door frames, and edge components.
In damage level classification, the Swin Transformer demonstrates clear advantages, particularly in the Moderate and Minor damage categories. The F1-scores in these classes increase by +0.33 and +0.23, respectively, suggesting a better ability to distinguish subtle differences between intermediate damage levels. The model also excels in identifying Heavy damage and Undamaged conditions, with precision and recall exceeding 0.89. The overall classification accuracy improves by +12.5% for structural component classification and +22.5% for damage level recognition, highlighting the Swin Transformer’s effectiveness in both coarse and fine-grained classification tasks.
These results confirm that the transformer-based architecture not only improves overall performance, but also addresses some of the weaknesses observed in conventional CNN models, particularly in cases where global context and fine details must be jointly considered.
5 Development of Graphical User Interface(GUI)
To enhance the practical usability and facilitate the deployment of the proposed STPEIC framework, a lightweight graphical user interface (GUI) using Python’s tkinter library is developed. This interface is designed for field engineers and researchers to easily analyze post-earthquake images without requiring programming expertise. Fig. 10 illustrates the complete GUI interface, demonstrating both the visualization panel and the classification output area.
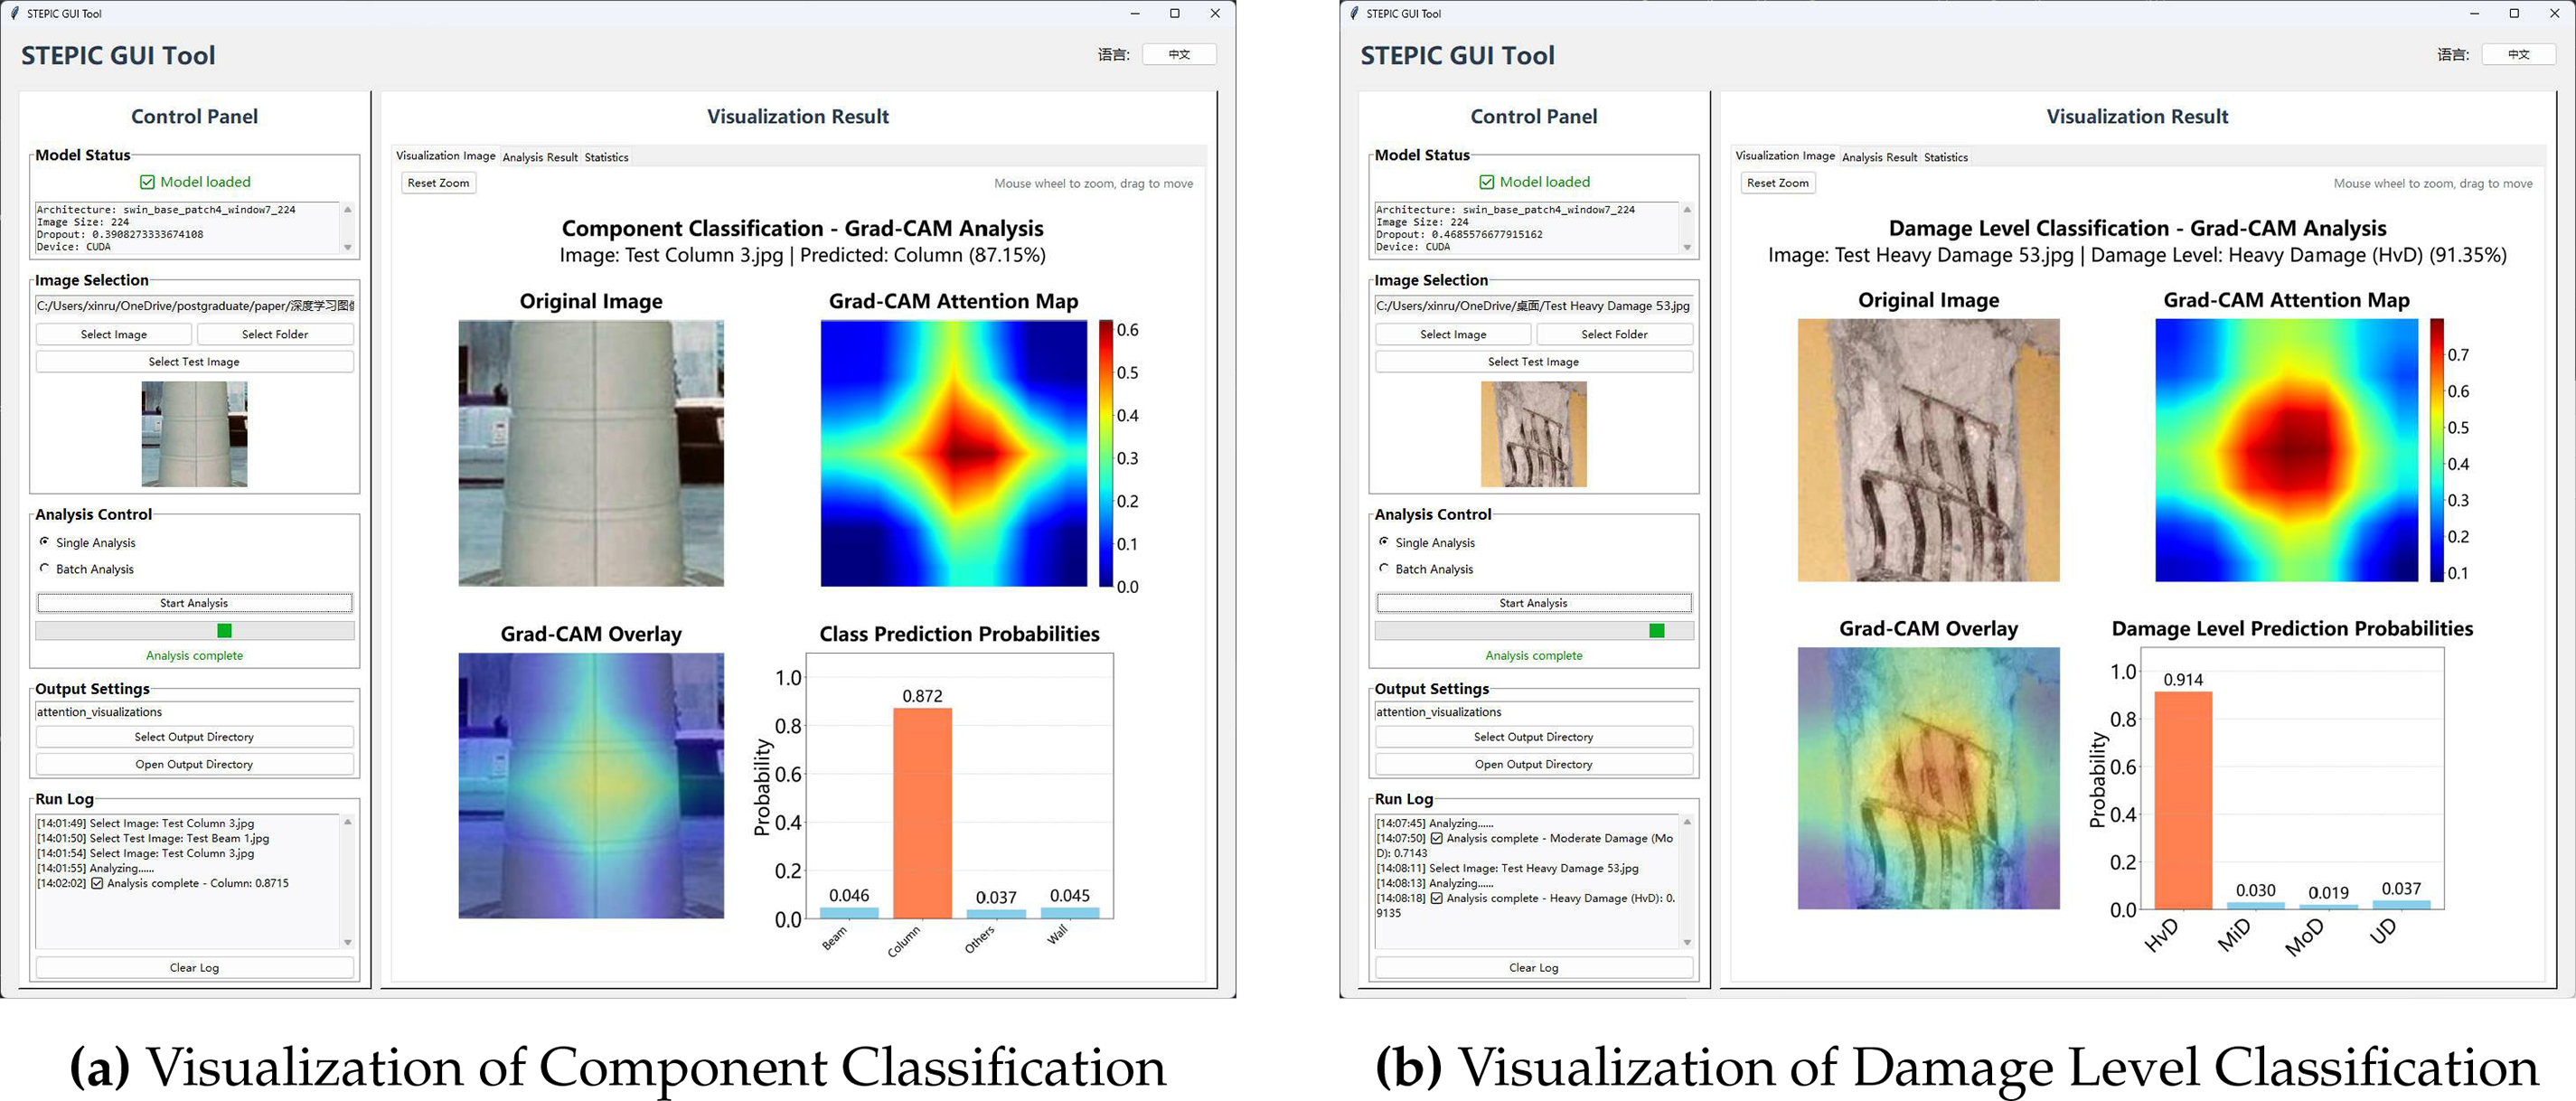
Figure 10: Visualization of structural component and damage level classification results via STPEIC GUI tool
The GUI supports the following functionalities:
• Real-time model loading: Swin Transformer-based classification models are automatically loaded upon application start, with architecture and training configuration displayed.
• Image input flexibility: Users can analyze a single image or a folder of images in batch mode. File selection, preview, and format support (JPG, PNG, BMP) are included.
• Interactive visualization: The Grad-CAM attention map is shown alongside the original image and classification result. Zooming and panning are supported via mouse interaction.
• Output management: Generated attention maps and log files are saved to a configurable output directory. Analysis results are summarized with timestamped statistics.
In summary, the STPEIC GUI tool bridges the gap between advanced deep learning models and real-world usability by providing an intuitive, interpretable, and efficient analysis tool for post-earthquake imagery. It significantly lowers the barrier to entry for non-technical users, enabling rapid on-site assessment of structural damage and structural component classification with minimal manual intervention.
In this study, STPEIC (Swin Transformer-Based Framework for Interpretable Post Earthquake Image Classification) is proposed as an interpretable deep learning framework for post-earthquake structural assessment. The framework leverages the hierarchical attention mechanism of the Swin Transformer to perform two core classification tasks: structural component identification and damage level classification. To enhance transparency and usability, STPEIC integrates Grad-CAM-based interpretability visualization and a lightweight graphical user interface (GUI), providing an end-to-end solution suitable for both research and field deployment.
Key contributions and findings are summarized as follows:
• Two independent Swin Transformer models were developed for structural component classification and damage level classification, achieving high test accuracies of 85.4% and 85.1%, respectively.
• Attention-based interpretability analysis via Grad-CAM revealed that the model effectively attends to semantically meaningful structural and damage features, reinforcing the reliability of the prediction results.
• Comparative experiments demonstrated the superiority of the Swin Transformer over CNN-based baselines such as EfficientNet, with improvements of +12.5% and +22.5% in component and damage classification accuracy, respectively.
• A practical GUI tool was implemented to support real-time image input, classification, and visual explanation, enabling non-expert users to efficiently operate the framework in post-disaster field conditions.
Despite these promising results, several limitations remain and point to potential directions for future work:
• Although data augmentation was applied to enhance model robustness, the current study relies on a single post-earthquake image dataset, which limits its generalization. Variations in architectural styles and materials across different countries and regions can lead to differences in post-earthquake images, potentially affecting the model’s performance. To ensure broader generalization across diverse seismic regions, structural typologies, and imaging conditions, it is crucial to validate the model with more heterogeneous datasets. In the future, expanding the training data to include images from various regions will improve the model’s adaptability and robustness.
• The current framework uses two separately trained models, but future work could explore multi-task learning (MTL) as a way to improve performance. MTL allows the model to learn shared representations across tasks, such as structural geometry and damage patterns, which can enhance generalization, reduce overfitting, and make better use of limited data. By sharing parameters across tasks, MTL can also improve computational efficiency and simplify the training process.
• Deployment scalability: Although the GUI enables user-friendly interaction, the current version is limited to offline inference. Future efforts could develop cloud-based or edge-deployable versions to support real-time post-disaster analytics at scale.
In conclusion, STPEIC demonstrates a robust, interpretable, and accessible approach to post-earthquake structural damage classification. By integrating advanced vision transformers with practical usability features, this study makes a meaningful contribution toward automating structural safety evaluation in disaster resilience engineering.
Acknowledgement: The authors would like to express their sincere gratitude to Professor Decheng Feng from Southeast University for providing valuable data and technical support.
Funding Statement: The corresponding author acknowledges financial support from General Project Supported by Natural Science Basic Research Plan in Shaanxi Province of China (2025JC-YBMS-443), Fundamental Research Funds for the Central Universities, CHU (300102213209), Research Funds for the Interdisciplinary Projects, CHU (300104240915) and National Natural Science Foundation of China (Grant No. 52361135806).
Author Contributions: The authors confirm contribution to the paper as follows: Conceptualization, Xinrui Ma and Shizhi Chen; methodology, Xinrui Ma; software, Xinrui Ma; validation, Xinrui Ma and Shizhi Chen; formal analysis, Xinrui Ma; investigation, Xinrui Ma; resources, Shizhi Chen; data curation, Xinrui Ma; writing—original draft preparation, Xinrui Ma; writing—review and editing, Xinrui Ma and Shizhi Chen; visualization, Xinrui Ma; supervision, Shizhi Chen; project administration, Shizhi Chen; funding acquisition, Shizhi Chen. All authors reviewed the results and approved the final version of the manuscript.
Availability of Data and Materials: Data available on request from the authors.
Ethics Approval: Not applicable.
Conflicts of Interest: The authors declare no conflicts of interest to report regarding the present study.
Abbreviations:
The following abbreviations are used in this manuscript:
| STEPIC | Swin Transformer-Based Framework for Interpretable Post-Earthquake Image Classification |
| CNN | Convolutional Neural Network |
| GUI | Graphical User Interface |
| Grad-CAM | Gradient-weighted Class Activation Mapping |
| Swin Transformer | Swin Transformer |
| PE | Post-Earthquake |
| MSA | Multi-Head Self-Attention |
| MLP | Multi-Layer Perceptron |
| GELU | Gaussian Error Linear Unit |
| TPE | Tree-structured Parzen Estimator |
| FN | False Negative |
| FP | False Positive |
| TP | True Positive |
| TN | True Negative |
References
1. Feng DC, Chen SZ, Taciroglu E. Deep learning-enhanced efficient seismic analysis of structures with multi-fidelity modeling strategies. Comput Methods Appl Mech Eng. 2024;421(1):116775. doi:10.1016/j.cma.2024.116775. [Google Scholar] [CrossRef]
2. Fan Y, Li H, Bao Y, Xu Y. Cycle-consistency-constrained few-shot learning framework for universal multi-type structural damage segmentation. Struct Health Monit. 2024. doi:10.1177/14759217241293467. [Google Scholar] [CrossRef]
3. Ling L, Ma G, Hwang HJ, Tan X. Post-earthquake detection of surface spalling and cracks in masonry buildings based on computer vision. Structures. 2025;78(1):109226. doi:10.1016/j.istruc.2025.109226. [Google Scholar] [CrossRef]
4. Xu Y, Qiao W, Zhao J, Zhang Q, Li H. Vision-based multi-level synthetical evaluation of seismic damage for RC structural components: a multi-task learning approach. Earthq Eng Eng Vibrat. 2023;22(1):69–85. doi:10.1007/s11803-023-2153-4. [Google Scholar] [CrossRef]
5. Liu XY, Xu ZD, Huang XH, Du X, Tao Y, Xia ZH, et al. Horizontal shaking table tests on a four-story prototype structure using multi-dimensional earthquake isolation and mitigation devices. Mech Syst Signal Process. 2025;223(2):111894. doi:10.1016/j.ymssp.2024.111894. [Google Scholar] [CrossRef]
6. Tao Y, Xu ZD, Wei Y, Liu XY, Zang X, Li SD. A wavelet packet deep learning model for energy-based structural collapse assessment under earthquake-fire scenarios: framework and hybrid simulation. Mech Syst Signal Process. 2025;222:111784. doi:10.1016/j.ymssp.2024.111784. [Google Scholar] [CrossRef]
7. Lee JH, Cho JR. Simplified earthquake response analysis of rectangular liquid storage tanks considering fluid-structure interactions. Eng Struct. 2024;300(1):117157. doi:10.1016/j.engstruct.2023.117157. [Google Scholar] [CrossRef]
8. Ma G, Wang Y, Hwang HJ. Genetic programming-based backbone curve model of reinforced concrete walls. Eng Struct. 2023;283:115824. doi:10.1016/j.engstruct.2023.115824. [Google Scholar] [CrossRef]
9. Castillo B, Ceron DF, Vides SM, Marulanda J, Thomson P. Comprehensive assessment of the seismic performance of an innovative hybrid semiactive and passive state control system for a low-degree-of-freedom structure using real-time hybrid simulation. Struct Control Health Monit. 2024;2024(1):9945556. doi:10.1155/2024/9945556. [Google Scholar] [CrossRef]
10. Pereira EMV, Andrade RB, Leitão FF, Carobeno CL, Siqueira GH. Seismic risk evaluation of non-ductile low-rise RC buildings in Brazil: time-based and intensity-based assessments considering different performance metrics. J Build Eng. 2024;88(2–4):109147. doi:10.1016/j.jobe.2024.109147. [Google Scholar] [CrossRef]
11. Meng S, Zhou Y, Gao Z. Refined self-attention mechanism based real-time structural response prediction method under seismic action. Eng Appl Artif Intell. 2024;129:107380. doi:10.1016/j.engappai.2023.107380. [Google Scholar] [CrossRef]
12. Xu Y, Li Y, Zheng X, Zheng X, Zhang Q. Computer-vision and machine-learning-based seismic damage assessment of reinforced concrete structures. Buildings. 2023;13(5):1258. doi:10.3390/buildings13051258. [Google Scholar] [CrossRef]
13. Gao S. Life cycle sustainability assessment of concrete-filled steel tubular frames in earthquake regions. Eng Struct. 2025;328(08):119761. doi:10.1016/j.engstruct.2025.119761. [Google Scholar] [CrossRef]
14. Cao XY, Shen D, Feng DC, Wang CL, Qu Z, Wu G. Seismic retrofitting of existing frame buildings through externally attached sub-structures: state of the art review and future perspectives. J Build Eng. 2022;57(6036):104904. doi:10.1016/j.jobe.2022.104904. [Google Scholar] [CrossRef]
15. Zhong QM, Feng DC, Chen SZ. Multi-fidelity enhanced few-shot time series prediction model for structural dynamics analysis. Comput Methods Appl Mech Eng. 2025;434(4):117583. doi:10.1016/j.cma.2024.117583. [Google Scholar] [CrossRef]
16. Owens JD, Houston M, Luebke D, Green S, Stone JE, Phillips JC. GPU Computing. Proc IEEE. 2008;96(5):879–99. doi:10.1109/jproc.2008.917757. [Google Scholar] [CrossRef]
17. Gao Y, Mosalam KM. PEER Hub ImageNet: a large-scale multiattribute benchmark data set of structural images. J Struct Eng. 2020;146(10):04020198. doi:10.1061/(asce)st.1943-541x.0002745. [Google Scholar] [CrossRef]
18. Chen SZ, Feng DC, Taciroglu E. Prior knowledge-infused neural network for efficient performance assessment of structures through few-shot incremental learning. Comput-Aided Civ Infrastruct Eng. 2024;39(13):1928–45. doi:10.1111/mice.13175. [Google Scholar] [CrossRef]
19. Feng DC, Yi X, Deger ZT, kun Liu H, Chen SZ, Wu G. Rapid post-earthquake damage assessment of building portfolios through deep learning-based component-level image recognition. J Build Eng. 2024;98(13):111380. doi:10.1016/j.jobe.2024.111380. [Google Scholar] [CrossRef]
20. Dondi P, Gullotti A, Inchingolo M, Senaldi I, Casarotti C, Lombardi L, et al. Post-earthquake structural damage detection with tunable semi-synthetic image generation. Eng Appl Artif Intell. 2025;147(1):110302. doi:10.1016/j.engappai.2025.110302. [Google Scholar] [CrossRef]
21. Wu K, Matsuoka M, Oshio H. Earthquake damage detection and level classification method for wooden houses based on convolutional neural networks and onsite photos. Comput-Aided Civ Infrastruct Eng. 2025;40(5):674–94. doi:10.1111/mice.13224. [Google Scholar] [CrossRef]
22. Xu Y, Zhang C, Li H. Transformer-based large vision model for universal structural damage segmentation. Autom Constr. 2025;176(2):106256. doi:10.1016/j.autcon.2025.106256. [Google Scholar] [CrossRef]
23. Deng J, Dong W, Socher R, Li LJ, Li K, Li FF. ImageNet: a large-scale hierarchical image database. In: 2009 IEEE Conference on Computer Vision and Pattern Recognition; 2009 Jun 20–25; Miami, FL, USA. p. 248–55. [Google Scholar]
24. Shen Y, Ma G, Hwang HJ, Kim DJ, Zhang Z. Prediction of seismic response of building structures using a CNN-LSTM-ATT network with transfer learning. Adv Struct Eng. 2025. doi:10.1177/13694332251340730. [Google Scholar] [CrossRef]
25. Cheng MY, Khasani RR, Citra RJ. Image-based preliminary emergency assessment of damaged buildings after earthquake: taiwan case studies. Eng Appl Artif Intell. 2023;126:107164. doi:10.1016/j.engappai.2023.107164. [Google Scholar] [CrossRef]
26. Zhuang X, Tran TV, Nguyen-Xuan H, Rabczuk T. Deep learning-based post-earthquake structural damage level recognition. Comput Struct. 2025;315:107761. [Google Scholar]
27. Reis HC, Turk V, Karacur S, Kurt AM. Integration of a CNN-based model and ensemble learning for detecting post-earthquake road cracks with deep features. Structures. 2024;62(2):106179. doi:10.1016/j.istruc.2024.106179. [Google Scholar] [CrossRef]
28. Vaswani A, Shazeer N, Parmar N, Uszkoreit J, Jones L, Gomez AN, et al. Attention is all you need. In: Guyon I, Luxburg UV, Bengio S, Wallach H, Fergus R, Vishwanathan S, et al, editors. Advances in neural information processing systems. Vol. 30. Red Hook, NY, USA: Curran Associates, Inc.; 2017. [Google Scholar]
29. Dosovitskiy A, Beyer L, Kolesnikov A, Weissenborn D, Zhai X, Unterthiner T, et al. An image is worth 16 × 16 words: transformers for image recognition at scale. arXiv:2010.11929. 2020. [Google Scholar]
30. Liu Z, Lin Y, Cao Y, Hu H, Wei Y, Zhang Z, et al. Swin transformer: hierarchical vision transformer using shifted windows. In: Proceedings of the 2021 IEEE/CVF International Conference on Computer Vision (ICCV); 2021 Oct 10–17; Montreal, QC, Canada. p. 10012–22. [Google Scholar]
31. Ma Z, Wu X, Chu A, Huang L, Wei Z. SwinFG: a fine-grained recognition scheme based on swin transformer. Expert Syst Appl. 2024;244:123021. doi:10.1016/j.eswa.2023.123021. [Google Scholar] [CrossRef]
32. Cui L, Jing X, Wang Y, Huan Y, Xu Y, Zhang Q. Improved swin transformer-based semantic segmentation of postearthquake dense buildings in urban areas using remote sensing images. IEEE J Sel Top Appl Earth Obs Remot Sens. 2023;16:369–85. doi:10.1109/jstars.2022.3225150. [Google Scholar] [CrossRef]
33. Zhou Z, Zhang J, Gong C. Hybrid semantic segmentation for tunnel lining cracks based on Swin Transformer and convolutional neural network. Comput-Aided Civ Infrastruct Eng. 2023;38(17):2491–510. doi:10.1111/mice.13003. [Google Scholar] [CrossRef]
34. Ferrando J, Gállego GI, Alastruey B, Escolano C, Costa-jussà MR. Towards opening the black box of neural machine translation: source and target interpretations of the transformer. arXiv:2205.11631. 2022. [Google Scholar]
35. Chefer H, Gur S, Wolf L. Transformer interpretability beyond attention visualization. In: Proceedings of the 2021 IEEE/CVF Conference on Computer Vision and Pattern Recognition (CVPR); 2021 Jun 20–25; Nashville, TN, USA. p. 782–91. [Google Scholar]
36. Li Y, Sun Z, Li Y, Yang H, Liu X, He W. A vision transformer-based method for predicting seismic damage states of RC piers: database development and efficient assessment. Reliab Eng Syst Safety. 2025;263:111287. [Google Scholar]
37. Fan CM, Liu TJ, Liu KH. SUNet: swin transformer UNet for image denoising. In: 2022 IEEE International Symposium on Circuits and Systems (ISCAS); 2022 May 27–Jun 1; Austin, TX, USA. p. 2333–7. [Google Scholar]
38. Kim S, Nam J, Ko BC. ViT-NeT: interpretable vision transformers with neural tree decoder. In: Chaudhuri K, Jegelka S, Song L, Szepesvari C, Niu G, Sabato S, editors. Proceedings of the 39th International Conference on Machine Learning. London, UK: PMLR; 2022. p. 11162–72. [Google Scholar]
39. Wang H, Wang J, Sui Q, Zhang F, Li Y, Jiang M, et al. Intelligent fault diagnosis method of rolling bearings based on transfer residual swin transformer with shifted windows. Struct Durab Health Monit. 2024;18(2):91–110. doi:10.32604/sdhm.2023.041522. [Google Scholar] [CrossRef]
40. Zhang Q, Wang C, Wu H, Xin C, Phuong TV. GELU-Net: a globally encrypted, locally unencrypted deep neural network for privacy-preserved learning. In: Proceedings of the Twenty-Seventh International Joint Conference on Artificial Intelligence, IJCAI-18; 2018 Jul 13–19; Stockholm, Sweden. p. 3933–9. [Google Scholar]
41. Xu Y, Hong W, Noori M, Altabey WA, Silik A, Farhan NS. Big model strategy for bridge structural health monitoring based on data-driven, adaptive method and convolutional neural network (CNN) group. Struct Durab Health Monit. 2024;18(6):763–83. doi:10.32604/sdhm.2024.053763. [Google Scholar] [CrossRef]
42. Cai C, Guo X, Xue Y, Ren J. Damage diagnosis of bleacher based on an enhanced convolutional neural network with training interference. Struct Durab Health Monit. 2024;18(3):321–39. [Google Scholar]
43. Akiba T, Sano S, Yanase T, Ohta T, Koyama M. Optuna: a next-generation hyperparameter optimization framework. In: Proceedings of the 25th ACM SIGKDD International Conference on Knowledge Discovery & Data Mining. KDD ’19. New York, NY, USA: Association for Computing Machinery; 2019. p. 2623–31. [Google Scholar]
44. Chen SZ, Feng DC, Han WS, Wu G. Development of data-driven prediction model for CFRP-steel bond strength by implementing ensemble learning algorithms. Constr Build Mater. 2021;303(6):124470. doi:10.1016/j.conbuildmat.2021.124470. [Google Scholar] [CrossRef]
45. Chen SZ, Zhang SY, Han WS, Wu G. Ensemble learning based approach for FRP-concrete bond strength prediction. Constr Build Mater. 2021;302(8):124230. doi:10.1016/j.conbuildmat.2021.124230. [Google Scholar] [CrossRef]
46. Ma XR, Wang XL, Chen SZ. Trustworthy machine learning-enhanced 3D concrete printing: predicting bond strength and designing reinforcement embedment length. Autom Constr. 2024;168(5):105754. doi:10.1016/j.autcon.2024.105754. [Google Scholar] [CrossRef]
47. Akata Z, Perronnin F, Harchaoui Z, Schmid C. Good practice in large-scale learning for image classification. IEEE Trans Pattern Anal Mach Intell. 2014;36(3):507–20. doi:10.1109/tpami.2013.146. [Google Scholar] [PubMed] [CrossRef]
48. Chen SZ, Wang XY, Ma XR, Wang T, Askari M, Taciroglu E. Transforming regression to classification for enhancing extrapolation capacity of data-driven structural behavior prediction. Expert Syst Appl. 2025;277(6):127302. doi:10.1016/j.eswa.2025.127302. [Google Scholar] [CrossRef]
49. Ma XR, Liang X, Wang S, Chen SZ. Language model enhanced surface chloride concentration determination for concrete within splash environment based on limited field records. Case Stud Constr Mater. 2024;20(5535):e03157. doi:10.1016/j.cscm.2024.e03157. [Google Scholar] [CrossRef]
50. Selvaraju RR, Cogswell M, Das A, Vedantam R, Parikh D, Batra D. Grad-CAM: visual explanations from deep networks via gradient-based localization. Int J Comput Vis. 2019;128(2):336–59. doi:10.1109/iccv.2017.74. [Google Scholar] [CrossRef]
51. Selvaraju RR, Das A, Vedantam R, Cogswell M, Parikh D, Batra D. Grad-CAM: why did you say that? arXiv:1611.07450. 2017. [Google Scholar]
52. Gu H, Zhu K, Strauss A, Shi Y, Sumarac D, Cao M. Rapid and accurate identification of concrete surface cracks via a lightweight & efficient YOLOv3 algorithm. Struct Durab Health Monit. 2024;18(4):363–80. [Google Scholar]
53. Sun Y, Xue B, Zhang M, Yen GG, Lv J. Automatically designing CNN architectures using the genetic algorithm for image classification. IEEE Trans Cybern. 2020;50(9):3840–54. doi:10.1109/tcyb.2020.2983860. [Google Scholar] [PubMed] [CrossRef]
54. Hershey S, Chaudhuri S, Ellis DPW, Gemmeke JF, Jansen A, Moore RC, et al. CNN architectures for large-scale audio classification. In: 2017 IEEE International Conference on Acoustics, Speech and Signal Processing (ICASSP); 2017 Mar 5–9; New Orleans, LA, USA. p. 131–5. [Google Scholar]
Cite This Article
 Copyright © 2025 The Author(s). Published by Tech Science Press.
This work is licensed under a Creative Commons Attribution 4.0 International License , which permits unrestricted use, distribution, and reproduction in any medium, provided the original work is properly cited.
 Downloads
 Citation Tools