
 Submit a Paper
 Open Access
ARTICLE
Development of IoT-Based Condition Monitoring System for Bridges
Department of Electronics Engineering, Shri Ramdeobaba College of Engineering & Management, Nagpur, India
* Corresponding Author: Suresh S. Balpande. Email:
Sound & Vibration 2022, 56(3), 209-220. https://doi.org/10.32604/sv.2022.014518
Received 05 October 2021; Accepted 18 February 2022; Issue published 10 August 2022
 View Full Text
 Download PDF
Abstract
As of April 2019, India has 1,42,126 kilometres of National Highways and 67,368 kilometres of railway tracks that reach even the most remote parts of the country. Bridges are critical for both passenger and freight movement in the country. Because bridges play such an important part in the transportation system, their safety and upkeep must be prioritized. Manual Condition Monitoring has the disadvantage of being sluggish, unreliable, and ineffi- cient. The Internet of Things has given structural monitoring a boost. Significant decreases in the cost of electronics and connection, together with the expansion of cloud platforms, have made it possible to collect large amounts of data remotely, aggregate it, and perform essential analysis to generate actionable insights. This research focuses on a scalable system for monitoring the state of bridges, such as vibration and loading, employing multimodal inputs, controllers, and Wi-Fi modules. The accelerometer and load cells were installed on the prototype, tested for a sample load (56.21 gramsavg, 590 gramsmax, and 147.66 gramsrms) with induced vibration (5.87 m/sec2 avg, 18 m/sec2 max, and 7.04 m/sec2 rms) that are processed, displayed on-board, and uploaded to ThingSpeak cloud service. This system will aid the maintenance personnel in remotely monitoring it. This system can send out notifications if any of these parameters exceeds their threshold value, allowing you to take preventive measures ahead of time.Keywords
Nomenclature
| SHM | Structural Health Monitoring |
| IoT | Internet-of-the-things |
| API | Application Programming Interface |
| MQTT | Message Queuing Telemetry Transport |
| HTTP | Hypertext Transfer Protocol |
Bridges are an important aspect of a country’s transportation network, yet they are prohibitively expensive to build and maintain. Bridges on the tracks are the lifeblood of rail transportation for both passengers and freight traffic throughout the country. It is evident that bridges play a significant part in the transportation infrastructure. Their safety and upkeep should be prioritized. As a result, bridges should have related optimised, cost-effective, and reliable inspection to protect lives from structural failure. Monitoring the Health of Ancient Structures [1], an onsite judge is prohibitively overpriced for nearly a little fraction of structures and conjointly suffers from the many downsides of perspicacity [2].
The bridge’s age does not pose a direct threat to its safety, but it does require annual maintenance and reinforcement. Such bridges were built to accommodate a lot of light traffic at the time of their construction. With the introduction of change, however, heavier automobiles tuned in to the trendy burden demands and were propelled by the truth that older existing bridge structures had massive flaws. Owning autonomous surveillance approaches capable of living and diagnosing tectonic difficulties is a requirement.
For heavily laden bridges, large-scale buildings, and old heritage structures to sustain a long and reliable life, structural health monitoring is critical. It is also necessary for averting disasters. The effectiveness of maintenance and inspection programmes, on the other hand, is restricted to periodic inspection and revealing faulty performance. As a result, the shift to real-time, round-the-clock online automated system monitoring is well worth it. As a result, a wireless structural health monitoring system can be utilised to monitor buildings around the clock. It requires little or no maintenance to maintain their long and dependable useful life, which in turn evaluates health and so prevents unexpected collapse/disaster. Many smart sensing systems have been available in recent years that can be used to monitor the health of bridges. Most of them have adopted a cluster-based architecture, in which a cluster of sensors is installed at specified bridge joints to detect data and transmit it on to a controller. Sensor data can be transmitted to the cloud via wireless communication technology, which aids in structural health analysis.
Many researchers came up with many ideas that automatically awake the system when a train or vehicle travels on the bridge and adaptively powers through an energy harvesting mechanism [3–6] and went to sleep mode after finishing the task. An event detection system is deployed to monitor passing load with a perpetual power source. An energy harvesting technology has been researched and developed numerous prototypes for bridge vibrations [7–9]. Field tests on the target bridges show that it can effectively detect passing vehicles [10–14].
Sakib Mahmud Khan et.al worked out the integration of Structural Health Monitoring wherein collected data is integrated to attain accuracy and extend the reliability [15]. An intelligent transportation system comprises of video cameras and traffic sensors to trace the sources of critical happenings and capture the responses under different traffic conditions.
Reyer et al. [16] designed a wireless sensor network for structural condition monitoring of widely distributed structures like bridges. Jian et al. [17] proposed the Electroluminescent principle which was used to visualize the strain by employing Wheatstone bridge and monochrome electro luminance technology.
Casas et al. [18] proposed the concept of damage index denoted as DI at the structural level as mentioned in Eq. (1).
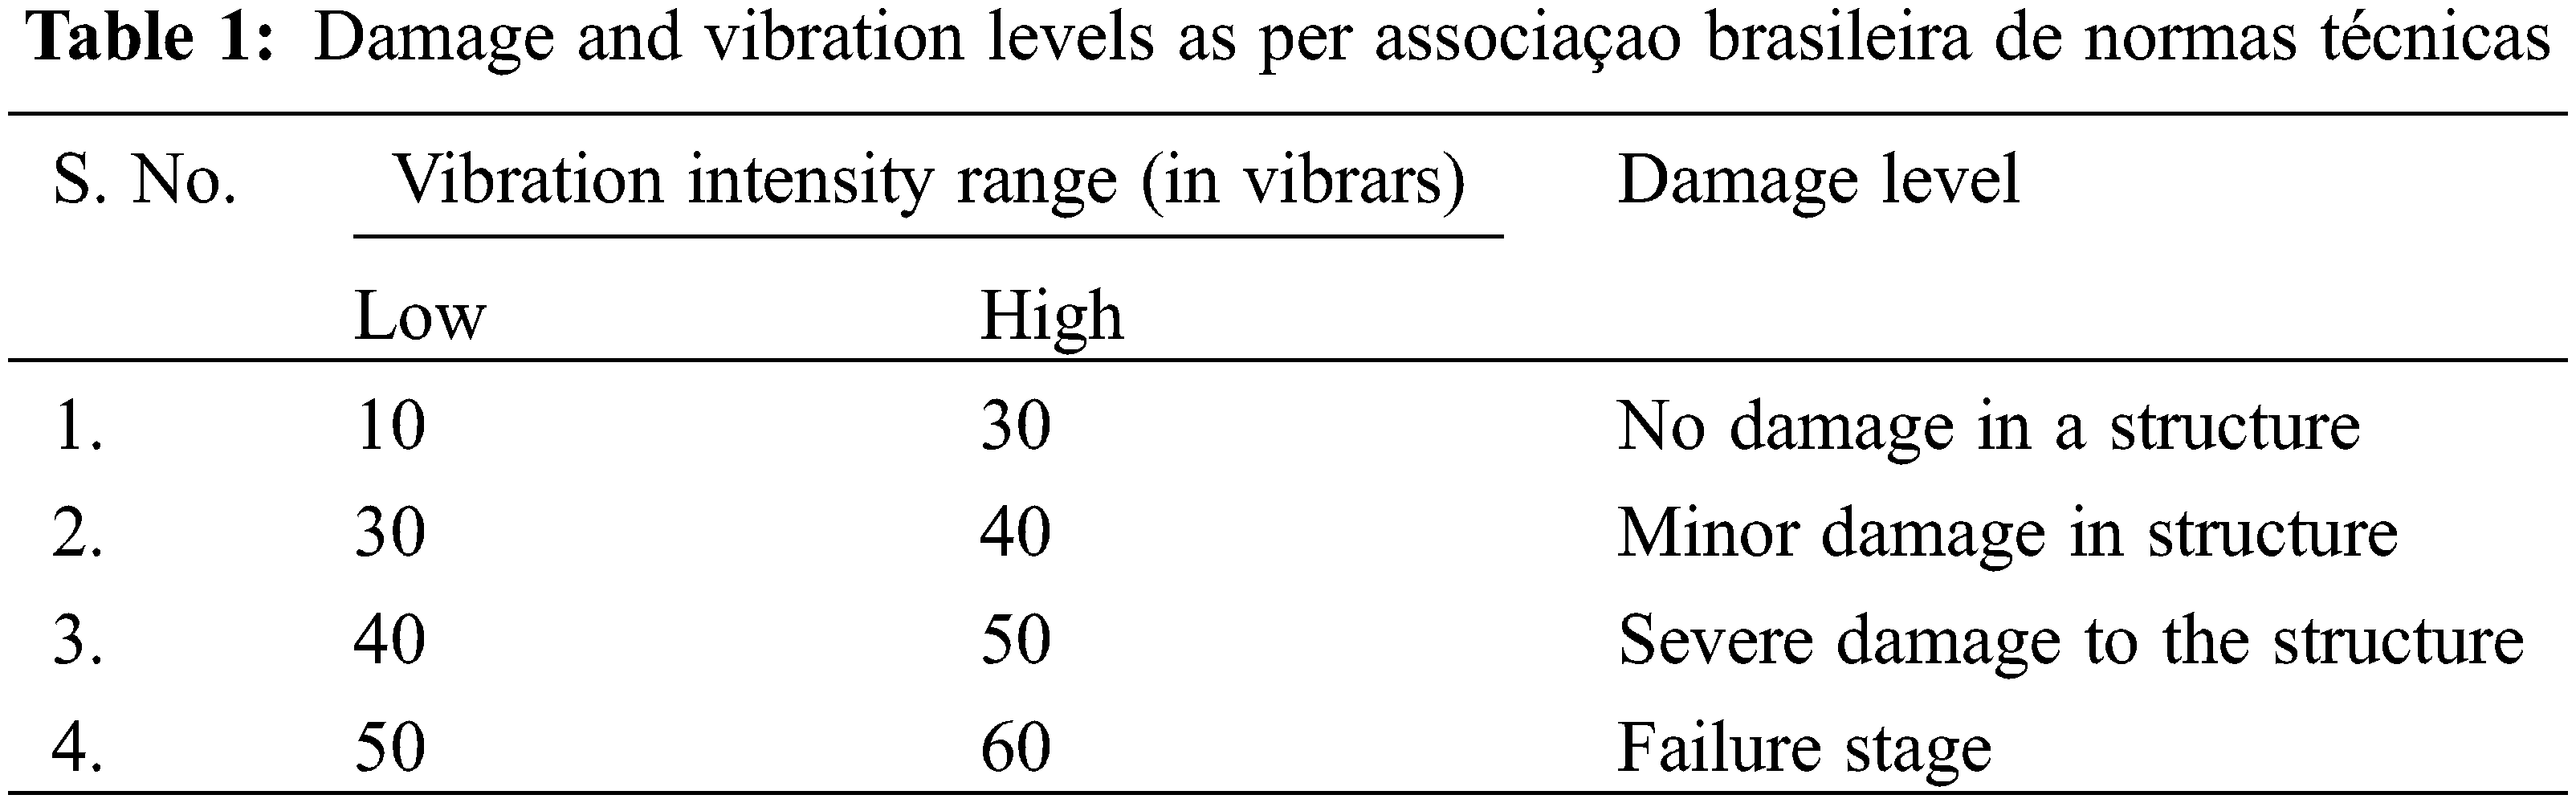
where ‘fcur’–current first bending natural frequency when dynamic tests are carried out, ‘fref’ first bending natural frequency recorded when the bridge was newly constructed. It is used as a signature for comparison. Vibration intensity was measured (in vibrars) from time-series of acceleration data captured from the bridges under normal traffic [19]. The degree of damage to any type of structures like bridges, multistory buildings with vibration intensity is measured to examine structural health. The damages initiated by inertial forces and squared mean value of acceleration at a particular frequency can be calculated using Eq. (2).
where ‘I’ represents vibration intensity. In the case of a simple harmonic, the amplitude of acceleration ‘a’ is represented as a0, and the term {ao2/f} is called vibration intensity in mm2/s3. The decibel form ‘S’ in Vibrars can be computed as 10*log10 (I/Is), where “Is” is a standard value typically set to be 10 mm2/s3.
DI = 1 means total damage, while DI = 0 means no damage. Some bridges may have negative values, indicating that the current bridge state is stiffer than the expected reference condition. It demonstrates that the reference model was built improperly. For particular bridges, a negative DI value can be presumed to be 0 and inspected visually. The typical data related to damage level is presented in Table 1.
All the strategies proposed to date can be summed up as a system comprising of sensors and regulators and a product stage for identification and examination of the occasion. There is almost no variety in equipment and that shifts as per extra necessity. Programming or the online stage utilized for investigation and checking has differed a great deal as for comfort. Typically those stages are either a few applications created utilizing programming dialects or there is some immediate visual checking again with the assistance of programming language. We will likely build up a framework that is not just constant yet in addition easy to understand and simple to utilize. We are living in a period wherein we can convey anyplace over the globe. The web is new asset apparatus for masses on which many frameworks can be built. We intend to develop a system using the internet which is used by 4.57 billion people, i.e., 59% of the global population which meets our goal of a user-friendly system.
Succeeding with a short discussion on connected work, there is a need for a system consisting of various sensors, controllers, an analytics platform for real-time analysis, and a module to send messages. To monitor bridge status parameters, different sensors are deployed like load cells for measuring the load, and a 3-axis accelerometer to sense bridge vibration [20,21]. These parameters are compared with the threshold value [22] and commented on the health of a bridge as shown in Fig. 1.
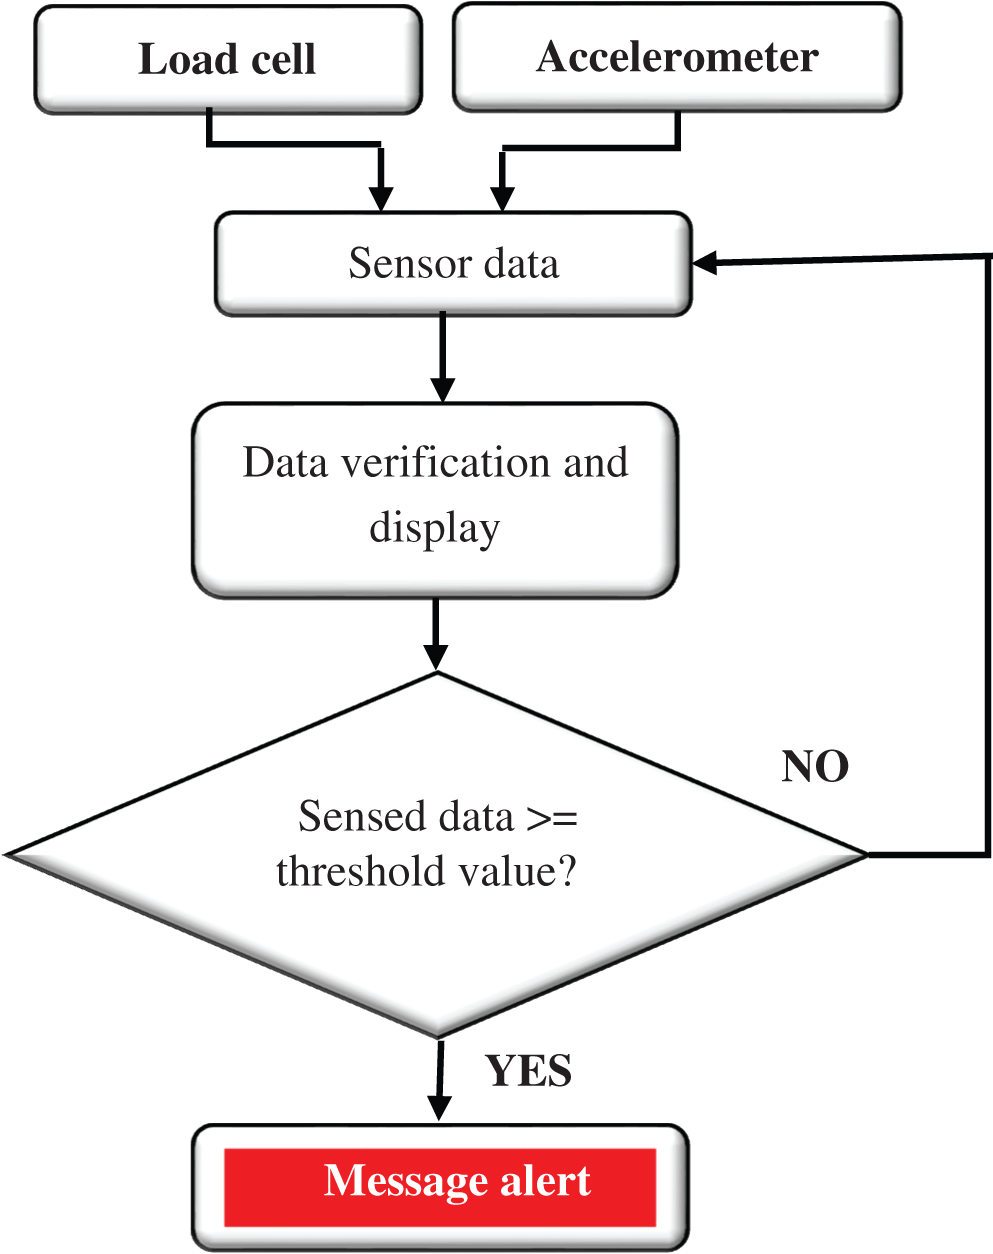
Figure 1: Flowchart of the sensing system
This paper is organized in different sections as discussed here. It describes the event of a smart sensing system for condition surveillance that specializes in systems represented within the connected work as mentioned in Section 2. An associated measuring system like load cells, data processing, hardware and software integration, and testing is discussed in Section 3 followed by conclusions in Section 4.
To meet the functional requirements of the structural health monitoring system, an attempt has been made to develop a wireless system with IoT. This work covers crucial parameters such as loading and vibrations. Our system is easy to operate, maintain and trigger early warning indications to the monitoring stations.
A load cell is employed to monitor the weight and cargo on the bridge where the load cell develops electrical signals of the same magnitude of the load or force that is being measured. The sensing unit with wireless connectivity is interfaced with the processing and condition monitoring unit as shown in Fig. 2.
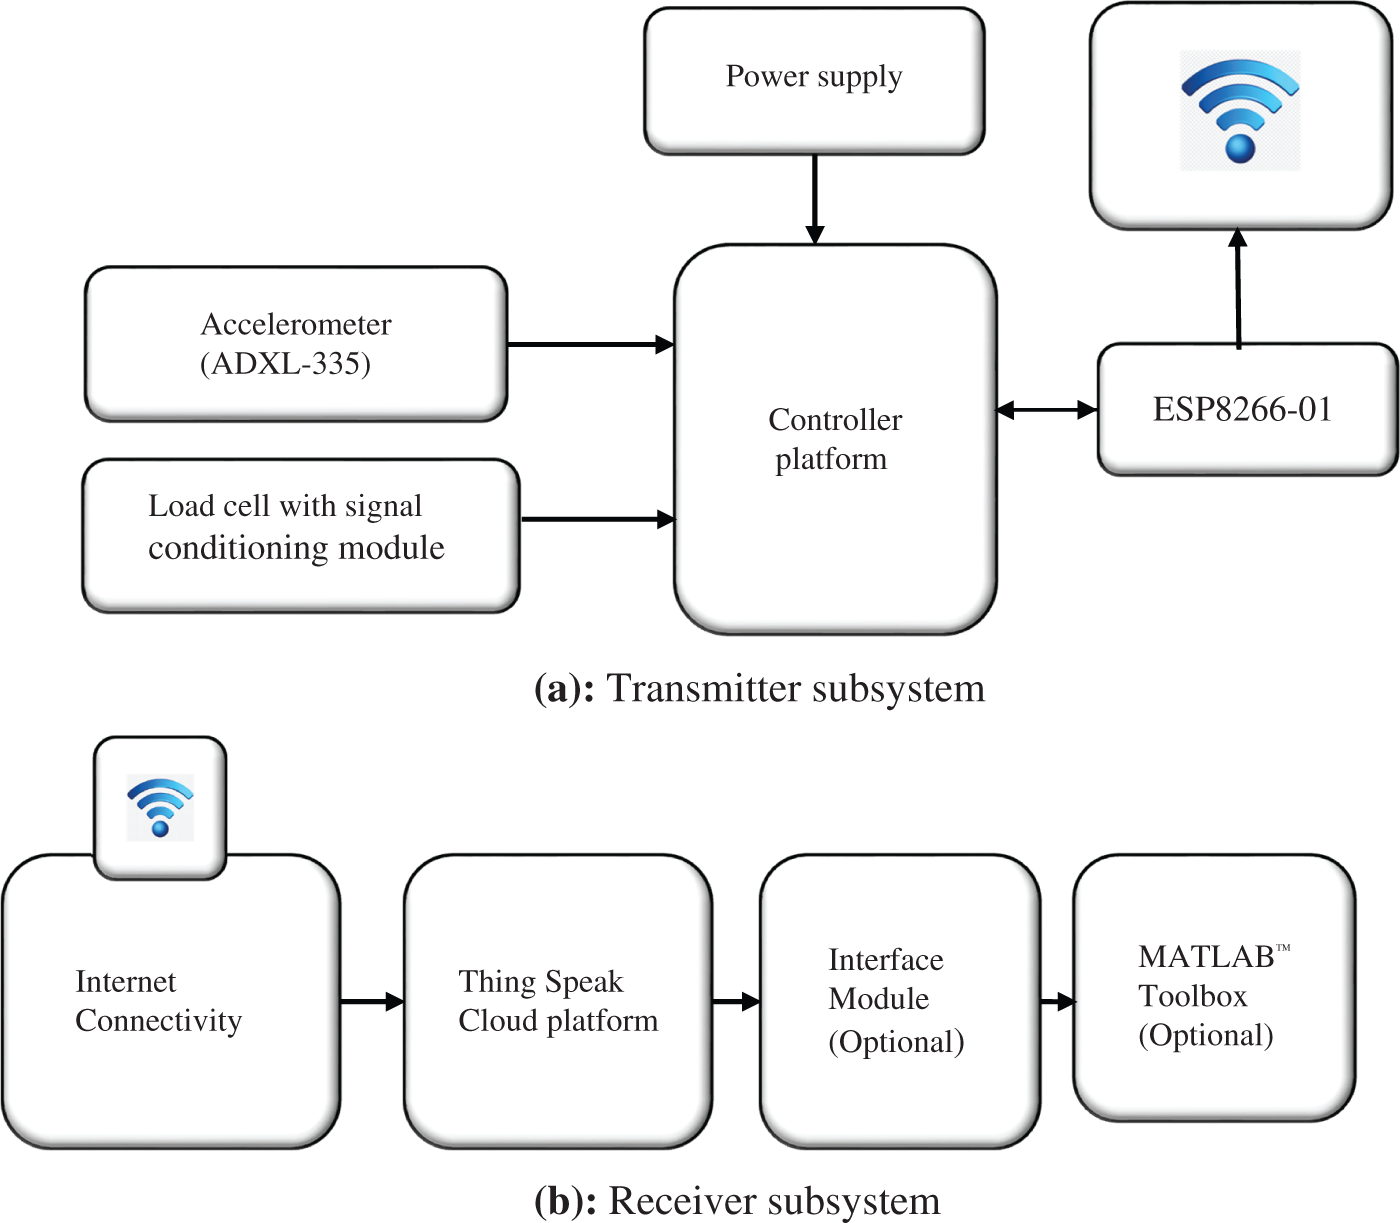
Figure 2: (a) Transmitter subsystem (b) Receiver subsystem
The weight measured by load cells helps in maintaining the integrity of the unit troubled and protects folks. There are several types of load cells available on the market which one can be chosen based on the requirements of the system designer. Typically load cells are developed by employing hydraulic, pneumatic, and strain gauge principles. The strain gauge is the most preferred due to its ease of installation and accuracy. The load cell senses the loading, convert, and provides an electrical analog output to the HX711 module. The controller converts numerical raw data into the load values in gram in our system. The low-end load cell has been used in our prototype which has limited weighing range and accuracy. However, high-end load cells are recommended for real-life applications. The concept proposed in this work is scalable and can fit the actual measurement with a minor change in the system.
A capacitive accelerometer has been used to gauge the acceleration forces (static and dynamic forces) acting on an object to determine the object’s position and trace movement. The static forces are constantly applied to the object such as friction or gravity whereas dynamic forces encompass varying forces applied to the object at different rates like vibration. The ADXL335 is a compact, low-power, 3-axis accelerometer with conditioned voltage outputs. This sensor was deployed to measure acceleration with a full-scale of ± 3 g where ‘g’ = 9.81 m/s2 as shown in the Fig. 3.
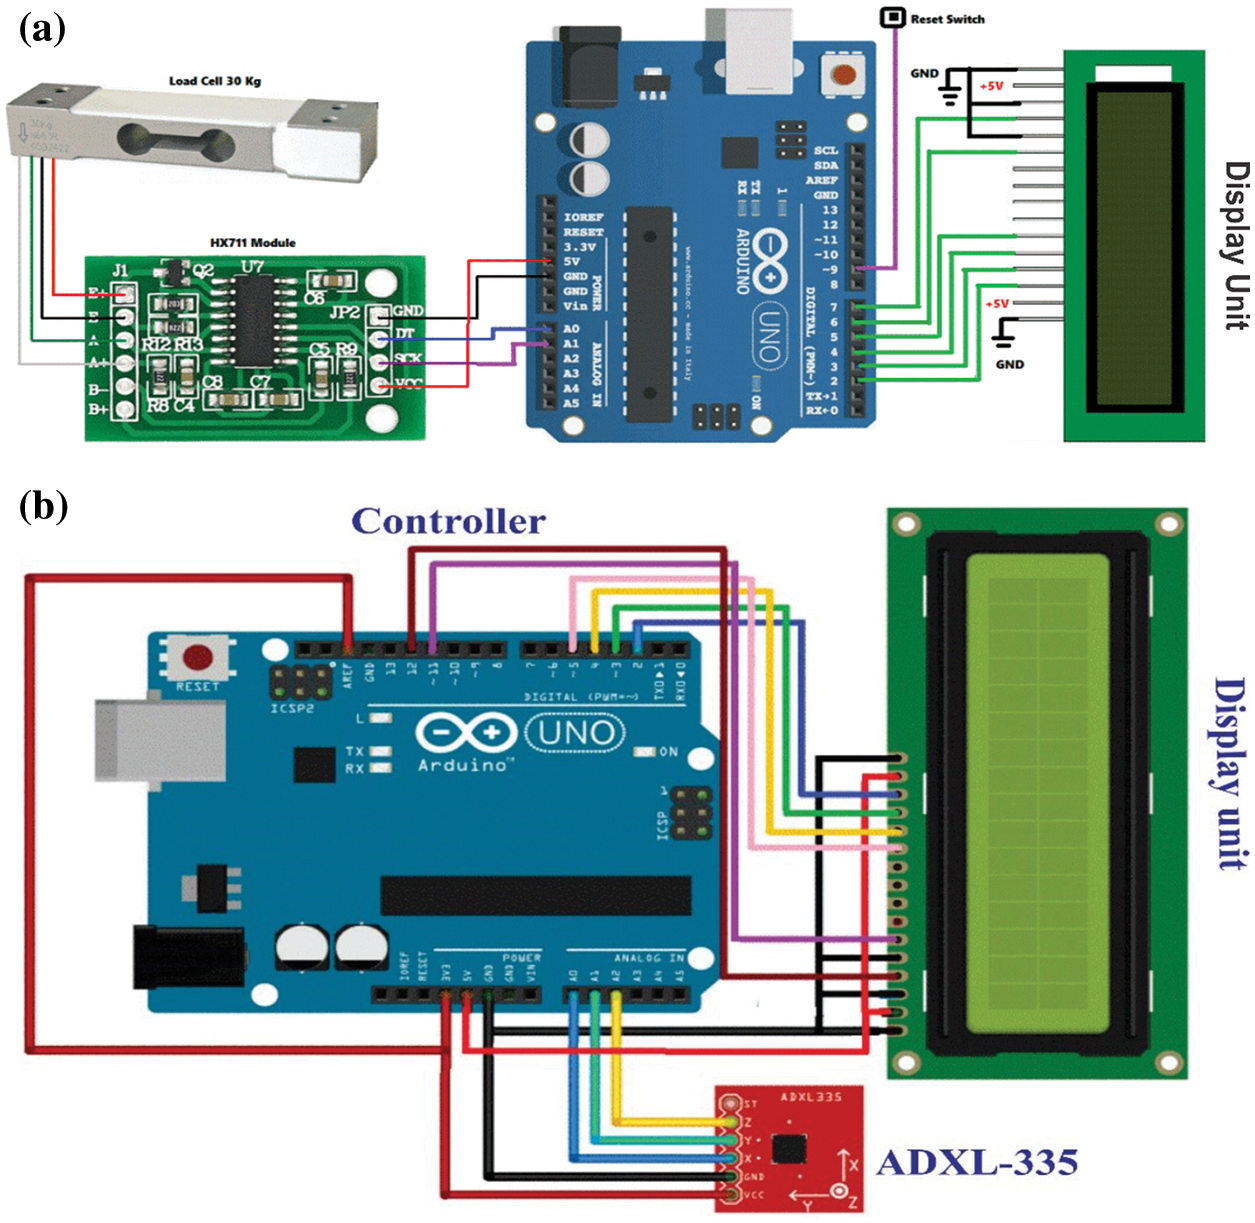
Figure 3: Interfacing diagram (a) Load cell, HX-711, and Arduino-UNO (b) ADXL-335, and Arduino-UNO
The ADXL335 is used to compute the angle of inclination or tilt by using X, Y, Z’s outputs followed by analog to digital conversion using 10 Bit ADC. Referring to the ADXL-335 datasheet, the peak voltage is 1.65 V at 0 g with the sensitivity scale factor of 330 mV/g at 3 volts supply. The Eqs. (3)–(6) provide the acceleration values for X, Y, and Z in ‘g’.
The individual output for X, Y, and Z can be computed using Eqs. (4)–(6).
Arduino platform was programed for capturing sensors values and transmit it wirelessly using ESP-8266 module. The values of the parameters are also displayed onboard display unit. Fig. 4 reveals our hardware prototype which monitors beam sustainability, weight, etc. At any instant, the system is programmed to generate an alarm whenever the cited parameters cross their limit for taking precautionary measures.
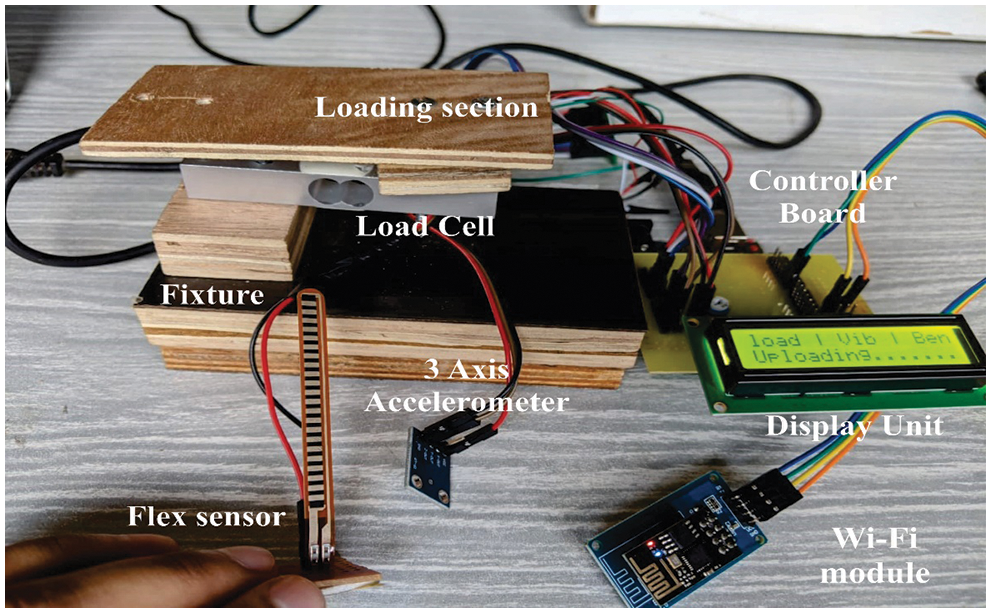
Figure 4: Dissembled view of our prototype
In addition to the sensing part, we need a platform where all this data is accumulated and visualized with markers in a real-time mode. To achieve interface, we established a connection between our hardware and real-time plotting platform. This paper focuses on the smart use of IoT platform which is defined as the system of interrelated devices that provides the ability to transfer data over a network without any human intervention. ESP module for internet connectivity was used which is a low-cost module that allows controllers to make simple TCP/IP connections using Hayes-style commands.
IoT encompasses web-enabled devices that collect, transmit and act on captured data relevant to surrounding environments using mounted sensors, controllers, and communication modules [23,24]. ThingSpeak is an open-source IoT analytics platform that permits us to accumulate, visualize, and analyze real-time data on cloud services. It can create graphical visualizations of live data when data is pushed from the system. Wi-Fi module is the crucial part of IoT System which work with API. It uses HTTP Protocol to transfer, store, and retrieve information from numerous sensors. The complete arrangement is shown in Fig. 5.
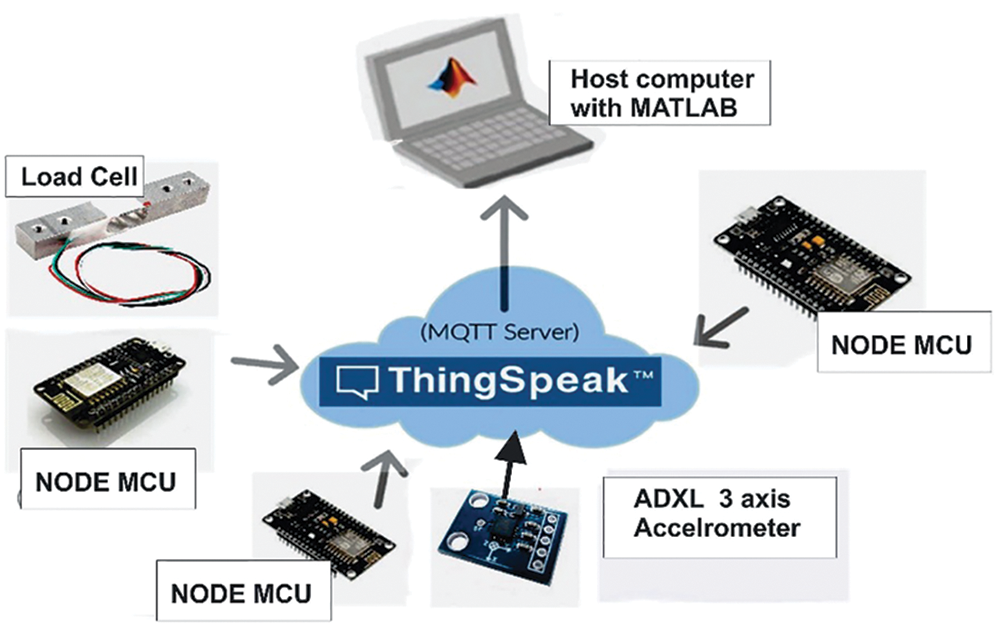
Figure 5: ThingSpeak communication using MQTT
A channel was created to load and process real-time data for analysis with a unique identification tag. To retrieve and load the data from a channel, the application sends the query to the ThingSpeak server by issuing HTTP requests, publishing MQTT messages.
Each channel can provide access to up to 8 fields of 255 characters each (numeric or alphanumeric). Each channel has location data and a standing update field. The data is entered with a date and time stamp so that it can be retrieved or sorted by time or entry ID. ThingSpeak API can be utilized to process numeric data such as time scaling, averaging, rounding, summing, and median, etc. ThingSpeak is a platform that uses channels to store data provided by the devices. To access this data from the channel we can use HTTP calls or use MQTT subscribe method to receive messages whenever the channel is updated [25]. The application developed on the MATLABTM platform was used to prepare, filter, and analyze data from a channel as shown in Fig. 6. The analysis and visualization applications provide template code to assist in carrying out various operations on past or live data.
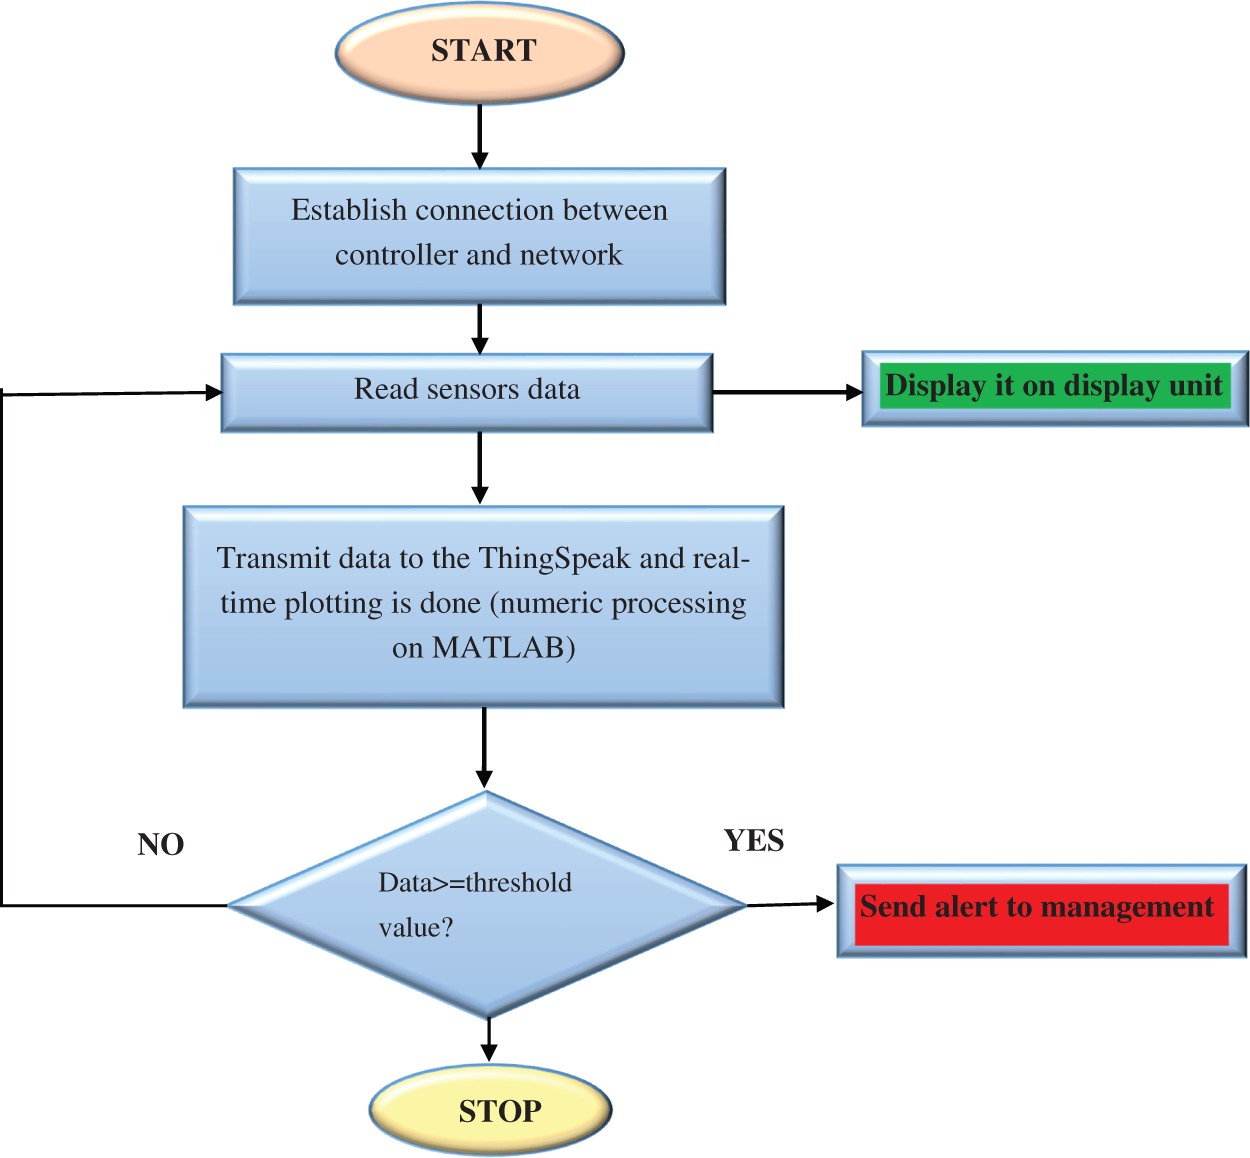
Figure 6: Flowchart for processing damage index value
In our prototype, load cell and accelerometer were used as discussed in Section 2. Fig. 7 reveals a few of the important events undertaken during capturing sensor data, uploading it to the server, and displaying the same on a display unit.
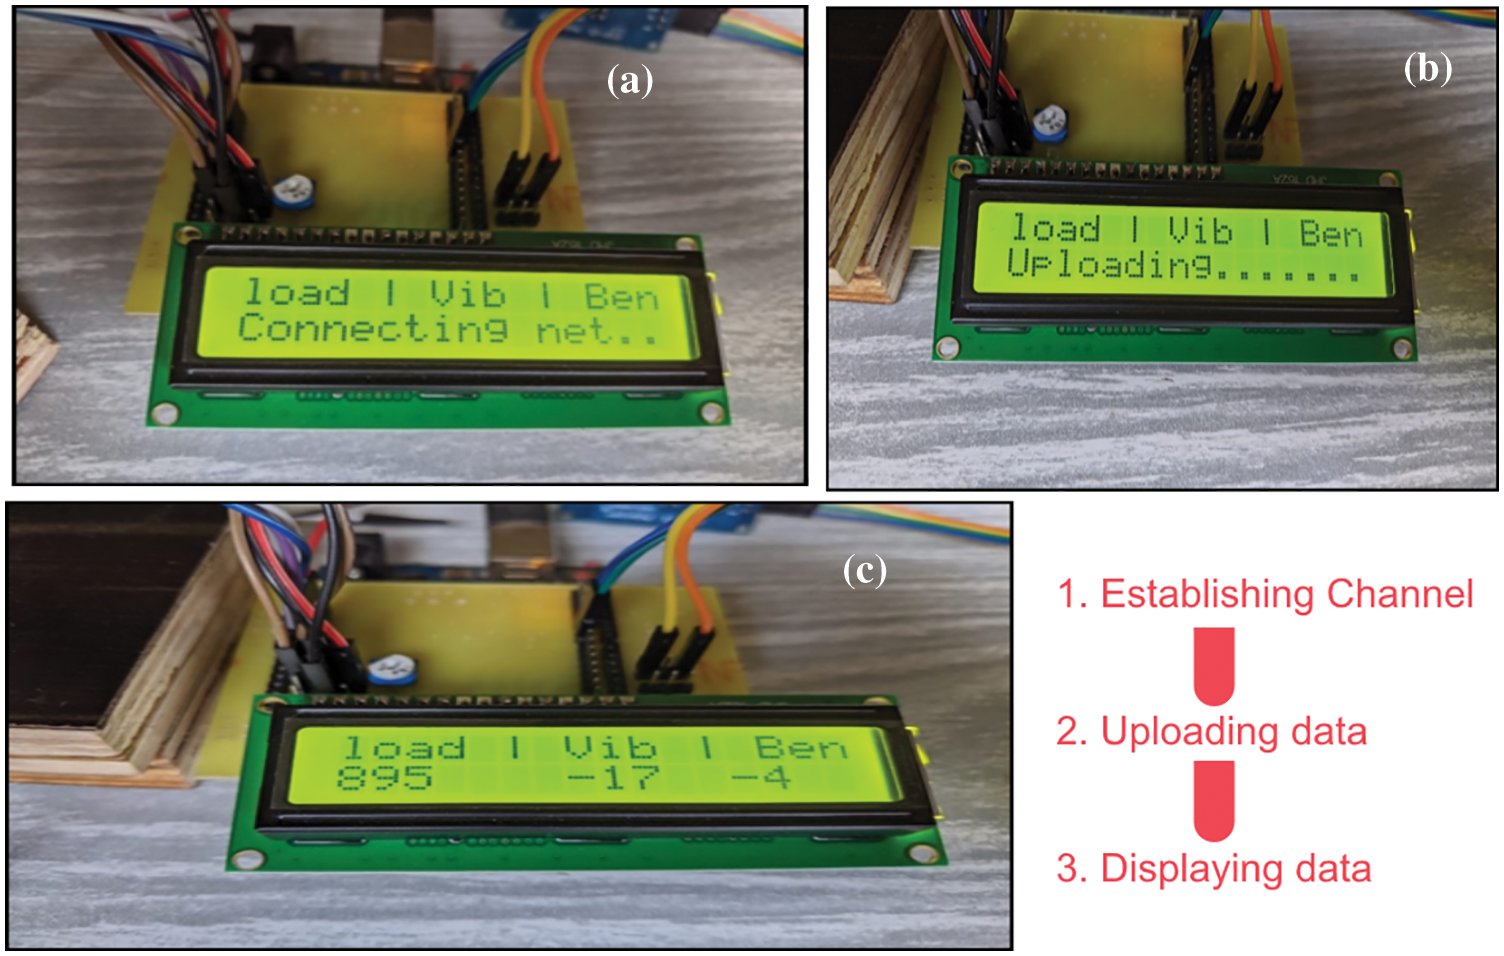
Figure 7: (a) The connection establishment (b) Uploading stage (c) Experimental data
The real-time plotting of the accumulated data takes place on each channel created on an IoT ThingSpeak platform. All the data logged on the cloud server has a date stamp as shown in Fig. 8.
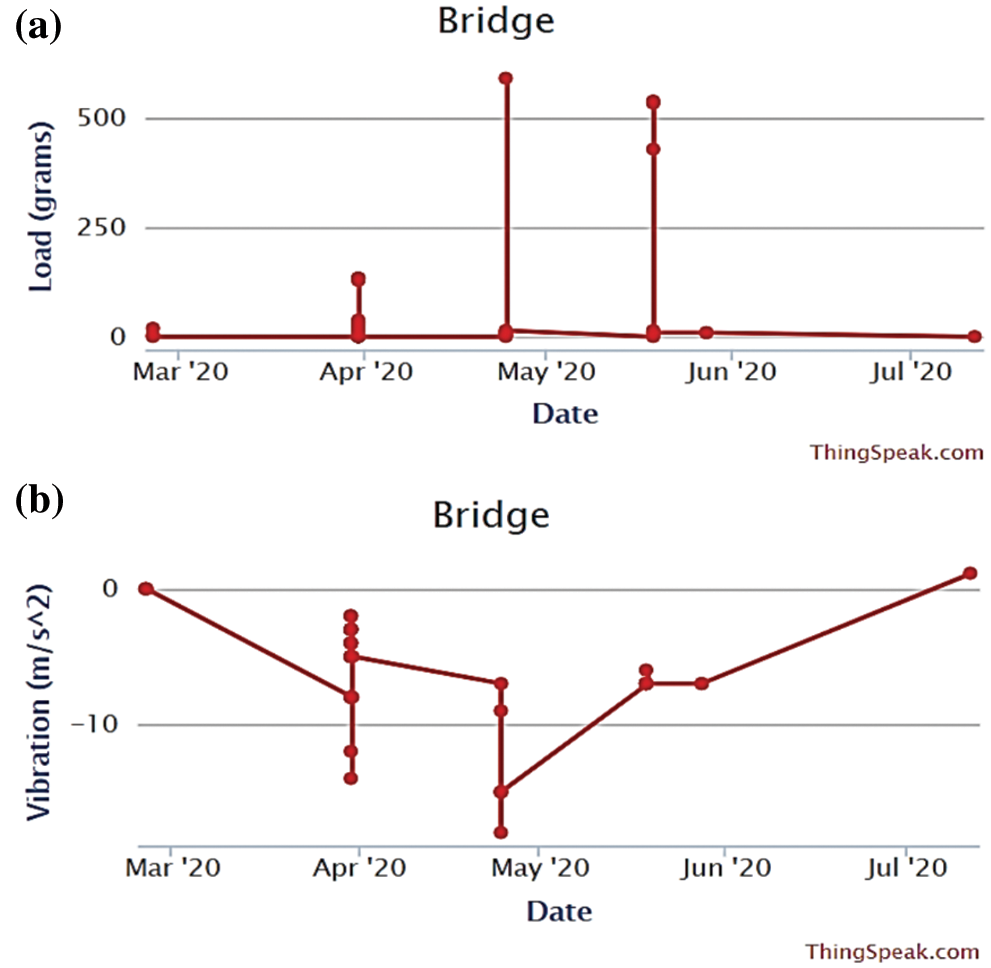
Figure 8: ThingSpeak data plots (a) Load plot (b) Vibration plot
The channel data was accessed through MATLABTM for detailed data analysis. This arrangement is optional in a few of the cases [26].
Fig. 9 shows the loading plot in which the ‘Y-axis represents load in gram and time in seconds on X-axis. A load cell with 30 kg capacity was used to evaluate loading at a particular point as per the recommendations of the civil structural engineer. The actual load capacity would differ in the actual case and typically lies in the range of tons [27]. The average, maximum, and Root Mean Square values of a varying load were 56.2, 590, and 147.6 grams respectively as shown in Fig. 9.
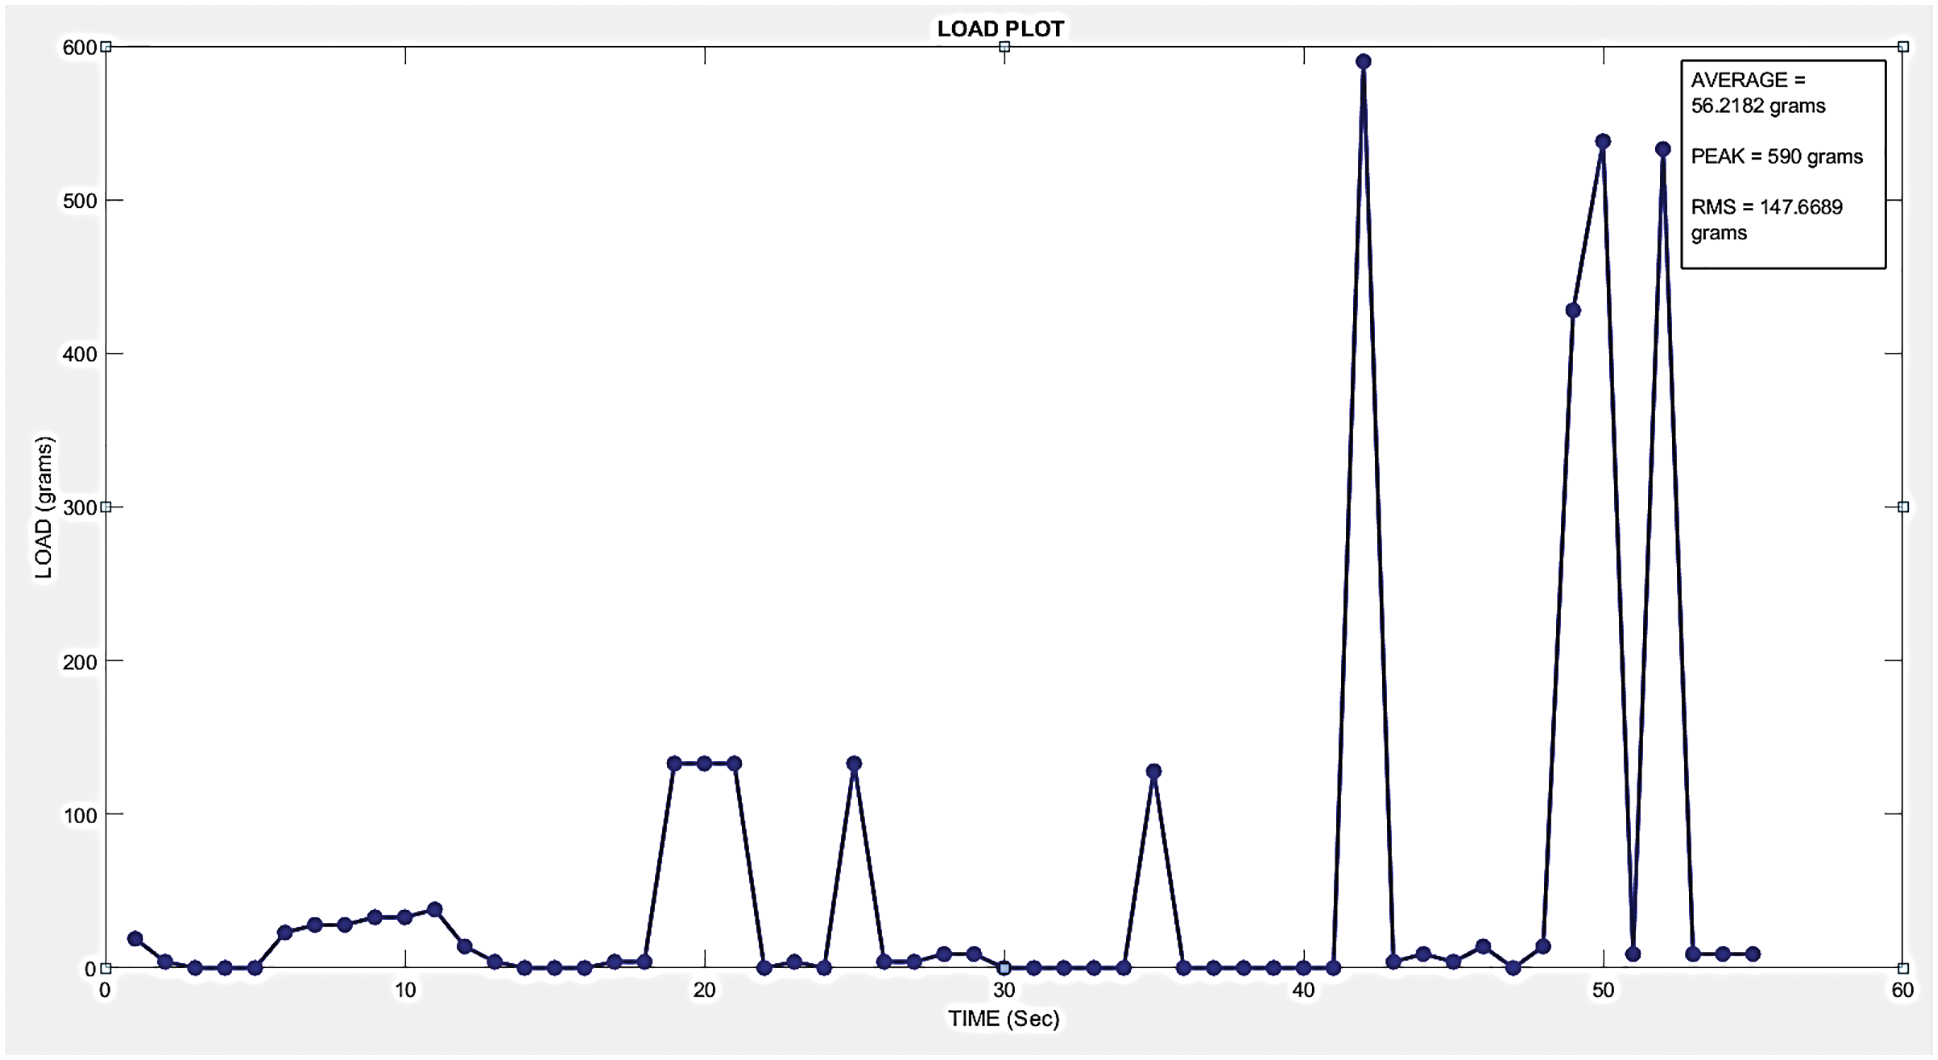
Figure 9: Time-domain loading plot
A similar process was carried for the vibration plot as well. The incentive on the y-axis is vibration in m/sec2 and the x-axis in seconds. According to the trial arrangement, the accompanying plot is obtained. The average, maximum, and RMS for vibration came out to be 5.87, 18 and 7.04 m/sec2 respectively as shown in Fig. 10. The negative sign indicates vibration in-z direction.
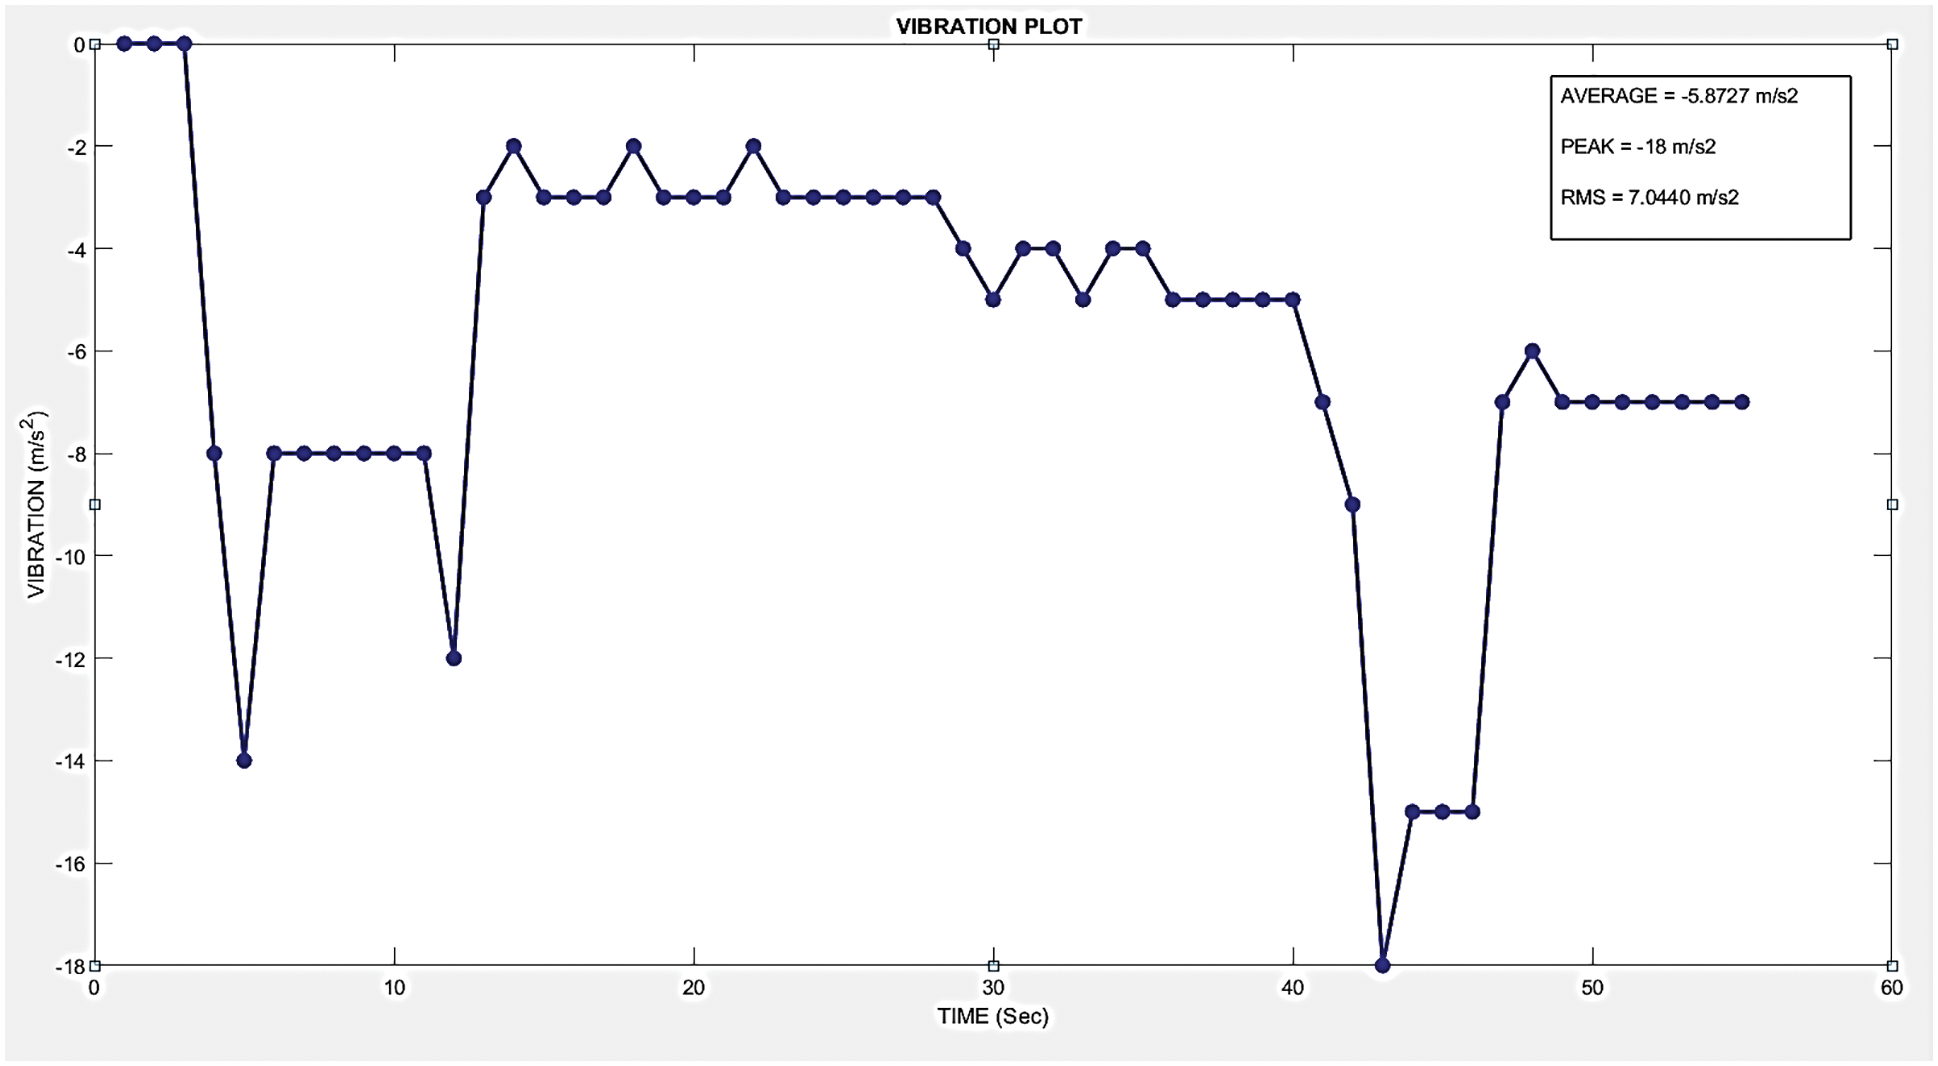
Figure 10: Time-domain vibration plot
The power spectral density can be defined as the squared value of the signal that describes the signal strength or time series distributed values over a frequency band. It transforms the time-domain signal to the frequency-domain signal which is used to estimate the spectral density of a random signal from a sequence of time samples. ‘Pspectrum’ MATLAB function returns the power spectrum to analyze signals in both the domains of the input signal as shown in Fig. 11. There are harmonic components with changing instantaneous frequency and vibration. Additionally, between 0 and 0.25 normalized frequency, the vibration amplitudes of all components are rapidly varied, as we expect the local resonance in this frequency region.
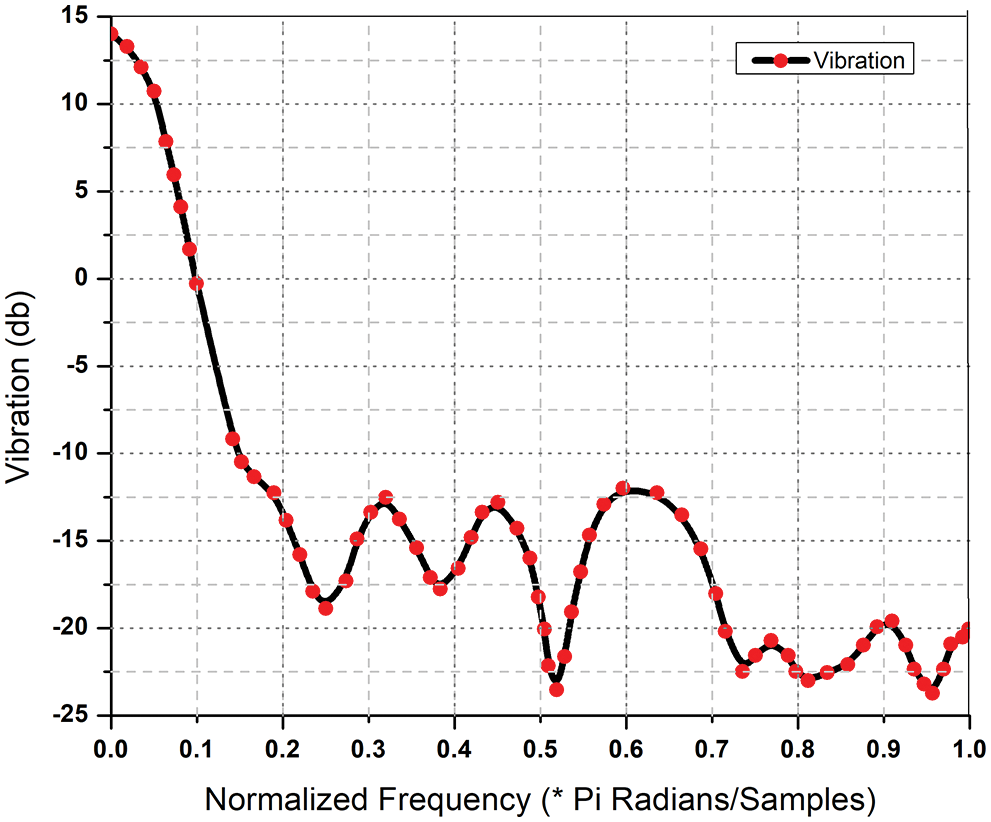
Figure 11: The power spectrum of a vibration plot
The bridge condition monitoring is of uttermost importance due to exhaustive use in India. It is high time to transfer economically viable technology to ease the monitoring process. A scalable system has been developed and tested for a sample load (56.21 gramsavg 590 gramsmax, and 147.66 gramsrms) with induced vibration (5.87 m/sec2avg, 18 m/sec2max and 7.04 m/sec2rms). It is found in a good degree of accuracy and acceptable time lag subjected to computing hardware and internet speed. It is used to monitor the bridge parameters at a specific interval, log to the server and judge the structural health. This work can be extended by developing an advanced system with industry-grade sensors, controllers and making it suitable for real-life applications with detailed dynamic analysis of the signals to interpret other crucial parameters.
Acknowledgement: This work was carried out as a part of a Sixth-Month Research Internship and Supported by YFRS (Young Faculty Research Funding Scheme), Shri Ramdeobaba College of Engineering and Management, Nagpur.
Funding Statement: The authors received no specific funding for this study.
Conflicts of Interest: The authors declare that they have no conflicts of interest to report regarding the present study.
References
1. Balpande, S. S., Lande, S. B., Akare, U. P., Thakre, L. P. (2009). Modeling of cantilever based power harvester as an innovative source of power for RFID Tag. 2009 Second International Conference on Emerging Trends in Engineering & Technology, pp. 13–18. Nagpur, India. [Google Scholar]
2. Bandyopadhyay, S. S. (2019). Maintenance of bridges in Indian railways: A review. In: Ministry of railways twenty third report. Sixteenth LOK SABHA Standing Committee on Railways. [Google Scholar]
3. Balpande, S. S., Pande, R. S., Patrikar, R. M. (2016). Design and low cost fabrication of green vibration energy harvester. Sensors and Actuators A: Physical, 251(1), 134–141. DOI 10.1016/j.sna.2016.10.012. [Google Scholar] [CrossRef]
4. Balpande, S. S., Bhaiyya, M. L., Pande, R. S. (2017). Low-cost fabrication of polymer substrate-based piezoelectric microgenerator with PPE, IDE and ME. Electronics Letters, 53(5), 341–343. DOI 10.1049/el.2016.4099. [Google Scholar] [CrossRef]
5. Balpande, S. S., Kalambe, J. P., Pande, R. S. (2019). Development of strain energy harvester as an alternative power source for the wearable biomedical diagnostic system. Micro & Nano Letters, 14(7), 777–781. DOI 10.1049/mnl.2018.5250. [Google Scholar] [CrossRef]
6. Balpande, S. S., Kalambe, J. P., Pande, R. S. (2018). Vibration energy harvester driven wearable biomedical diagnostic system. 2018 IEEE 13th Annual International Conference on Nano/Micro Engineered and Molecular Systems (NEMS), pp. 448–451.Singapore. [Google Scholar]
7. Balpande, S., Pande, S. (2022). Comparative evaluation of fabric yarn, polymers, and seed crust dielectrics for triboelectric energy harvesters. Journal of Electronic Materials, 51, 4270–4280. DOI 10.1007/s11664-022-09676-7. [Google Scholar] [CrossRef]
8. Swaraj, R., Prayag, A., Vedant, M., Shubham, A., Vishal, R. et al. (2022). TRIBO-SIM: A parametric simulation tool for triboelectric energy generators. International Journal of Ambient Energy, 2022, 1–11. DOI 10.1080/01430750.2022.2059002. [Google Scholar] [CrossRef]
9. Dhone, M. D., Gawatre, P. G., Balpande, S. S. (2018). Frequency band widening technique for cantilever-based vibration energy harvesters through dynamics of fluid motion. Materials Science for Energy Technologies, 1(1), 84–90. DOI 10.1016/j.mset.2018.06.002. [Google Scholar] [CrossRef]
10. Ali, S. H., Zaid, M., Abdullah, M., Khan, T. M. R. (2018). SHM of concrete bridge structures using wireless sensor networks. European Conference on Smart Objects, Systems and Technologies, pp. 1–6.Munich, Germany. [Google Scholar]
11. Liu, Y., Voigt, T., Wirström, N., Höglund, J. (2018). Ecovibe: On-demand sensing for railway bridge structural health monitoring. IEEE Internet of Things Journal, 6(1), 1068–1078. DOI 10.1109/JIOT.2018.2867086. [Google Scholar] [CrossRef]
12. Jattalwar, N., Balpande, S. S., Shrawankar, J. A. (2020). Assessment of denim and photo paper substrate-based microstrip antennas for wearable biomedical sensing. Wireless Personal Communications, 115, 1993–2003. DOI 10.1007/s11277-020-07665-9. [Google Scholar] [CrossRef]
13. Siriya, P., Shrawankar, J. A., Balpande, S. S. (2019). Design and development of inset feed microstrip patch antennas using various substrates. International Journal of Innovative Technology and Exploring Engineering, 8(9), 163–167. DOI 10.35940/ijitee. [Google Scholar] [CrossRef]
14. Balpande, S., Yenorkar, S. (2019). Optimization of energy harvester for trapping maximum body motions to power wearables. Sensor Letters, 17(1), 46–54. DOI 10.1166/sl.2019.4003. [Google Scholar] [CrossRef]
15. Khan, S., Atamturktur, S., Chowdhury, M., Rahman, M. (2016). Integration of structural health monitoring and intelligent transportation systems for bridge condition assessment: Current status and future direction. IEEE Transactions on Intelligent Transportation Systems, 17(8), 2107–2122. DOI 10.1109/TITS.2016.2520499. [Google Scholar] [CrossRef]
16. Reyer, M., Hurlebaus, S., Mander, J., Ozbulut, O. E. (2011). Design of a wireless sensor network for structural health monitoring of bridges. 2011 Fifth International Conference on Sensing Technology, pp. 515–520. Palmerston North, New Zealand. [Google Scholar]
17. Jian, X., Hongki, J. (2015). Development of high-sensitivity and low-cost electroluminescent strain sensor for structural health monitoring. IEEE Sensors Journal, 16(7), 1962–1968. DOI 10.1109/JSEN.2015.2509261. [Google Scholar] [CrossRef]
18. Casas, J. R., Moughty, J. J. (2017). Bridge damage detection based on vibration data: Past and New developments. Front. Built Environ, 3(4), 1–12. DOI 10.3389/fbuil.2017.00004. [Google Scholar] [CrossRef]
19. Kumar, A., Balpande, S. S. (2014). MEMS based bridge health monitoring system. International Journal of Advances in Science, Engineering and Technology, 2(4), 14–18. [Google Scholar]
20. Balpande, S. S., Pande, R. S., Patrikar, R. M. (2021). Grains level evaluation and performance enhancement for piezoelectric energy harvester. Ferroelectrics, 572(1), 71–93. DOI 10.1080/00150193.2020.1868874. [Google Scholar] [CrossRef]
21. Suvarna, K. G., Suresh, S. B. (2019). A comprehensive review of micro and nano scale piezoelectric energy harvesters. Sensor Letters, 17, 1–15. [Google Scholar]
22. Dhone, M. D., Balpande, S., Kalambe, J. (2019). Energy harvester: A green power source for wearable biosensors. Sensor Letters, 17(1), 55–63(9). DOI 10.1166/sl.2019.3984. [Google Scholar] [CrossRef]
23. Vitekar, S. N., Patil, V. A. (2017). Automatic bridge monitoring system using wireless sensor network. IOSR Journal of Electronics and Communication Engineering, 12(6), 29–33. [Google Scholar]
24. Avci, O., Abdeljaber, O., Kiranyaz, S., Hussein, M., Inman, D. J. (2018). Wireless and real-time structural damage detection: A novel decentralized method for wireless sensor networks. Journal of Sound and Vibration, 424, 158–172. DOI 10.1016/j.jsv.2018.03.008. [Google Scholar] [CrossRef]
25. Charlotte, D. (2020). Set up a NodeMCU to communicate with ThingSpeak using MQTT. https://medium.com/@chardorn/set-up-a-nodemcu-to-communicate-with-thingspeak-using-mqtt-fbad7556a5bc. [Google Scholar]
26. Chakole, P., Rathee, V., Kalambe, J., Kulkarni, P., Balpande, S. (2019). Design and development of triboelectric blue energy harvester. International Journal of Engineering and Advanced Technology, 8(5), 1287–1283. [Google Scholar]
27. Eun-Taik, L., Hee-Chang, E. (2016). Structural damage detection by power spectral density estimation using output-only measurement. Shock and Vibration, 2016, 1–13. [Google Scholar]
Cite This Article
 Copyright © 2022 The Author(s). Published by Tech Science Press.
This work is licensed under a Creative Commons Attribution 4.0 International License , which permits unrestricted use, distribution, and reproduction in any medium, provided the original work is properly cited.
 Downloads
 Citation Tools