
 Submit a Paper
 Propose a Special lssue
 Open Access
ARTICLE

AI-driven radiogenomic analysis of clear cell renal cell carcinoma: perinephric adipose tissue stranding as a key feature of the NIPAL4-associated imaging pattern
1 Department of Radiology, Cittadella della Salute, Azienda Sanitaria Locale di Lecce, Piazza Filippo Bottazzi, 2, Lecce, 73100, Italy
2 Research Unit of Radiology, Department of Medicine and Surgery, Università Campus Bio-Medico di Roma, Via Alvaro del Portillo, 21, Roma, 00128, Italy
3 Apphia srl, via per Monteroni, Lecce, 73100, Italy
4 Fondazione Policlinico Universitario Campus Bio-Medico, Via Alvaro del Portillo, 200, Roma, 00128, Italy
5 Department of Medical Surgical Sciences and Translational Medicine, Sapienza University of Rome, Radiology Unit, Sant’Andrea University Hospital, Via di Grottarossa, 1035–1039, Roma, 00189, Italy
6 Department of Urology, “Vito Fazzi” Hospital, Piazza Filippo Muratore, 1, Lecce, 73100, Italy
* Corresponding Authors: Federico Greco. Email: ,
(This article belongs to the Special Issue: AI, Radiomics, and Radiogenomics in Urologic Oncology: Toward a New Era of Precision Imaging)
Canadian Journal of Urology 2025, 32(5), 433-443. https://doi.org/10.32604/cju.2025.068390
Received 28 May 2025; Accepted 22 August 2025; Issue published 30 October 2025
 View Full Text
 Download PDF
Abstract
Background: Radiogenomics offers a non-invasive approach to correlate imaging features with tumor molecular profiles. This study aims to identify computed tomography (CT) imaging characteristics associated with positive NIPA-like domain containing 4 (NIPAL4) expression in clear cell renal cell carcinoma (ccRCC) and to develop a radiogenomic predictive model to support personalized risk stratification. Methods: A retrospective analysis was conducted on 241 ccRCC patients from The Cancer Genome Atlas (TCGA) and The Cancer Imaging Archive (TCIA) databases. Clinical, pathological, and CT features were compared between NIPAL4-positive and NIPAL4-negative groups. A penalized logistic regression model was built to predict NIPAL4 expression, and its performance was assessed using Receiver Operating Characteristic (ROC) and Decision Curve Analysis (DCA). Additionally, unsupervised K-means clustering was used to identify radiologic phenotypes, and a nomogram was developed to enable individualized risk estimation. Results: Among 241 ccRCC patients, 29 (12.03%) showed positive NIPAL4 expression. Compared to NIPAL4-negative cases, positive expression was significantly associated with larger tumor size (median 70.5 mm vs. 52 mm, p = 0.0371), ill-defined margins (61.5% vs. 32.4%, p = 0.0077), perinephric adipose tissue stranding (76.9% vs. 50.0%, p = 0.0114), renal vein thrombosis (24.0% vs. 4.7%, p = 0.021), Gerota’s fascia thickening (61.5% vs. 35.2%, p = 0.0163), and collecting system invasion (52.0% vs. 26.5%, p = 0.0171). A multivariate penalized logistic regression model incorporating these features achieved an AUC of 0.973% and 92.1% accuracy in predicting NIPAL4 positivity. Conclusions: Positive NIPAL4 expression in ccRCC is significantly associated with aggressive CT features—particularly perinephric adipose tissue stranding, ill-defined margins, and renal vein thrombosis. A radiogenomic model based on these features achieved excellent predictive performance (AUC = 0.973), supporting its potential role in non-invasive risk stratification and personalized clinical decision-making.Keywords
Radiogenomics explores the association between image-based features and genomic alterations.1,2 Imaging methods provide a macroscopic perspective on molecular activity, collectively referred to as radiologic phenotypes.1,2 The Cancer Genome Atlas (TCGA) Research Network offers an extensive dataset on gene expression profiles and genetic mutations related to clear cell renal cell carcinoma (ccRCC).3,4 Radiogenomic analysis presents multiple important advantages. In contrast to biopsy procedures, it is entirely non-invasive, eliminating the potential risks and complications tied to sample removal. Whereas biopsies yield information limited to the sampled area, radiogenomics assesses the entire tumor mass, offering genomic insights across the whole lesion. This broader perspective is essential for capturing tumor heterogeneity, a critical factor in precise prognostic evaluation. Traditional biopsies might overlook key genetic alterations or expression patterns that are vital for the development of targeted treatment strategies.5–11
Additionally, radiogenomics facilitates longitudinal monitoring of the tumor’s genomic profile throughout follow-up, enabling assessment of how genetic traits evolve in response to therapy. It also supports the evaluation of multiple lesions at once. Furthermore, imaging methods can measure body composition and correlate it with genomic characteristics.5
The magnesium transporter NIPA-like domain containing 4 (NIPAL4) has recently gained attention as a pivotal protein within the broader context of biological sciences.12–14 NIPAL4 plays a crucial role in regulating epidermal lipid metabolism and maintaining magnesium ion (Mg2+) balance, with Mg2+ acting as a secondary messenger in numerous cellular functions.15–17 Magnesium ions are closely associated with key processes in tumor cells, including proliferation, metabolic reprogramming, and resistance to apoptosis.18,19
A recent study found that NIPAL4 is overexpressed in several tumor types, especially in ccRCC, where its high expression correlates with poor prognosis and advanced disease stages.20 Bioinformatic and experimental analyses suggest that NIPAL4 plays a role in extracellular matrix remodeling, lipid metabolism, and regulation of the TGF-β pathway, key mechanisms in tumor progression and immune cell infiltration. It has also been associated with increased immune cell presence and immune checkpoint expression, indicating its impact on the tumor microenvironment. Interestingly, NIPAL4 does not seem to influence tumor mutational burden or microsatellite instability. These findings highlight NIPAL4 as both a potential prognostic biomarker and a promising target for new therapeutic strategies in ccRCC.20
So far, the radiogenomic characteristics linked to NIPAL4 expression in ccRCC have not been investigated. This retrospective work seeks to examine the computed tomography (CT) features associated with NIPAL4 positivity in ccRCC cases. Based on its functional role, we hypothesize that NIPAL4 expression may be related to a more aggressive radiologic presentation. A CT-based assessment could therefore provide meaningful information on NIPAL4 expression patterns in ccRCC.
TCGA, a project supported by the National Cancer Institute together with the National Human Genome Research Institute, serves as a large-scale repository of genomic alterations spanning more than 20 cancer types, including ccRCC. Contributing institutions provided tissue samples after obtaining approval from their respective institutional review boards, and these specimens underwent extensive multiplatform genomic characterization. Complementing this resource, The Cancer Imaging Archive (TCIA), also funded by the National Cancer Institute, hosts a de-identified collection of medical images in DICOM format. Pretreatment imaging from TCIA is systematically matched with TCGA tissue samples through unique identifiers, making both genomic and radiologic datasets publicly available.
In this study, we used data from The Cancer Genome Atlas Kidney Renal Clear Cell Carcinoma (TCGA-KIRC) dataset, available through the Genomic Data Commons Data Portal (https://portal.gdc.cancer.gov/), and matched pretreatment contrast-enhanced CT scans from The Cancer Imaging Archive (TCIA) (https://www.cancerimagingarchive.net/). From TCGA, we specifically analyzed RNA-seq gene expression profiles for NIPAL4 together with the corresponding clinicopathological information, while from TCIA we retrieved DICOM-format CT images linked to the same patients through unique TCGA identifiers. The study population consisted of cases with histologically confirmed ccRCC for which both complete genomic and imaging datasets were available, and with CT images of sufficient quality for radiological assessment. Patients with incomplete data or with a history of surgical or interventional procedures that could alter the radiologic appearance were excluded from the analysis. A total of 241 patients were included in the study, of whom 212 (87.97%) showed negative NIPAL4 expression and 29 (12.03%) showed positive expression.
Data extraction and preprocessing
Clinical, genomic, and imaging data were obtained from TCGA-KIRC and TCIA databases. Inclusion criteria were: histologically confirmed ccRCC; availability of matched genomic expression data for NIPAL4 from TCGA; availability of pretreatment contrast-enhanced CT scans from TCIA; and sufficient image quality for radiological assessment. Patients with incomplete genomic or imaging datasets were excluded.
Genomic data were downloaded via the Genomic Data Commons (GDC) Data Portal, and NIPAL4 expression was dichotomized based on the median expression value. Radiological data were extracted from TCIA in DICOM format and reviewed using Horos v.4.0.0. Clinical-pathological data were matched using TCGA code identifiers.
Image interpretation was independently performed by two experienced radiologists (Federico Greco, 9 years’ experience; Carlo Augusto Mallio, 13 years’ experience), blinded to clinical and genomic information. Radiologic features were assessed according to standardized CT evaluation criteria. Preprocessing included anonymization, standardization of window/level settings, and exclusion of scans with artifacts or incomplete imaging phases.
For each ccRCC case, CT scans were analyzed to characterize a series of imaging parameters, including: tumor size [measured in millimeters (mm)], composition (solid vs. cystic), margin definition (well-defined or ill-defined), tumor necrosis (evaluated only in solid lesions and classified as 0%, 1%–33%, 34%–66%, or >66%), growth pattern (endophytic, <50% exophytic, or ≥50% exophytic), calcifications (present or absent), laterality (right or left kidney), evidence of collateral vascular supply (e.g., macroscopically enlarged renal capsular veins visible on CT or MRI), intralesional hemorrhage, infiltration, collecting system invasion, hydronephrosis, renal artery thrombosis, and renal vein thrombosis.5,21–23
Additional CT findings considered were the presence of Gerota’s fascia thickening and perirenal fat stranding.5,22,23
Tumor size was determined by recording the maximum axial diameter on contrast-enhanced images, expressed in millimeters, consistent with prior radiogenomic evaluations.5,21–23 Margins were classified as well-defined when more than 90% of the lesion’s circumference showed a sharp, “pencil-thin” interface with the renal parenchyma, collecting system, or perirenal adipose tissue in post-contrast scans.5,21–23 This evaluation was carried out with window settings of width 400 and level 50.5,21–23
Tumors were labeled as cystic when at least half (≥50%) of their volume consisted of clearly defined cystic areas showing fluid attenuation values (≤20 Hounsfield units [HU]). Lesions with less than 50% cystic content or entirely lacking it were classified as solid.5,21–23
Tumor necrosis was evaluated during nephrographic or excretory phases and identified as non-enhancing hypodense areas lacking distinct walls, allowing differentiation from cystic regions.5,21–23 Calcifications were recognized as hyperdense foci or plaques, with uncertain cases confirmed when maximum HU values exceeded 60.5,21–23 Intralesional hemorrhage was detected by identifying regions with attenuation values typical of blood density (+30 to +80 HU).5,21–23 In situations where hemorrhage and calcifications exhibited overlapping HU values, two radiologists specializing in oncologic imaging (Federico Greco, 9 years’ experience; Carlo Augusto Mallio, 13 years’ experience) reviewed morphological characteristics to distinguish between them.5,21–23
Infiltration was defined as the spread of tumor tissue into neighboring normal structures, observed on post-contrast images.5,21–23 Hydronephrosis was diagnosed by identifying urinary tract dilation on enhanced scans.5,21–23 Thrombosis of the renal artery or vein was determined by detecting intraluminal filling defects consistent with thrombus presence in post-contrast studies.5,21–23 Collecting system invasion was assessed during the excretory phase and identified by tumor-related filling defects within the collecting system.5,21–23
All imaging characteristics were reviewed using Horos v.4.0.0 RC2 software. The evaluation was carried out by two radiologists (Federico Greco and Carlo Augusto Mallio, with 9 and 13 years of experience, respectively), who reached a consensus while being blinded to genomic and clinicopathological information.5,21–23
Statistical analyses were conducted to compare clinical, pathological, and radiological features between NIPAL4-negative and NIPAL4-positive patients. Continuous variables were expressed as median and interquartile range (IQR) and compared using the Mann-Whitney U test, while categorical variables were analyzed using Pearson’s Chi-square test or Fisher’s exact test, depending on distribution. Statistical significance was set at p < 0.05.
In addition to traditional statistical analyses, our study employed artificial intelligence methodologies to develop the predictive model. Specifically, a penalized logistic regression (Ridge regression) model was implemented using the Scikit-learn package in Python (v3.10), representing a supervised machine learning approach. The model was trained on a dataset incorporating clinical and radiologic features and validated using 5-fold cross-validation. To address class imbalance due to the limited number of NIPAL4-positive cases, we applied random oversampling of the minority class. Additionally, an unsupervised K-means clustering algorithm was used to identify distinct radiologic phenotypes without prior knowledge of molecular expression. The source code used for model development and analysis is available from the corresponding authors upon request and can be made accessible via GitHub to ensure transparency and reproducibility.
Patients with positive NIPAL4 expression were significantly older compared to those with negative expression (median age 65 vs. 58 years, p = 0.0052). Primary tumor size was also significantly larger in the positive expression group (70.5 mm vs. 52 mm, p = 0.0371). No significant differences were observed regarding sex, laterality, tumor grade, or stage.
Several CT-based features were significantly associated with positive NIPAL4 expression. Patients with positive expression more frequently presented with ill-defined tumor margins (61.54% vs. 32.37%, p = 0.0077), perinephric adipose tissue stranding (76.92% vs. 50.00%, p = 0.0114), Gerota’s fascia thickening (61.54% vs. 35.23%, p = 0.0163), collecting system invasion (52.00% vs. 26.47%, p = 0.0171), and renal vein thrombosis or infiltration (24.00% vs. 4.71%, p = 0.021). Hydronephrosis was also more frequent in the positive group (12.00% vs. 1.74%, p = 0.0281) (Table 1 and Figure 1).
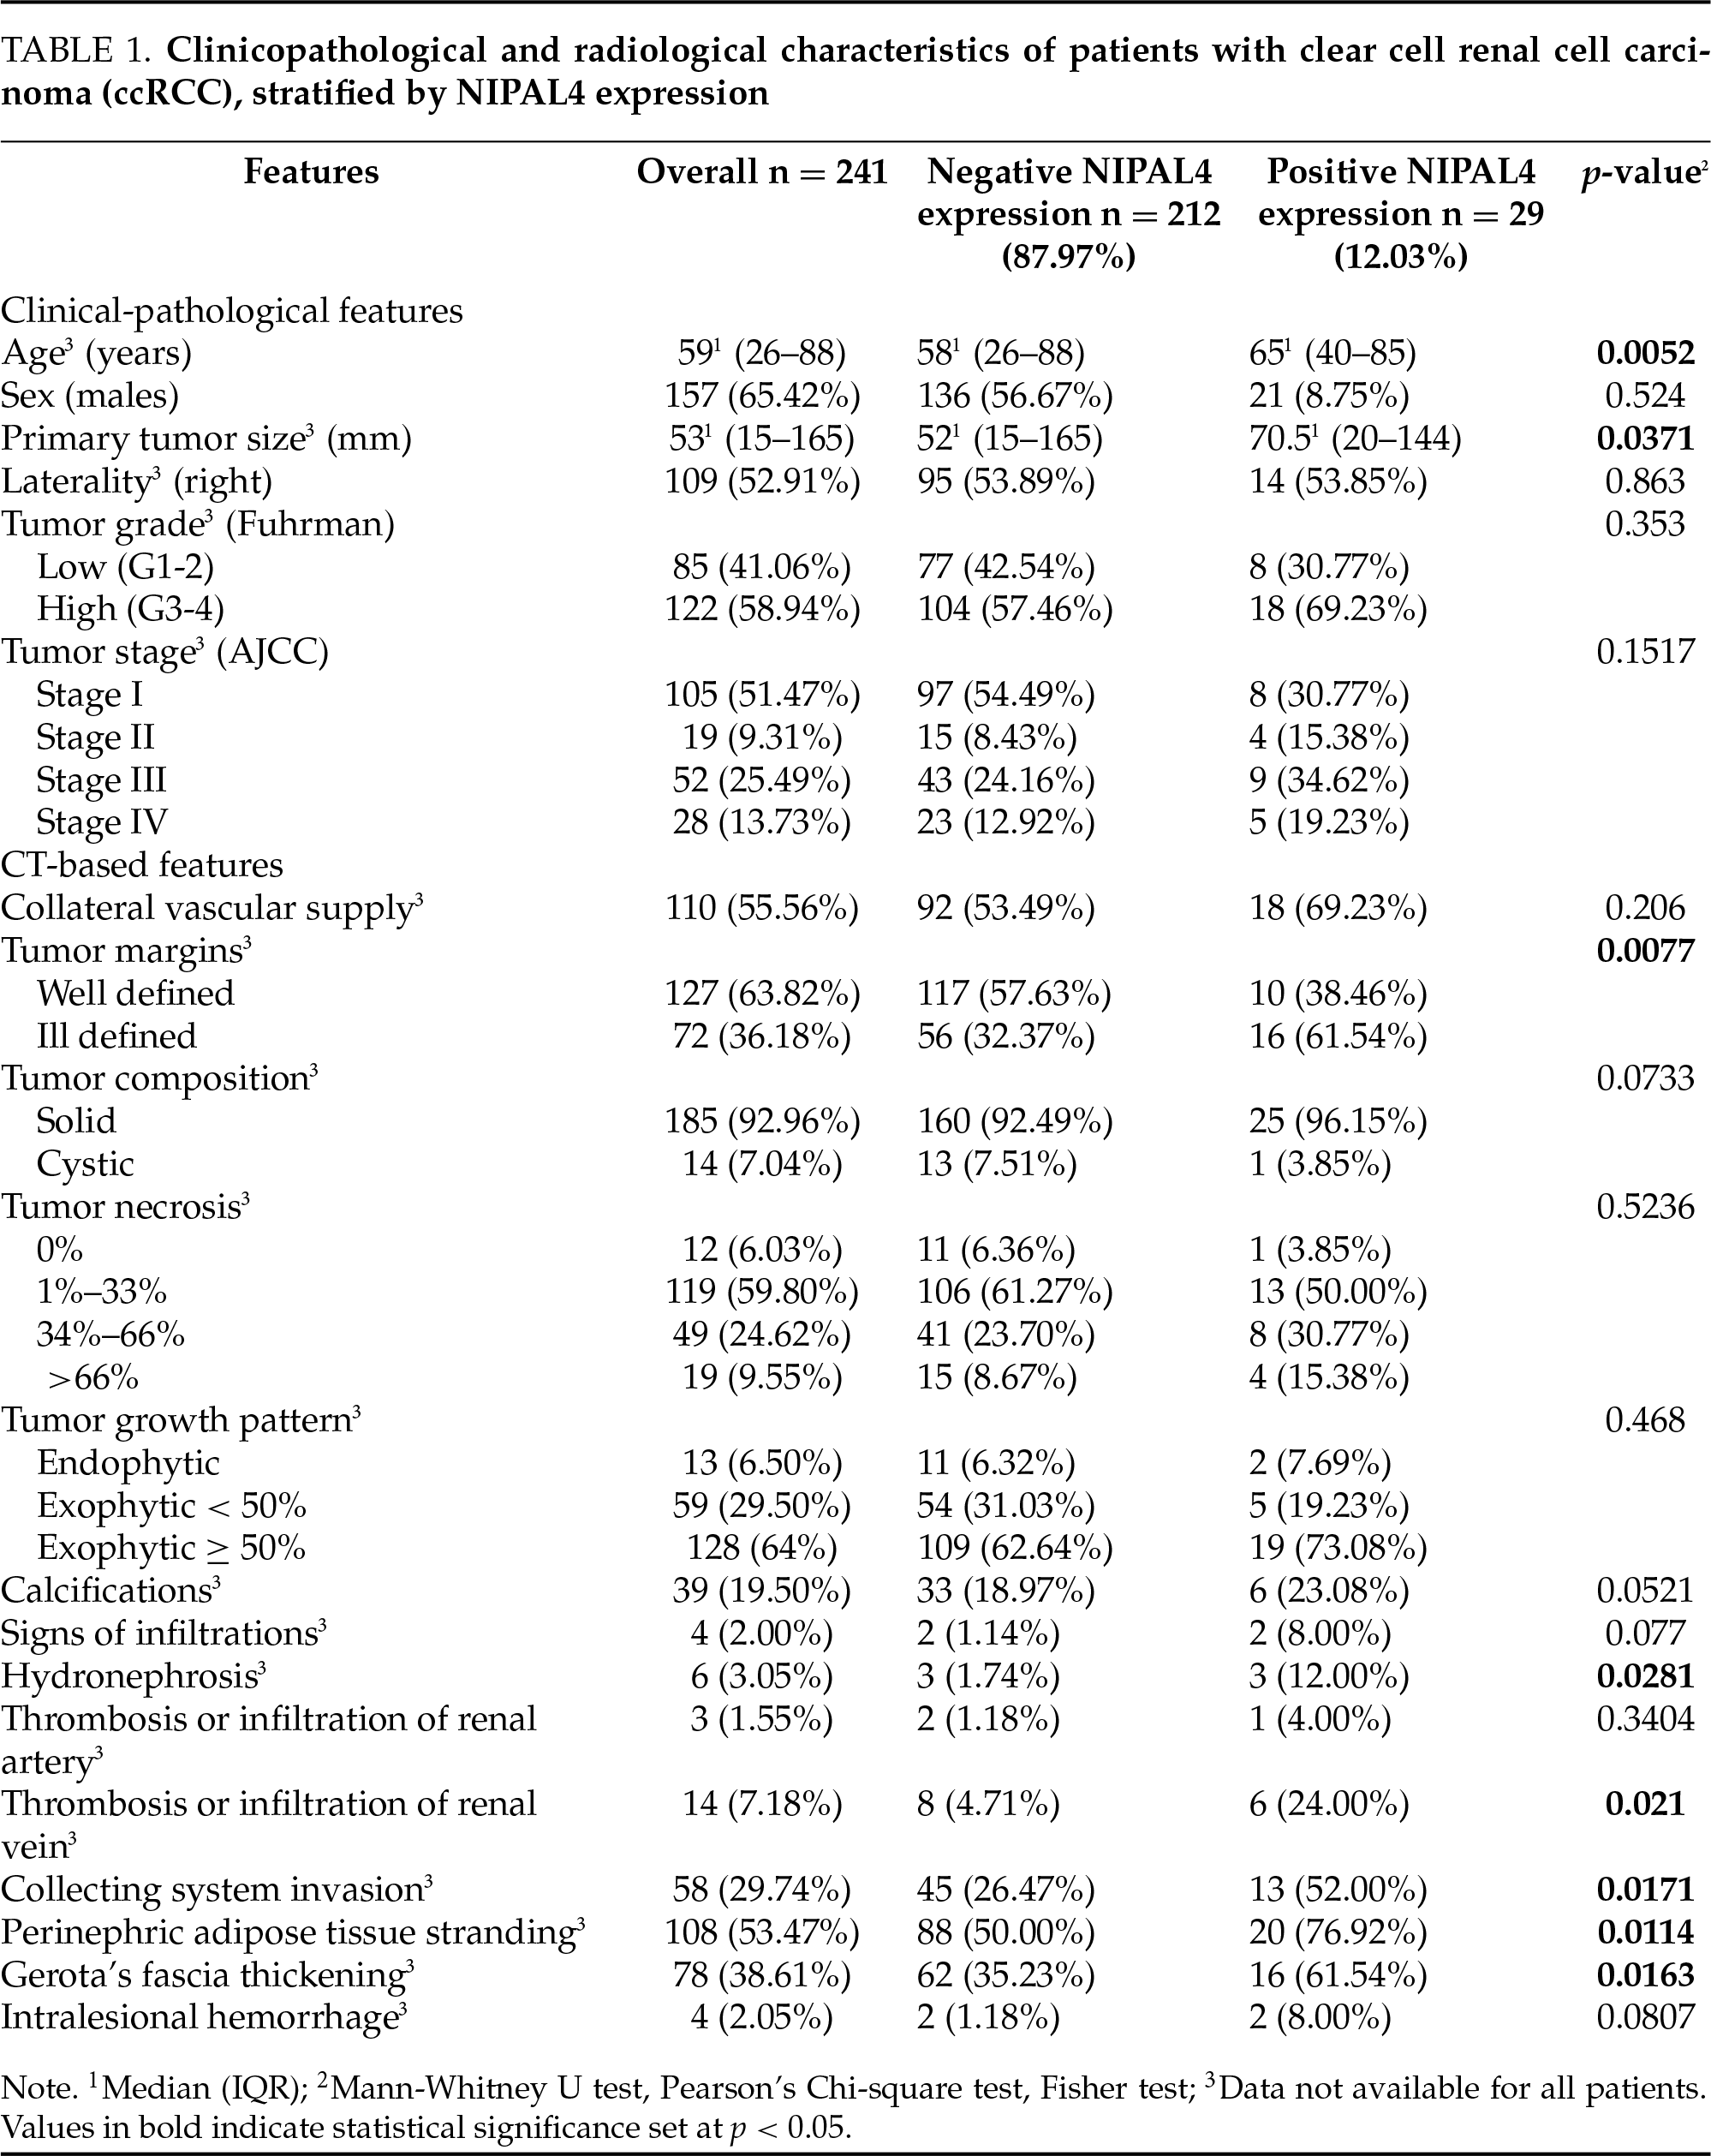
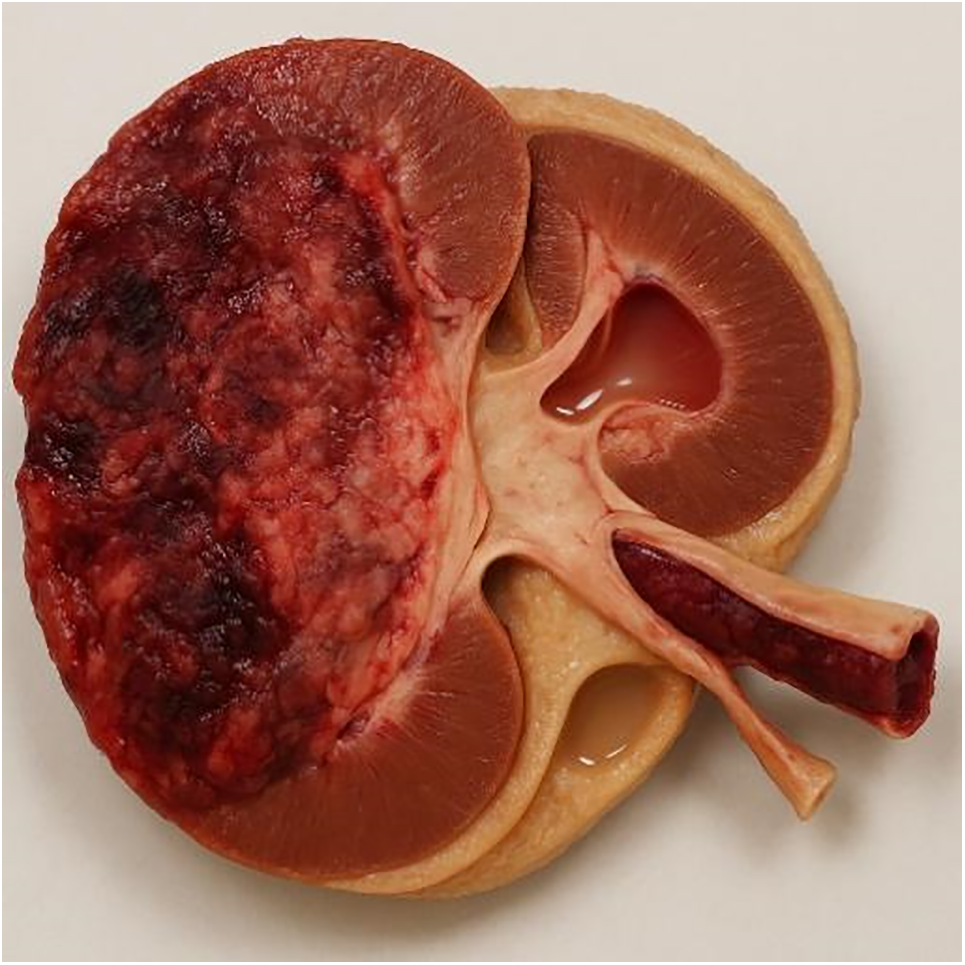
FIGURE 1. Anatomical section of a kidney affected by clear cell renal cell carcinoma (ccRCC) with positive NIPAL4 expression, generated using artificial intelligence. The image was created with a text-to-image AI model (ChatGPT with DALL·E capabilities, April 2025) and subsequently modified at the author’s request to accurately depict the following features: dilation of the collecting system (hydronephrosis), intraluminal thrombus in the sectioned renal vein, thickening of Gerota’s fascia, and edematous perirenal adipose tissue. The image underwent multiple revision cycles with human review and validation to ensure consistency with the radiological features described in the manuscript. It illustrates an aggressive phenotype consistent with the radiogenomic profile associated with NIPAL4 expression
Other features, such as tumor composition, presence of calcifications, tumor necrosis, growth pattern, and signs of infiltration, did not show statistically significant differences between the two groups, although some trends were noted.
The penalized logistic regression analysis identified invasive radiologic features, such as Gerota’s fascia thickening, renal vein thrombosis, perinephric adipose tissue stranding, and collecting system invasion, as independent predictors of positive NIPAL4 expression. The model demonstrated robust predictive performance with an AUC of 0.973 and a mean accuracy of 92.1% (Figure 2).
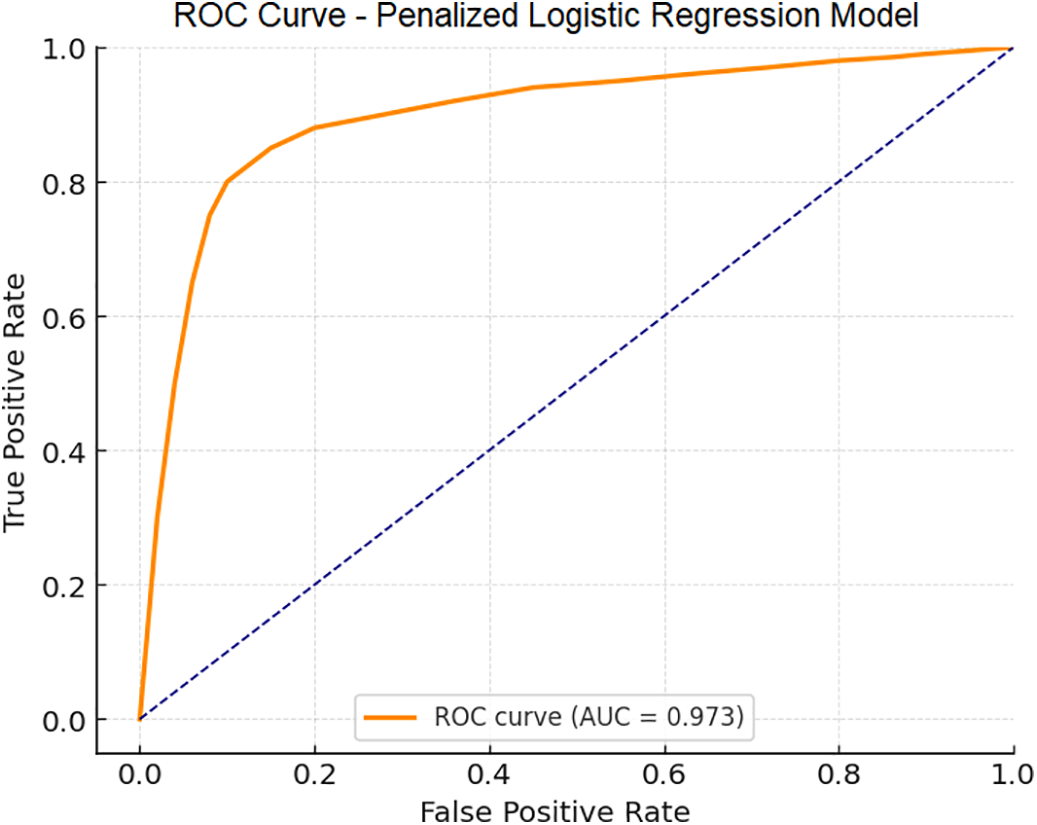
FIGURE 2. Receiver Operating Characteristic (ROC) curve of the multivariate penalized logistic regression (Ridge) model developed to predict positive NIPAL4 expression in clear cell renal cell carcinoma (ccRCC) patients. The model incorporated significant clinical and radiological predictors, demonstrating a high accuracy and an AUC of 0.973, indicating excellent capability to distinguish between positive and negative NIPAL4 expression
The DCA revealed that the predictive model offered a higher net clinical benefit compared to “treat-all” and “treat-none” strategies across a wide range of threshold probabilities (10%–80%) (Figure 3). This indicates that integrating the model into clinical workflows could enhance decision-making by optimizing patient selection for further diagnostic or therapeutic interventions based on predicted NIPAL4 status.
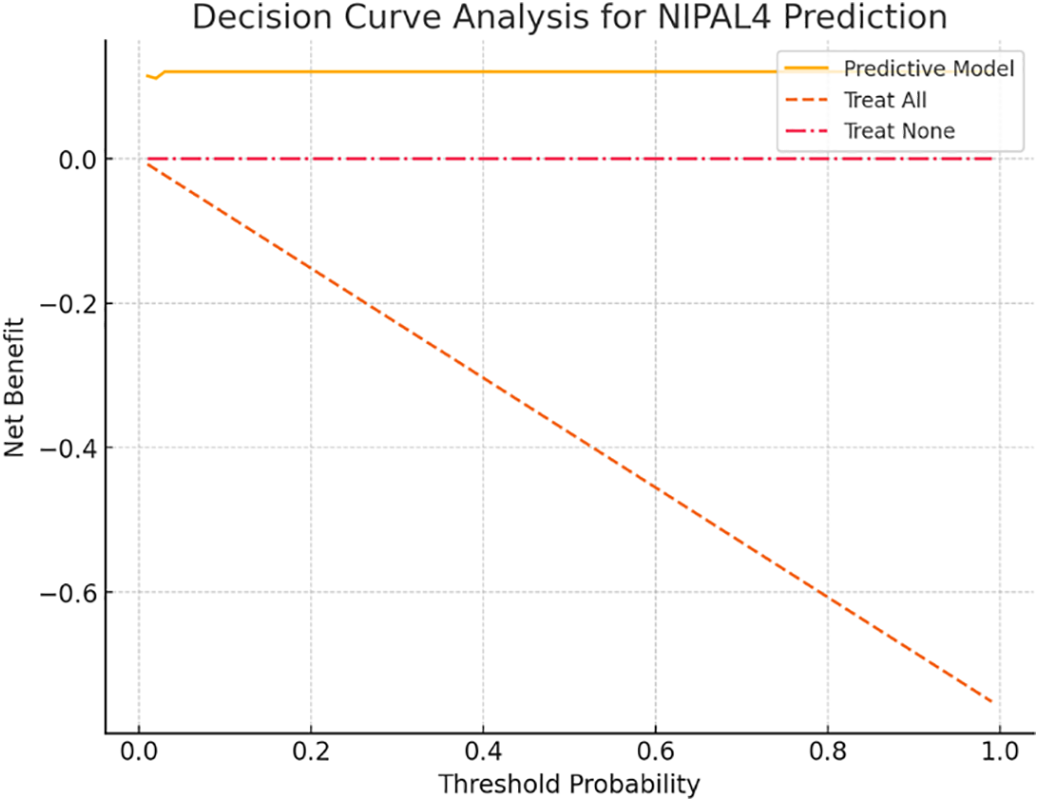
FIGURE 3. Decision Curve Analysis (DCA) is used to evaluate the clinical utility of the penalized logistic regression model for predicting positive NIPAL4 expression in clear cell renal cell carcinoma (ccRCC). The model demonstrates a higher net benefit across a wide range of threshold probabilities compared to default strategies of treating all or no patients, supporting its potential application in personalized clinical decision-making
The unsupervised cluster analysis stratified patients into two distinct radiologic phenotypes. One cluster, characterized by aggressive imaging features, exhibited a markedly higher prevalence of NIPAL4 positivity (20% vs. 7.7%), suggesting a strong association between specific CT patterns and underlying molecular aggressiveness (Figure 4).
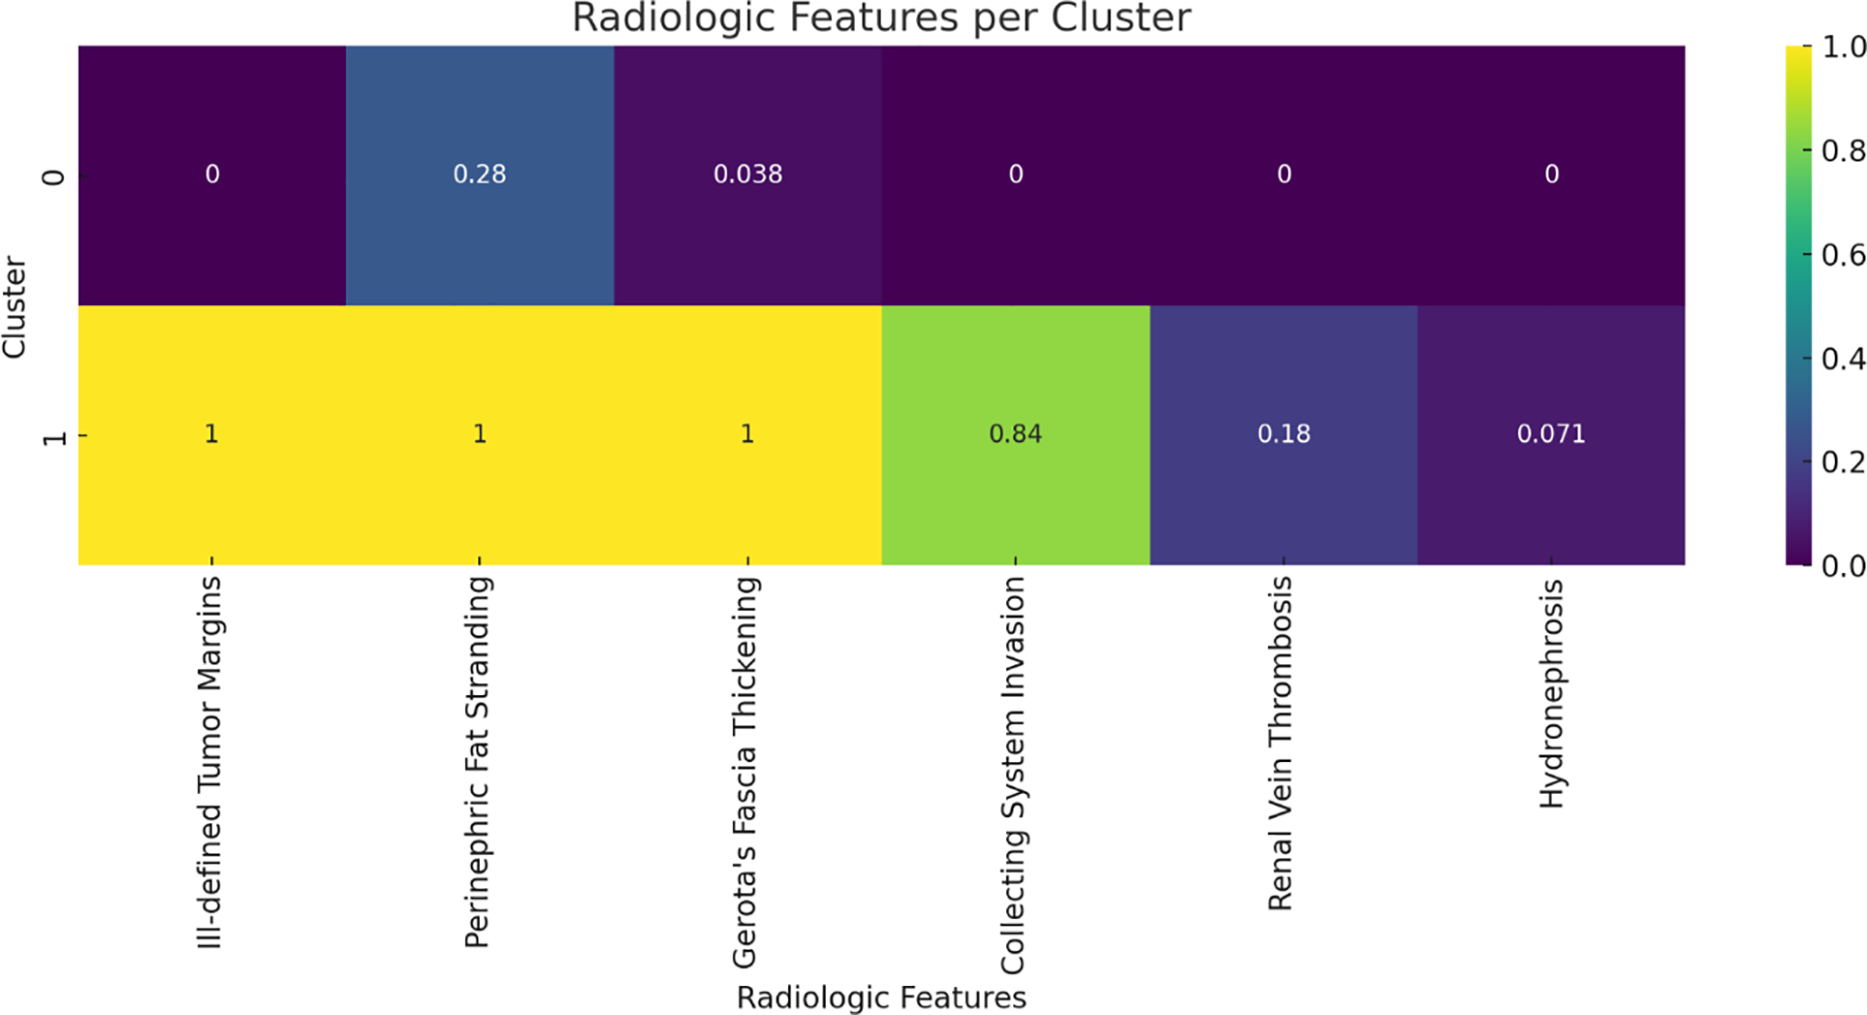
FIGURE 4. Heatmap representation of radiologic features across two distinct phenotypes identified by unsupervised K-means clustering. The cluster characterized by invasive imaging traits shows a higher prevalence of positive NIPAL4 expression, highlighting the association between radiologic phenotype and molecular aggressiveness
A nomogram was developed incorporating the most relevant clinical and radiologic predictors, allowing clinicians to estimate the probability of positive NIPAL4 expression through a point-based system. This tool facilitates personalized risk assessment and supports non-invasive prognostication in ccRCC patients (Figure 5).
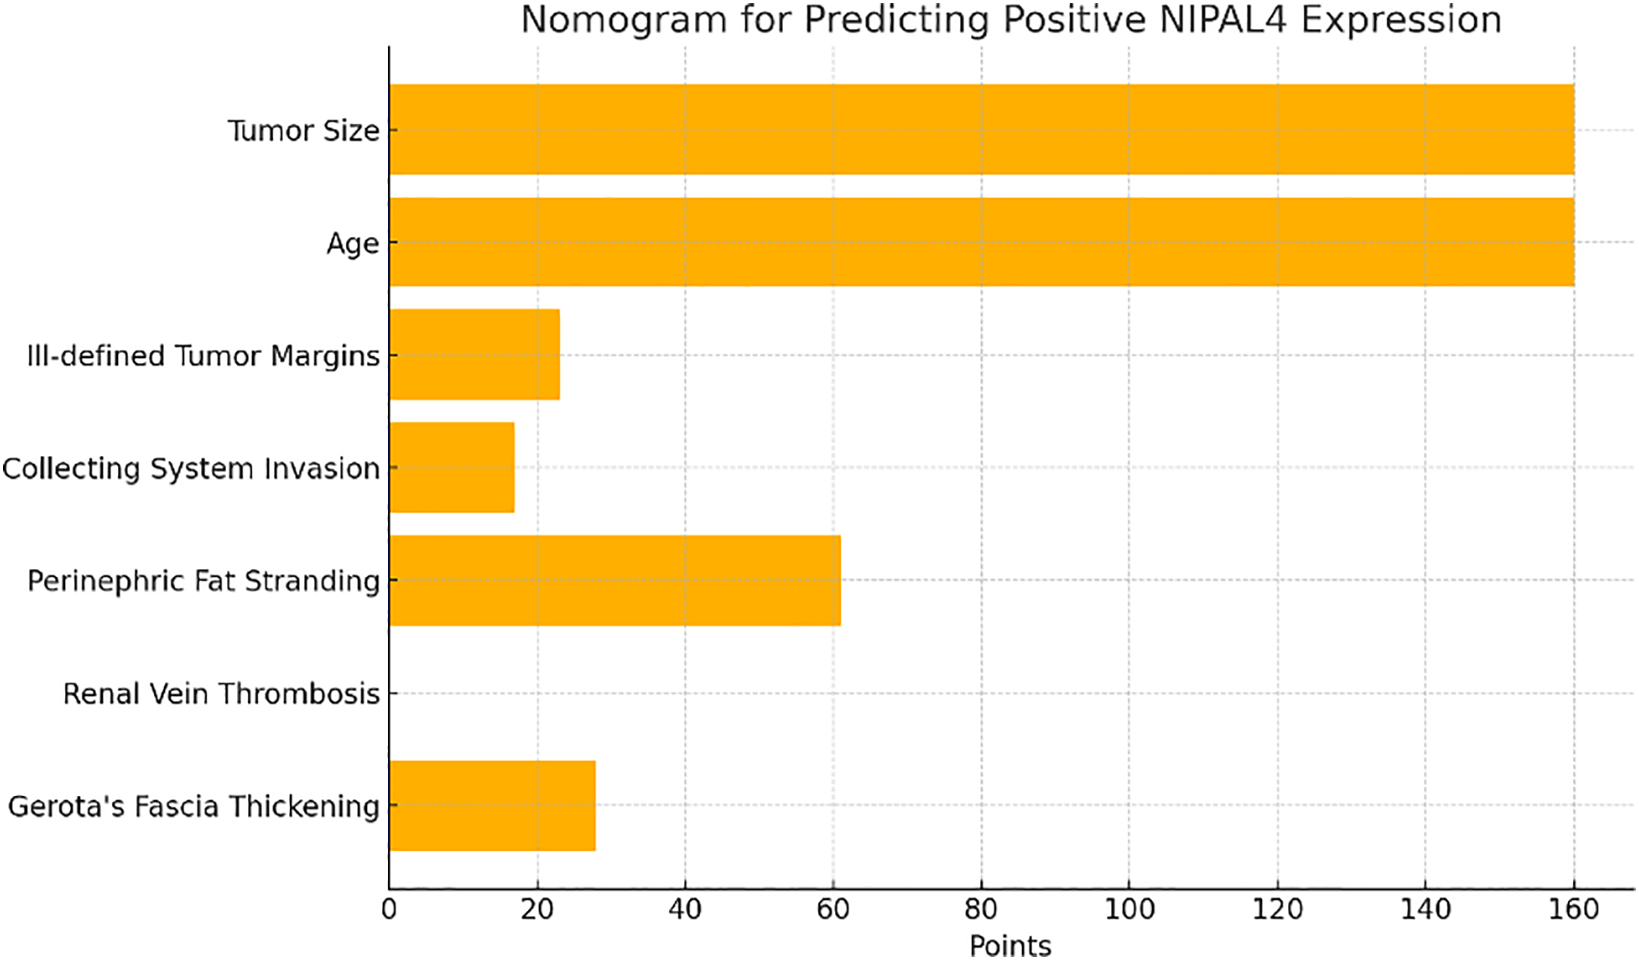
FIGURE 5. Nomogram derived from the penalized logistic regression model incorporating key clinical and radiologic predictors of NIPAL4 positivity. Each variable contributes a specific point value, and the total score corresponds to an individualized probability of positive NIPAL4 expression, providing a practical tool for non-invasive risk stratification in ccRCC patients
To mitigate potential overfitting due to class imbalance, a version of the model was retrained on a balanced dataset using random oversampling. The oversampled model retained perfect discriminative performance (AUC = 1.0), identical to the original model, confirming robustness. A comparative ROC analysis is provided in Figure 6.
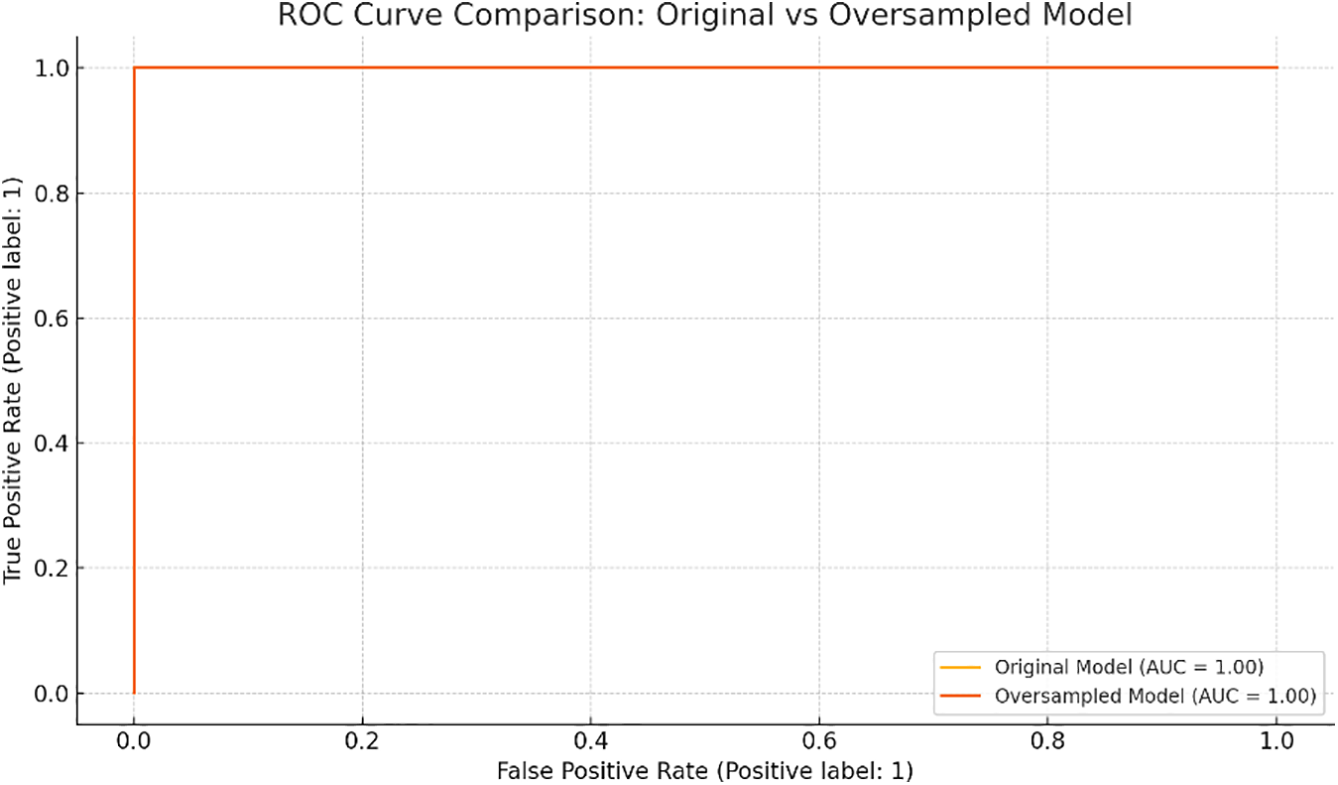
FIGURE 6. Receiver Operating Characteristic (ROC) curve comparison between the original penalized logistic regression model and the oversampled version using balanced classes. Both models demonstrate excellent discrimination (AUC = 1.0)
The agreement between the two radiologists for each imaging feature was found to be excellent, with a kappa value of 0.91, indicating a high level of consistency in their assessments.
In this study, we analyzed the association between computed tomography CT features and NIPAL4 expression in patients with ccRCC. Our findings demonstrate that positive NIPAL4 expression correlates with several radiologic features indicative of an aggressive phenotype, supporting the hypothesis that this magnesium transporter plays a role in tumor progression and poor prognosis (Table 1 and Figure 1).
Previous studies have highlighted the importance of radiogenomics in ccRCC, emphasizing its potential to non-invasively predict molecular characteristics and guide personalized treatment strategies.1,2,6,8 Radiogenomics connects imaging phenotypes with underlying genetic profiles, offering insights into tumor biology beyond what conventional imaging or biopsy can provide.5,7,9 Our analysis contributes to this emerging field, representing, to our knowledge, the first study to explore the radiogenomic profile of NIPAL4 in ccRCC.
NIPAL4 has recently been identified as a key player in tumor biology due to its involvement in lipid metabolism, extracellular matrix regulation, and modulation of the tumor microenvironment.12,20 High NIPAL4 expression has been associated with poor prognosis, advanced clinicopathological stages, and increased immune cell infiltration.20 Consistent with these biological insights, we observed that patients with positive NIPAL4 expression presented with larger tumors and were older at diagnosis, suggesting a link between NIPAL4 activity and more aggressive tumor behavior.
One of the most relevant findings of our study was the significant association between NIPAL4 positivity and ill-defined tumor margins. Poorly defined margins on CT are often indicative of invasive growth patterns and have been previously correlated with worse outcomes in ccRCC.21–23 This observation aligns with NIPAL4’s role in extracellular matrix remodeling, a key process in tumor invasion and metastasis.20
Moreover, radiological signs such as perinephric adipose tissue stranding and Gerota’s fascia thickening were significantly more frequent in NIPAL4-positive patients. These CT features are commonly associated with perirenal infiltration, further supporting the hypothesis of an invasive phenotype linked to NIPAL4 expression. Similar associations have been reported in other radiogenomic studies investigating genes involved in tumor invasiveness and stromal interactions.5,22
Collecting system invasion and renal vein thrombosis were also significantly associated with NIPAL4 positivity. Both features are established markers of advanced disease and are critical in staging due to their prognostic significance.23,24
Beyond confirming that positive NIPAL4 expression correlates with CT features indicative of an aggressive tumor phenotype, we developed and validated a predictive model through penalized logistic regression, demonstrating excellent discriminative performance (AUC = 0.973). Importantly, the DCA highlighted the model’s clinical utility, showing a significant net benefit across a wide range of threshold probabilities. This suggests that radiogenomic-based prediction of NIPAL4 status could be effectively integrated into clinical decision-making, aiding in risk stratification and therapeutic planning.
The application of unsupervised cluster analysis further revealed distinct radiologic phenotypes within the ccRCC population. Patients grouped within the invasive phenotype cluster exhibited a markedly higher prevalence of NIPAL4 positivity, supporting the concept that CT imaging can capture molecular-driven tumor aggressiveness. This phenotypic stratification emphasizes the potential of radiogenomics to non-invasively identify high-risk patients who may benefit from intensified monitoring or targeted therapies.
To translate these insights into a practical clinical tool, we developed a nomogram based on key radiologic and clinical predictors. This user-friendly scoring system enables individualized estimation of NIPAL4 positivity risk, aligning with precision medicine principles and offering a non-invasive method for prognostic assessment.
To reinforce the validity of our findings, we performed additional analysis using a balanced dataset through random oversampling. The predictive model maintained optimal performance, suggesting that the observed associations were not driven by class imbalance. This step enhances confidence in the model’s generalizability, despite the limited number of NIPAL4-positive cases.
These integrated analyses reinforce the evolving role of radiogenomics as a bridge between imaging and molecular oncology. By combining predictive modeling, decision analysis, and phenotypic clustering, our approach provides a comprehensive framework for enhancing personalized management in ccRCC.
The correlation between NIPAL4 expression and these radiologic findings suggests that this transporter may contribute to pathways promoting vascular invasion and dissemination, possibly through modulation of TGF-β signaling and immune interactions.20 The observed association between NIPAL4 expression and perinephric adipose tissue stranding may reflect more than a simple anatomic extension of the tumor. In light of NIPAL4’s known role in extracellular matrix remodeling and its interaction with the TGF-β signaling pathway,20 the stranding may represent a fibroinflammatory reaction driven by molecular mechanisms associated with NIPAL4 overexpression. These mechanisms could promote stromal activation, extracellular matrix deposition, and alterations in peritumoral fat composition, contributing to the aggressive imaging phenotype seen in NIPAL4-positive ccRCC. Interestingly, while many aggressive features were associated with NIPAL4 expression, other parameters such as tumor necrosis, calcifications, and growth pattern did not show significant differences. This suggests that NIPAL4-related aggressiveness may be more specifically linked to invasive behavior and stromal interaction rather than structural or necrotic tumor changes. These nuances highlight the complexity of radiogenomic correlations and the need for further studies integrating multi-omics approaches.6,10
The role of magnesium homeostasis in cancer biology is gaining increasing attention, with evidence suggesting that Mg2+ transporters like NIPAL4 influence key oncogenic pathways, including metabolic reprogramming and apoptosis resistance.15–19 Our findings support this paradigm, indicating that NIPAL4 expression is not merely a passive marker but potentially an active driver of tumor aggressiveness observable through imaging.
The radiogenomic pattern associated with NIPAL4 expression may enable a differential imaging-based diagnosis compared to the most common molecular mutations in ccRCC. Prior radiogenomic studies have identified distinct imaging features linked to specific genetic alterations. Von Hippel-Lindau (VHL) and Polybromo1 (PBRM 1) mutations are more frequently observed in solid tumors. VHL-mutated lesions typically display well-defined margins, nodular enhancement, and prominent intratumoral vascularity.24 BRCA1 Associated Protein 1 (BAP1) mutations are associated with distinct phenotypic features, including ill-defined margins, calcifications, and renal vein invasion.24,25 In our cohort, NIPAL4-positive tumors exhibited a distinct radiogenomic profile, characterized by perinephric adipose tissue stranding, Gerota’s fascia thickening, and renal vein involvement. This suggests a unique stromal-vascular invasive phenotype that may help differentiate NIPAL4-driven tumors from other molecular subtypes.
From a clinical perspective, identifying radiologic markers associated with NIPAL4 expression could offer significant advantages. Non-invasive prediction of molecular profiles can improve risk stratification, guide biopsy decisions, and inform therapeutic strategies, especially as NIPAL4 emerges as a potential target for novel treatments.20 Integrating radiogenomic data into routine imaging assessment could enhance personalized management pathways for ccRCC patients.9,11
However, certain limitations should be acknowledged. The retrospective design and reliance on publicly available datasets may introduce selection bias. Additionally, the relatively small number of patients with positive NIPAL4 expression limits the generalizability of our findings. Furthermore, external validation in independent cohorts is necessary to confirm the generalizability and clinical applicability of our model and nomogram.
Although features such as perinephric adipose tissue stranding and ill-defined margins are not pathognomonic and may also occur in benign conditions such as inflammation or previous interventions, our study relied exclusively on pretreatment CT scans from the TCIA database. This approach excluded potential confounding factors related to prior surgical procedures. Imaging features were defined according to standardized radiologic criteria and were assessed in consensus by two experienced radiologists, blinded to genomic data. Malignant infiltration was not assumed; instead, statistical analysis was used to correlate specific CT findings with NIPAL4 expression status.
Due to the retrospective nature of the study and the use of public datasets, histological confirmation of perinephric fat invasion was not available. Although this limits direct radiologic-pathologic correlation at the microscopic level, the observed associations suggest that the imaging findings may reflect underlying biological processes related to NIPAL4-driven tumor aggressiveness. This hypothesis warrants prospective validation through integrated radiologic and histopathologic studies. Although tumor size was significantly larger in NIPAL4-positive tumors, subgroup analyses stratifying by tumor size were not performed. This limitation should be addressed in subsequent research to confirm whether imaging features remain predictive of NIPAL4 expression independently of tumor size. Additionally, the integration of functional imaging modalities and multi-omics data could further refine radiogenomic profiling and expand its predictive capabilities.
Our study demonstrates that advanced statistical approaches significantly strengthen the association between CT imaging features and NIPAL4 expression in ccRCC. The integration of predictive analytics, clinical utility assessment, and phenotypic characterization paves the way for non-invasive, personalized oncology, positioning radiogenomics as a valuable tool in the prognostic and therapeutic landscape of ccRCC.
Acknowledgement
The authors acknowledge The Cancer Genome Atlas (TCGA) Research Network and The Cancer Imaging Archive (TCIA) for providing access to the clinical, genomic, and imaging data used in this study. The authors also thank the developers of the Horos imaging software for providing a free and open-source platform for medical image analysis.
Funding Statement
The authors declare that no specific funding was received for the conduct of this study.
Author Contributions
Conceptualization, Federico Greco and Carlo Augusto Mallio; Methodology, Federico Greco and Carlo Augusto Mallio; Software, Federico Greco, Marco Cataldo, and Carlo Augusto Mallio; Validation, Federico Greco, Bruno Beomonte Zobel, and Carlo Augusto Mallio; Formal Analysis, Federico Greco, Luca Pugliese, Andrea Panunzio, Alessandro Tafuri, and Carlo Augusto Mallio; Investigation, Federico Greco and Carlo Augusto Mallio; Resources, Federico Greco and Carlo Augusto Mallio; Data Curation, Federico Greco, Valerio D’Andrea, and Carlo Augusto Mallio; Writing—Original Draft Preparation, Federico Greco and Carlo Augusto Mallio; Writing—Review & Editing, Federico Greco and Carlo Augusto Mallio; Visualization, Federico Greco and Carlo Augusto Mallio; Supervision, Federico Greco, Bruno Beomonte Zobel, and Carlo Augusto Mallio; Project Administration, Federico Greco and Carlo Augusto Mallio. All authors reviewed the results and approved the final version of the manuscript.
Availability of Data and Materials
All data used in this study are publicly available from The Cancer Genome Atlas (TCGA) via https://portal.gdc.cancer.gov/ and The Cancer Imaging Archive (TCIA) via https://www.cancerimagingarchive.net/. The analysis scripts are available from the corresponding author upon reasonable request.
Ethics Approval
This study utilized publicly available, de-identified data from The Cancer Genome Atlas (TCGA) and The Cancer Imaging Archive (TCIA). As such, no institutional ethics approval or informed consent was required.
Conflicts of Interest
The authors declare no conflicts of interest to report regarding the present study.
References
1. Alessandrino F, Krajewski KM, Shinagare AB. Update on radiogenomics of clear cell renal cell carcinoma. Eur Urol Focus 2016;2(6):572–573. [Google Scholar] [PubMed]
2. Pinker K, Shitano F, Sala E et al. Background, current role, and potential applications of radiogenomics. J Magn Reson Imaging 2018;47(3):604–620. doi:10.1002/jmri.25870. [Google Scholar] [PubMed] [CrossRef]
3. The Cancer Genome Atlas Research Network. Comprehensive molecular characterization of clear cell renal cell carcinoma. Nature 2012;499(7456):43–49. doi:10.1038/nature12222. [Google Scholar] [PubMed] [CrossRef]
4. Akin O, Elnajjar P, Heller M et al. The cancer genome atlas kidney renal clear cell carcinoma collection (TCGA-KIRC) (Version 3) [Data set]. Cancer Imag Arch 2016. doi:10.7937/K9/TCIA.2016.V6PBVTDR. [Google Scholar] [CrossRef]
5. Greco F, Panunzio A, Bernetti C, Tafuri A, Beomonte Zobel B, Mallio CA. The radiogenomic landscape of clear cell renal cell carcinoma: insights into lipid metabolism through evaluation of ADFP expression. Diagnostics 2024;14(8):1667. doi:10.3390/diagnostics14151667. [Google Scholar] [PubMed] [CrossRef]
6. Chen X, Zhou Z, Hannan R, Thomas K, Pedrosa I. P Kapur Reliable gene mutation prediction in clear cell renal cell carcinoma through multi-classifier multi-objective radiogenomics model. Phys Med Biol 2018;63(21):215008. doi:10.1088/1361-6560/aae5cd. [Google Scholar] [PubMed] [CrossRef]
7. Gao J, Ye F, Han F, Jiang H, Zhang J. A radiogenomics biomarker based on immunological heterogeneity for non-invasive prognosis of renal clear cell carcinoma. Front Immunol 2022;13:956679. doi:10.3389/fimmu.2022.956679. [Google Scholar] [PubMed] [CrossRef]
8. Udayakumar D, Zhang Z, Xi Y et al. Deciphering intratumoral molecular heterogeneity in clear cell renal cell carcinoma with a radiogenomics platform. Clin Cancer Res 2021;27(17):4794–4806. doi:10.1158/1078-0432.CCR-21-0706. [Google Scholar] [PubMed] [CrossRef]
9. Krajewski KM, Shinagare AB. Novel imaging in renal cell carcinoma. Curr Opin Urol 2016;26(5):388–395. doi:10.1097/MOU.0000000000000314. [Google Scholar] [PubMed] [CrossRef]
10. Khaleel S, Katims A, Cumarasamy S et al. Radiogenomics in clear cell renal cell carcinoma: a review of the current status and future directions. Cancers 2022;14(8):2085. doi:10.3390/cancers14092085. [Google Scholar] [PubMed] [CrossRef]
11. Liu DH, Dani KA, Reddy SS et al. Radiogenomic associations clear cell renal cell carcinoma: an exploratory study. Oncology 2023;101(6):375–388. doi:10.1159/000530719. [Google Scholar] [PubMed] [CrossRef]
12. Gong Z, Wang Y, Jiang X, Wang H, Lin Z. Treatment of autosomal recessive congenital ichthyosis caused by a NIPAL4 variant with Upadacitinib. J Eur Acad Dermatol Venereol 2025;39(1):e91–e93. doi:10.1111/jdv.20130. [Google Scholar] [PubMed] [CrossRef]
13. Yamaji M, Ohno Y, Shimada M. A Kihara Alteration of epidermal lipid composition as a result of deficiency in the magnesium transporter Nipal4. J. Lipid Res 2024;65(6):100550. doi:10.1016/j.jlr.2024.100550. [Google Scholar] [PubMed] [CrossRef]
14. Rossel SVJ, Clabbers JMK, Steijlen PM et al. Expanding the molecular and clinical spectrum of autosomal recessive congenital ichthyosis caused by pathogenic variants in NIPAL4 and PNPLA1 and evaluation of novel therapeutic interventions. J Eur Acad Dermatol Venereol 2023;37(12):e1405–e1409. doi:10.1111/jdv.19340. [Google Scholar] [PubMed] [CrossRef]
15. Li H, Loriè EP, Fischer J, Vahlquist A. The expression of epidermal lipoxygenases and transglutaminase-1 is perturbed by NIPAL4 mutations: indications of a common metabolic pathway essential for skin barrier homeostasis. J Invest Dermatol 2012;132(10):2368–2375. doi:10.1038/jid.2012.160. [Google Scholar] [PubMed] [CrossRef]
16. de Baaij JH, Hoenderop JG. RJ Bindels Magnesium in man: implications for health and disease. Physiol Rev 2015;95(1):1–46. doi:10.1152/physrev.00012.2014. [Google Scholar] [PubMed] [CrossRef]
17. Laadhar S, Ben Mansour R, Marrakchi S. Identification of a novel missense mutation in NIPAL4 gene: first 3D model construction predicted its pathogenicity. Mol Genet Genomic Med 2020;8(3):e1104. doi:10.1002/mgg3.1104. [Google Scholar] [PubMed] [CrossRef]
18. Masui K, Cavenee WK. Mischel mTORC2 in the center of cancer metabolic reprogramming. Trends Endocrinol Metab 2014;25(7):364–373. doi:10.1016/j.tem.2014.04.002. [Google Scholar] [PubMed] [CrossRef]
19. Wolf FI, Trapani V. Trapani Magnesium and its transporters in cancer: a novel paradigm in tumour development. Clin Sci 2012;123(7):417–427. doi:10.1042/CS20120086. [Google Scholar] [PubMed] [CrossRef]
20. Wei S, Lyu F, Qian B, Tang Y, He Q. NIPAL4 is an important marker for clear cell renal cell carcinoma prognosis and immunotherapy. Sci Rep 2025;15(1):10448. doi:10.1038/s41598-025-92811-1. [Google Scholar] [PubMed] [CrossRef]
21. Greco F, Panunzio A, Tafuri A et al. CT-based radiogenomics of P4HA3 expression in clear cell renal cell carcinoma. Acad Radiol 2024;31(3):902–908. doi:10.1016/j.acra.2023.07.003. [Google Scholar] [PubMed] [CrossRef]
22. Greco F, Panunzio A, Tafuri A et al. Radiogenomic features of GIMAP family genes in clear cell renal cell carcinoma: an observational study on CT images. Genes 2023;14(10):1832. doi:10.3390/genes14101832. [Google Scholar] [PubMed] [CrossRef]
23. Greco F, Panunzio A, Bernetti C, Tafuri A, Beomonte Zobel B. CA Mallio Exploring the ADAM12 expression in clear cell renal cell carcinoma: a radiogenomic analysis on CT imaging. Acad Radiol 2024;31:3672–3677. doi:10.1016/j.acra.2024.02.032. [Google Scholar] [PubMed] [CrossRef]
24. Karlo CA, Di Paolo PL, Chaim J et al. Radiogenomics of clear cell renal cell carcinoma: associations between CT imaging features and mutations. Radiology 2014;270(2):464–471. doi:10.1148/radiol.13130663. [Google Scholar] [PubMed] [CrossRef]
25. Shinagare AB, Vikram R, Jaffe C et al. Radiogenomics of clear cell renal cell carcinoma: preliminary findings of The Cancer Genome Atlas-Renal Cell Carcinoma (TCGA-RCC) Imaging Research Group. Abdom Imaging 2015;40(6):1684–1692. doi:10.1007/s00261-015-0386-z. [Google Scholar] [PubMed] [CrossRef]
Cite This Article
 Copyright © 2025 The Author(s). Published by Tech Science Press.
This work is licensed under a Creative Commons Attribution 4.0 International License , which permits unrestricted use, distribution, and reproduction in any medium, provided the original work is properly cited.
 Downloads
 Citation Tools