
 Submit a Paper
 Propose a Special lssue
 Open Access
ARTICLE

Improved Supervised and Unsupervised Metaheuristic-Based Approaches to Detect Intrusion in Various Datasets
1 Faculty of Sciences and Technology, Department of Computer Sciences, Cadi Ayyad University, Marrakech, 40000, Morocco
2 Mathematics and Informatics Department, Royal Air School, Marrakech, 40000, Morocco
* Corresponding Author: Ouail Mjahed. Email:
Computer Modeling in Engineering & Sciences 2023, 137(1), 265-298. https://doi.org/10.32604/cmes.2023.027581
Received 04 November 2022; Accepted 06 January 2023; Issue published 23 April 2023
 View Full Text
 Download PDF
Abstract
Due to the increasing number of cyber-attacks, the necessity to develop efficient intrusion detection systems (IDS) is more imperative than ever. In IDS research, the most effectively used methodology is based on supervised Neural Networks (NN) and unsupervised clustering, but there are few works dedicated to their hybridization with metaheuristic algorithms. As intrusion detection data usually contains several features, it is essential to select the best ones appropriately. Linear Discriminant Analysis (LDA) and t-statistic are considered as efficient conventional techniques to select the best features, but they have been little exploited in IDS design. Thus, the research proposed in this paper can be summarized as follows. a) The proposed approach aims to use hybridized unsupervised and hybridized supervised detection processes of all the attack categories in the CICIDS2017 Dataset. Nevertheless, owing to the large size of the CICIDS2017 Dataset, only 25% of the data was used. b) As a feature selection method, the LDA performance measure is chosen and combined with the t-statistic. c) For intrusion detection, unsupervised Fuzzy C-means (FCM) clustering and supervised Back-propagation NN are adopted. d) In addition and in order to enhance the suggested classifiers, FCM and NN are hybridized with the seven most known metaheuristic algorithms, including Genetic Algorithm (GA), Particle Swarm Optimization (PSO), Differential Evolution (DE), Cultural Algorithm (CA), Harmony Search (HS), Ant-Lion Optimizer (ALO) and Black Hole (BH) Algorithm. Performance metrics extracted from confusion matrices, such as accuracy, precision, sensitivity and F1-score are exploited. The experimental result for the proposed intrusion detection, based on training and test CICIDS2017 datasets, indicated that PSO, GA and ALO-based NNs can achieve promising results. PSO-NN produces a tested accuracy, global sensitivity and F1-score of 99.97%, 99.95% and 99.96%, respectively, outperforming performance concluded in several related works. Furthermore, the best-proposed approaches are valued in the most recent intrusion detection datasets: CSE-CICIDS2018 and LUFlow2020. The evaluation fallouts consolidate the previous results and confirm their correctness.Keywords
Abbreviations
| AdaBoost | Adaptive Boosting |
| ALO | Ant-Lion Optimizer |
| BH | Black Hole algorithm |
| BPNN, CNN, NN | Back-propagation, Convolutional, Neural Network |
| CA | Cultural algorithm |
| CICIDS2017 | IDS Dataset created by the Canadian Institute for Cyber-security in 2017 |
| CTree | Conditional inference Tree |
| CSE-CICIDS2018 | IDS Dataset created by the Communications Security Establishment (CSE) and the Canadian Institute for Cyber-security in 2018 |
| DE | Differential Evolution algorithm |
| DL | Deep Learning |
| DT | Decision Tree |
| FCM | Fuzzy C-means |
| FKNN, K-NN | Fast, K-Nearest Neighbor Classifier |
| GA | Genetic Algorithm |
| HS | Harmony Search algorithm |
| IDS | Intrusion Detection System |
| IG | Information Gain |
| LDA, QDA | Linear, Quadratic Discriminant Analysis |
| LUFlow2020 | IDS Dataset created by Lancaster University in 2020 |
| ML | Machine Learning |
| MLP | Multi-Layer Perceptron |
| PCA | Principal Component Analysis |
| PSO | Particle Swarm Optimization |
| RBF | Radial Basis Function |
| RF | Random Forest |
| SVM | Support Vector Machines |
Symbols
| Centroid of class Ci | |
| Confusion matrix | |
| Connection weight between the neurons i (in layer l) and j (in layer l-1) | |
| Covariance matrix | |
| Data instance | |
| Discriminant function | |
| Euclidean distance between the ith data and the jth cluster center. | |
| False decision rate for class Ci, Global false decision rate | |
| f, fi | Fitness function |
| m | Fuzziness index |
| F1i, F1 | F1-score for class Ci, Global F1-score |
| ci | ith cluster center |
| ri(p) | ith desired output value for data point p |
| oi(p) | ith effective neuron output value for data point p |
| μil | Mean of feature xi for class Cl |
| ωij | Membership of the ith data to jth cluster center |
| N(l) | Number of neurons in the layer l |
| J | Objective function |
| Yj (1) | Output of neuron j in layer (l) |
| P(t) | Population at iteration t |
| βi, β | Precision for class Ci, Global precision (Accuracy) |
| E(p) | Quadratic error for data point p |
| Sensitivity for class Ci, Global sensitivity | |
| Nl | Size of class Cl |
| σil | Standard deviation of feature xi for class Cl |
| Threshold of the ith neuron in layer l | |
| t(xi) | t-statistic of feature xi |
Owing to an increasing proliferation of cyber-attacks, the requirement to develop high-performance intrusion detection systems (IDS) is becoming more imperative than ever. In IDS research, the most used methodology is based on anomaly detection, where normal activity is compared with observed events in order to detect significant deviations. In recent works, most of the IDS are created on machine-learning technologies using the CICIDS2017 Dataset. As intrusion detection data usually contains numerous features, which strongly influence the learning phase, degradation of speed and performance due to overfitting can occur. Consequently, it is essential to select the best features appropriately through feature engineering.
The broad range of recently published works [1–33] has made it possible to develop IDS capable of recognizing intrusions with great efficiency. The working hypotheses are different, whether it concerns the datasets, the data reduction methods or the classification algorithms. The datasets used are diverse. Generally, those who have used CICIDS2017 have only used part of these datasets, but not always the same one. On the other hand, the attribute reduction techniques as well as the intrusion classification algorithms are very extensive and cover almost all existing ML tools. In some works, all the features were exploited, while in others, only a limited number of these attributes were used.
In addition, it can be noticed that NNs are among the most efficient methods, but there are very few works dedicated to the hybridization of these NNs with metaheuristic algorithms. Clustering methods are exploited in combination with other tools, but are little used as classification algorithms. On the other hand, Linear Discriminant Analysis (LDA) and t-statistic are considered as efficient conventional techniques for selecting the best features, but they have been little exploited. Thus, the proposed contribution through this paper, as well as its novelty, can be summarized as follows:
a) Regarding the data, CICIDS2017 Dataset was chosen to implement the proposed approach, because this dataset is realistic and exploits up-to-date attacks. Additionally, the proposed approach suggests a hybridized detection procedure of all the attack categories. However, due to the high dimension of the CICIDS2017 Dataset, only 25% of the data was used.
b) As feature selection method, LDA performance measure, as F1-score, is used in combination with t-statistic.
c) For the detection of intrusions, unsupervised Fuzzy C-means (FCM) clustering and supervised NN techniques are chosen.
d) In addition, the classifiers (FCM and NN) are hybridized by seven most known metaheuristic methods.
e) The best approach developed will be confronted with two of the most recent datasets: CSE-CICIDS2018 and LUFlow2020.
Based on the CICIDS2017 Dataset, the goal was to implement intrusion detection solutions using FCM and Back-propagation Neural Network (BPNN) techniques that detect and classify with high accuracy each type of attack. Improved FCM and NNs by using hybrid metaheuristic algorithms are then designed. As metaheuristic methods, the seven most known algorithms, including Genetic Algorithm (GA), Particle Swarm Optimization (PSO), Cultural Algorithm (CA), Differential Evolution (DE), Black Hole (BH) Algorithm, Harmony Search (HS), and Ant-Lion Optimizer (ALO), are chosen. To evaluate the proposed classifiers, performance metrics extracted from confusion matrices, such as precision, accuracy, sensitivity and F1-score are employed.
The structure of this paper is as follows. Section 2 gives an overview of related work in the field of IDS. Section 3 introduces the available datasets used for the implementation and evaluation of the proposed approaches. In Section 4, a succinct description of the adopted methods and algorithms (as LDA, BPNN, K-means, FCM, PSO, GA, DE, CA, HS, BH and ALO) as well as performance measure parameters are provided. In Section 5, the experiment results on CICIDS2017 Dataset of the suggested algorithms are detailed; an evaluation of CICIDS2018 and LUFlow2020 Datasets and a comparison between state-of-the-art works and the proposed intrusion detection solutions are also outlined. Some discussions close Section 5. Finally, the main conclusions and perspectives end this paper in Section 6.
Recently, Machine Learning (ML) methods have been frequently adopted in IDS, as detection or features selection tools. Ullah et al. [1] used a global approach to select significant features, oversampling and cleaning the CICIDS2017 Dataset, achieving values for specificity, precision, recall and F1-score of 100%. Vijayanand et al. [2] proposed an IDS centered on genetic algorithm (GA) and Support Vector Machines (SVM) for feature selection and classification. To evaluate their approach, a small percentage of instances from the CICIDS2017 Dataset were used. Zhang et al. [3] performed an anomaly detection model, using Convolutional Neural Network (CNN) and Long Short-Term Memory (LSTM), which reached good classification outcomes with an accuracy of about 99%.
Binbusayyis et al. [4] suggested a feature selection method and established an IDS model by using Random Forest (RF) algorithm. The results achieve 99.88% accuracy. Ahmim et al. [5] proposed a novel IDS, conducted in CICIDS2017, using three different Machine Learning (ML) classifiers. The performance metrics showed that they achieved an accuracy rate of 96.66% and detection rate of 94.47%. Krishna et al. [6] introduced a Fast K-Nearest Neighbor Classifier (FKNN), reaching great precision with less computation time. Alrowaily et al. [7] experimented with seven ML algorithms using CICIDS2017 Dataset, showing that the K-Nearest Neighbor (K-NN) method performed better than other classifiers. Zhang et al. [8] introduced a real-time detection system, using a distributed Random Forest (RF) algorithm, implemented on the CICIDS2017 Dataset. The experimental results revealed that their suggested approach achieved higher accuracy with a shorter detection time. Using the synthetic minority oversampling technique (SMOTE), Adaptive Boosting (AdaBoost) and principal component analysis (PCA) on CICIDS2017, a F1-score of 0.8183 was obtained [9]. In [10], a Random Forest Regressor is first used to select the best features, which is then exploited by K-NN, Multi-Layer Perceptron (MLP), Iterative Dichotomiser 3 (ID3), Adaboost, Naïve Bayes, RF and Quadratic Discriminant Analysis (QDA). The best accuracy value reached 0.98 with RF and ID3 [10].
In [11], the Fisher Score, SVM, K-NN and Decision Tree (DT) algorithms are proposed for features selection and classification tasks to design a denial of service based IDS. With KNN, DT and SVM, this IDS reached 99.7%, 57.76% and 99% success rates, respectively. Moreover, MLP and CNN classifiers are implemented on the Packet CAPture file (PCAP) of CICIDS2017 [12]. The results attested the superiority of MLP, which distinguish network intrusion from benign traffic with an average true positive rate of 94.5%.
A Data Dimensionality Reduction method based IDS has been proposed [13], where SVM, CTree (Conditional inference Trees), XGBoost (Extreme Gradient Boosting) and Neural network (NN) classifiers using 36 selected features were evaluated. The highest accuracy achieved was 98.93% with XGboost, excluding Monday traffic (benign traffic) of the CICIDS2017 Dataset. In [14], the CICIDS2017 Dataset was classified using the DT, naïve Bayes, RF and SVM methods. During this experiment, the ten best features were extracted, allowing Naïve Bayes to provide the best result with an F1-score of 0.92.
Studies using deep learning (DL) methods, such as deep neural network (DNN), recurrent neural network and deep reinforcement learning, have been developed [15–17]. The information Gain (IG) method is used to select appropriate and weighty features and ML algorithms as RF, Random Tree (RT) and J48 are applied in the investigation on CICIDS2017 Dataset. Specifically, RF and J48 achieve the highest accuracy values of 99.86% and 99.87%, respectively, using two different sets of selected relevant features [18].
Ferriyan et al. [19] emphasized applying GA for selecting optimal features and RF for labels classification. Vasan et al. [20] tried the convenience of PCA for intrusion detection. They found that classification accuracy is improved by PCA, by using the optimal number of principal components. Chabathula et al. [21] examined the effect of PCA, used to reduce the number of features, on many ML algorithms as Voting Features Interval, SVM, Random Forest Tree, Naïve Bayes probabilistic classifier, proving that tree algorithm yield the highest classification accuracy.
On the other hand, in IDS design, K-means and K-medoids clustering techniques have been considered in combination with other machine learning methods [22–25]. In [22], K-means clustering and KNN classifier were proposed to enhance the detection accuracy in the NSLKDD Dataset. A hybrid technique merging K-means (for data mining) and RBF kernel function of SVM (for classification) was applied to KDDCup99, achieving an accuracy of 88.70% [23]. An IDS using cluster centers and nearest neighbors proposed and applied to the KDDCup99 Dataset reached an accuracy of 99.9% [24]. In [25], anomalies were detected by using SVM classifier and k-Medoids clustering technique. Ariafar et al. [26] presented a structure for detecting network attacks by means of DT and K-means methods, where K-means parameters and DT confidence factor are adjusted by GA. Peng et al. [27] have offered a PCA and K-means-based IDS, where PCA is used to reduce the data size, and K-means are allowed to cluster the obtained data.
Thakkar et al. [28] considered, ML and DL algorithms, feature selection-based performance evaluation, on the basis of the CICIDS2017 Dataset. In [29], the performance of DNN-based IDS was enhanced by employing a novel fusion of statistical importance–based feature selection technique. A fusion of L1, L2 and elastic net regularization techniques are applied in [30] for increasing a DNN-based IDS performance, by using several datasets, including CICIDS2017.
Kanimozhi et al. [31] focused on detecting the botnet attacks in the CSE-CICIDS2018 Dataset by means of ANN, achieving an accuracy of 99.97% and a false positive rate of 0.001. In [32], Ferrag et al. showed that the DL models, based on Naïve Bayes, ANN, SVM and RF and applied to the CSE-CICIDS2018 Dataset, achieved a 95% of detection rate. In [33], SVM, KNN and DT performances were compared by using multiple datasets, including the CSE-CICIDS2018 Dataset, showing that the IDS-based accuracy ranged from 95% to 100%.
The previous state of the art allows to better situate the problem treated in this paper. The richness of works in the IDS field stimulates the attempt to improve NN and FCM by a metaheuristic-based hybridization. CICIDS2017 is chosen as a database for implementing the proposed approach. In addition, CSE-CICIDS2018 and LUFlow2020 are adopted to assess the results obtained.
This section provides an overview of the CICIDS2017, CSE-CICIDS2018 and LUFlow2020 Datasets used.
CICIDS2017 produced by the Canadian Institute for Cyber-security IDS [34], includes up-to-date network intrusions. Additionally, CICIDS2017 meets all real-world attack criteria. This dataset, publicly available, shows the status of the network traffic, counting normal and attack traffic during five days. The dataset consists of 2830743 instances with 79 features, corresponding to 15 unbalanced traffic classes (one normal class and 14 attack traffic categories). As detailed in [35,36], this dataset is unbalanced because classes are present with an abundant number of occurrences as DDos, PortScan and Dos Hulk, and classes have few instances, such as Infiltration, Web Attack-Sql Injection and Heartbleed.
In the proposed research, only 25% of the MachineLearningCSV version of the CICIDS2017 Dataset was considered, with 707686 observations (Table 1).

In the beginning, the dataset comprises 707686 observations on 79 features including category attributes. In the pre-processing step, some records containing missing values and non-regular values are omitted. After cleaning up the initial dataset, the total number of remaining instances is 707146. The distribution of the data used is shown in Table 1. For experimental purposes, the 25% cleaned CICIDS2017 Dataset is divided with a lot of 70% for training data (with 495000 records) and 30% for testing data (212146 records), as depicted in Table 1.
The two sets of data (training and test) both consist of 15 intrusion classes (normal and attack) with high-class imbalance. The 79 features [34] will be the subject, in Subsection 5.1, of a search for the best characteristics that will be used by the different approaches proposed in this work.
CSE-CICIDS2018 Dataset is produced as part of a collaborative project between the Communications Security Establishment (CSE) and the Canadian Institute for Cybersecurity (CIC) [37]. This dataset, identical to the CICIDS2017, except for the PortScan and Heartbleed attacks, includes 13 different attack scenarios and using the same features. For evaluation purposes, a reduced lot of this dataset is used, after cleaning, with a 70%/30% ratio for the training/test sets, as shown in Table 1.
The LUFlow Dataset [38] is one of the latest datasets for the domain of IDS, created by Lancaster University in 2020. This huge dataset consists of two classes (benign and malicious), with 16 features. Hence, only a reduced set of the samples, after cleaning, are randomly selected for this work, with training/test proportions of 70%/30%, as given in Table 2.

To train an ML algorithm, several techniques can be applied, such as supervised and unsupervised learning. A classification based on labeled data instances in the learning phase, thus defines supervised learning. LDA and NN represent two of the most well-known supervised learning methods. On the other hand, during an unsupervised learning unlabeled data instances can be grouped into classes. This clustering technique include K-means and FCM algorithms.
The use of an ML algorithm generally involves the minimization of a cost function. Metaheuristic algorithms are strategies that guide the process of finding minima. In addition, before being processed, the data must be reduced by first selecting the best features. For this purpose, LDA and t-statistic are adopted in this work. This section briefly outlines the tools used in this work as LDA and t-statistic–based selection method, FCM and NN-based algorithms, the metaheuristic algorithms and the performance measurement parameters.
During a linear discriminant analysis (LDA), discriminant functions are sought [39,40]. In the simple case of 2 classes (C1 and C2), the expression of the unique discriminant function h1, for a data example x, is as given in Eq. (1), where g1 and g2 are class centroids and V a covariance matrix
This discriminant function is computed, using the training set. An intrusion instance x0 is classified as C1 or C2, according to the value of h1(x0), as proposed in System (2).
4.2 Basics of Fuzzy C-Means (FCM) Algorithm
K-means algorithm [41] is a familiar clustering technique distributing instances into K clusters by updating the clusters centers iteratively. Similar instances are assigned to the same cluster and examples with lower similitude are arranged in separate sets. The main K-means steps are shown in Algorithm 1.

With K-means, the results obtained usually depend on the initial centroids’ positions. Few alternatives are proposed to answer this initialization question. The main idea of FCM is to express the membership of each instance to the different clusters by seeking to optimize the objective function [42].
At each iteration, the K cluster centroids
where N is the number of data instances and m the fuzziness index (
dij is the Euclidean distance between the ith data and the jth cluster center.
The FCM main goal is to minimize the objective function J (Eq. (5)).
The FCM steps are given in Algorithm 2.

A multilayered neural network is structured into layers of neurons: one input layer, one output layer and one or several hidden layers [39,43]. Each neuron i in a level l is directly connected to all the neurons of the previous layer (l − 1) and yields a response Yi (l), result of a nonlinear processing through an activation function s (Eq. (6)).
where θi(l) and Wij(l) are the threshold of the neuron i in layer l and its connection weight with neurons j (in layer l − 1), N(l−1) the number of neurons in the layer l − 1.
Through supervised training, using the error back-propagation (BP) algorithm, the BPNN attempts to minimize, on the output layer, for each data p, a quadratic error E(p) (Eq. (7)) subsisting between the ith output effective value oi(p) and the desired value ri(p).
This subsection will succinctly describe the metaheuristic algorithms adopted in this study as PSO, GA, DE, CA, HS, BH and ALO.
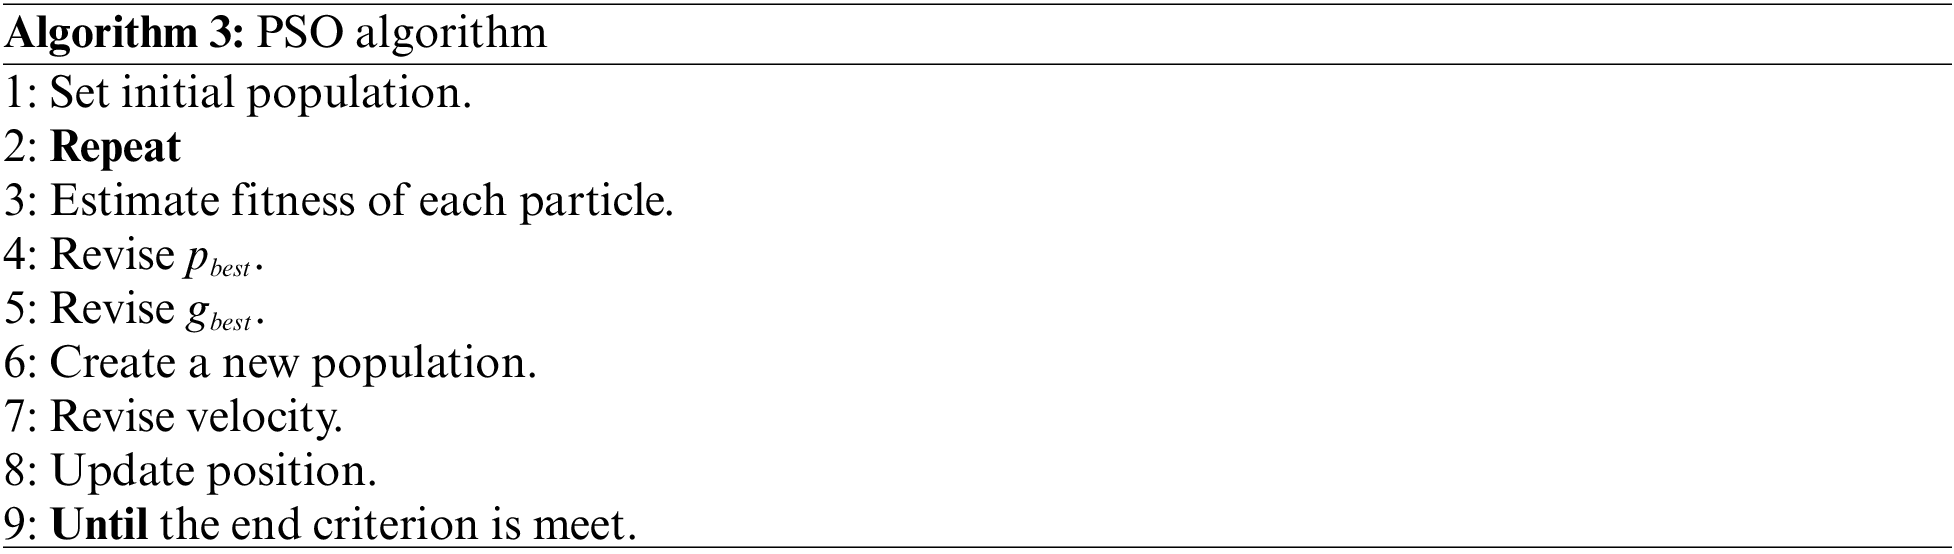
4.4.1 Particle Swarm Optimization (PSO)
Particle swarm optimization (PSO) is a metaheuristic algorithm founded on the swarm intelligence concept [44]. A PSO procedure starts with a random population of solutions. In the search space, the prospective solutions, called particles, have a fitness value to evaluate by the objective function, and a velocity that directs their flying [45].
At each iteration, PSO updates the velocity and position of each particle, using the two best attributes: pbest and gbest. The key points of PSO are shown in Algorithm 3.
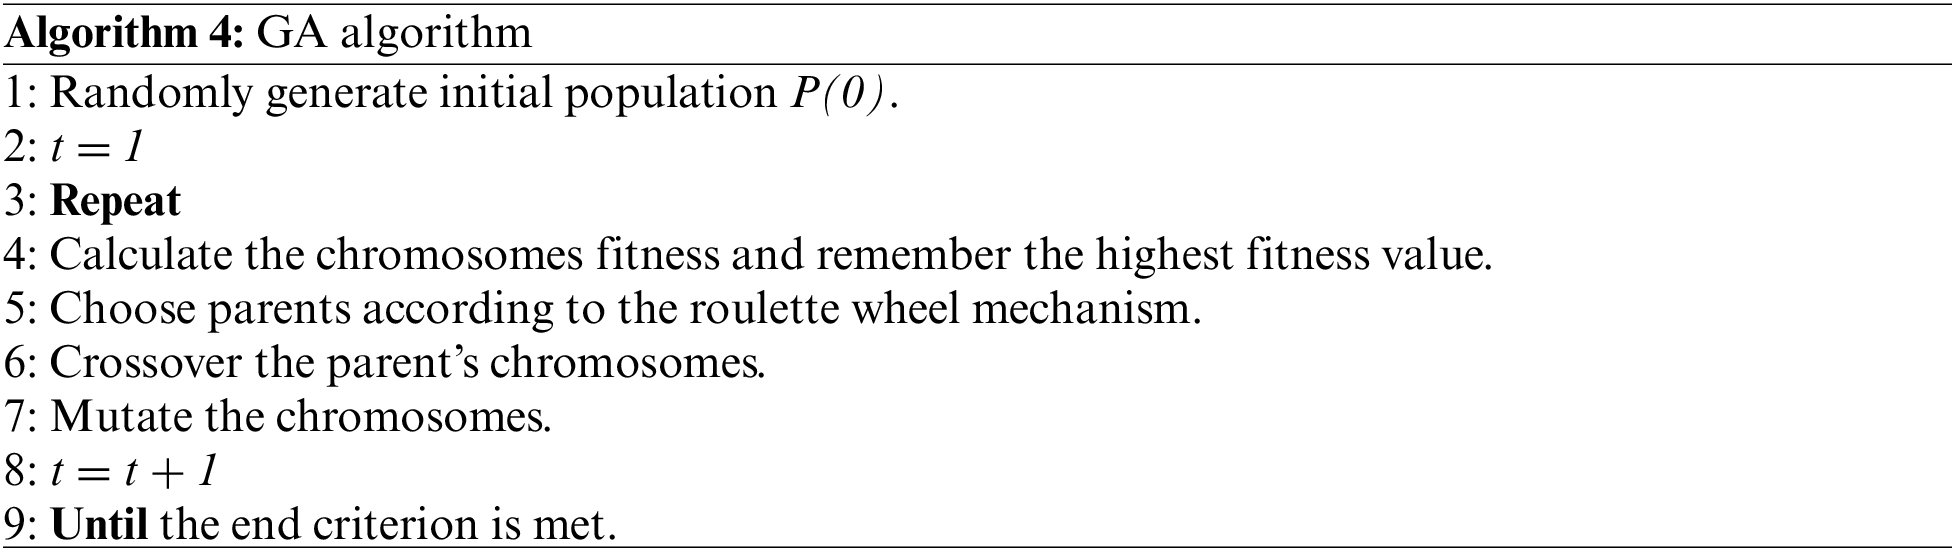
The genetic algorithm (GA), developed by Holland [46], is centered on three main operators: selection, crossover and mutation.
The GA process begins iterations with a generated random set of individuals and considered as potential solutions. That set of individuals is then tested against the objective function. The selection procedure retains then the best performing chromosomes, called parents, according to their fitness values. GA operates on a population, denoted P(t), the tasks described by Algorithm 4.
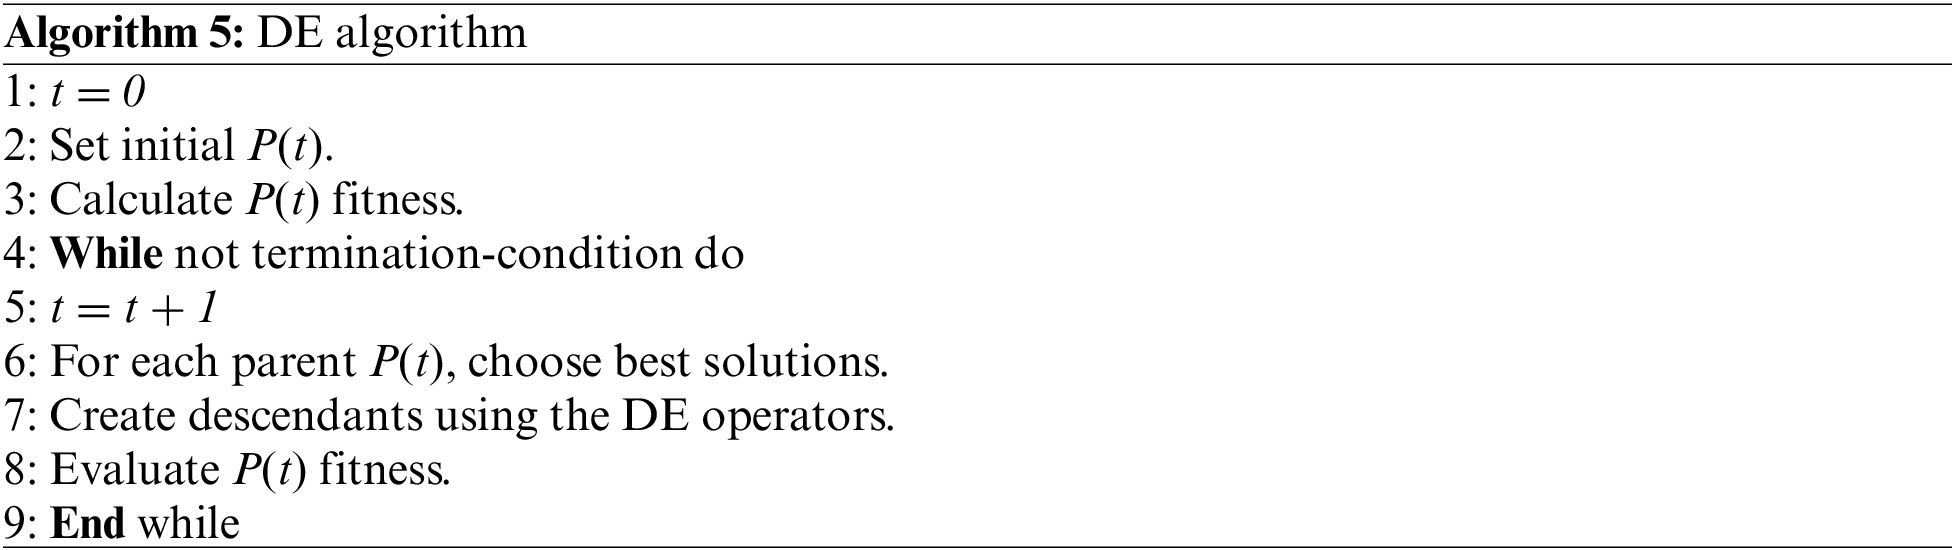
4.4.3 Differential Evolution Algorithm (DE)
The differential evolution algorithm (DE) is a population-based metaheuristic search algorithm [47]. In DE, solutions are identified as genomes or chromosomes. DE algorithm takes on a population P(t), the operations of mutation, crossover, selection and calculates the fitness value of each solution repeatedly, as illustrated by Algorithm 5.
CA is based on the human cultural evolution process. CA works on two spaces, including population and belief spaces [48]. The interaction between the population and belief spaces is provided through the communication protocol (defined by acceptance and influence functions). The population space (PS) of CA contains individual solutions, while the belief space (BS) represents the cultural information gained during the evolution process. The main Cultural Algorithm steps are described in Algorithm 6.

4.4.5 Harmony Search Algorithm (HS)
Harmony Search (HS) Algorithm is a metaheuristic search algorithm which attempts to reproduce the musicians creativity process in composing an agreeable harmony [49]. This algorithm considers harmony memory using a process similar to choosing the best-fit individuals in other metaheuristic techniques. In addition, a harmony memory-accepting factor (reaccept) is allocated. The main HS steps are given in Algorithm 7.

4.4.6 Black Hole Algorithm (BH)
The Black Hole algorithm (BH) is motivated by the phenomenon of the black hole and tries to reproduce its rule of attracting other stars in space [50]. Black holes symbolize solution with best fitness and other candidate solutions as star. All stars explore new best positions while moving towards black-hole. When a star reaches better fitness than black hole, its position is swapped. Star too close to black hole (pass event horizon) will be replaced by new random solution, as explained in Algorithm 8.

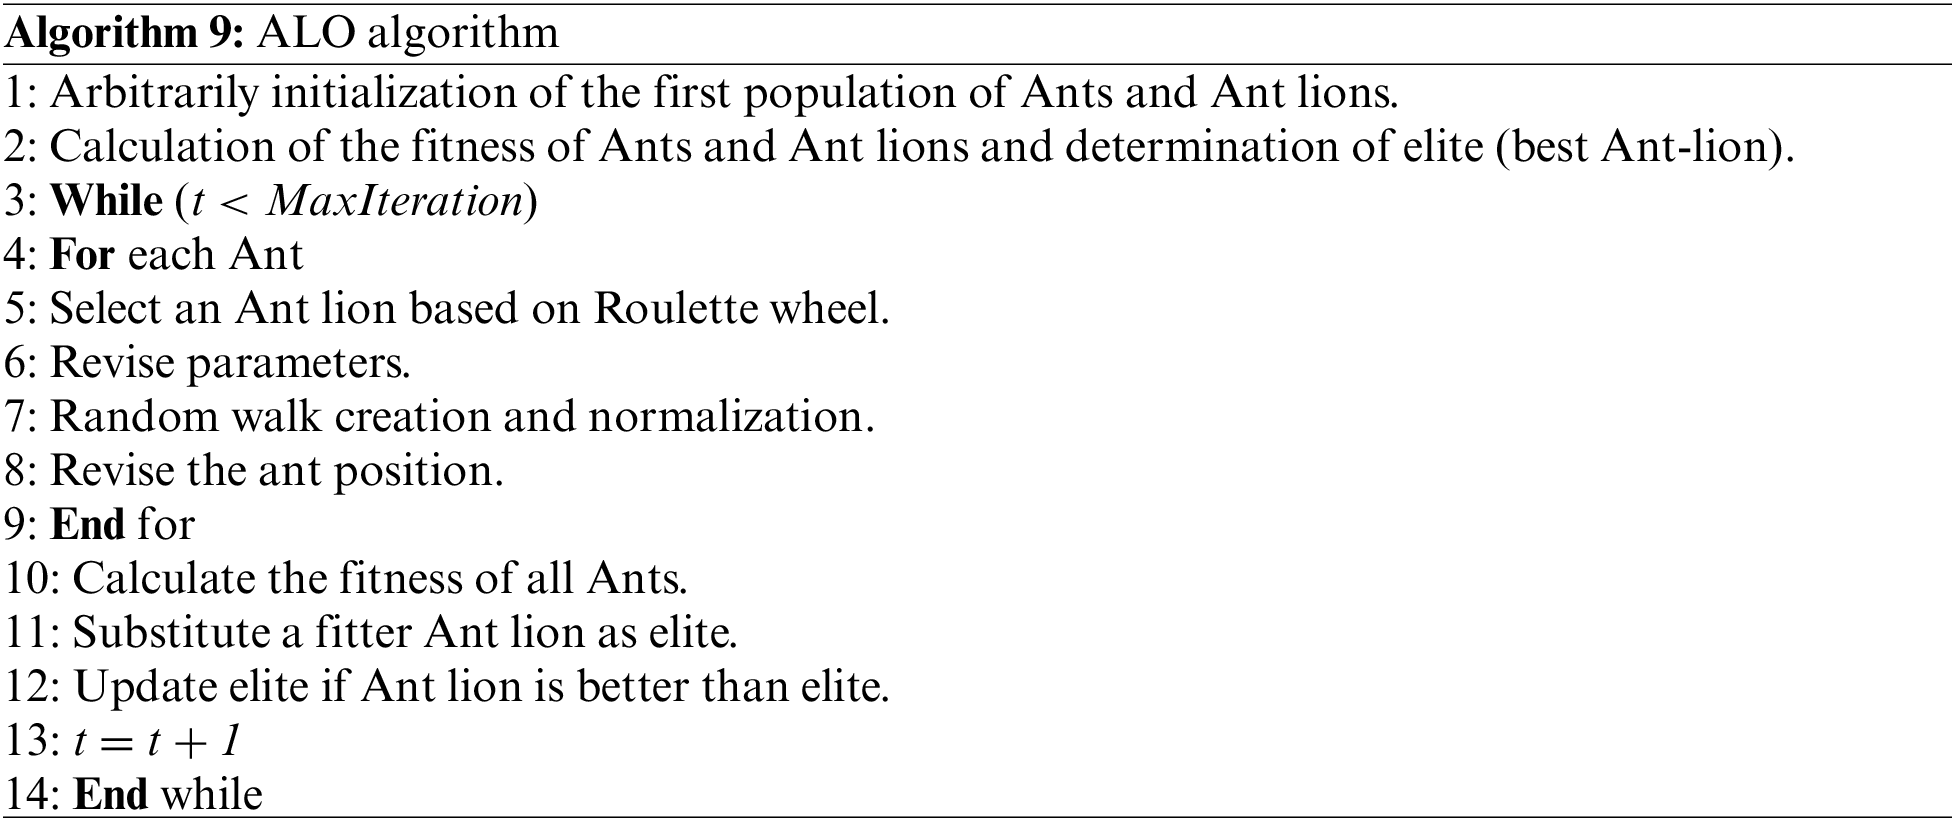
4.4.7 Ant Lion Optimization (ALO)
Ant lion optimization (ALO) algorithm uses ant lions hunting technique [51]. ALO comprises five main hunting steps: random walk, construction traps, entrapment of ants in the trap, catching prey and reconstruction traps. The main ALO steps are given in Algorithm 9.
Performance metrics regarding intrusion detection can be defined from a confusion matrix, such as accuracy, precisions, sensitivities and F1-score. On the other hand, and before applying a classification method, it is essential to select the best features. The following subsections summarize how to compute these metrics.
4.5.1 Confusion Matrix Based Parameters
IDS effectiveness is estimated according to its ability to classify intrusion traffic into a correct type. Table 3 displays all possible cases of classification, where Aij denote the number of examples of genuine class Ci categorized as class Cj and Ni is the size for class Ci.

To evaluate the proposed classifiers (FCM, BPNN, hybrid based FCM and hybrid based NN), two parameter sets are used. The first set includes specific metrics of each type of attack, as the Detection Rate or Precision, the True Positive Rate (recall or sensitivity), the False Decision Rate (or False Alarm Rate) and F1-score. The second one consists of global metrics as global sensitivity, global false decision rate, global F1-score and accuracy.
For each predicted class Ci, precision rate
Thus, the global rates as accuracy
It is also essential to note that for all the metaheuristic based approaches (hybridized FCM and NNs), and to maximize accuracy
4.5.2 T-Statistic Based Features Ranking
As feature selection technique, the t-statistic method [52] is applied in this work. For each characteristic xi, a univariate Discriminant Function is calculated on data belonging a priori to two classes Cj and Cl. t-statistic, t(xi) is obtained according to Eq. (11).
where μik, σik and Nk signify respectively the mean, the standard deviation of ith feature xi and the size for class Ck, for k = {j, l}. The best features are those with the highest t-statistic values.
5 Implementation of the Proposed Methodology
As earlier presented, the aim of this work is to improve the detection of intrusions in 25% of CICIDS2017 Dataset, by using a hybridized detection process of all the attack families. To this end, this work was carried out in three main steps:
i) To select the best features, a combination between F1-score, extracted from LDA, and t-statistic method was adopted.
ii) For the detection of intrusions, unsupervised Fuzzy C-means (FCM) and hybrid FCM clustering using seven metaheuristic algorithms (GA, PSO, CA, DE, HS, BH and ALO) are performed after the designation of the finest number of clusters by Elbow technique.
iii) To improve performance parameters of intrusion detection, supervised NNs (a Back-propagation Neural Network and seven hybrid NNs, using the above-cited metaheuristic algorithms) are achieved.
To finalize this analysis, two further steps are achieved:
iv) The best approaches, proven during the two previous steps, are reassessed using data from CICDS2018 and LUFlow2020 Datasets.
v) Performance regarding the suggested approaches and state of the art works are displayed.
In this section, the different steps of the suggested approach are detailed. In addition, the overall results are discussed.
Notice that the various analyzes achieved in this work have been developed under the Matlab environment, R2017b, with an Intel Core i7 3.0 GHz processor, 16 GB of RAM.
As introduced above, the used CICIDS2017 Dataset contains observations on 79 features counting category attribute [34]. In this work, and to select the best features, two techniques are used, namely F1-score extracted from LDA and t-statistic.
Indeed, a univariate discriminant analysis was developed, allowing to calculate the Discriminant Functions (DF) by considering one variable xi at a time and a couple of classes at a time as well. This allowed to establish the confusion matrix for each DF (and for each feature), and to deduce the F1-score value (F1i).
In the same way, the t-statistic function t(xi) was calculated, for all the features xi and for all class pairs, as given in Eq. (11). Thus, considering all classes, each feature xi has an average value for F1i, noted (F1mi) and for t(xi), noted tm(xi). The sum (0.5 F1m i + 0.5 tm(xi)) is used to rank the features in decreasing order. Thus, the 24 best uncorrelated attributes, ranked by decreasing value of the sum (0.5 F1m i + 0.5 tm(xi)

To test the discriminating power of these 24 selected features to detect normal traffic or attacks, a complete LDA is performed. Thus, by exploiting the 24 variables listed in Table 4, and the first nine most frequent classes (C1 to C9) of Table 1, eight discriminant functions, DF, (h1, h2, …, h8) were calculated for eight pairs of classes. To carry out the designs, we chose 1200 instances per intrusion class and a decision rule as given in System (12).
The best DFs allow to establish the confusion matrix, from which the performance rates (precisions
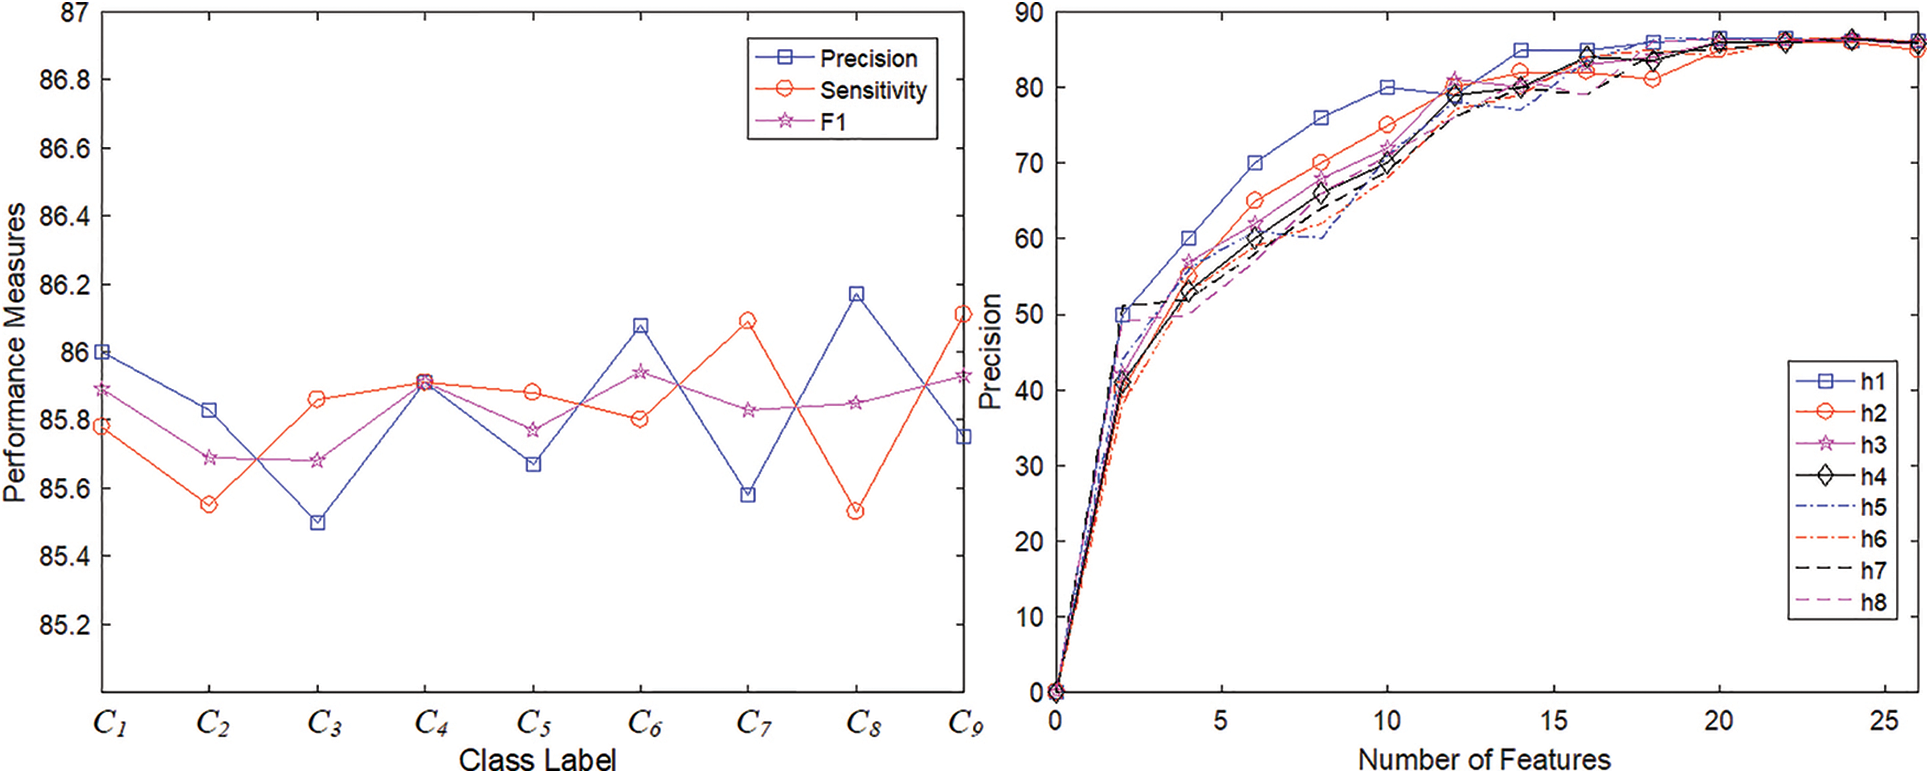
Figure 1: Performance measures obtained by LDA
These results show acceptable precisions, sensitivities as well as F1-scores, with an average value of these three parameters around 85.83%, because the selected features are sufficient and relevant to characterize the attack patterns. In addition, the experiment results illustrate the fact that through LDA, identification of the different classes is possible with reasonable accuracy and global F1-score (improvable by non-linear methods like those proposed in the following subsections).
5.2 FCM and Hybrid FCM Based Detection of Intrusion
The considered data (707146 intrusion instances of Table 1, split into a training set (70%) and test set (30%), with 24 features listed in Table 4) will be classified using FCM and hybridized FCM. Let us start first by determining the exact number of clusters existing in the used CICIDS2017 Dataset by the elbow method.
5.2.1 Finest Number of Clusters (K) Using Elbow Method
Before clustering the data using K-means or FCM methods, it is necessary to know the exact number of clusters (K) present in the dataset. The elbow method gives an interpretation to the evolution of the variance regarding the number of clusters [53]. In fact, Within-Cluster Sum of Square (WCSS) is calculated as a function of the number of clusters (K), WCSS is the sum of the squared distance between each instance and the cluster centroid (Fig. 2). According to Fig. 2, the curves (obtained by K-means and FCM clustering designs) decrease to the elbow point (K = 13–15), from which the curve decreases no more or very little. This observation brings us closer to the actual number of classes (K = 15), contained in the used CICIDS2017 Dataset. However, from clustering point of view, if the class size is negligible (as for classes C12–C15 in Table 1), it is immersed by the other classes. Finding K~13 is not surprising; this reflects one of the intrusion classes’ realities.
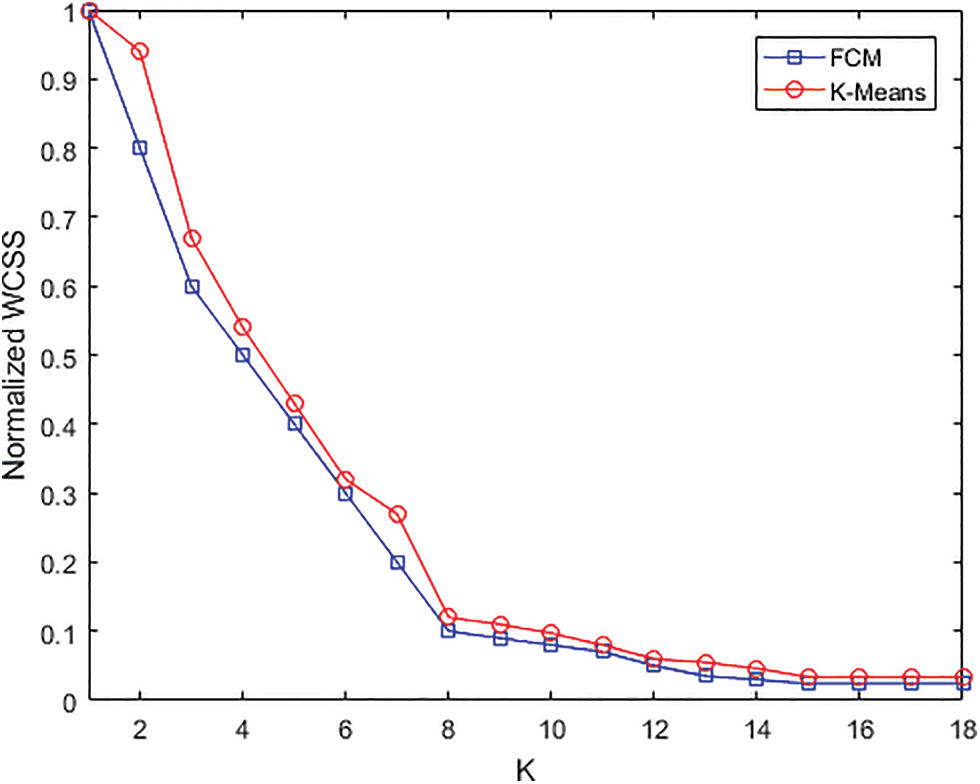
Figure 2: Within clusters sum of squared distances (WCSS) vs. K
5.2.2 FCM Based Detection of Intrusion
Each instance is labeled according to the type of intrusion to which it belongs. Since FCM is an unsupervised procedure, the instance label is not used during clustering, but as validation information and to calculate performance metrics. Intrusion data defined by the 24 most informative features, as defined in Table 4, are considered as input for the FCM algorithm. According to Algorithm 2, all data in the training set are grouped into 15 clusters (K = 15). After an initial random choice of 15 clusters centers, FCM assigns to each intrusion instance a membership score for each of the clusters. By minimizing the adopted objective function, FCM updates, at each iteration, clusters centers and membership levels for each instance. FCM ends by producing a list of cluster centers and multiple membership levels. This allows for establishing the confusion matrix, based on the knowledge of the real membership of each instance, and from which the performance parameters are deduced and reported in Table 5.

5.2.3 Hybrid FCM Based Detection of Intrusion
Metaheuristic algorithms as PSO, GA… are powerful and stochastic non-linear optimization tools. To find the optimum fuzzy partitions of intrusion types, a new metaheuristic based FCM clustering method has been proposed. Clustering using PSO-FCM, GA-FCM, DE-FCM, CA-FCM, HS-FCM, BH-FCM and ALO-FCM can be achieved using the Algorithm 10.

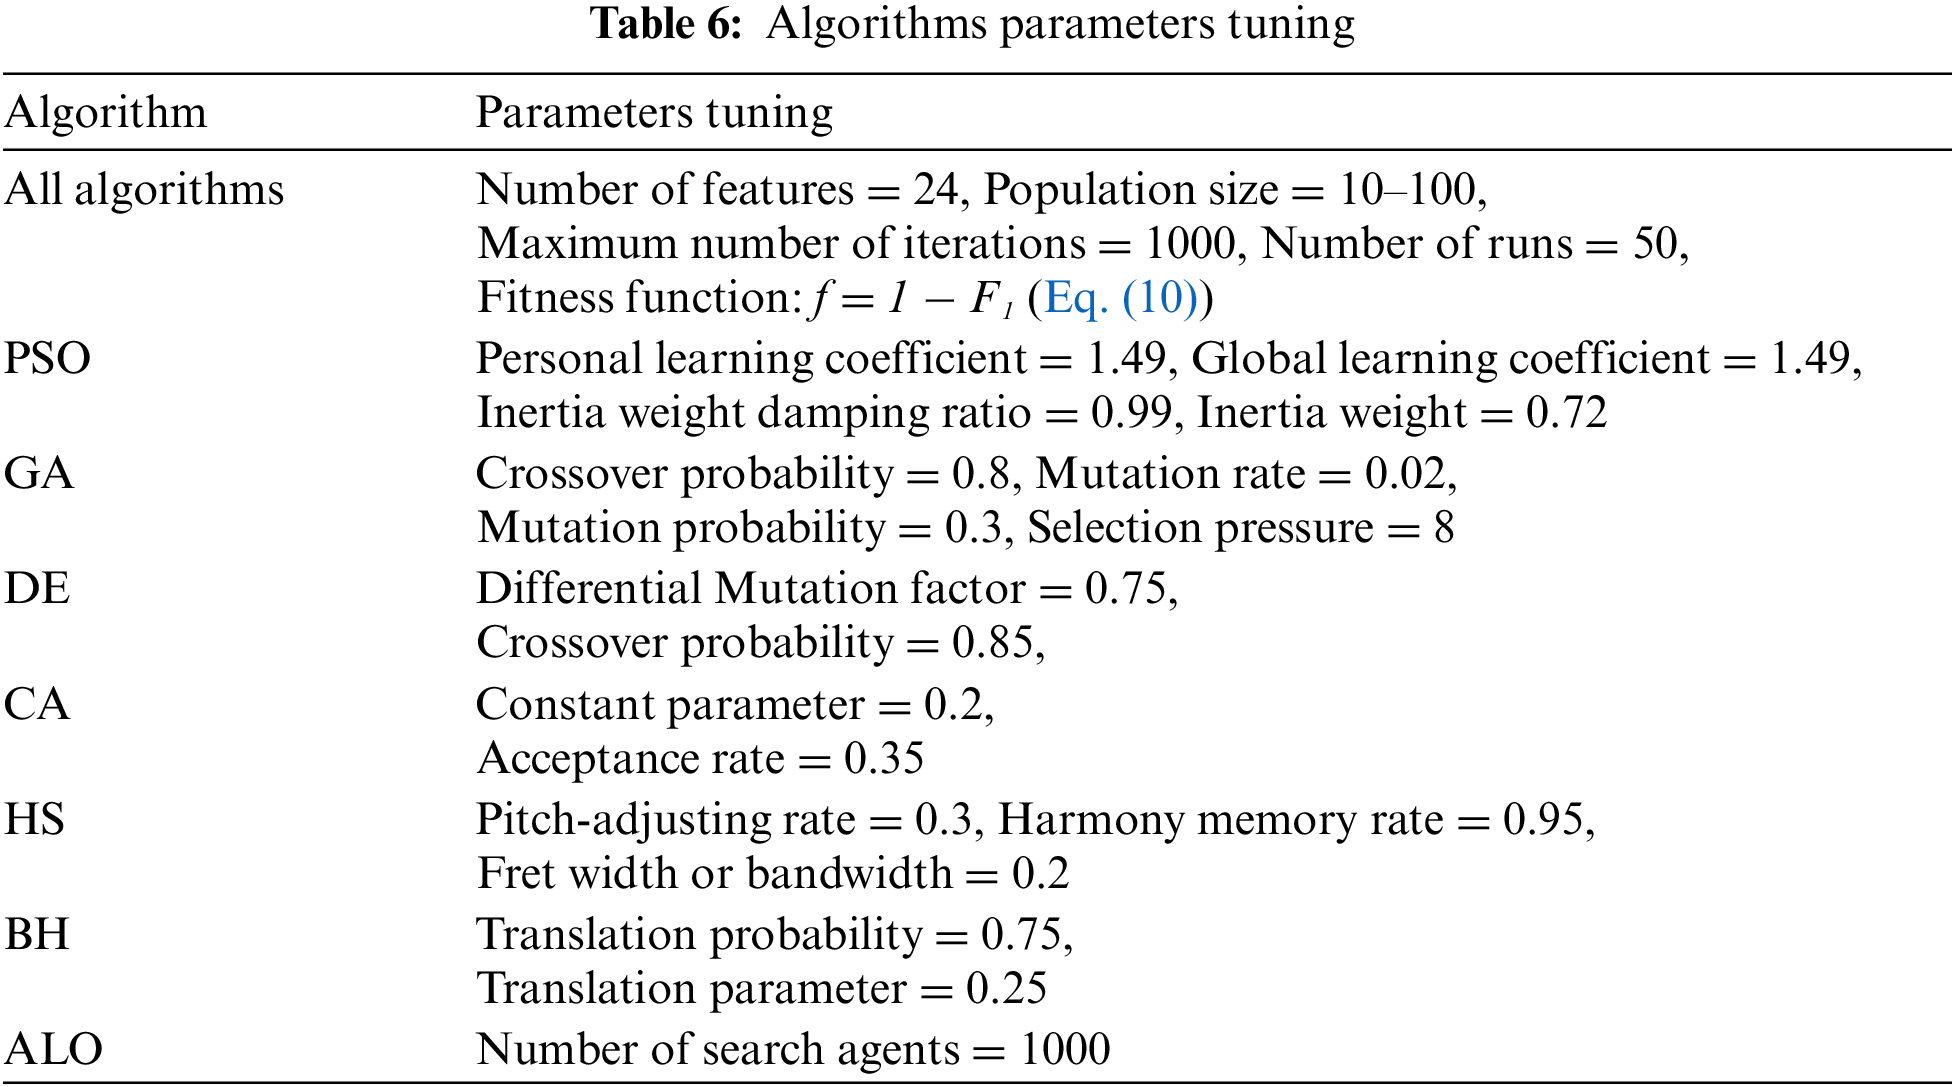
This algorithm comprises two parts. In the first step, the K clusters (K = 15) are developed according to the metaheuristic algorithm concerned by using the tuning parameters exposed in Table 6. The best result obtained is then readapted, during the second stage, according to FCM clustering Algorithm.
As observed for FCM design, the instance label is not used during clustering, but as validation information and to calculate confusion matrices and their corresponding performance metrics as achieved and illustrated in Table 5 and Fig. 3. FCM and Hybrid FCM being unsupervised approaches design, only the CICIDS2017 training Dataset was used, acting also as a test set. Thus, the results provided in Table 5 represent the test performance rates (Accuracy β, global sensitivity γ and global F1-score).
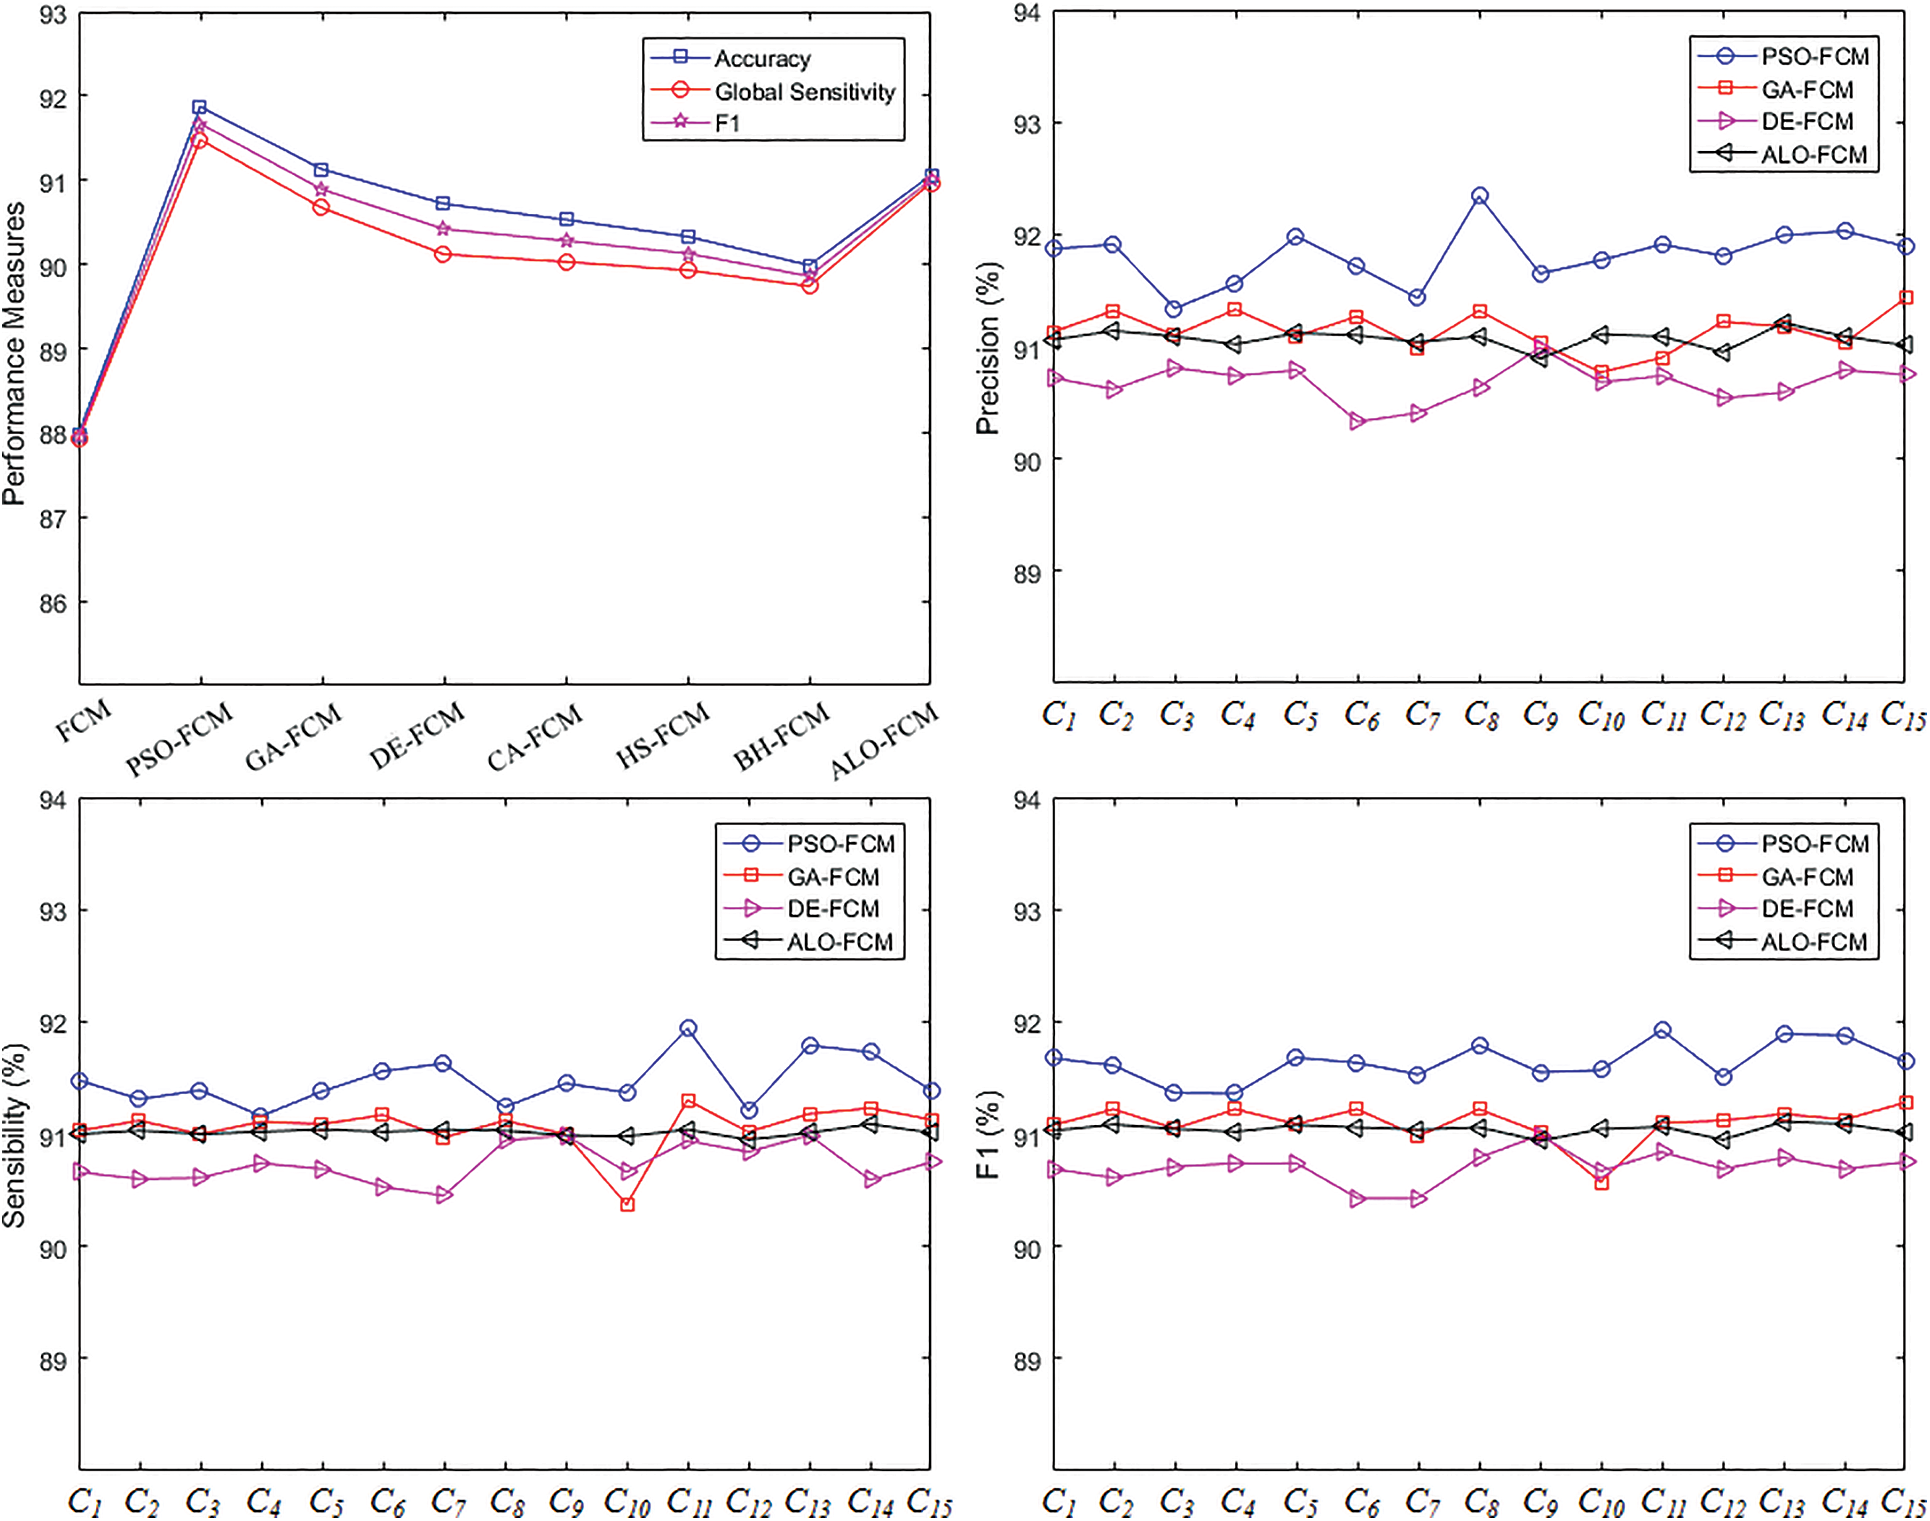
Figure 3: Best performance measures for FCM-based algorithms and intrusion categories (C1 to C15 are attack classes defined in Table 1)
Because the results of the proposed algorithms depend on random initializations, the FCM-based approaches were repeated 50 times. The results illustrated in Table 5 represent the mean values with the standard deviations of the performance parameters obtained. These results can be shortened as follows. The best accuracy rates are (in %) 87.98, 91.87, 91.13, 90.72, 90.53, 90.33, 89.99 and 91.06 for FCM, PSO-FCM, GA-FCM, DE-FCM, CA-FCM, HS-FCM, BH-FCM and ALO-FCM, respectively. The best global sensitivity rates are (in %) 87.92, 91.48, 90.67, 90.12, 90.03, 89.93, 89.74 and 90.97 for the previous eight FCM-based algorithms, respectively, while the best global F1 values reach (in %) 87.95, 91.67, 90.89, 90.42, 90.28, 90.13, 89.86 and 91.01 for the eight FCM-based algorithms mentioned above, respectively.
The best performance rates obtained are summarized in Fig. 3. As proved by these last results, PSO-FCM, GA-FCM, ALO-FCM and DE-FCM outweigh the rest of the FCM-based algorithms. Fig. 3 presents also the best precisions, sensitivities and F1-scores of these last 4 algorithms, with regard to the intrusion classes C1 to C15 (as defined in Table 1).
5.3 BPNN and Hybrid NN-Based Detection of Intrusion
As dealt with in the previous section, the considered CICIDS 2017 intrusions will be detected using BPNN, followed by processing through seven metaheuristic-based NN as expressed in Algorithm 11 and based on parameters shown in Table 6. However, before proceeding with the detection of these intrusions, it would be wise to seek the best NN architecture.
It should be noted that regardless of the adopted architecture, the NN model consists of one input layer including 24 neurons, corresponding to selected features in Table 4. The input layer is followed by several hidden layers, whose exact number and sizes are to be determined. The output layer consists of 15 neurons, where each neuron is dedicated to a class. The desired response ri of the ith output neurons (i = 1, …, 15), for each instance x, is coded according to Eq. (13).
For every intrusion instance x0, a decision rule is proposed, for the 15 intrusion classes, depending on the ith neural output oi (i = 1,…, 15) as specified in System (14).
In the search of the best NN, all structures with 1 to six hidden layers, containing between 10 and 100 neurons each, are considered.
During the BPNN classification, the NN weights and thresholds are computed using the formulation given in Subsection 4.3. In the case of hybrid-NN using GA, PSO, DE, BH, CA, HS and ALO, the weights and thresholds are the metaheuristic components to be handled until the end of the iterations. Additionally, runs with 10 to 1000 iterations and populations ranging from 10 to 100 individuals were explored.

The key points to note, in NN designs, are the reliance of accuracy rates with the NN size (regardless of the neurons spreading in the network), the training number of iterations and the population’s size. The Accuracy-Number of neurons dependency is shown in Fig. 4, where accuracy rates are schemed regarding the number of hidden nodes for BPNN and PSO-NN. This first result is probed thanks to architectures with 5 hidden layers, using BPNN and PSO-NN (with 200 iterations and a population size of only 40 individuals). After a lot of experimentation, and as shown in Fig. 4, the finest architecture attained is (24, 40, 60, 40, 20, 30, 15).
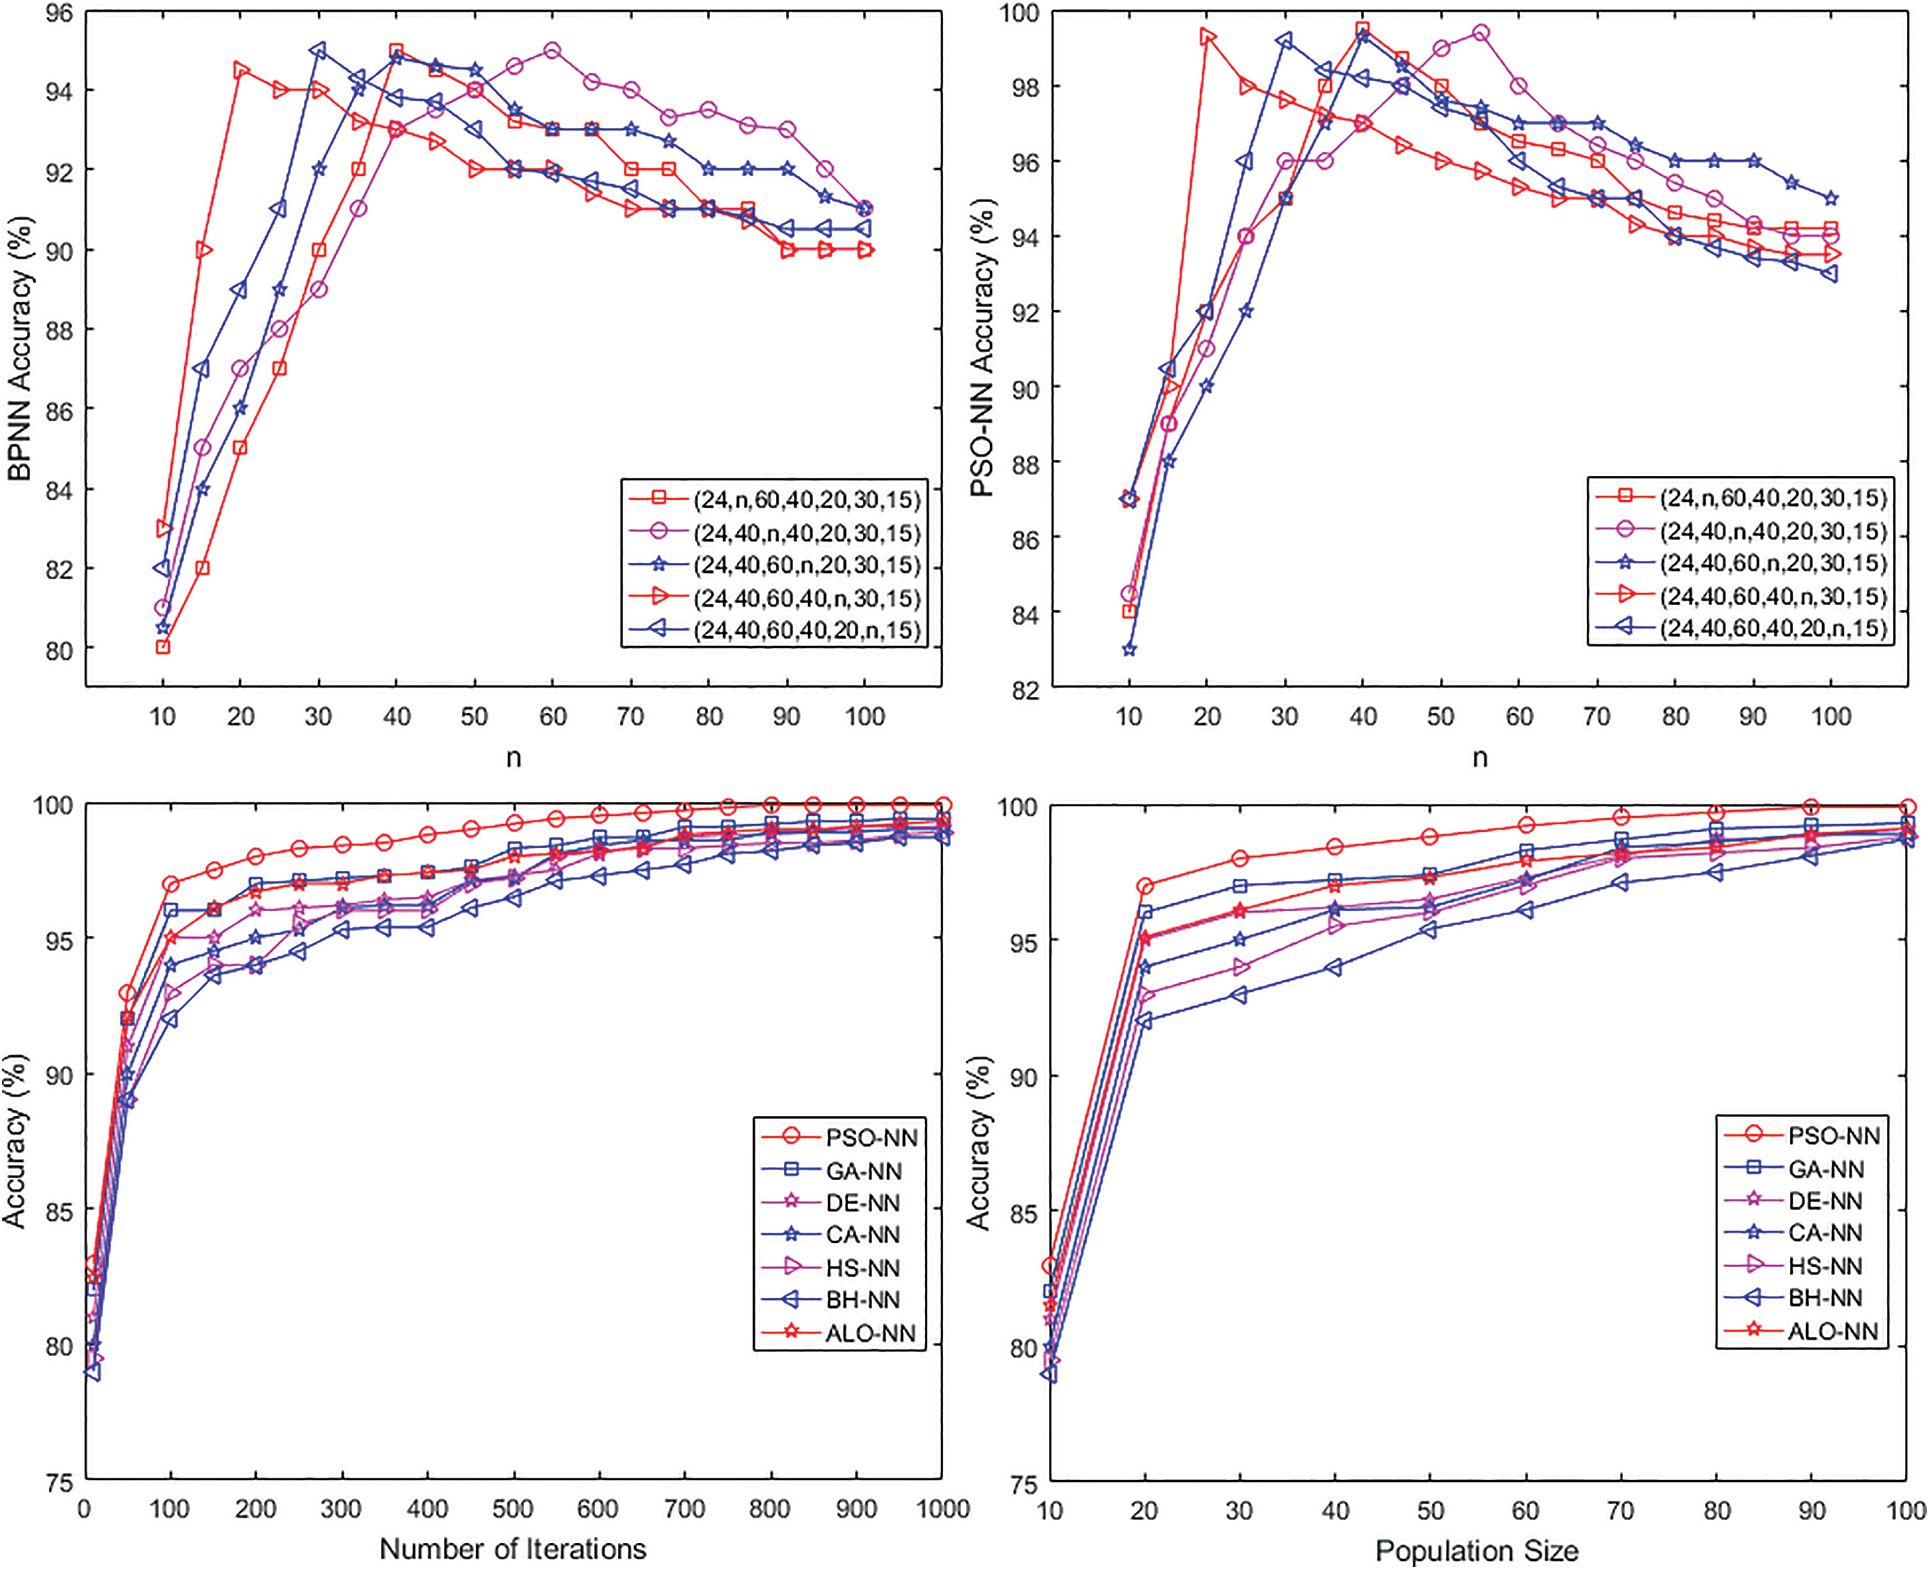
Figure 4: Accuracies vs. number of hidden neurons n for BPNN and PSO-NN and accuracy vs. number of iterations and accuracy vs. population’s size
Regarding the contribution of the Number of Iterations in improving accuracies, Fig. 4, produced on the same NN architecture (24, 40, 60, 40, 20, 30, 15), shows that accuracies can be improved by 3–4 points if the number of iterations is increased to 1000. It can be perceived that the PSO-NN, GA-NN and ALO-NN algorithms are more efficient.
Fig. 4 illustrates the best accuracy rates found for different population’s size values and produced on the same NN architecture (24, 40, 60, 40, 20, 30, 15). The last result again explains the advantage of the PSO-NN approach. Moreover, satisfactory results are provided with an average population of 50 individuals.
5.3.2 Intrusion Detection by Using Hybrid NN
Because the proposed metaheuristic algorithms are initialized in a random way, the hybrid NN-based approaches were re-executed 50 times. Notice that, for each run, a confusion matrix is established allowing to extract the global results. The best results on the 50 adopted runs, obtained with the eight NN-based algorithms for both training and testing datasets, are shown in Table 7.

The best training performance measures by the eight NN-based algorithms can be summarized as follows. The best training accuracy rates correspond (in %) to 96.88, 99.99, 99.56, 99.13, 98.87, 98.97, 99.12 and 99.25 for BPNN, PSO-NN, GA-NN, DE-NN, HS-NN, BH-NN and ALO-NN, respectively. The best global training sensitivity rates are (in %) 96.34, 99.97, 99.45, 99.09, 98.68, 99.13, 98.94 and 99.41 for the previous eight NN-based algorithms, respectively. The best training F1-values cover the range (in %) of 96.11, 99.98, 99.50, 99.11, 98.77, 99.05, 99.03 and 99.33 for the eight NN-based algorithms mentioned above, respectively.
Additionally and in conjunction with the four best NN-based algorithms, the greatest test accuracy rates are (in %) 99.97, 99.51, 99.01 and 99.23 for PSO-NN, GA-NN, DE-NN and ALO-NN, respectively. The highest global test sensitivity rates reach the following values (in %): 99.95, 99.26, 98.93 and 99.11 for the previous four best NN-based algorithms, respectively. The highest test F1-values extend over the interval (in %) of 99.96, 99.38, 98.97 and 99.17 for the four best NN-based algorithms mentioned above, respectively.
Fig. 5 displays the best test global performance measures attained by the eight NN-based algorithms and examples of test precision, sensibility and F1-score rates, obtained by the four best NN-based algorithms (PSO-NN, GA-NN, ALO-NN and DE-NN) with respect to intrusion category.
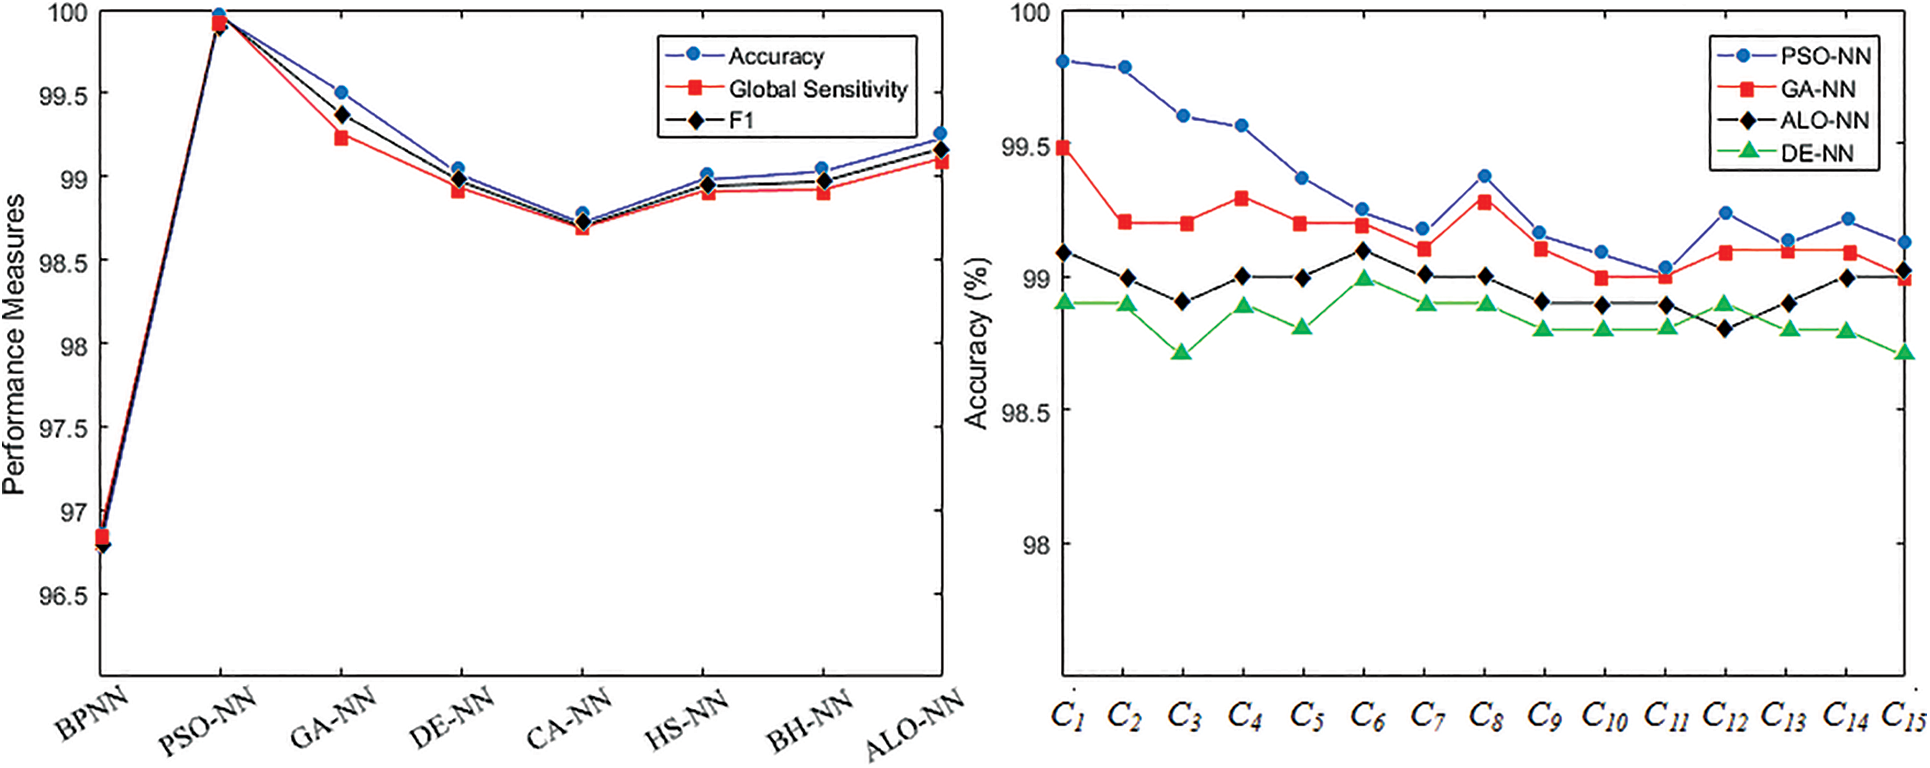

Figure 5: Test performance measures with respect to NN-based algorithms and intrusion detection performance comparing of NN-based algorithms for accuracy, sensitivity and F1-score
As shown by the previous results, PSO-NN is the best algorithm among the eight metaheuristic-based NNs. Details about the distribution of PSO-NN performance rates with respect to the 15 intrusion classes, given in Table 8, for training and test datasets, show excellent performance, situating thus accuracies, sensitivities and F1 rates, for all classes, between 99.32% and 99.99%.

The execution times, achieved offline during the learning phase, for FCM-based algorithms and NN-based techniques with (24, 40, 60, 40, 20, 30, 15) architecture, using 1000 iterations, are collected in Table 9. From Table 9 and previous results, the PSO-NN approach provides the best efficiency-computational cost.

5.4 Approach Evaluation by Using CSE-CICIDS2018 and LUFlow2020 Datasets
After ensuring that the PSO, GA and ALO-based FCM and NN have achieved good accuracy, the models are tested using the CSE-CICIDS2018 [37] and LUFlow2020 Datasets [38].
Regarding the CSE-CICIDS2018 Dataset, the training and test data given in Table 1 were used. As this dataset has the same features as the CICIDS2017 Dataset, the same selected attributes (Table 4) are retained.
For the LUFlow2020 Dataset, the training and testing of the proposed approaches are performed on the data set in Table 2. The features of this dataset have been reduced from 16 to 10, based on the same features selection approach employed for the CICIDS2017 Dataset, described in Subsection 5.1. The features selected are shown in Table 10.

For the hybridization of FCM or NN by the three metaheuristics chosen (PSO, GA and ALO), the same procedures defined in Algorithms 10 and 11 are used and keep the same tuning parameters of Table 6. The results obtained during the training phase, with 1000 iterations and after 50 runs, are summarized in Table 11. The best test performance rates are shortened in Table 12. Based on these results, PSO-NN, GA-NN and ALO-NN, as well as the FCM-based approaches, keep the same efficiencies as those reached for CICIDS2017. Moreover, PSO-NN and GA-NN show excellent test accuracies, reaching 99.77 % and 99.31%, respectively, for the CSE-CICIDS2018 Dataset, (99.97% and 99.72%, respectively for the LUFlow2020 Dataset).


These results are illustrated in another way, with the Receiver Operating Characteristic (ROC) curves, given in Fig. 6. The area under the curve (AUC) values are also provided in Table 12, once again proving the correctness of the proposed approach.

Figure 6: ROC curves for FCM- and NN-based approaches using CSE-CICIDS2018 and LUFlow2020 Datasets
5.5 Comparison with State-of-the-Art Works
Performance evaluation regarding the suggested approaches and published works [9,54–69] is displayed in Table 13. Despite the fact that the comparison with related work is not a straight forward process, the established results show that the three algorithms PSO-NN, GA-NN and ALO-NN are very efficient in the intrusion detection task. Moreover, PSO-NN algorithm provides improved performance than state-of-the-art studies concerning accuracy (

In this subsection, the results obtained are commented on by raising issues related to the interpretation of the False decision rate, the evaluation of the approaches proposed by recent datasets, the comparison with state-of-the-art works, and the implementation and deployment of real-time IDS.
Firstly, it is important to remember that the results provided are articulated around the three parameters accuracy, sensitivity and F1-score. The results of the fourth parameter (the false decision rate) can be deduced from the sensitivity (its complement). On the basis of the experimental outcomes (Table 5), by means of training the CICIDS2017 Dataset, with the 24 selected features (Table 4), FCM and Hybrid FCM algorithms can detect all attack categories with acceptable performance rates. Indeed, the detection accuracy of FCM-based algorithms increases from 88% for FCM to 91.87%, 91.13% and 91.06% for PSO-FCM, GA-FCM and ALO-FCM, respectively. The same observation is made for sensitivity measurements, where this parameter rises from 87.92% for FCM to 91.48%, 90.67% and 90.97% for ALO-FCM, GA-FCM and ALO-FCM, respectively.
The performance of BPNN and metaheuristic-based NNs in detecting intrusions, as presented in Table 7 (for the training and test used ICICIDS2017 data), greatly improved accuracy, sensitivity and F1 rates. The three performance parameters range from 96% for BPNN to 99.99% for PSO-NN. The accuracy of PSO-NN approach in detecting intrusion families is excellent, reaching a value of 99.99% using the training Dataset and 99.97% using testing dataset. In the same way, the test-sensitivity and test-F1 rates are worth 99.95% and 99.96%, respectively. Since the PSO-NN based overall sensitivity is 99.95%, the false decision rate is 0.05%. In other words, out of a decision regarding 212146 test-instances (defined in Table 1), only 106 intrusions would be false alarms.
It should be noticed that the NN-based results are linked to the decision rules established in (System 14). Thus to reduce the False decision rate, these decision rules must be modified by exploiting the histograms of the 15 PSO-NN training responses. For example, by exploiting the histogram of o4 (the output reserved to the C4 class or the DDos intrusion category), shown in Fig. 7, and calculated for all the training instances, the DDos detection sensitivity obtained by PSO-NN can reach the value of 100% (and the false detection rate can be 0%), if the rule defined in (System 15) is applied.
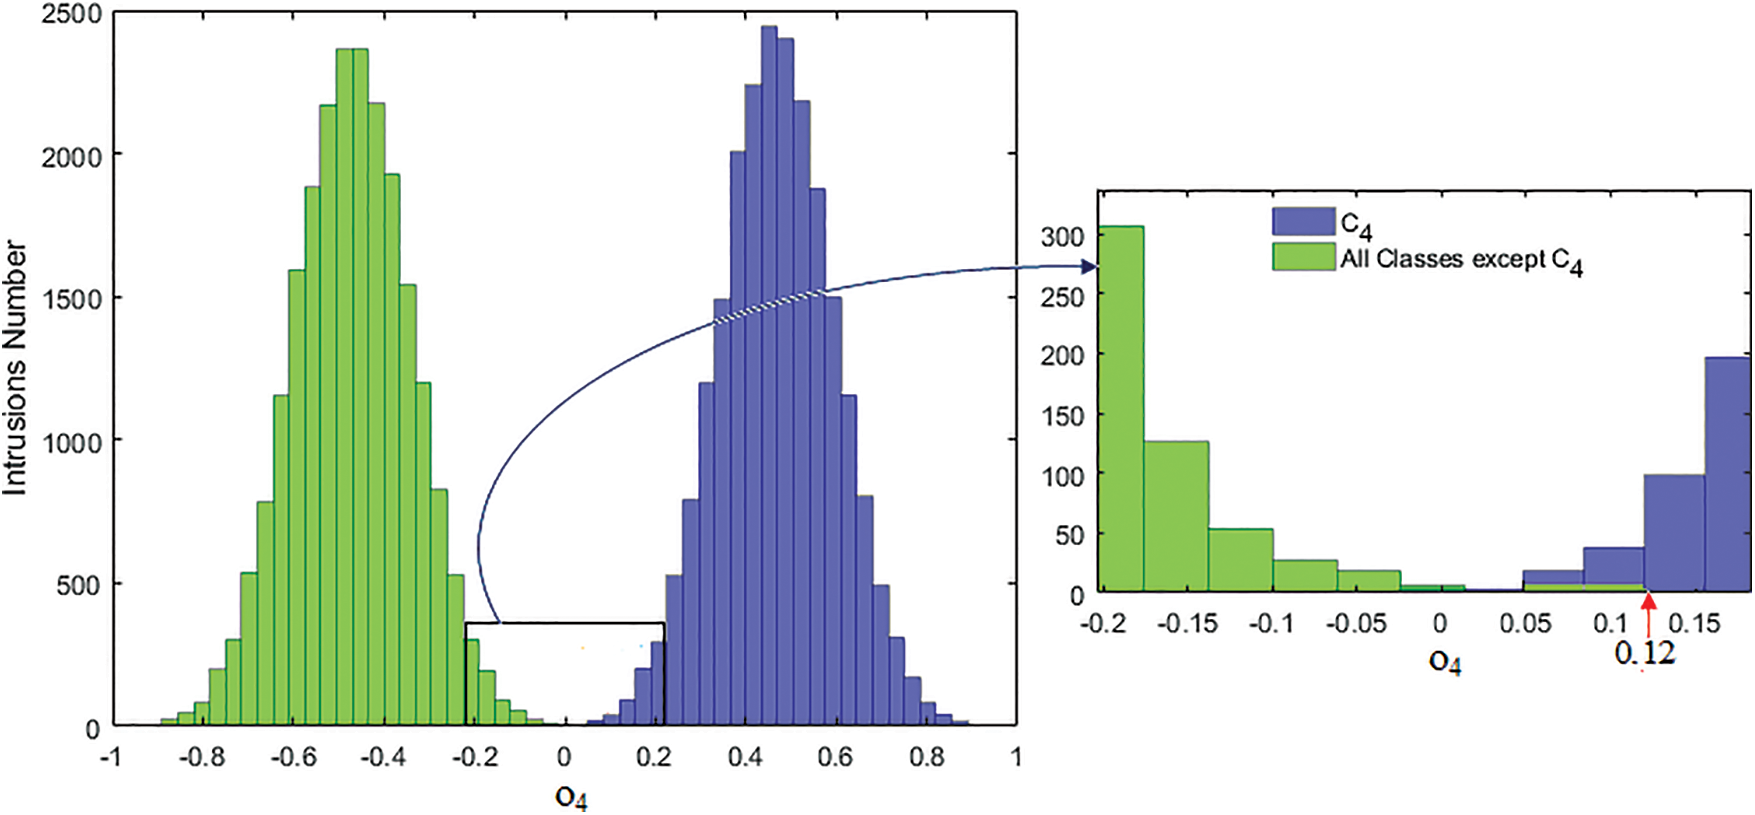
Figure 7: Distribution of intrusions with respect to the PSO-NN output o4 (by using 22400 C4-training instances and 22400 training instances belonging to All Ci, (i ≠ 4)
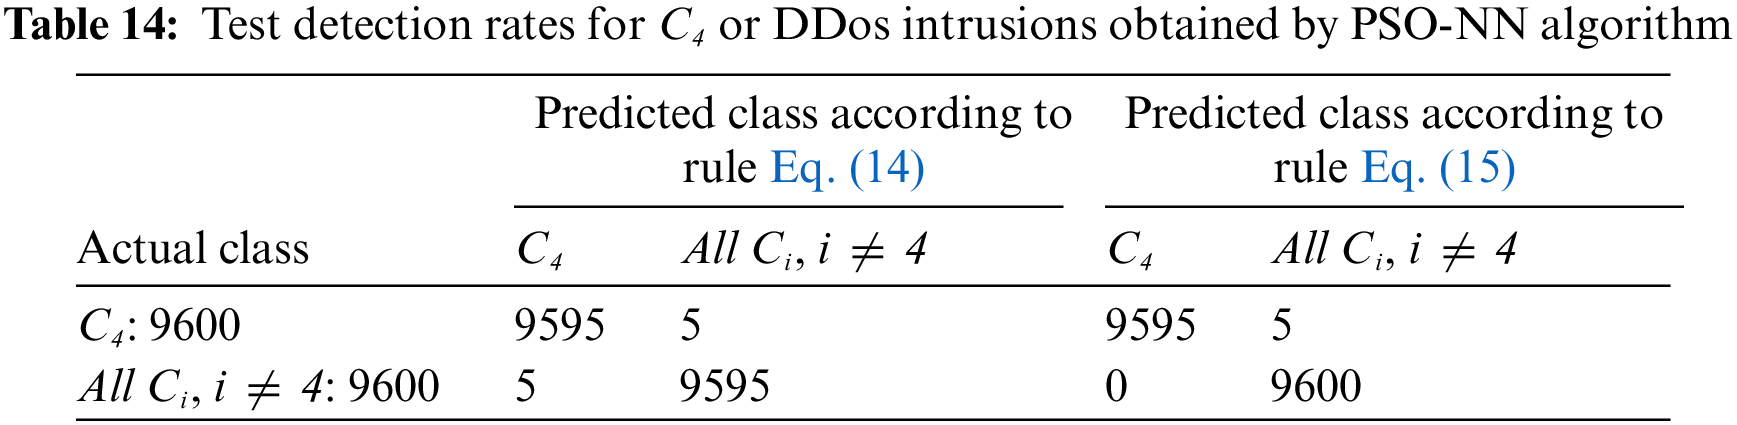
Thus by applying the rules (14 and 15) to 9600 test instances belonging to C4 (DDos class) and 9600 test instances randomly combining all other classes Ci, i ≠ 4 (all classes except DDos), detection rates were obtained as illustrated in Table 14. PSONN’s results for the 15 intrusion classes, provide a sensitivity of 99.95% for DDos-intrusions. The Sensitivity (or False detection) rates concerning the detection of DDos-intrusions thus go from 99.95% (or 0.05%) with the initial rule given in System 14 to 100% (or 0%) with the modified rule (System 15).
The same technique can be generalized for all PSO-NN outputs oi (i = 1, …, 15) to reduce, or even nullify the Ci False decision rates.
The evaluation of approaches based on PSO, GA and ALO on the CSE-CICIDS2018 and LUFlow2020 Datasets shows their efficiency. The results obtained with LUFlow2020 even exceed those obtained with CICIDS2018. This can be interpreted by the fact that in LUFFlow2020, the number of attack classes (equal to 2) allows PSO-NN algorithm to learn features better.
Regarding the comparison with the state-of-the-art works, Table 13 allows appreciating the efficiency of the proposed approach. The results obtained generally exceed those obtained in the recent works [9,54–69], and this is for the three datasets considered (CICIDS2017, CSE-CICIDS2018 and LUFlow2020).
The majority of the ML published methods are valid for a network-based IDS implementation. Existing datasets also provide a reference for the intrusions categories that may be encountered. Updating these datasets is more than imperative. Moreover, merging these datasets would be a great asset, at least those described by the same features. The interest in selecting the best features is well established. Today, a variety of features selection techniques exists, combining conventional and new approaches or introducing novel concepts [1,20,28–30,56,60]. This research axis is predestined for further development.
IDS is not a laboratory matter only since most techniques proven by research teams end up in products delivered by service providers and commercials.
Despite the abundance of publications in the field of IDS, the treatment of certain key points related to the deployment and real-time implementation of network-based IDS remains rare. Indeed, few documents address this issue [70–74].
For the deployment, several solutions exist and must be adapted to the network environment. For efficient use of IDS, the combination of both a network- and host-based IDS is recommended. A network-based IDS secures the network by monitoring all traffic on specific segments, while a host-based IDS is deployed on devices.
From a professional point of view, the problem of detection time by an IDS does not arise, given the panoply of existing information technology solutions, regardless of the size of intrusion packets. The plethora of commercial IDS solutions can analyze and record network data packets in real-time, as reported for several IDS deployment [70–74].
As indicated in Table 9, training an IDS algorithm consumes a lot of computation time because for NN optimization requirements, for example, the number of iterations, the size of the NN, the parameters of the metaheuristics must be appropriate to achieve the expected performance. For an architecture of (24, 40, 60, 40, 20, 30, 15), PSO-NN requires more than 645 s for its optimization (with 1000 iterations, population size equal to 100 and 495000 instances). Running an IDS, like the test operation, consumes very little time. For the same PSONN architecture, on average, more than 76500 intrusions can be processed per second.
For a 10 Gbps link, PSO-NN-based IDS will give near real-time results as it can be combined with threads. Threads and asynchronized calculation are essential to maintain all the traffic passed to PSONN, where detections are instant and do not need a powerful CPU or a large memory.
This paper aims to improve FCM- and NN-based Intrusion Detection performance on CICIDS2017 Dataset by using the seven most known metaheuristic algorithms. To achieve this objective, the proposed approach focused on the following major directions:
a) First of all, 25% used in this dataset have been cleaned and the attributes reduced to 24 features only, as a result of a combination of LDA performance parameter with t-statistic. The interest in the selected features has also been demonstrated through the results obtained.
b) New hybridizations of FCM and NN are suggested and applied for the first time in intrusion detection research.
c) To confirm the truthfulness of the proposed approach, several performance indices as accuracy, sensibility, and F1-score are exploited.
The unsupervised approach to detect intrusions via FCM, showed its validity, especially after hybridization with PSO, GA, and ALO. Through PSO-FCM, for example, the accuracy, global sensitivity, and F1 have reached the values of 91.87%, 91.48%, and 91.67%, respectively.
On the other hand, NNs and their metaheuristic-based hybridizations have greatly improved the detection of intrusions in the CICDS2017 Dataset. PSO-NN offered tested accuracy, sensitivity and F1-score of 99.97%, 99.95%, and 99.96%, respectively, improving hybrid FCM and other hybrid NN.
d) The best approaches based on PSO, GA, and ALO methods are reassessed using intrusion instances from CICDS2018 and LUFlow2020 Datasets. The results obtained further confirmed the correctness of the proposed approaches.
e) On the other hand, the comparison of the proposed approaches with the state-of-the-art works proved that PSO-NN outperforms some recently published results and this is for the three datasets considered.
Although the training of the IDS algorithms requires a long calculation time, the real-time processing of the attacks is instantaneous and does not generally require special hardware or additional memory.
Future studies should extend the work to the following key points:
i) Data mining: data may be reduced by assembling attack classes into similar groups or by merging several datasets, simplifying the analysis and further increasing performance rates. Moreover, a Dataset is better when it is described with a minimum of very relevant features. This can be achieved by sightseeing new tools.
ii) IDS design: other Artificial Intelligence-based methods, not yet sufficiently covered, can be combined or hybridized.
iii) In addition to improving the performance of IDS by ML methods, more interest should be given to the implementation and deployment aspects.
Funding Statement: The authors received no specific funding for this study.
Conflicts of Interest: The authors declare that they have no conflicts of interest to report regarding the present study.
References
1. Ullah, I., Mahmoud, Q. H. (2019). A two-level hybrid model for anomalous activity detection in IOT networks. Proceedings of the 16th IEEE Annual Consumer Communications Networking Conference (CCNC), pp. 1–6. Las Vegas, NV, USA. [Google Scholar]
2. Vijayanand, R., Devaraj, D., Kannapiran, B. (2018). Intrusion detection system for wireless mesh network using multiple support vector machine classifiers with genetic-algorithm-based feature selection. Computers & Security, 77(2), 304–314. https://doi.org/10.1016/j.cose.2018.04.010 [Google Scholar] [CrossRef]
3. Zhang, Y., Chen, X., Jin, L., Wang, X., Guo, D. (2019). Network intrusion detection: Based on deep hierarchical network and original flow data. IEEE Access, 7, 37004–37016. https://doi.org/10.1109/ACCESS.2019.2905041 [Google Scholar] [CrossRef]
4. Binbusayyis, A., Vaiyapuri, T. (2019). Identifying and benchmarking key features for cyber intrusion detection: An ensemble approach. IEEE Access, 7, 106495–106513. https://doi.org/10.1109/ACCESS.2019.2929487 [Google Scholar] [CrossRef]
5. Ahmim, A., Maglaras, L., Ferrag, M. A., Derdour, M., Janicke, H. (2018). A novel hierarchical intrusion detection system based on decision tree and rules-based models. arXiv:1812.09059v1. [Google Scholar]
6. Krishna, K. V., Swathi, K., Rao, B. B. (2020). A novel framework for NIDS through fast kNN classifier on CICIDS2017 Dataset. International Journal of Recent Technology and Engineering, 8(5), 3669–3675. [Google Scholar]
7. Alrowaily, M., Alenezi, F., Lu, Z. (2019). Effectiveness of machine learning based intrusion detection systems. Proceedings of the International Conference on Security, Privacy and Anonymity in Computation, Communication and Storage, pp. 277–288. Atlanta, GA, USA. [Google Scholar]
8. Zhang, H., Dai, S., Li, Y., Zhang, W. (2018). Real-time distributed random-forest-based network intrusion detection system using apache spark. Proceedings of the IEEE 37th International Performance Computing and Communications Conference (IPCCC), pp. 1–7. Orlando, FL, USA. [Google Scholar]
9. Yulianto, A., Sukarno, P., Suwastika, N. A. (2019). Improving AdaBoost-based intrusion detection system (IDS) performance on CICIDS2017 Dataset. Journal of Physics: Conference Series, 1192, 12–18. [Google Scholar]
10. Sharafaldin, I., Lashkari, A. H., Ghorbani, A. A. (2018). Toward generating a new intrusion detection Dataset and intrusion traffic characterization. Proceedings of the Fourth International Conference on Information Systems Security and Privacy, pp. 108–116. Funchal, Madeira, Portugal. [Google Scholar]
11. Aksu, D., Üstebay, S., Aydin, M. A., Atmaca, T. (2018). Intrusion detection with comparative analysis of supervised learning techniques and fisher score feature selection algorithm. Proceedings of the International Symposium on Computer and Information Sciences, pp. 141–149. Berlin, Germany, Springer. [Google Scholar]
12. Watson, G. (2018). A comparison of header and deep packet features when detecting network intrusions (Technical Report). University of Maryland: College Park, MD, USA. [Google Scholar]
13. Bansal, A. (2018). DDR scheme and LSTM RNN algorithm for building an efficient IDS (Master’s Thesis). Thapar Institute of Engineering and Technology, Punjab, India. [Google Scholar]
14. Abdulrahman, A. A., Ibrahem, M. K. (2018). Evaluation of DDoS attacks detection in a CICIDS2017 Dataset based on classification algorithms. Iraqi Journal of Information and Communication Technology, 1(3), 49–55. https://doi.org/10.31987/ijict.1.3.40 [Google Scholar] [CrossRef]
15. Niyaz, Q., Sun, W., Javaid, A. Y., Alam, M. (2016). A deep learning approach for network intrusion detection system. EAI Endorsed Transactions on Security and Safety, 3(9), 21–26. [Google Scholar]
16. Yin, C., Zhu, Y., Fei, J., He, X. (2017). A deep learning approach for intrusion detection using recurrent neural networks. IEEE Access, 5, 21954–21961. https://doi.org/10.1109/ACCESS.2017.2762418 [Google Scholar] [CrossRef]
17. Tang, C., Luktarhan, N., Zhao, Y. (2020). SAAE-DNN: Deep learning method on intrusion detection. Symmetry, 12(10), 1695. https://doi.org/10.3390/sym12101695 [Google Scholar] [CrossRef]
18. Kurniabudi, K., Stiawan, D., Darmawijoyo, D., Bin Idris, M. Y., Bamhdi, A. M. et al. (2020). CICIDS-2017 Dataset feature analysis with information gain for anomaly detection. IEEE Access, 8, 132911–132921. https://doi.org/10.1109/ACCESS.2020.3009843 [Google Scholar] [CrossRef]
19. Ferriyan, A., Thamrin, A. H., Takeda, K., Murai, J. (2017). Feature selection using genetic algorithm to improve classification in network intrusion detection system. Proceeding of the International Electronics Symposium on Knowledge Creation and Intelligent Computing, pp. 46–49. Surabaya, Indonesia. [Google Scholar]
20. Vasan, K. K., Surendiran, B. (2016). Dimensionality reduction using principal component analysis for network intrusion detection. Perspectives in Science, 8(1), 510–512. https://doi.org/10.1016/j.pisc.2016.05.010 [Google Scholar] [CrossRef]
21. Chabathula, K. J., Jaidhar, C. D., Kumara, M. A. A. (2015). Comparative study of principal component analysis based intrusion detection approach using machine learning algorithms. Proceedings of the 3rd International Conference on Signal Processing, Communication and Networking, pp. 1–6. Chennai, India. [Google Scholar]
22. Shapoorifard, H., Shamsinejad, P. (2017). Intrusion detection using a novel hybrid method incorporating an improved KNN. International Journal of Computer Applications, 173(1), 5–9. https://doi.org/10.5120/ijca2017914340 [Google Scholar] [CrossRef]
23. Ravale, U., Marathe, N., Padiya, P. (2015). Feature selection based hybrid anomaly intrusion detection system using K means and RBF kernel function. Procedia Computer Science, 45, 428–435. https://doi.org/10.1016/j.procs.2015.03.174 [Google Scholar] [CrossRef]
24. Lin, W. C., Ke, S. W., Tsai, C. F. (2015). CANN: An intrusion detection system based on combining cluster centers and nearest neighbors. Knowledge-Based Systems, 78(1), 13–21. https://doi.org/10.1016/j.knosys.2015.01.009 [Google Scholar] [CrossRef]
25. Chitrakar, R., Chuanhe, H. (2012). Anomaly detection using support vector machine classification with k-medoids clustering. Proceedings of the Third Asian Himalayas International Conference on Internet, pp. 1–5. Kathmundu, Nepal. [Google Scholar]
26. Ariafar, E., Kiani, R. (2018). Intrusion detection system using an optimized framework based on datamining techniques. Proceedings of the IEEE 4th International Conference in Knowledge-Based Engineering and Innovation KBEI, pp. 785–791. Teheran, Iran. [Google Scholar]
27. Peng, K., Leung, V. C. M., Huang, Q. (2018). Clustering approach based on mini batch K-means for intrusion detection system over big data. IEEE Access, 6, 11897–11906. https://doi.org/10.1109/ACCESS.2018.2810267 [Google Scholar] [CrossRef]
28. Thakkar, A., Lohiya, R. (2022). A survey on intrusion detection system: Feature selection, model, performance measures, application perspective, challenges, and future research directions. Artificial Intelligence Review, 55(1), 453–563. https://doi.org/10.1007/s10462-021-10037-9 [Google Scholar] [CrossRef]
29. Thakkar, A., Lohiya, R. (2023). Fusion of statistical importance for feature selection in deep neural network-based intrusion detection system. Information Fusion, 90(1), 353–363. https://doi.org/10.1016/j.inffus.2022.09.026 [Google Scholar] [CrossRef]
30. Thakkar, A., Lohiya, R. (2021). Analyzing fusion of regularization techniques in the deep learning-based intrusion detection system. International Journal of Intelligent Systems, 6(12), 7340–7388. https://doi.org/10.1002/int.22590 [Google Scholar] [CrossRef]
31. Kanimozhi, V., Jacob, T. P. (2019). Artificial intelligence based network intrusion detection with hyperparameter optimization tuning on the realistic cyber Dataset CSE-CIC-IDS2018 using cloud computing. Proceedings of the IEEE International Conference on Communication and Signal Processing (ICCSP’2019), pp. 33–36. Melmaruvathur, India. [Google Scholar]
32. Ferrag, M. A., Maglaras, L., Moschoyiannis, S., Janicke, H. (2020). Deep learning for cyber security intrusion detection: Approaches, datasets, and comparative study. Journal of Information Security and Applications, 50(1), 102419. https://doi.org/10.1016/j.jisa.2019.102419 [Google Scholar] [CrossRef]
33. Kilincer, I. F., Ertam, F., Sengur, A. (2021). Machine learning methods for cyber security intrusion detection: Datasets and comparative study. Computer Networks, 188, 107840. https://doi.org/10.1016/j.comnet.2021.107840 [Google Scholar] [CrossRef]
34. CICIDS2017 Dataset. https://www.unb.ca/cic/datasets/ids-2017.html [Google Scholar]
35. Pelletier, Z., Abualkibash, M. (2020). Evaluating the CICIDS-2017 Dataset using machine learning methods and creating multiple predictive models in the statistical computing language R. International Research Journal of Advanced Engineering and Science, 5(2), 187–191. [Google Scholar]
36. Panigrahi, R., Borah, S. (2018). A detailed analysis of CICIDS2017 Dataset for designing intrusion detection systems. International Journal of Engineering and Technology, 7, 479–482. [Google Scholar]
37. CSE-CIC-IDS2018 Dataset. https://www.unb.ca/cic/datasets/ids-2018.html [Google Scholar]
38. LUFlow2020 Dataset. https://www.kaggle.com/datasets/mryanm/luflow-network-intrusion-detection-data-set [Google Scholar]
39. Mjahed, M. (2005). Higgs search at LHC by neural networks. Nuclear Physics B, 140, 799–801. https://doi.org/10.1016/j.nuclphysbps.2004.11.263 [Google Scholar] [CrossRef]
40. Li, C., Wang, B. (2014). Fisher linear discriminant analysis, lectures notes. Boston: Northeastern University. [Google Scholar]
41. Praveen, P., Rama, B. (2017). A K-means clustering algorithm on numeric data. International Journal of Pure and Applied Mathematics, 117(7), 157–164. [Google Scholar]
42. Balasko, B., Abonyi, J., Feil, B. (2005). Fuzzy clustering and data analysis toolbox: For use with MATLAB. Math Works, pp. 1–74. Veszprem, Hungary. [Google Scholar]
43. Haykin, S. (2009). Neural networks and learning machines, 3rd edition. Upper Saddle River, New Jersey: Pearson Education, Inc. [Google Scholar]
44. Kennedy, J., Eberhart, R. C., Shi, Y. (2001). Swarm intelligence. San Francisco, CA: Morgan Kaufmann Publishers Inc. [Google Scholar]
45. Rini, P., Shamsuddin, M., Yuhaniz, S. (2011). Particle swarm optimization: Technique, system and challenges. International Journal of Computer Applications, 14(1), 19–27. https://doi.org/10.5120/1810-2331 [Google Scholar] [CrossRef]
46. Holland, J. H. (1975). Adaptation in natural and artificial systems. Ann Arbor: University of Michigan Press. [Google Scholar]
47. Price, K. V., Storn, R. M., Lampinen, J. A. (2005). Differential evolution: A practical approach to global optimization. Berlin: Springer. [Google Scholar]
48. Reynolds, R. (1994). An introduction to cultural algorithms. Proceedings of the Third Annual Conference on Evolutionary Programming, pp. 131–139. San Diego, California, USA. [Google Scholar]
49. Gao, X. Z., Govindasamy, V., Xu, H., Wang, X., Zenger, K. (2015). Harmony search method: Theory and applications. Computational Intelligence and Neuroscience, 2(2), 1–10. https://doi.org/10.1155/2015/258491 [Google Scholar] [PubMed] [CrossRef]
50. Hatamlou, A. (2013). Black hole: A new heuristic optimization approach for data clustering. Information Sciences, 222, 175–184. https://doi.org/10.1016/j.ins.2012.08.023 [Google Scholar] [CrossRef]
51. Mirjalili, S. (2015). The ant lion optimizer. Advances in Engineering Software, 83, 80–98. https://doi.org/10.1016/j.advengsoft.2015.01.010 [Google Scholar] [CrossRef]
52. Zhou, N., Wang, L. (2007). A modified T-test feature selection method and its application on the hap map genotype data. Genomics, Proteomics & Bioinformatics, 5(3–4), 242–249. https://doi.org/10.1016/S1672-0229(08)60011-X [Google Scholar] [PubMed] [CrossRef]
53. Bholowalia, P., Kumar, A. (2014). EBK-means: A clustering technique based on elbow method and K-means in WSN. International Journal of Computer Applications, 105(9), 17–24. [Google Scholar]
54. Abdulhammed, R., Musafer, H., Alessa, A., Faezipour, M., Abuzneid, A. (2019). Features dimensionality reduction approaches for machine learning based network intrusion detection. Electronics, 8(3), 322. https://doi.org/10.3390/electronics8030322 [Google Scholar] [CrossRef]
55. Huang, S., Lei, K. (2020). IGAN-IDS: An imbalanced generative adversarial network towards intrusion detection system in ad-hoc networks. Ad Hoc Networks, 105(6), 102177. https://doi.org/10.1016/j.adhoc.2020.102177 [Google Scholar] [CrossRef]
56. Hosseini, S., Seilani, H. (2021). Anomaly process detection using negative selection algorithm and classification techniques. Evolving Systems, 12(3), 769–778. https://doi.org/10.1007/s12530-019-09317-1 [Google Scholar] [CrossRef]
57. Bindra, N., Sood, M. (2019). Detecting DDoS attacks using machine learning techniques and contemporary intrusion detection dataset. Automatic Control and Computer Science, 53(5), 419–428. https://doi.org/10.3103/S0146411619050043 [Google Scholar] [CrossRef]
58. Lee, J., Kim, J., Kim, I., Han, K. (2019). Cyber threat detection based on artificial neural networks using event profiles. IEEE Access, 7, 165607–165626. https://doi.org/10.1109/ACCESS.2019.2953095 [Google Scholar] [CrossRef]
59. Kurniabudi, K., Stiawan, D., Darmawijoyo, D., Bin Idris, M. Y., Kerime, B. et al. (2021). Important features of CICIDS-2017 Dataset for anomaly detection in high dimension and imbalanced class dataset. Indonesian Journal of Electrical Engineering and Informatics, 9(2), 498–511. https://doi.org/10.52549/ijeei.v9i2.3028 [Google Scholar] [CrossRef]
60. Zhang, Y., Zhang, H., Zhang, B. (2022). An effective ensemble automatic feature selection method for network intrusion detection. Information, 13(7), 314. https://doi.org/10.3390/info13070314 [Google Scholar] [CrossRef]
61. Rosay, A., Cheval, E., Carlier, F., Leroux, P. (2022). Network intrusion detection: A comprehensive analysis of CIC-IDS2017. Proceedings of the 8th International Conference on Information Systems Security and Privacy (ICISSP 2022), pp. 25–36. Vienna, Austria. [Google Scholar]
62. Wei, P., Li, Y., Zhang, Z., Hu, T., Li, Z. et al. (2019). An optimization method for intrusion detection classification model based on deep belief network. IEEE Access, 7, 87593–87605. https://doi.org/10.1109/ACCESS.2019.2925828 [Google Scholar] [CrossRef]
63. Farhan, R. I., Abeer, T. M., Nidaa, F. H. (2020). Optimized deep learning with binary PSO for intrusion detection on CSE-CIC-IDS2018 Dataset. Journal of Al Qadisiyah for Computer Science and Mathematics, 12(3), 16–27. [Google Scholar]
64. Farhan, R. I., Abeer, T. M., Nidaa, F. H. (2020). Performance analysis of flow-based attacks detection on CSE-CIC-IDS2018 Dataset using deep learning. Indonesian Journal of Electrical Enginering and Computer Science, 20(3), 16–27. https://doi.org/10.11591/ijeecs.v20.i3.pp1413-1418 [Google Scholar] [CrossRef]
65. Lin, P., Ye, K., Xu, C. Z. (2019). Dynamic network anomaly detection system by using deep learning techniques. In: Lecture notes in computer science, pp. 161–176. Switzerland: Springer Science and Business. [Google Scholar]
66. Zhou, Q., Pezaros, D. (2019). Evaluation of machine learning classifiers for zero-day intrusion detection—an analysis on CIC-AWS-2018 Dataset. arXiv:1905.03685v1. [Google Scholar]
67. Kim, J., Shin, Y., Choi, E. (2019). An intrusion detection model based on a convolutional neural network. Journal of Multimedia Information System, 6(4), 165–172. https://doi.org/10.33851/JMIS.2019.6.4.165 [Google Scholar] [CrossRef]
68. Khan, M. A. (2021). HCRNNIDS: Hybrid convolutional recurrent neural network-based network intrusion detection system. Processes, 9(5), 834. https://doi.org/10.3390/pr9050834 [Google Scholar] [CrossRef]
69. Chua, T. H., Salam, I. (2022). Evaluation of machine learning algorithms in network-based intrusion detection system. arXiv:2203.05232. [Google Scholar]
70. Yuwono, D. T. (2022). Analysis performance intrusion detection system in detecting cyber-attack on apache web server. IT Journal Research and Development, 6(2), 169–178. https://doi.org/10.25299/itjrd.2022.7853 [Google Scholar] [CrossRef]
71. Ujjan, R. M. A., Pervez, Z., Dahal, K. (2020). Snort based collaborative intrusion detection system using blockchain in SDN. Proceedings of the 13th IEEE International Conference on Software, Knowledge, Information Management and Applications (SKIMA), pp. 1–7. Island of Ulkulhas, Maldives. [Google Scholar]
72. Jaw, E., Wang, X. (2022). A novel hybrid-based approach of snort automatic rule generator and security event correlation (SARG-SEC). Peer Journal of Computer Science, 8(1), 1–37. https://doi.org/10.7717/peerj-cs.900 [Google Scholar] [PubMed] [CrossRef]
73. Saputra, F. A., Salman, M., Hasim, J. A. N., Nadhori, I. U., Ramli, K. (2022). The next-generation NIDS platform: Cloud-based snort NIDS using containers and big data. Big Data Cognitive Computing, 6(19), 1–15. https://doi.org/10.3390/bdcc6010019 [Google Scholar] [CrossRef]
74. Gupta, A., Sharma, L. S. (2020). Performance analysis and comparison of snort on various platforms. International Journal of Computer Information Systems and Industrial Management Applications, 10, 23–32. [Google Scholar]
Cite This Article
 Copyright © 2023 The Author(s). Published by Tech Science Press.
This work is licensed under a Creative Commons Attribution 4.0 International License , which permits unrestricted use, distribution, and reproduction in any medium, provided the original work is properly cited.
 Downloads
 Citation Tools