
 Submit a Paper
 Propose a Special lssue
 Open Access
ARTICLE

Assessment of Dependent Performance Shaping Factors in SPAR-H Based on Pearson Correlation Coefficient
1 School of Automation Engineering, Shanghai University of Electric Power, Shanghai 200090, China
2 State Key Laboratory of Nuclear Power Safety Monitoring Technology and Equipment, Shenzhen, 518172, China
* Corresponding Author: Xiaoyan Su. Email:
(This article belongs to the Special Issue: Computer-Aided Uncertainty Modeling and Reliability Evaluation for Complex Engineering Structures)
Computer Modeling in Engineering & Sciences 2024, 138(2), 1813-1826. https://doi.org/10.32604/cmes.2023.030957
Received 06 March 2023; Accepted 20 June 2023; Issue published 17 November 2023
 View Full Text
 Download PDF
Abstract
With the improvement of equipment reliability, human factors have become the most uncertain part in the system. The standardized Plant Analysis of Risk-Human Reliability Analysis (SPAR-H) method is a reliable method in the field of human reliability analysis (HRA) to evaluate human reliability and assess risk in large complex systems. However, the classical SPAR-H method does not consider the dependencies among performance shaping factors (PSFs), which may cause overestimation or underestimation of the risk of the actual situation. To address this issue, this paper proposes a new method to deal with the dependencies among PSFs in SPAR-H based on the Pearson correlation coefficient. First, the dependence between every two PSFs is measured by the Pearson correlation coefficient. Second, the weights of the PSFs are obtained by considering the total dependence degree. Finally, PSFs’ multipliers are modified based on the weights of corresponding PSFs, and then used in the calculating of human error probability (HEP). A case study is used to illustrate the procedure and effectiveness of the proposed method.Graphic Abstract
Keywords
Reliability assessment is the process of evaluating the reliability of a system, product, or process to ensure that it performs its intended function consistently and without failure. It involves identifying potential sources of failure, estimating the likelihood and consequences of failure, and developing strategies to mitigate or manage the risks associated with failure. Reliability assessment can be applied to various areas, such as engineering design [1–3], information security [4–6], power industry [7–9], and social science [10–12].
The foundation of risk and reliability evaluation is the modeling of uncertain information. How to handle uncertainty has attracted much attention. Many methods have been proposed, such as evidence theory [13–15], fuzzy sets, and random permutation set [16], which are applied in various fields, like pattern classification [17,18], decision making [19,20] and information fusion [21]. Among these, probabilistic safety assessment (PSA) is a specific type of reliability assessment method that is focused on evaluating the safety and risk associated with complex systems, such as nuclear power plants, space agencies, or other high-risk industrial facilities.
Human reliability analysis (HRA) has become an important part of PSA [22], and plays an important role in avoiding human error and improving system reliability. Human error is an important factor to be considered in the design and risk assessment of large complex systems [23]. HRA has gained widespread attention. To quantify the impact of human error on the system and reduce human error probability (HEP), various methods have been proposed [24–26].
One method is the Standardized Plant Analysis Risk-Human Reliability Analysis (SPAR-H), introduced by Gertman et al. in 2005 [27] to solve the problem of risk assessment and human performance evaluation in nuclear power plants. SPAR-H provides a specific method to evaluate HEP. It categorizes human error events into two categories: diagnosis and action, based on professionals’ sorting and mechanism analysis of event reports.
Since HEP varies greatly in different situations, such as task complexity and operator pressure levels, SPAR-H suggests eight performance shaping factors (PSFs) that influencing human performance to be considered in the evaluation of HEP. The eight PSFs are available time, stress/stressors, complexity, experience/training, procedures, Ergonomics/Human-System Interface (HSI), fitness for duty, and work process. By evaluating the levels of these PSFs, the basic HEP is modified. The final HEP is the sum of the diagnosis and action error probabilities. As the SPAR-H method is effective and easy to understand and calculate [28], it has been widely used in various fields such as the petroleum industry [29,30], nuclear power plant risk analysis [31–33], chemical industry [34], occupational risk [35] and maritime accidents [36,37].
However, the classical SPAR-H method does not take into account the dependence among PSFs when calculating HEP. This kind of dependence is universal in practical engineering, and failing to consider it can significantly affect the results. For instance, the current task is highly complex, which is bound to impose a heavy psychological burden on the operator and increases the multiplier factor of “stress/stressors”. As a result, the HEP repeatedly calculates the negative effect, causing the calculated result to be higher than the actual situation. Moreover, if there are multiple groups of dependence or deep dependence degrees, the excessively repeated calculation can lead to a significant difference between the final HEP result and the actual situation. Therefore, analyzing and addressing dependence problems is crucial for enhancing the rationality and accuracy of SPAR-H results.
In recent years, more and more researches have been conducted to deal with the dependencies among PSFs in HRA [38–41]. For the SPAR-H method, there has been also increasing attention given to identifying and quantifying dependence among PSFs. Laumann et al. [42] identified limitations in the definitions of SPAR-H PSFs and levels, and thus proposed new definitions to increase the resolution and nuance of the PSFs. Liu et al. [43] investigated the dependence between every two PSFs and its corresponding psychological mechanism that triggers human errors, and improved the design of PSF multipliers in SPAR-H. However, the PSF multiplier design needs to rely on expert opinions, which are subjective. Liu et al. [44] studied the highly complex dependencies among PSFs in both qualitative and quantitative ways, providing valuable insights for future dynamic HRA research. Nevertheless, due to the lack of available data and the complexity involved in quantifying HEPs based on PSFs, the modeling curves may be imprecise. Xu et al. [45] used the DEMATEL method to identify the dependence among PSFs, and proved that it effectively reduced the repeated calculation of the related part of PSFs through additional cases, and the result was more reasonable. However, DEMATEL’s input data is generated by expert opinions, which is subjective to some extent. Liu et al. [46] extracted and integrated data from 219 nuclear power plant operation event reports, and used Grey theory-based data mining-Apriori algorithm, Exploratory factor analysis, and Pearson correlation analysis to analyze the dependence among eight PSFs, and obtained relatively consistent conclusions. Among these methods, Pearson correlation analysis, as a mathematical model to measure the linear dependence between two variables, can clearly represent the dependence between two PSFs in numerical form, which provides strong data support for the analysis of dependence among PSFs. However, no subsequent processing of the dependence in calculating HEP was provided in Liu et al.’s method.
In this paper, we propose a new method to deal with the dependencies among PSFs in SPAR-H based on the Pearson correlation coefficient. Firstly, we calculate the relative weight of each PSF by determining its comprehensive independence degree using the Pearson correlation coefficient based on Liu et al.’s method [46]. Secondly, the PSF multipliers are modified by discounting them based on the relative weights of corresponding PSFs. Finally, the classical SPAR-H formula is used to obtain the final HEP. The proposed method can effectively handle the dependencies among PSFs, reduce the repeated calculation of related parts during the process of SPAR-H, and generate more reasonable results.
This paper is organized as follows: Section 2 introduces the basic theoretical knowledge of SPAR-H and Pearson correlation analysis. Section 3 illustrates the procedure of the proposed approach. Section 4 presents a basic case study and an additional cases to prove the method’s effectiveness. Finally, Section 5 summarizes the paper.
2.1 SPAR-H [27]
The SPAR-H method presents several advantages, including high reliability and easy-to-use [47]. Specifically, SPAR-H offers a systematic approach for evaluating HEP as follows.
Human failure events are sorted out and analyzed under low power and shutdown conditions in nuclear power plant. Different multipliers are assigned to each PSF according to the influence of different PSF levels on the HEP, as is shown in Table 1 (source from Table 1 of [45]). When the PSF multiplier shows P (failure) = 1.0, it indicates that the PSF at this time poses a severe threat to the security of the system, and it will undoubtedly lead to system failure with a human error probability of 1. During the diagnosis and action sections, the analysts determine the levels for each PSF by evaluating event reports based on Table 1. If the evaluation opinion of PSF is at the nominal level, the corresponding PSF multiplier is 1. When the evaluation opinion of PSF is negative, i.e., the current PSF has an adverse impact on the system, the multiplier of PSF is greater than 1, and the more negative the impact, the greater the multiplier. On the contrary, when the evaluation opinion of PSF is at the positive level, the PSF multiplier is less than 1, and the greater the positive impact, the smaller the PSF multiplier.

After receiving evaluation opinions from the analysts during the diagnosis and action sections on the eight PSFs, the HEP is calculated using the following equation:
where NHEP (nominal HEP) is the basic error probability of each event. NHEP = 0.01 for diagnosis and NHEP = 0.001 for action.
When there are too many negative levels (more than or equal to 3), the HEP needs to be modified as follows:
Through the calculation of Eqs.(1) or (2), the
2.2 Pearson Correlation Analysis [48]
Pearson correlation coefficient is a mathematical model based on statistical measures of the linear dependence between two sample variables X and Y of the same length and n sample size. Its correlation coefficient consists of the covariance and standard deviation of the estimated sample:
where,
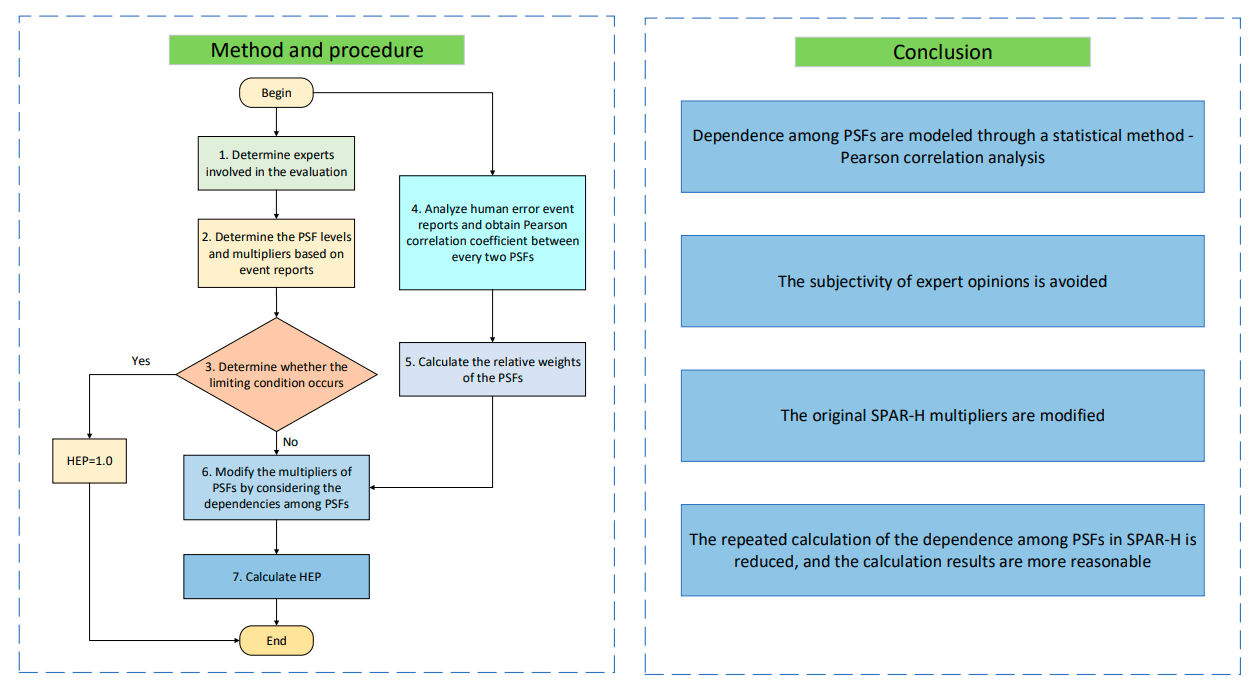
In this study, a flow chart for dependence processing in the SPAR-H method is presented as shown in Fig. 1. The detailed steps are as follows:

Figure 1: Flow chart of the proposed method
Step 1. Determine experts involved in the evaluation
It is essential that we enlist the help of individuals with the necessary skills and knowledge to conduct the evaluation. These experts must possess a deep understanding of nuclear power plants and their operations, as well as an extensive background in conducting evaluations. Their expertise will contribute to the assessment process, ensuring a comprehensive and accurate evaluation of nuclear power plants.
Step 2. Determine the PSF levels and multipliers based on event reports
The assessment involved experts who utilized their expertise and experience to analyze the event reports, and based on their analysis, determined the PSF levels and multipliers as outlined in Table 1.
Step 3. Determine whether the limiting condition occurs
Table 1 reveals that if the level of PSF “available time” is categorized as “inadequate” or the level of PSF “fitness for duty” is classified as “unfit”, then the HEP score is directly assigned a value of 1, and the process comes to an end. However, if neither of these limiting conditions is met, the process continues with the subsequent steps.
Step 4. Analyze human error event reports and obtain Pearson correlation coefficient between every two PSFs
The method of handling event reports in [46] can be adopted in this step to obtain the Pearson correlation coefficient between every two PSFs. Firstly, we need to sift through all the published event reports, analyze and summarize the direct and root causes of each event, and then isolate the reports where the failure source is attributed to human error. Once we have a refined sample data set, we can calculate the Pearson correlation coefficient between every pair of PSFs using Eq. (4). More details can be found in [46].
Step 5. Calculate the relative weights of the PSFs
Suppose that the set composed of the 8 PSFs is
where
The total independence degree
The total independence degree
Step 6. Modify the multipliers of PSFs by considering the dependencies among PSFs
Assuming that a certain PSF
where
Step 7. Calculate HEP
The modified PSF multiplier
In this section, the HRA worksheet of the event “Failure to Recover RHR” in “Loss of Inventory with RCS Pressurized” for low power and shut down (LP/SD) [27] is used to demonstrate the procedures of the proposed method.
The event “Failure to Recover RHR” in “Loss of Inventory with RCS Pressurized” refers to a scenario in a nuclear power plant where the Reactor Coolant System (RCS) loses coolant inventory and becomes pressurized. In this scenario, the High-Pressure Safety Injection (HPSI) and Low-Pressure Safety Injection (LPSI) systems are activated to recover the RCS inventory and restore system pressure. However, in the event of a “Failure to Recover RHR,” the plant’s emergency response systems are unable to recover the RCS inventory or restore system pressure to normal levels. This can lead to a potential loss of coolant accident (LOCA) and a breach of the fuel cladding, which can release radioactive materials into the surrounding environment. The consequences of a “Failure to Recover RHR” event can be severe and may include damage to the reactor core, release of radioactive material, and potential harm to personnel and the environment. Therefore, it is critical that nuclear power plant operators have robust emergency response procedures and systems in place to prevent and mitigate such events.
4.1 Application Process of the Proposed Method
Step 1. Determine experts involved in the evaluation
The experts have been chosen for their professional experience and knowledge in the field of HRA, particularly in nuclear power plants. Note that the study does not involve any concrete implementation of this step, the data source is based on the opinions of experts from [27], which is sufficient for demonstrating the use of the proposed method.
Step 2. Determine the PSF levels and multipliers based on event reports
According to Appendix D, page 156, in [27], the PSF levels and multipliers of the “Recovery RHR” event report for diagnosis and action part are shown in Table 2.

Step 3. Determine whether the limiting condition occurs
No limiting conditions occur in this case.
Step 4. Analyze human error event reports and obtain Pearson correlation coefficient between every two PSFs
Liu [46] counted 219 event reports at China’s nuclear power plants from 2007 to 2017, out of which 89 reports were related to human errors. Based on these reports, correlation coefficients between every pair of PSFs can be obtained. In this paper, we use the correlation coefficient table shown in Table 3 (source from [46]) as the data source for calculating the relative weights.

Step 5. Calculate the relative weights of the PSFs
Based on Table 3, the dependence degree

Step 6. Modify the multipliers of PSFs by considering the dependencies among PSFs
Based on Eq. (9), the modified multipliers of PSFs can be obtained as shown in Table 5.
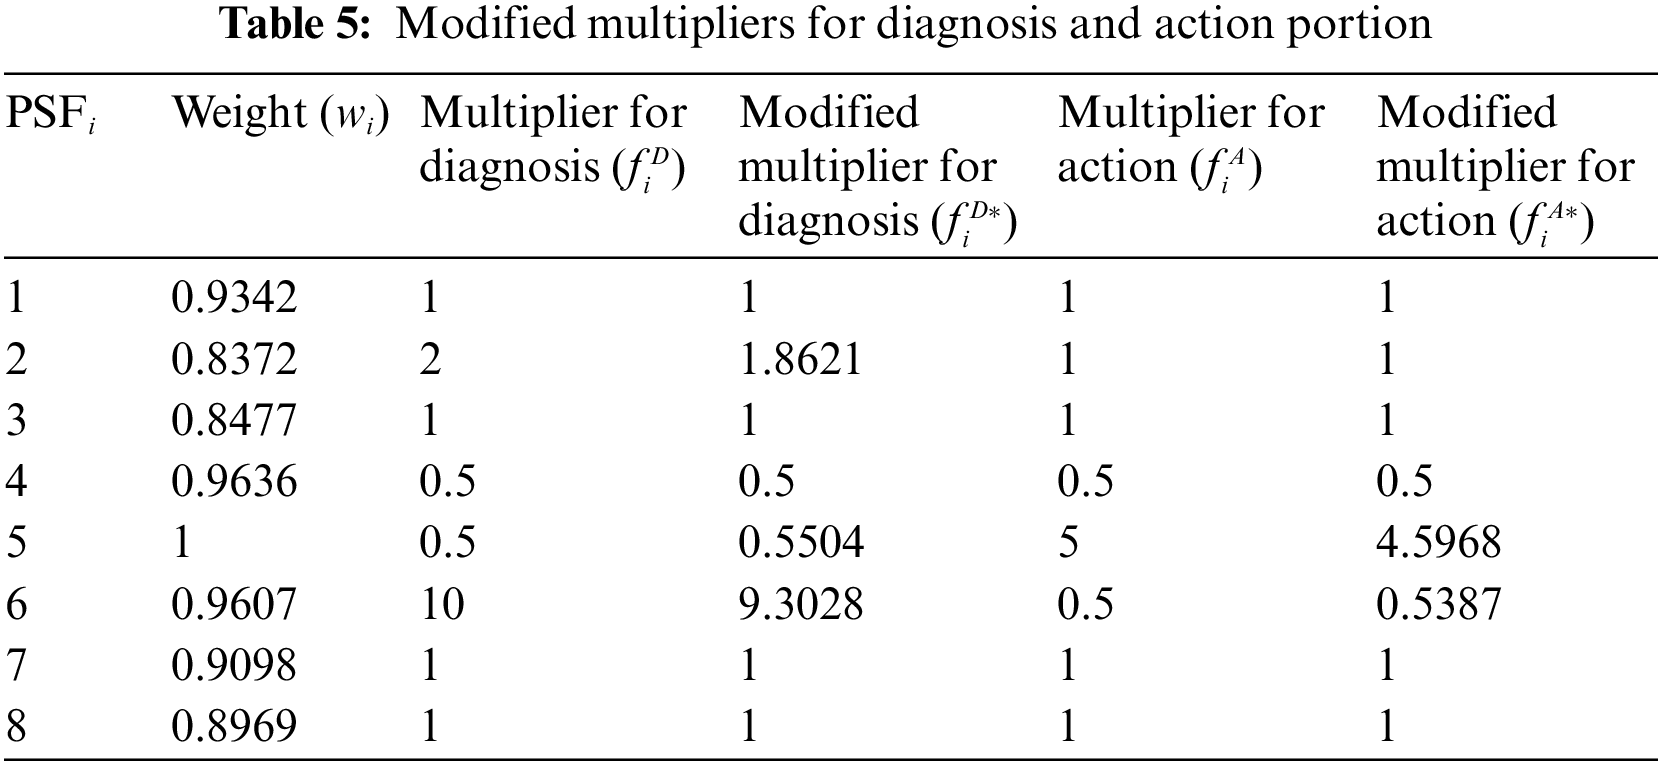
Step 7. Calculate HEP
According to Eq. (1), the HEP for the diagnostic part is 0.04592, the HEP for the action part is 0.00135, and the final HEP is 0.04726, while the final HEP calculated in [27] is 0.05125. The reason for the difference is that the proposed method considers the dependence among PSFs and modifies the PSF multipliers.
The PSFs weights calculated by the proposed method are compared with those calculated by Xu et al. [45]. Table 6 shows the weight ranking of PSFs for the two methods and the difference in ranking. As can be seen from Table 6, the ranking of PSFs by the two methods is consistent in general, the top three PSFs of the two methods are similar, and two PSFs “Complexity” and “Fitness for duty” have the same ranking. In addition, the HEP calculated by Xu is 0.04891, and the HEP calculated by the method in this paper is 0.04726, which is very close. There are also some different results derived from these two methods. For example, the variance of weight calculated by the two methods is different. Xu’s is 0.0119, while this paper’s is 0.0029. Based on the above data analysis, some possible explanations are as follows.

The two methods differ in variance for the following reasons. For the elements in DEMATEL’s input matrix in Xu’s method [45], the influence of X on Y is different from that of Y on X, that is, DEMATEL is directional when expressing the dependence of alternative schemes, while Pearson correlation analysis, as a statistical method, has the same correlation coefficient no matter the influence of X on Y or the influence of Y on X. That is, the relevance of alternatives is expressed without regard to directivity.
The ranking of PSFs of the two methods is consistent in general, but some local differences exist. The reasons for the difference can be concluded as follows. One possible explanation for this discrepancy is that the data sources are different. Xu’s method [45] relied on expert opinions as input data for the DEMATEL analysis. Specifically, he constructed a comparison scale using discontinuous integers ranging from 0 to 9 and mapped different numbers to corresponding semantic labels. As a result, distinct boundaries existed among different dependencies. In contrast, the method presented in this paper employs statistical methods. Firstly, human error event reports of nuclear power plants are counted, and the results of Pearson correlation analysis are used as data sources. The dependence between every two PSFs can be expressed by any number between 0 and 1, thereby blurring the boundary between different dependence levels. The second possible explanation is that Pearson correlation analysis is a way to measure the linear dependence between two variables, while the actual dependence among PSFs is not necessarily linear. This suggests that relying solely on Pearson correlation analysis may not capture the true nature of the dependence among PSFs.
In dealing with the dependence among PSFs, DEMATEL is a qualitative analysis method which requires evaluations from domain experts, and Pearson correlation analysis is a quantitative analysis method which is preferred when enough event reports (data) is available. The appropriate method should be chosen according to the specific situation.
In this paper, statistical methods were used to conduct a quantitative analysis of the dependence among PSFs. The Pearson correlation analysis is used to model the dependence among PSFs, and Pearson correlation coefficient between two PSFs is used as input data instead of expert opinions, thus eliminating subjectivity. Considering the relative weight of PSFs and using the discount equation to discount the original multipliers of PSFs of classical SPAR-H, the calculation results are more reasonable. The results of the proposed method are generally consistent with Xu’s method, which shows the effectiveness of the proposed method. Considering the limitations of the Pearson correlation analysis, further study of more appropriate statistical methods should be investigated in the future.
Acknowledgement: The author greatly appreciates the editor’s encouragement and the anonymous reviewers’ suggestions to improve our paper.
Funding Statement: The work is partially supported by Shanghai Rising-Star Program (Grant No. 21QA1403400), Shanghai Sailing Program (Grant No. 20YF1414800), Shanghai Key Laboratory of Power Station Automation Technology (Grant No. 13DZ2273800).
Author Contributions: The authors confirm contribution to the paper as follows: study conception and design: Xiaoyan Su; data collection: Shuwen Shang; analysis and interpretation of results: Xiaoyan Su, Hong Qian; draft manuscript preparation: Shuwen Shang, Xiaolei Pan. All authors reviewed the results and approved the final version of the manuscript.
Availability of Data and Materials: The data used in this study are from [27,45,46], and the data cited are all stated in the paper. There is no unavailable data cannot be released in this paper.
Conflicts of Interest: The authors declare that they have no conflicts of interest to report regarding the present study.
References
1. Liu, H., Li, S., Huang, X. (2023). Adaptive surrogate model coupled with stochastic configuration network strategies for time-dependent reliability assessment. Probabilistic Engineering Mechanics, 71, 103406. [Google Scholar]
2. Meng, D., Yang, S., He, C., Wang, H., Lv, Z. et al. (2022). Multidisciplinary design optimization of engineering systems under uncertainty: A review. International Journal of Structural Integrity, 13(4),565–593. [Google Scholar]
3. Meng, D., Li, Y., He, C., Guo, J., Lv, Z. et al. (2021). Multidisciplinary design for structural integrity using a collaborative optimization method based on adaptive surrogate modelling. Materials & Design, 206, 109789. [Google Scholar]
4. Chen, X., Deng, Y. (2022). An evidential software risk evaluation model. Mathematics, 10(13), 2325. https://doi.org/10.3390/math10132325 [Google Scholar] [CrossRef]
5. Palko, D., Babenko, T., Bigdan, A., Kiktev, N., Hutsol, T. et al. (2023). Cyber security risk modeling in distributed information systems. Applied Sciences, 13(4), 2393. [Google Scholar]
6. Song, M., Li, H., Sun, C., Cai, D., Hong, S. (2022). DLSA: Semi-supervised partial label learning via dependence-maximized label set assignment. Information Sciences, 609, 1169–1180. [Google Scholar]
7. Wang, H., Fang, Y. P., Zio, E. (2022). Resilience-oriented optimal post-disruption reconfiguration for coupled traffic-power systems. Reliability Engineering & System Safety, 222, 108408. [Google Scholar]
8. Meng, D., Yang, S., de Jesus, A. M., Zhu, S. P. (2023). A novel kriging-model-assisted reliability-based multidisciplinary design optimization strategy and its application in the offshore wind turbine tower. Renewable Energy, 203, 407–420. [Google Scholar]
9. Meng, D., Yang, S., de Jesus, A. M., Fazeres-Ferradosa, T., Zhu, S. (2023). A novel hybrid adaptive kriging and water cycle algorithm for uncertainty-based design and optimization strategy: Application in offshore wind turbine monopile. Computer Methods in Applied Mechanics and Engineering, 412(6), 116083. [Google Scholar]
10. Pollen, T. R., Ebaugh, D., Mohring, J., Hutchinson, D., Silfies, S. P. (2022). Is real-time poolside assessment of upper limb errors in front crawl swimming technique reliable and equivalent to video analysis? Journal of Sport Rehabilitation, 1, 1–7. [Google Scholar]
11. Wang, Y., Wang, J., Huang, M., Wang, M. (2022). An evidence combination rule based on new weight assignment scheme. Soft computing, 26, 7123–7137. [Google Scholar]
12. Che, Y., Deng, Y., Yuan, Y. H. (2022). Maximum-entropy-based decision-making trial and evaluation laboratory and its application in emergency management. Journal of Organizational and End User Computing, 34(7), 1–16. [Google Scholar]
13. Xiao, F. (2023). Generalized quantum evidence theory. Applied Intelligence, 53(11), 14329–14344.https://doi.org/10.1007/s10489–022–04181–0 [Google Scholar] [CrossRef]
14. Xiao, F. (2022). CEQD: A complex mass function to predict interference effects. IEEE Transactions on Cybernetics, 52(8), 7402–7414 [Google Scholar] [PubMed]
15. Deng, Y. (2020). Uncertainty measure in evidence theory. Science China Information Sciences, 63(11), 210201. [Google Scholar]
16. Deng, Y. (2022). Random permutation set. International Journal of Computers Communications & Control, 17(1), 4542. [Google Scholar]
17. Xiao, F., Cao, Z., Lin, C. T. (2022). A complex weighted discounting multisource information fusion with its application in pattern classification. IEEE Transactions on Knowledge and Data Engineering, 6, 1–16. [Google Scholar]
18. Xiao, F., Pedrycz, W. (2023). Negation of the quantum mass function for multisource quantum information fusion with its application to pattern classification. IEEE Transactions on Pattern Analysis and Machine Intelligence, 45(2), 2054–2070 [Google Scholar] [PubMed]
19. Xiao, F., Wen, J., Pedrycz, W. (2022). Generalized divergence-based decision making method with an application to pattern classification. IEEE Transactions on Knowledge and Data Engineering, 6, 6941–6956. https://doi.org/10.1109/TKDE.2022.3177896 [Google Scholar] [CrossRef]
20. Xiao, F., Cao, Z., Jolfaei, A. (2020). A novel conflict measurement in decision making and its application in fault diagnosis. IEEE Transactions on Fuzzy Systems, 29(1), 186–197. https://doi.org/10.1109/TFUZZ.2020.3002431 [Google Scholar] [CrossRef]
21. Xiao, F. (2022). GEJS: A generalized evidential divergence measure for multisource information fusion. IEEE Transactions on Systems, Man, and Cybernetics: Systems, 53(4), 2246–2258. https://doi.org/10.1109/TSMC.2022.3211498 [Google Scholar] [CrossRef]
22. Zio, E. (2014). Integrated deterministic and probabilistic safety assessment: Concepts, challenges, research directions. Nuclear Engineering and Design, 280, 413–419. [Google Scholar]
23. Su, X., Mahadevan, S., Xu, P., Deng, Y. (2015). Dependence assessment in human reliability analysis using evidence theory and AHP. Risk Analysis, 35(7), 1296–1316 [Google Scholar] [PubMed]
24. Swain, A. D. (1983). Handbook of human reliability analysis with emphasis on nuclear power plant applications. NUREG/CR-1278, SAND 80-0200. Washington DC, USA: US Nuclear Regulatory Commission. [Google Scholar]
25. Williams, J. C. (1988). A data-based method for assessing and reducing human error to improve operational performance. Conference Record for 1988 IEEE Fourth Conference on Human Factors and Power Plants, pp. 436–450. Monterey, CA, USA, IEEE. [Google Scholar]
26. Hollnagel, E. (1998). Cognitive reliability and error analysis method (CREAM). New York, USA: Elsevier Science Inc. [Google Scholar]
27. Gertman, D., Blackman, H., Marble, J., Byers, J., Smith, C. et al. (2005). The SPAR-H human reliability analysis method, NUREG/CR-6883. US Nuclear Regulatory Commission, 230(4), 35. [Google Scholar]
28. Whaley, A. M., Kelly, D. L., Boring, R. L., Galyean, W. J. (2012). SPAR-H step-by-step guidance. Idaho Falls, ID (United StatesTechnical Report, Idaho National Lab. (INL). [Google Scholar]
29. Claire, T., Sondre, Ø., Kristian, G. (2020). Lessons learned from applying a new HRA method for the petroleum industry. Reliability Engineering & System Safety, 194, 106276. [Google Scholar]
30. Laumann, K., Rasmussen, M. (2016). Experience and training as performance-shaping factors in human reliability analysis. In: Risk, reliability and safety: Innovating theory and practice. Proceedings of the 26th European safety and reliability conference, Glasgow, Scotland. [Google Scholar]
31. Zhao, X., Zhang, R., Zhao, S., Wu, Y., He, Z. (2018). Incorporation TACOM and SPAR-H into the operating procedure of nuclear power plants. Annals of Nuclear Energy, 114, 451–457. [Google Scholar]
32. Liu, J., Zou, Y., Wang, W., Zhang, L., Qing, T. et al. (2021). A study on assigning performance shaping factors of the SPAR-H method for adequacy human reliability analysis of nuclear power plants. International Journal of Industrial Ergonomics, 81, 103051. [Google Scholar]
33. Ramezani, A., Nazari, T., Noori-Kalkhoran, O. (2021). A proposed improvement for the design of safety injection system in VVER-1000/V446 reactor. Progress in Nuclear Energy, 137, 103767. [Google Scholar]
34. Jahangiri, M., Hoboubi, N., Rostamabadi, A., Keshavarzi, S., Hosseini, A. A. (2016). Human error analysis in a permit to work system: A case study in a chemical plant. Safety and Health at Work, 7(1), 6–11 [Google Scholar] [PubMed]
35. La Fata, C. M., Giallanza, A., Micale, R., La Scalia, G. (2021). Ranking of occupational health and safety risks by a multi-criteria perspective: Inclusion of human factors and application of VIKOR. Safety Science, 138(2), 105234. [Google Scholar]
36. Ahn, S. I., Kurt, R. E., Akyuz, E. (2022). Application of a SPAR-H based framework to assess human reliability during emergency response drill for man overboard on ships. Ocean Engineering, 251, 111089. [Google Scholar]
37. Zhang, W., Meng, X., Yang, X., Lyu, H., Zhou, X. Y. et al. (2022). A practical risk-based model for early warning of seafarer errors using integrated bayesian network and SPAR-H. International Journal of Environmental Research and Public Health, 19(16), 10271 [Google Scholar] [PubMed]
38. de Ambroggi, M., Trucco, P. (2011). Modelling and assessment of dependent performance shaping factors through analytic network process. Reliability Engineering & System Safety, 96(7), 849–860. [Google Scholar]
39. Wang, W., Liu, X., Qin, Y. (2018). A modified HEART method with FANP for human error assessment in high-speed railway dispatching tasks. International Journal of Industrial Ergonomics, 67, 242–258. [Google Scholar]
40. Wang, L., Wang, Y., Chen, Y., Pan, X., Zhang, W. (2020). Performance shaping factors dependence assessment through moderating and mediating effect analysis. Reliability Engineering & System Safety, 202, 107034. [Google Scholar]
41. Park, J., Jung, W., Kim, J. (2020). Inter-relationships between performance shaping factors for human reliability analysis of nuclear power plants. Nuclear Engineering and Technology, 52(1), 87–100. [Google Scholar]
42. Laumann, K., Rasmussen, M. (2016). Suggested improvements to the definitions of standardized plant analysis of risk-human reliability analysis (SPAR-H) performance shaping factors, their levels and multipliers and the nominal tasks. Reliability Engineering & System Safety, 145, 287–300. [Google Scholar]
43. Liu, P., Qiu, Y., Hu, J., Tong, J., Zhao, J. et al. (2020). Expert judgments for performance shaping factors’ multiplier design in human reliability analysis. Reliability Engineering & System Safety, 194, 106343. [Google Scholar]
44. Liu, J., Zou, Y., Wang, W., Zhang, L., Liu, X. et al. (2021). Analysis of dependencies among performance shaping factors in human reliability analysis based on a system dynamics approach. Reliability Engineering & System Safety, 215, 107890. https://doi.org/10.1016/j.ress.2021.107890 [Google Scholar] [CrossRef]
45. Xu, Z., Shang, S., Su, X., Qian, H., Pan, X. (2023). Handling dependencies among performance shaping factors in SPAR-H through DEMATEL method. Nuclear Engineering and Technology, 55(8), 2897–2904. [Google Scholar]
46. Liu, J., Zhang, L., Zou, Y., Sun, Q., Liu, X. et al. (2021). Identification of correlation among performance shaping factors of SPAR-H method. Nuclear Power Engineering, 42(4), 144–150. [Google Scholar]
47. Boring, R. L., Blackman, H. S. (2007). The origins of the SPAR-H method’s performance shaping factor multipliers. 2007 IEEE 8th Human Factors and Power Plants and HPRCT 13th Annual Meeting, pp. 177–184. Monterey, CA, USA, IEEE. [Google Scholar]
48. Bishara, A. J., Anthony, J. B. (2012). Testing the significance of a correlation with nonnormal data: Comparison of Pearson, Spearman, transformation, and resampling approaches. Psychological Methods, 17(3), 399–417 [Google Scholar] [PubMed]
Cite This Article
 Copyright © 2024 The Author(s). Published by Tech Science Press.
This work is licensed under a Creative Commons Attribution 4.0 International License , which permits unrestricted use, distribution, and reproduction in any medium, provided the original work is properly cited.
 Downloads
 Citation Tools